
A pilot test a methodology for rapidly assessment of mosquito net use in the Kassena Nankana District, Northern Ghana.
A pilot test a methodology for rapidly assessment of mosquito net use in the Kassena Nankana District, Northern Ghana. Philip Adongo 1 Catherine Reed 2 Fred N. Binka 3 Joseph Amankwah 4 Martin Adjuik 1 1 Navrongo Health Research Centre, 2 PATH Canada, 3 World health Organization (WHO), 4 Ministry of Health. Ghana. 1 Executive Summary .......................................................................................... 3 2 INTRODUCTION............................................................................................. 5 3 DESIGN AND METHODS .............................................................................. 6 3.1 Study Site:............................................................................................................... 6 3.2 METHODS ............................................................................................................. 7 3.2.1 3.2.2 Cluster survey:............................................................................................................. 7 Random sample survey: ............................................................................................... 7 3.3 Night observational survey:.................................................................................... 8 3.4 Focus group discussions: ........................................................................................ 8 4 RESULTS ......................................................................................................... 8 4.1 Monitoring of the Implementation process ............................................................ 8 4.1.1 4.1.2 4.1.3 4.1.4 4.1.5 4.1.6 Health Centres ............................................................................................................. 9 Shops .......................................................................................................................... 9 Itinerant Workers. ...................................................................................................... 10 NHRC Premises......................................................................................................... 10 Seasonal variation in net sales and treatment .............................................................. 11 Problems ................................................................................................................... 11 4.2 Promotion ............................................................................................................. 11 4.2.1 4.2.2 Meeting ..................................................................................................................... 11 Radio announcement.................................................................................................. 12 4.3 Impact assessment ................................................................................................ 12 4.3.1 4.3.2 5 Process monitoring .................................................................................................... 12 Survey ....................................................................................................................... 12 Net use and Coverage Assessment .................................................................. 13 5.1 Results of the random sample survey versus the cluster survey.......................... 16 5.2 Net use and factors that affect net use.................................................................. 16 5.3 Malaria education:................................................................................................ 17 5.4 Net treatment:....................................................................................................... 18 5.5 Community perception about net treatment, sale and promotional activities.... 18 5.6 Benefits and side effects of net treatment............................................................. 19 6 DISCUSSION ................................................................................................. 19 7 References ...................................................................................................... 22 8 Appendix A SURVEY INDIVIDUAL QUESTIONNAIRE.......................... 23 9 Appendix B – Focus Group Discussion Guidelines ........................................ 25 10 Appendix C FGD Questions for nonnet owners.......................................... 27 11 Appendix D Draft paper for publication in peer review journal................... 28 12 Appendix E Cluster sampling population data ............................................. 38 1 Acknowledgements This research was funded by Programme for Appropriate Technology in Health (PATH) Canada. We wish to acknowledge the technical assistance provided by the staff of PATH Canada. We also wish to acknowledge the valuable contribution of the following; Alex Nazzar, James F. Phillips, Cornelius Debpuur, Patricia Akweongo, Livesy Abokyi and Abraham Hudgson. 2 1 Executive Summary Malaria is a serious barrier to health and development in Ghana and is the main cause of mortality in young children. Interest in treated nets continues to grow as treated nets have been associated with a 17% reduction in all cause mortality in young children in Ghana. Recent studies in Ghana suggest that household ownership of nets is between 9 20%, however, the number of children within these samples that were actually sleeping under nets was approximately 20%. The purpose of this study was to pilot test a cluster sampling (CS) methodology for rapidly assessing the coverage of mosquito nets for children under 2 years in particular, and the general population in an ongoing program area. As part of the monitoring process, other methods such as Focus Group Discussion (FGDs), promotional campaigns and good record keeping system were also used to shape program activities. Most community members had knowledge about the net and net treatment service but a few people utilize these services as clearly shown by the focus group discussion and the survey. Community members were expecting free nets and treatment services as it happened during the efficacy trial. Another reason advanced for nonpurchase of nets is lack of money. It was noted that income status of women is low and that men control most of the income in the household and would have to take decisions on how to use scarce resources. Women are therefore constrained by their inability to acquire nets or re treat services without depending on their husbands. Personal contact was seen as the best mode of communicating messages about nets and net retreatment services to the community. Itinerant workers were found to be the most effective way to deliver ITN services to the community. In the CS (cluster sampling), 71% of households owned one or more nets compared to 68.4% in the Simple Random Survey (SRS). In the SRS, the total number of children living in a net owning household was 63.2%. From the SRS male children of this age group were reported to sleep under nets 98.0% of the time compared to 89.6% female children. In the CS, approximately 62.1% of children living in net owning households were reported to be sleeping under nets. Similar to the SRS, there were more males aged children 04 sleeping under nets (97%) than females of the same age category (87.6). With respect to the number of people in the household who were sleeping under a net, the difference in proportions between the two surveys was 2.4%, 95% CI = (9.8% 5.0%). The sample was subdivided into groups by age and sex; no significant difference was found between the two surveys in terms of net usage except for the age group of 40+ males. The results from this study suggest that either of the two methods could be used to assess net coverage since there is no difference between the two samples. CS does not 3 require a rigorous sampling framework and is easier to adopt by district health managers. The CS provides an additional advantage of offering the opportunity to collect information on Expanded Programme on Immunization such as infant immunization coverage and tetanus toxoid immunization of women at little extra time and effort. However, care should be taken when combining surveys for malaria control and EPI, to ensure that equal attention is paid to both areas when training and during data collection. Subsequent studies should further subdivide the under 5 years old into under 24 months to provide detailed information on coverage of this risk group. 4 2 INTRODUCTION Malaria is a serious barrier to health and development in Ghana. It is the main cause of mortality among young children. The increasing resistance of plasmodium falciparum to choroquine (Afari et. al., 1992) has prompted interest in treated nets as a part of integrated malaria control activities. Treated nets have been associated with a 17% reduction in all cause mortality in young children (6 months 4 year old) in Northern Ghana (Binka et al., 1996). Ghana has little recent tradition of mosquito net use. When nets were introduced into the KassenaNankana District in 1992, only 4% of the households owned one or more nets. More recent studies in other areas of Ghana show ownership of between 9 20%, but only 20% of children in these households actually slept underneath a net (Adongo 1996). However nets and treated nets have been well accepted when they were introduced during the trial (Binka and Adongo, 1997). When considering promoting the widespread use of ITNs, cost is a primary concern. In Ghana, the lack of a tradition of net use and the poor availability of nets in shops around the country are also important factors. A recent survey (June 1998) has estimated that 68% of the households in the KassenaNankana district own one or more mosquito nets, most of them donated during the bednet trial in 1992. The percentage of children sleeping under a net in net owning households is approximated to be less than 30%. A similar study from 1996 showed that 93% of households had one or more nets and approximately 50% of children in net owning households slept under them. The Navrongo Health Research Centre (NHRC) has experience with ITNs from the efficacy trial of 1992 1994 as well as community assessment from the work performed on Vitamin A supplementation trial and other interventions. With this experience, the NHRC collaborated with PATH Canada to develop and test a collection of tools that can be used in the KassenaNankana district and other districts of Ghana to monitor ITN interventions. Particular emphasis was placed on assessing the number of children under five years old that are sleeping under a mosquito net. This target group is the most vulnerable to mortality and morbidity from malaria and has been chosen by the MOH in Ghana (and other interested organizations) as a key indicator for ITN interventions. As ITN interventions move from the research world into the sphere of child health it is fitting that ITN implementers benefit from the lessons learned from other interventions which have also targeted children under five and developed monitoring tools to assess their interventions. In this study, a cluster sampling technique was piloted and evaluated against a standard simple random sampling method. Also, Focus Group Discussions (FGD), a survey and careful recording system were used to monitor three distinct activities that have been implemented in the KassenaNankana district: These included; 1. 2. Selling of mosquito nets Provision of a net treatment service 5 3. Promotion of the above activities as well as raising awareness of the benefits of treated nets for health and malaria prevention. These activities are being supported by WHO/TDR through a project evaluating community’s willingness to replace and retreat nets. Nets and insecticides are being actively marketed through three different channels: itinerant vendors, health centres and shops. The survey methodology discussed in this paper is only one of a complimentary set of tools that has been developed to assess these different activities. There is a growing commitment by the Ghana Ministry of Health (MOH) to actively promote malaria control. The promotion of insecticide treated mosquito nets (ITNs) are an integral part of this strategy. With the collaboration of the MOH, NGOs and donors, ITN interventions are being planned in Ghana. Since most districts will be implementing ITN programs in the near future, knowledge of coverage will help managers to assess performance and develop strategies to increase coverage. The need for rapid, pragmatic and accurate monitoring and evaluation tools that will assist programme managers to assess baseline coverage, plan their activities, monitor progress towards setting goals and providing information to assist in refining activities during the life of the project cannot be overemphasized. The optimal research tool will be able to assess reported coverage (children sleeping under a net) of children under five years of age in a given population and monitor change in that population. Other methods will then provide information on the factors that influence this coverage rate. 3 DESIGN AND METHODS 3.1 Study Site: This study was carried out in the KassenaNankana district of northern Ghana where a largescale trial of permethrin impregnated bednet study was conducted (Binka et al. 1996). In addition, ongoing activities are being implemented at the Navrongo Health Research Centre (NHRC) to evaluate the community's willingness to replace and retreat nets in the district which will include the sale of nets and insecticide. The district lies within the Guinea Savannah of northern Ghana and covers an area of about 1675km 2 with population approximately 140,000 (NDSS, 1993). There are two main seasons, a short wet season with an average annual rainfall of 8501000mm and a dry season from September to May when little or no rainfall occurs. The people in this area comprise mainly of the Kassena and Nankana peoples and a minority of Buli speaking people. The population is primarily rural, agrarian and live in dispersed settlements. There are no distinct villages as such because village boundaries overlap. Settlement pattern is characterized by extended family living in dispersed compounds surrounded by farmlands. The district is divided into ten chiefdoms and each chiefdom is headed by a paramount chief. The chiefdoms are also subdivided into divisional and sub 6 divisional areas, each headed by divisional and subdivisional chiefs. At the sub divisional level, there is further division into lineage groups. The lineage is the smallest corporate group and is usually headed by the oldest male member. Most social and political activities take place at the lineage level. Net usage was about 4% in the community before the start of the impregnated bednet (Gyapong et al.1996). Usage increased to over 90% during the trial (Binka and Adongo 1997). 3.2 METHODS Two methodological approaches were used to pilot test and validate the cluster sampling methodology: a cluster survey and a simple random sample survey. 3.2.1 Cluster survey: The study adopted the WHO EPI cluster survey method because of its usefulness in measuring other health indicators collected at the district level (WHO 1991). The NHRC runs a Demographic Surveillance System (NDSS) which reports the dynamics of the population every quarter to update demographic events. The district has been divided into 244 clusters, with a cluster containing an average of 65 compounds. An average of 570 people live in a cluster. Using the EPI clustering system, the 244 clusters were regrouped into 30 new clusters. Seven mothers with children who were aged between 1224 months at the date of visit were interviewed in each cluster. One advantage of selecting this age category is to make it possible for District Health Management Teams to also assess EPI coverage during net coverage. Two field workers working together were expected to conduct 7 interviews in a cluster per day. This was judged to be realistic but not punitive allowing for the distances between compounds. There was supervision by a senior researcher from NHRC and a counterpart from the MOH, experienced in EPI survey methods. The most critical issue for the cluster survey is how to select the first compound (or household) where interviewing will commence. With the assistance of geographic maps, schematic maps and people who are knowledgeable about the locality, the field workers identified a central location within the cluster from which to start. They randomly selected a direction by spinning a pencil from the centre of the cluster. After spinning the pencil, all compounds in the direction of the pencil were walked through and marked with chalk until the edge of the cluster was reached. A random number between 1 and the total of compounds was selected to represent the first compound/household. The interviewers then visited every compound from the starting point until they had found 7 children meeting the criteria for the study. For the purpose of collecting household information on ITN use, each mother or guardian of index child (age 1223 months) was interviewed. No interviews were conducted in compounds where there were no children aged between 1224 months. Immunization cards and NDSS ID cards were used to ascertain correct ages and children qualified to be interviewed. 3.2.2 Random sample survey: The Navrongo Demographic Surveillance System covers about 13,000 compounds. From the compound data, a random sample of 400 compounds was selected and all households in these compounds were interviewed. Based on 68% (Adongo 1996) 7 prevalence of net use in the district, 400 compounds were selected. The software program Stata 4.0 was used for all random calculations for the survey. 3.3 Night observational survey: In order to validate reported usage with actual usage, a night observational survey was carried out. A random sample of 200 compounds (50%) was selected from the random survey sample for this survey. These compounds were visited by senior field supervisors between 03 30 hours to 06 30 hours to observe actual net usage. 3.4 Focus group discussions: Focus Group Discussions (FGD) were held with a cross section of the community; men and women who are net owners and nonowners. In all, eight FGDs were held with four net owning groups and four nonnet owning groups. Discussions centered on knowledge about net promotional activities and malaria education. 4 RESULTS 4.1 Monitoring of the Implementation process The retreatment and sale of nets started in the first week of July. Thirty Itinerants Workers (IWs), ten shop keepers and three representatives of the health centres have been recruited and trained on how to treat nets and keep good record of nets sold or retreated. Each person is given 10 nets and 240mls of insecticide to sell at a time (The insecticide is put in smalldecanted bottles of 240 mils.) The volunteers are re supplied after the proceeds from earlier supplies have been paid. Meetings are held with IWs the last Friday of every month to discuss issues arising from the field and the to know the problem they are facing in the field. There has been a change from permethrin to deltamethrin as the insecticide for net treatment. This change was made for the reason that deltamethrin cuts down the number of treatment in a year from two (with permethrin) to one and also helps solve low retreatment rate in the dry season when mosquito density is low. Unfortunately, we were unable to buy individual packed insecticide because of availability and cost. The only available individual packed deltamethrin is the tablet and it is sold at 5,000 cedis ($2.20) which is well beyond the means of most people. We therefore had to buy one litre deltamethrin bottles for the mean time. It is hoped that in the second year of the project, individual doses of insecticide either tablet, sachet or bottle will be used. 8 For the period under review, a total of 4131 bednets have been sold while 4753 nets have also been treated through the various channels as shown in figure 1 below. Figure 1: No. of nets sold/treated by agent 8000 7000 Nunmber 6000 5000 No. of nets treated No.of nets sold 4000 3000 2000 1000 0 Health centre Shops NHRC Itinerants workers Agent 4.1.1 Health Centres The three health centres recorded the least sales and treatment of nets. For the entire period under review, about 27 nets were sold and another 41 nets treated as shown in figure 1. Although nets are displayed at the health centres for patients and mothers who are attending antenatal clinic, few nets are sold or treated. The main reason given by the medical assistants for the low patronage of nets at the health centres was that people who come to the health centre for either health care or antenatal reasons usually carry money enough to pay for their medical expenses. They also do not remember to carry old nets for retreatment. Despite the recorded low sales and treatment by this outlet, the health centres have been very useful for educating the visiting patients and mothers about net impregnation and net use. 4.1.2 Shops Compared to the health centres, the ten shops seem to be doing better. The ten shops sold 569 nets and treated 642 (see fig 1). The shops are good channels to get nets to the community since it is easier for them to sell the nets. Discussions with shop owners revealed that it is more profitable selling nets than providing retreatment services. It was observed that shop owners find selling and treating a net time consuming and the reward from the treatment is so little. The shops are completely not suitable as channels for retreatment. Just as the health centres, people going to the market are less likely to carry nets for retreatment. However, the tendency to buy new nets is high because they have enough money to buy nets after the sale of their 9 products. The shop may be a good avenue to sell individual prepacked treatment dosage. 4.1.3 Itinerant Workers. The Itinerant workers so far have proven to be the best mechanism for delivering nets and providing net treatment services to the community. Figure 1 above, clearly demonstrates this as the combined team of 30 volunteers sold 2808 nets and retreated 3329 nets for the period. Their modus operandi is welled suited to what was adopted during the bednet trial that took place in the district five years ago. They move either on foot or on bicycle around the compounds in the localities selling and retreating nets. In addition to moving around compounds, they also visit local markets and sell nets. This system of operation, especially the former, is more suitable to most community members as they are able to retreat their weak or worn out nets at their home without showing them to the public. This affords them the opportunity to avoid the embarrassment that would arise if they treat them at the health centre or in the shop. One major problem we face in dealing with Itinerant workers is the tendency for some to move outside the district to sell nets. A rigorous monitoring system was put in place to check this and four people who were found to be involved in this kind of activity were withdrawn from the study and replaced. 4.1.4 NHRC Premises Both sale and retreatment services were also provided at the premises of the Centre. As shown in the figure above, about 437 nets were sold and about 498 nets were treated. The centre’s premise is mostly patronized by the staff of the centre, staff of the district hospital and people who come from adjacent districts to buy nets. Figure 2 Bednet sale/treatmet by Month 1200 No. sold/treated 1000 800 No. of nets sold No. of nets treated 600 400 200 0 Jul Aug Sep Oct Nov Dec Jan Feb Mar Apr May Jun Jul Month 10 4.1.5 Seasonal variation in net sales and treatment The sale and treatment of nets follow a seasonal pattern. More nets are sold in the rainy season when there is high mosquito nuisance compared to the dry season when mosquito nuisance is low. The rainy season begins in May but nuisance is minimal until from June to September when there are heavy torrential falls and water collects in several bodies ideal for breeding all kinds of mosquitoes. As shown in figure 2 above, sale and treatment picked up in July 1998 when the study was launched to September 1998 where an average of 500 and 700 nets were sold and treated respectively. A similar situation can be observed for June to July 1999. The figure also shows clearly that acquisition and treatment of nets is lowest in the dry season which is from November to April. April seems to be an exceptional month in the dry season. It coincides with the tomato harvest period and at the same time, it is the period when most rice fields are pounded. People who live around the irrigated areas would therefore buy nets because they have more money. 4.1.6 Problems 1. The main complaint noted is the change from permethrin to deltamethrin. The community has observed that the deltamethrin does not have a strong smell as permethrin. For the community, the smell of the insecticide is associated with its potency and because deltamethrin is odorless, they think it cannot kill the mosquitoes. 2. The volunteers have also complained that work involves moving around compounds and they will need bicycles to do their work effectively. Shortly after sending them to the field, three IWs returned their nets and insecticide because they had no means of transport. The IWs said their work performance will be greatly enhanced if they were mobile. 3. The use of the local FM radio station to create awareness has generated demand across the entire region and people from other districts in the region flock to the KassenaNankana district to seek ITNs. 4. Some community members have complained that this is the lean season and they have no money to retreat or buy nets. 4.2 Promotion 4.2.1 Meeting Various activities to create awareness about the study started as early as March. First and foremost, six community meetings were held with the chiefs, elders and people of the main study area. During these meetings, the purpose, design and importance of the study were explained to the community leaders. These meetings also gave community members the opportunity to ask questions and seek clarification about the study. Durbars The organisation of durbars in the various communities to increase awareness about nets and net retreatment is ongoing. Four durbars are organized each month in different communities. These durbars are organized with drumming and dancing and 11 this pulls a large crowd and make them excellent grounds for communicating to the people messages about malaria and net use. During the dubars, a drama on ITNs is enacted and talks on treated nets are given and the community members react to these messages. 4.2.2 Radio announcement Radio announcements are made three times weekly in two local languages and in English to remind the community of the net sale and treatment services. The announcements also inform community members where they can retreat their bednets and buy new ones and at what prices the nets are sold and retreated. 4.3 Impact assessment 4.3.1 Process monitoring A continuous recording system has been developed at the retailer/outlet level (i.e. with IWs, general shop keepers and health centres) to keep track of nets sold or re treated and the amount received from the sales. A system has been developed with the accounting office to keep track of all payments and expenses made. Daily log of all sales and any anecdotal evidence regarding the project are also being kept. 4.3.2 Survey The main study area (for the first year of the study) which forms about a quarter of the KassenaNankana district has population of 49,576 with approximately 7,249 households who live in 3,639 compounds. At the beginning of June, preparations were made for the collection of baseline data for the study and this took a period of four weeks. A total of 300 compounds was randomly selected for the baseline survey and in each compound two households were selected for interviewing. A target of 600 interviews was planned for this survey. Out of this figure, 437 interviews were completed in the 300 compounds. About 27% of the compounds were made up of single households. Of the 437 households interviewed, 65% (283) had at least one or more nets and the remaining 35% (153) of the households had no nets at all. These two groups are likely to have had nets from the Navrongo Health Research Centre (NHRC) and might not differ from one another in terms of net use. It is also possible that those who do not have nets now were in the treated clusters of the trial and theirs are worn out. This deduction is based on the fact that over 96% (273) of households with nets reported that they got their nets from the bednet trial carried out by the NHRC, with only 4% buying their nets from other sources. Since these nets have been in existence for the past four years, most of them may either be weak or torn with holes in them due to extensive use over the years and would need to be replaced. About 12% (33) of households that reported having a net, had purchased at least one net to increase or replace existing nets. For those who did not buy an additional net, 52% said there was no need to buy a net because the net they got from NHRC was still in good condition while 48% mentioned that the price of a net is either too high or they had no money to buy. However, over 92% (255) of respondents who owned a net were willing to replace their nets if it became completely worn out. The main reason given for net ownership was to prevent mosquito bites (94%). 12 Out of the 283 households that had nets, 32% (95) reported retreating their nets in the last year and have paid between 600 and 800 cedis (3540 US cents) for treating a net. Most of these nets were retreated by Itinerants workers (80%) and the remaining 20% were also treated at the health centre, NHRC and markets within the district. The high retreatment rate by the itinerant workers may be attributed to the study design of the efficacy trial where a team of workers moved around compounds every six months to retreat nets. The community is accustomed to this system because they think it saves time. A total of 181 (66%) did not retreat their nets during the past year. Of this group of respondents, 118 (64%) reported the insecticide was not available and the remaining 65 (36%) mentioned that they could not afford the cost of retreatment. Although 98% of this group would like to treat their nets, the amount they offered for one dose of treatment ranged between 200500 cedis (1030 US cents) as compared to 1,200 cedis (50 US cents) which is the cost of treating one net currently. This suggests that, although this category of people are willing to retreat their nets, they are severely constrained by very low income levels. The question that arises from this then is that if they cannot afford the cost of retreatment, how can they afford the cost of replacing a net? Almost all of these respondents mentioned earlier that they would replace their nets if they became completely worn out. Of the 153 households that reported that they do not own a net, over 80% reported that they would like to buy a net to prevent mosquito bites (90%). However, about 41% reported that nets were not available and 59% could not afford to buy the nets. Although 80 % of the households said they were willing to buy a net, they were prepared to pay an average of 2, 000 cedis (under $1.00) for a net which is far below the current market price of a net which is 12,000 cedis ($5.00). Again, this shows that nets are desirable in the community but the key issue is the ability to pay for them. People want to use nets but the cost is well beyond their means. A total of 20% of respondents said they would not like to buy a net because the cost of a net was beyond their means. A total of 28% (123) reported having heard a message about nets and treated nets in the last 6 months. Of this, 37% heard a message from IWs, 21% from health, 12% from friends and 9% from the radio. Another 17% heard a message from other sources. 5 Net use and Coverage Assessment The surveys all took place during the 1998 rainy season. The Cluster Survey (CS) was conducted between the 4 th – 11 th of September and the simple random survey (SRS) between the 19 th 30 th of September. The SRS questionnaire was longer than the Cluster Survey, however the details of net ownership and net coverage were collected and recorded in the same manner. 13 In the CS, all 200 interviews were completed out of the expected 210. On some occasions single respondents had to be interviewed for two children either because the children are twins or their mothers were not present at the time of visit. The information was collected and analyzed by the staff of NHRC and PATH Canada. The data was entered using FOXPRO 2.6 for DOS and analyzed using EPI INFO version 6.0. The SRS team visited 566 households, in which 35% of the respondents were the head of the household (men) and 46% were women, the remainder were sons, daughters or other family members. In the CS, the 200 interviews were carried out with the child’s mother. In the SRS, 68.4% of the households owned one or more mosquito nets. In the CS 71% of households owned one or more nets. The total number of households visited was 566. From this total, there were 462 children aged 04. The percentage of children living in a household with a net was 63.2%. Male children of this age group in net owning households were reported to sleep under nets 98.0% of the time, compared to 89.6% female children from the SRS. In general, with increasing age group, there were fewer people sleeping under nets. For all age groups, 78.1% of females in net owning households slept under nets, compared to 67.5% males. Out of the 200 households interviewed in the cluster survey, the total number of children aged 04 was 248 and 62.1% of the children in all households were reported to be sleeping under nets (Table 2). Similar to the SRS, more males aged 04 in net owning households were sleeping under nets (97%) compared to females (87.6). The total percentage of people sleeping under nets in net owning households was 53.9%. Again more females than males were reported to be sleeping under nets (77.4%, 68.4%, respectively). Table 1. Cluster Survey (CS) Agegp Total pop N(%) Female Net owning pop Net N(%) Users N Total pop N(%) Male Net Owning Pop N(%) Net Users N Total N(%) 0 – 4 128 (60.9) 89 (87.6) 78 120(63.3) 78 (97.0) 76 248 (62.1) 5 – 15 143 (58.0) 111 (74.7) 83 133 (57.8) 107 (71.9) 77 276 (58.0) 16 – 39 203 (54.6) 145 (76.0) 110 122(28.6) 82 (42.6) 35 325 (44.6) 40+ 58 (53.4) 46 (67.3) 31 74 (51.3) 63 (60.3) 38 132 (52.3) Sub total 532 (56.9) 391(77.4) 303 449(50.3) 330 (68.4) 226 981 (53.9) Table.2 Simple random survey (SRS) Female Male 14 Agegp Total pop N(%) Net owning pop Net N(%) Users N Total pop N(%) Net Owning Pop N(%) Net Users N Total N(%) 0 – 4 227 (60.8) 154 (89.6%) 138 235 (65.9) 158 (98) 155 462 (63.2) 5 – 15 369 (50.4) 247 (75.3%) 186 362 (51.3) 244 (76) 186 731 (50.8) 16 – 39 520 (54.0) 350 (80.3%) 281 317 (34.3) 213 (51) 109 837 (46.5) 40+ 230 (49.6) 170 (67.1%) 114 260 (33.8) 182 (48) 88 490 (41.2) Sub total 1346 (53.4) 921 (78.1%) 719 1174(67.8) 797(67.5) 538 2520 (60.6) The NS visited 192 households all known from the SRS. These compounds were visited between 3.45 am and 6.30 am and the mean time of visits was 5. 00 am. During the visits, 72% of households were seen to have used their nets. The SRS in particular collected other data which are very relevant to the interpretation of the ownership and usage of treated nets as shown in table 3.1 below. Table 3.1 Occupation of respondents Occupation Farmers only Trader artisan supplementing arming) General population n = 566 68% (usually 23% Table 3.2 Wealth indicators Ownership within the household Bicycle Radio Coal pot General population n = 566 59% 43% 40% ‘New net purchasers’ n = 16 25% 63% ‘New net purchasers’ n= 16 100% 93% 81% The SRS also asked two questions to assess the coverage of the promotional activities. When asked if the respondent had heard or seen any message about nets or net treatment in the past 6 months, 51.4% (n = 291) they stated their sources as being a shown in the table; Table 4: Sources of information about treated nets Source Health Center Frequency 138 Percentage 48% Radio Friend Health worker Visiting NHRC 64 38 23 15 22% 13% 8% 5% 15 Durbars / Dramas 12 4% 5.1 Results of the random sample survey versus the cluster survey From table 1 and table 2, net usage is given as a proportion of netowning population. To assess whether the two surveys give different results, we calculated the differences in proportion by survey and included the confidence intervals of these differences for the stratified and overall results (Kirkwood, 1990). The results from the surveys will be different if the 95% confidence interval do not include zero. If 95% interval includes zero, then it implies that the results of the two surveys are comparable at the 95% confidence level. Table 5. Comparison between the results of the simple random survey and the cluster survey on usage Agegrp 0 4 5 15 16 39 40+ Overall Female Diff (%) (p_SSp_CS) 2.0 0.6 4.2 0.3 0.7 C. I. (4.8, 8.8) (7.0, 8.2) (1.7,10.1) (10.3,9.7) (3.1,4.5) Male Diff (%) (p_SSp_CS) 1.0 4.1 8.4 12.3 0.9 C.I. (2.1,4.1) (3.5,11.7) (1.1,17.9) (22.6,2.0) (5.5,3.7) 5.2 Net use and factors that affect net use Users of insecticide treated nets said they are desirable to use both in the dry and rainy seasons. The use of nets was associated with a reduction of mosquito nuisance and provision of good night sleep. The most important issue is that ITNs are seen as a means to good health as frequent use leads to less or no malaria attacks. Although users of the nets recommended the repelling power of insecticide, they complained about its smell and the irritation that it causes. As one discussant claimed, nets can cause catarrh: “I have realized that those who are sleeping under treated nets have not had malaria attack this year, meanwhile, I had three attacks because I am not sleeping under a net.” “Treated nets are more effective in malaria prevention. The insecticide repels the mosquitoes and also stays longer in the net. The scent of the insecticide is not good, it can even give you catarrh. Those who have sense of smell can not sleep under the net for the very first few days after treatment.” On the other hand, nonusers had little to say because of their limited experience with nets during the efficacy trial. The nonusers have not bought new nets since the nets they received during the trial. Although these people are not using nets, they are aware of the protective nature of ITNs against mosquito nuisance and prevention of illness and malaria in particular. Most nonusers would have wished to own a treated but the main reason given for the nonuse in the community is lack of resources to buy a net. 16 In rural communities where income levels are very low, people prefer to spend their little income on food. People complain that the cost of the net is high and even second hand nets are far cheaper than the nets NHRC sells. The lack of income to purchase a net is not limited to only nonusers but extends to even users. Some users have fewer nets than their family size require but they are unable to acquire more nets because of low levels of income. For this reason, people resort to other alternatives such as mosquito coil and aerosols. A discussant captures this vividly: “Others prefer the insecticide (aerosol) to the net because they cannot buy nets for the whole family. But when you spray a room many people can sleep in it but a net only one or two people. Besides that, the insecticide spray is cheaper.” Discussants acknowledged the importance of providing nets for all children to sleep under but also remarked that it is necessary for everybody to sleep under a net because of its protective ability. However, low income and poverty do not allow everyone to be covered. 5.3 Malaria education: As part of the ongoing evaluation of community willingness to replace and retreat ITNs, various IE&C activities have been put in place to educate and increase community awareness about malaria and 'where and when' to obtain net retreatment and new nets. These activities include the use of local FM radio station to make spot announcements, drama performances during durbars in the community and doorto door canvassing by itinerant workers in the communities. One of the most popular means of passing information to the community about ITNs was by personal contact through the itinerant worker. Communities are generally pleased with the work of the volunteers and their frequent visits prompt the re treatment of their nets. However, their visits were not always recalled as occasions were information on malaria prevention was passed on. Dramas performed locally were also rated very high though only two out of the eight focus groups sessions were in an area where a drama had taken place. There was considerable recall of the messages given during the performances and even the name of one of the main characters. A number of respondents talked about 'seeing' evidence of the use of ITNs and expressed that they considered live drama better than radio drama that lacks visual images. However, one respondent mentioned that the time of the year would determine whether a community was free to spend time watching dramas as pointed out below; “We all saw how Abachegetam (character in drama) used his money on drink and the whole of his family was sick with malaria. The lesson is simply prevention is better than cure. Protecting yourself against malaria is better than going to hospital and paying heavily for drugs.” “The play is more effective. In the radio programs you don't see how people behave, but in the play you can relate it to real life, especially the fun that accompanies the irresponsible behaviour of characters like Abachegatam, who refused to buy nets. What we saw in the play is better than the radio.” 17 A few people had also heard something on the radio and could recall with some detail information given; for example that NHRC would no longer be giving away nets. Many people heard that there was something on the radio but that either they did not own a radio (a common response) or that they did not hear everything that was broadcast. Only one respondent mentioned hearing 'messages concerning malaria from a health centre’. A number of respondents acknowledged that they had learned new things but... “The play has opened our eyes. We have heard about this, but the poverty does not make us act as we have heard the message.” 5.4 Net treatment: Most net owners knew that they could have their nets treated by community sales agents. The male respondents demonstrated some knowledge about net treatment whereas the female respondents (even net owners) were far more vague. The female respondents did not seem to associate someone coming to their door to treat their net with a 'sales agent'. The men linked the sales agents with NHRC and stated that this gave them a degree of credibility. “Your workers came round here with the chemical and impregnated the nets for us. You gave us the nets and we impregnate them only with your workers. If a different person comes with his / her chemical we will not impregnate our nets from them, because we do not know the source of the chemical.” However many respondents stated that though sales agents came offering net treatment, often they left not having treated any nets. The cost of treatment was the most common reason given for failure to treat. No one mentioned the logistical difficulties of treating a net (i.e. getting it down, washing and drying it etc). “It is good that they used to come and treat our nets but because we don't have money, they don't come and treat for us again.” Non net owners frequently stated that as they had no net, 'why would they be interested in net treatment’. 5.5 Community perception about net treatment, sale and promotional activities Men appeared to be more aware of where nets are sold and at what price. Male net owners were more informed than nonnet owners. Those that knew where nets were on sale named sales agents, NHRC, the market and specific shops as places to purchase nets. Female respondents tended not to know details and appear to have very little interest, though this was stated as being because they could not afford to buy them as observed by one female respondent; “We don't know where they sell them. They say there are some in the market, but we don't have money so we don't go there.” 18 The prices given were largely correct, at 12,000 cedis (about $5), however it should be noted that in one community a number of respondents had some grievances against nets being sold in local shops. “It is because they have given nets to the shop owners to sell, that is why they shoot up the price... we appeal to them to limit the sales to only their community agents, and reduce the price so more people can buy.” “The Store inflates the price to 20,000 cedis. Today some nets in stores are selling for about 20,000 cedis. We don't know where they get the nets.” 5.6 Benefits and side effects of net treatment There were interesting results from questions asked to net owning groups about their perceptions of net treatment. The male groups more often mentioned that treated nets prevented 'malaria' than female groups. Only one female group mentioned net treatment prevented 'sickness' and improved health and that treated nets were especially beneficial to children. “When they soak the net it brings health. We ourselves don't get sick and the children too don't fall sick.” “We like it because we can cover the children with it, it prevents mosquitoes from biting so we will not get the sickness they call malaria.” A number of participants from three out of four groups mentioned that use of nets could be produce warmth however a number of respondents gave very rational explanations for their comments and few said that feeling warm in a would stop them from using nets. “When the weather is warm it is uncomfortable to be in it. But when the weather is cold you don't need a cloth any longer.” One respondent mentioned that the use of four Milo tins and sticks enabled him to easily move his net to sleep outside, or onto the roof. The small size of nets was mentioned a number of times as a factor contributing to the discomfort of sleeping under a treated net. This is said to lead to more wear and tear. One man also suggested that a net hindered other nocturnal pursuits. 6 DISCUSSION Coverage is seen as one of the most important means of monitoring net use. Whereas this is relatively easy to achieve in trial situations (NIBP 1993), it is sometimes difficult for program managers at the district level to monitor coverage. The issue of selecting accurate samples for conducting surveys has been a problem in most districts because of nonexisting good sampling frames. The NHRC provides an ideal situation where a simple random survey could be compared to a cluster survey because of NDSS data source. In addition to this, the cluster survey provides a rapid and accurate knowledge of net use and coverage by households and by age group 19 especially the 04 year group considered most vulnerable to malaria. It also helps program managers to set realistic target for sales and retreatment for subsequent years and estimating coverage of net use on the most vulnerable groups. The results from the surveys suggest that there was no difference between the proportion of households owning one or more nets as presented in the SRS and CS respectively. The difference between the two proportions is 2.4%, 95% CI = (9.8% to 5.0%). It will be noticed from table 4 that the stratified analysis of the difference between proportions of the two surveys, except for the age group 40+ for the males, show that there is no significant difference between the methods in terms of estimated prevalence of net usage. One method could be used instead of both. If logistically one survey is more superior, then there is good reason to carry out that type of survey rather than the other. Conducting a CS does not require a rigorous sampling framework and it is easier to be adopted and used by district health managers. The CS will provide district managers an added opportunity of collecting information on Expanded Programme on Immunization (EPI) such as infant immunization coverage and tetanus toxoid immunization of women. Although the CS data were processed and analysed by using computer packages (FOXPRO 2.6 for DOS and EPI INFO version 6.0.), this can be done manually. It is quite possible to tabulate the population and coverage figures by hand. It is anticipated that the CS can be used with a sample size of 210 for communities with a high or low net use. On the other hand, when conducting a SRS the sample drawn must be according to the approximate percentage of existing net use. However, care should be taken when combining surveys for malaria control and EPI. Programme managers must ensure that equal attention is paid to both areas during training and at the stage of data collection. Although this survey did group children under 5 years of age together, it would be important that subsequent studies subdivide the under 5’s into under 24 months as well as the under five’s in order to provide detailed information on coverage of risk group. It is important to note that using the cluster survey technique to collect data on ITN coverage may result in getting less than the expected 210 interviews. This could occur if several mothers have twins or other household members have to stand in for children whose mothers are not at home at the time of interview. To overcome this issue, it may be necessary to over sample in order to obtain the required 210 interviews for the ITN coverage analysis. The minimum number of clusters required for the cluster survey is thirty, this could be increased in areas of low net usage to minimize bias. In communities where baseline sociodemographic information does not exist, it will be essential that the opportunity be used to get quantitative data on the characteristics of different strata of the population. A baseline approval may be designed to identify current net users, or in the case of areas where net programme exist, new net purchasers and the evaluation of the scale IEC promotion campaign and details of coverage would be useful information to collect. 20 Although most FGD participants had some knowledge about where to get nets and net treatment service, a clear message that came out of the FGDs was that men are more informed about net treatment and sale services than women. The same can be said for net owning households as against nonnet owning households. The probable reason for this could be that women income status are low and that men control most of the income in the household and would have to take decisions on how to use scarce resources. Women are therefore constrained their inability to acquire nets or retreat services without depending on their husbands. Personal contact was seen as the best mode of communicating messages about nets and net retreatment services to the community. Most community members are aware of the sale and treatment of nets in the community but a few people utilize these services as clearly shown by the focus group discussion and the survey. The main reason advanced for this, is that, during the efficacy trial, nets were given free to both the treated group and later to the control group and therefore people still expect to receive them free. Another reason given for nonpurchase of nets is lack of money. For rural African communities where resources are limited, buying a net over $5.00 is a very big investment and drain on the family income and to overcome this, alternative net production mechanisms such as locally made and sewn nets should be considered in order to make prices cheaper and affordable to all. The rigorous monitoring processes of going activities led to new ideas that helped the program to refine and redefine its strategies. The focus group discussions and other monitoring activities suggested that people need to be reminded at regular intervals about net and net treatment services which is well done by the itinerant workers. The shops were noted not to good avenues to do retreatment as compared to itinerant workers as the shops are more profit oriented. Meetings were held with shop owners to discussion these issues. They were encouraged to talk to people about the services they provide. Information gathered from the various monitoring processes indicate that the itinerant workers are the most efficient and desirable channels of providing ITN services to the community. This is an important information to program planners and implementers. However, it also important for further studies to be done on the cost of providing this service by itinerant workers. The confidence interval for the difference between two proportions is given by c.i.= (p1p2)+/1.96*sqrt((p1(1p1)/n1+(p2(1p2)/n2)) where p1, p2 are the two proportions n1, n2 the sample populations of the two proportions 1.96 is the 5% point of the standard normal distribution. The table below shows the results; 21 7 References Adongo P., Akweongo P., Reed K, and Binka F. N. (1996) An assessment of the availability of bednets in Ghana. A report submitted to PATH Canada, Ottawa. Afari E, Akanmori B., Nakano T. And OforiAdjei D. (1992). Plasmodium falciparum resistance to chloroquine in vivo in the three ecological zones in Ghana: Transactions of the Royal Society of Tropical Medicine and Hygiene 86 231232 Binka F. N., et al. (1996) Impact of permethrin impregnated bednets on child mortality in KassenaNankana district, Ghana. Tropical Medicine and International Health. Vol. 1 No. 2. PP 147154. Binka F. N. and Adongo P. (1997). Acceptability and use of insecticide impregnated bednets in northern Ghana. Tropical Medicine and International Health. Vol. 2 No. 2. pp 499507. Gyapong M., et al (1996). Introducing insecticide impregnated bednets in an area of low bednet usage: an exploratory study in northeast Ghana. Tropical Medicine and International Health. Vol. 1 No. 3. pp 328333. Kirkwood, B. R., (1990). Essentials of Medical Statistics. Blackwell Scientific Publications. pp 85. NIBP (National impregnated bednet program) Report on the (1992) Bednet impregnation process. NIBP, MRC Fajara, The Gambia. Ngom, P., Awasana A. A., Bawah A. A., Owusu_Adjei S., and Binka F. N. (1993). The Navrongo Demographic Surveillance System. Documentation note, 31, Navrongo Health Research Centre. WHO (1991) The EPI coverage survey. Training for mid level managers. Expanded programme on immunization. World Health Organization. 22 8 Appendix A SURVEY INDIVIDUAL QUESTIONNAIRE NAVRONGO HEALTH RESEARCH CENTRE BEDNET SURVEY INDIVIDUAL QUESTIONNAIRE Name of interviewee ______________________________________________ CPD NAME/ID PERMANENT ID OF INTERVIEWEE DATE OF INTERVIEW FIELD WORKER CODE NO QUESTIONS 1 Are you the head of the household? IF YES GO TO QUESTION 3. 2 What is your relationship with the head of the household? ANSWER OPTIONS Yes…………………………1 No…………………………2 Spouse…..…………………1 Son…………………………2 Daughter……………………3 Other……………………….4 NA…………………………8 Farmer…………………….1 Trader/artisan……………..2 Civil servant………………3 Other………………………4 Yes…………………………1 No…………………………2 Yes…………………………1 No…………………………2 Yes…………………………1 No…………………………2 Yes…………………………1 No…………………………2 3 What is your occupation? 4 Does any one in this household own a bicycle? Does any one in this household own a radio? Does any one in this household own a coal pot? Have you heard or seen a message about nets and net dipping in the last 6 months? From what sources did you hear or Radio………………………01 see this message Posters………………………02 Drama………………………03 Durbars………………………04 Health Centers………………05 Health Worker………………06 Friend………………………07 Visiting net treating person…..08 Other…………………………09 NA……………………………88 5 6 7 8 COMPID PERMID DINT FW CODE HHOUSE RHOUSE OCCUP BICY RADIO POT MESS SOUR 23 9 10 11 Do you know where you can re treat and buy nets from in your area? For how much does it cost for dipping a net? For how much does a net cost? Yes…………………………1 No…………………………2 NET __________________________ DCOST __________________________ NCOST Now I would to find out about our family? Age 04 515 1539 40+ 13 14 Female male Does your household own any mosquito Yes…………………………1 OWN net? No…………………………2 END INTERVIEW IF HOUSHOLD DOES NOT OWN NET. How many nets do you have? One MNET Two Three More than four Which members of family sleep under the a mosquito net which was bought the last year? [Indicate them a circle] Which members of family sleep under the a mosquito net which you owned for longer than a last year? [Indicate them a triangle] Age 04 515 1539 40+ Female male 24 9 Appendix B – Focus Group Discussion Guidelines Focus Group Discussion Guidelines for net owners We know that all the people here at least one mosquito net in their house. We would like to ask you a few questions about you nets and would appreciate you been open to us. Net Usage What are some of the things you like and don’t like about using a net? In your homes who usually sleeps under a mosquito nets? (Probe for children, older people and pregnant women). What time of the year are nets most often used? And why? Net treatment How can you get nets treated in your community? [ Probe knowledge of IWs/SH/HC]. What did you like about the services of [IWs/SH/HC] that you used? Are there any problems with the net treatment services? [ Probe about how services could be improved]. When do you think is the best time of the year for net treatment? Why? What are the things you like and don’t like about putting insecticide on your net? Some of you not treated your nets this year, why is it that you have not treated your nets? Is there anything that will make you decide to treat your nets next year? Promotional Have you seen any of these posters before? [show sets of posters], if yes where? What did the posters tell you? Have someone come to your house to tell about malaria and sell treated nets to you? Have you seen a drama about malaria and treated nets? if yes, what was it about? Have you heard a radio show about malaria and treated nets? if yes, what was it about? Have you attended a durbar about malaria and treated nets? if yes, what was it about? Net replacement What do you do when your net becomes torn? Do you know where you can buy nets from? And how much? 25 What are some of things that stop people from buying new nets? 26 10 Appendix C FGD Questions for nonnet owners FGD Questions for nonnet owners 1.We know that there are people around here who have mosquito nets but you don’t have. Do you know where mosquito nets are sold? 2.what is the reason for people not buying mosquito nets? 3. Have you spoken about the money. Is it because of the money or you don’t see it as necessary to have a mosquito net or because they are not available? 4. There are some people around your area who have mosquito nets but you don’t have. Can you tell us what the reasons are that you don’t have. 5. In this locality who are the people who sleep under the nets. Is it the children, adults or pregnant women? 6. What time in your area do you think many people like to sleep under mosquito net? What time of the year do most people often sleep under mosquito nets? 7. We have heard what you said so far, but why are there so many mosquitoes at the time you have spoken. 8. What do you know about the medicine used to treat the mosquito nets? What help does it give you? 9. Did they tell you it wasn’t good? 10. Did someone come to your area to talk about malaria and to sell mosquito nets? 11 .Did they come into your houses to speak to you about them? 12.Where do you send your net for treatment? 13. Have you watched or heard of a play that talks about malaria and treated nets? 14. Have you heard in the radio a talk about malaria and treated nets? 15. Some of you said you heard the play on radio and others say it is other people who spoke to you about this. Which of these do you prefer? 16. Is it the play you want or the talk? 17. When did you here the radio talk? 18. What did they talk about? 27 11 Appendix D Draft paper for publication in peer review journal Draft paper for publication in peer review journal To develop, pilot test a methodology to rapidly assess the use of mosquito nets in the Kassena Nankana District, Northern Ghana. Philip Adongo 1 Catherine Reed 2 Fred N. Binka 3 Joseph Amankwah 4 Martin Adjuik 1 1 Navrongo Health Research Centre, 2 PATH Canada, 3 World health Organization (WHO), 4 Ministry of Health. Ghana. 28 Abstract Malaria is a serious barrier to health and development in Ghana, and is the main cause of mortality in young children. Interest in treated nets continues to grow as treated nets have been associated with a 17% reduction in all cause mortality in young children in Ghana. Recent studies in Ghana suggest that household ownership of nets is between 9 20%, however, the number of children within these samples, actually sleeping under nets was approximately 20%. The purpose of this study was to pilot test a cluster sampling (CS) methodology for rapidly assessing the coverage by mosquito nets of children under 2 years, in particular, and the general population. In the CS, 71% of households owned one or more nets, compared to 68.4% in the Simple Random Survey (SRS). In the SRS, the total number of children living in a net owning household was 63.2%. From the SRS male children of this age group were reported to sleep under nets 98.0% of the time, compared to 89.6% female children. In the CS approximately 62.1% of children living in net owning households were reported to be sleeping under nets. Similar to the SRS, there were more males aged 0 4 sleeping under nets (97%) then females (87.6). With respect to the number of people in the household who were sleeping under a net, the difference in proportions between the two surveys was 2.4%, 95% CI = (9.8% 5.0%). The sample was subdivided into groups by age and sex, no significant difference was found between the two surveys in terms of net usage, except for the age group of 40+ males. The results from this study suggest that either of the two methods could be used to assess net coverage, since there is no difference between the two samples. CS does not require a rigorous sampling framework, and is easier to adopt by district health managers. The CS provides an additional advantage of offering the opportunity to collect information on Expanded Programme on Immunization, such as infant immunization coverage and tetanus toxoid immunization of women at little extra time and effort. However care should be taken when combining surveys for malaria control and EPI, to ensure that equal attention is paid to both areas when training and data collection. Subsequent studies should further subdivide the under 5 years old into under 24 months to provide detailed information on coverage of this risk group. 29 Introduction Malaria is a serious barrier to health and development in Ghana. It is the main cause of mortality among young children. The increasing resistance of plasmodium falciparum to choroquine (Afari et. al., 1992) has prompted interest in treated nets as a part of integrated malaria control activities. Treated nets have been associated with a 17% reduction in all cause mortality in young children (6 months 4 year old) in Northern Ghana (Binka et al., 1996). Ghana has little recent tradition of mosquito net use. When nets were introduced into the KassenaNankana District in 1992, only 4% of the households owned one or more nets. More recent studies in other areas of Ghana show ownership of between 9 20%, but only 20% of children in these households actually slept underneath a net (Adongo 1996). However nets and treated nets have been well accepted when they have been used (Binka and Adongo, 1997). When considering promoting the widespread use of ITN's cost is a primary concern. In Ghana, the lack of tradition and the poor availability of nets in shops around the country are also important factors. A recent survey (June 1998) has estimated that 68% of the households in the Kassena Nankana district own one or more mosquito nets, most of them donated during the bednet trial in 1992. The percentage of children sleeping under a net in net owning households is approximated to be <30%. A similar study from 1996 showed that 93% of households had one or more nets and approximately 50% of children in net owning households sleep underneath them. The Navrongo Health Research Centre (NHRC) has experiences with ITN’s from the efficacy trial of 1992 1994 as well as community assessment from the work performed on Vitamin A supplementation trial and other interventions. With this experience, the NHRC collaborated with PATH Canada to develop and test a collection of tools that can be used in the KassenaNankana District, and other Districts of Ghana to monitor ITN interventions. Particular emphasis was placed on assessing the numbers of children under five years old that are sleeping under a mosquito net. This target group is the most vulnerable to mortality and morbidity from malaria and has been chosen by the MOH in Ghana (and other interested organizations) as a key indicator for ITN interventions. As ITN interventions move from the research world into the sphere of child health it is fitting that ITN implementers benefit from the lessons learned from other interventions which have also targeted children under five and developed monitoring tools to assess their interventions. In this study, a cluster sampling technique was piloted and evaluated against a standard simple random sampling method. Since June 1998, three distinct activities have been implemented in the Kassena Nankana District: 1. Selling of mosquito nets 2. Provision of a net treatment service 3. Promotion of the above activities as well as raising awareness of the benefits of treated nets for health and malaria prevention. 30 These activities are being supported by WHO/TDR through a project evaluating a community’s willingness to replace and retreat nets. Nets and insecticides are being actively marketed through three different channels: itinerant vendors, Health Centres and shops. The survey methodology discussed in this paper is only one of a complimentary set of tools that has been developed to assess these different activities. There is a growing commitment by the Ghana Ministry of Health (MOH) to actively promote malaria control. The promotion of insecticide treated mosquito nets (ITN’s) are an integral part of that strategy. With the collaboration of the MOH, NGO's and donors, ITN interventions are being planned in Ghana. Since most districts will be implementing ITN programs in the near future, knowledge of coverage will help managers to assess performance and develop strategies to increase coverage. The need for rapid, pragmatic and accurate monitoring and evaluation tools which will assist programme mangers to assess a baseline coverage, plan their activities, monitor progress towards setting goals and providing information to assist in refining activities during the life of the project cannot be overemphasized. The optimal research tool will be able to assess reported coverage (children sleeping under a net) of children under five years of age in a given population and monitor change in that population. Other methods will then provide information on the factors, which influence this coverage rate. Design and Methods Study Site This study was carried out in the KassenaNankana district of northern Ghana, population approximately 140,000 (NDSS, 1996), where a large scale trial of permethrin impregnated bednet study was conducted (Binka et al. 1996). In addition, ongoing activities are being implemented at the Navrongo Health Research Centre (NHRC) to evaluate the community's willingness to replace and retreat nets in the district, which will include the sale of nets and insecticides. The district lies within the Guinea Savannah of northern Ghana and covers an area of about 1675km 2 . There are two main seasons, a short wet season with an average annual rainfall of 8501000mm and a dry season from September to May when little or no rainfall occurs. The people in this area comprise mainly of the Kassena and Nankana peoples and a minority of Buli speaking people. The population is primarily rural, agrarian and live in dispersed settlements. There are no distinguished villages as such because villages overlap. Settlement pattern is characterized by extended family living in dispersed compounds surrounded by farmlands. The district is divided into ten chiefdoms and each chiefdom is headed by a paramount chief. The chiefdoms are also subdivided into divisional and sub divisional areas, each headed by divisional and subdivisional chiefs. At the sub 31 divisional level, there is further division into lineage groups. The lineage is the smallest corporate group and is usually headed by the oldest male member. Most social and political activities take place at the lineage level. Net usage was about 4% in the community before the start of the impregnated bednet (Gyapong et al.1996). Usage increased to over 90% during the trial (Binka and Adongo 1997). Methods Two methodological approaches were used to pilot test and validate the cluster sampling methodology: a cluster survey and a simple random sample survey. Cluster survey The study adopted the WHO EPI cluster survey method because of its usefulness in measuring other health indicators collected at the district level (WHO 1991). The NHRC runs a Demographic Surveillance System (NDSS) which reports the dynamics of the population every quarter to update demographic events. The district has been divided into 244 clusters, with a cluster containing an average of 65 compounds. An average of 570 people live in a cluster. Using the EPI clustering system, the 244 clusters were regrouped into 30 new clusters. Seven mothers with children who were aged between 1224 months at the date of visit were interviewed in each cluster. One advantage of selecting this age category is to make it possible for District Health Management Teams to also assess EPI coverage during net coverage. Two field workers working together were expected to conduct 7 interviews in a cluster per day. This was judged to be realistic but not punitive allowing for the distances between compounds. There was supervision by a senior researcher from NHRC and a counterpart from the MOH, experienced in EPI survey methods. The most critical issue for the cluster survey is how to select the first compound/household to start the interview. With the assistance of geographic maps, schematic maps and people with good local knowledge, the field workers identified a central location within the cluster from which to start. They randomly selected a direction by spinning a pencil from the centre of the cluster. After spinning the pencil, all compounds in the direction of the pencil were walked through and marked with chalk until the edge of the cluster was reached. A random number between 1 and the total of compounds was selected to represent the first compound/household. The interviewers then visited every compound from the starting point until they had found 7 appropriate children. For the purpose of collecting household information on ITN use, the mother or guardian of the index child (1224 months) was interviewed. No interviews were conducted in compounds that did not have children aged between 1224 months. Immunization cards and NDSS ID cards were used to ascertain correct ages and children qualified to be interviewed. Random sample survey The Navrongo Demographic Surveillance System covers about 13,000 compounds. From the compound data, a random sample of 400 compounds was selected and all households in these compounds were interviewed. Based on 68% (Adongo 1996) prevalence of net use in the district, 400 compounds were selected. The software program Stata 4.0 was used for all random calculations for the survey. 32 Results The surveys all took place during the 1998 rainy season. The Cluster Survey (CS) was conducted between the 4 th – 11 th of September, the simple random survey (SRS) between the 19 th 30 th of September. The SRS questionnaire was longer than the Cluster Survey, however the details of net ownership and net coverage were collected and recorded in the same manner. In the CS, all 200 interviews were completed out of the expected 210. On some occasions single respondents had to be interviewed for two children either because the children are twins or their mothers were not present at the time of visit. The information was collected and analyzed by the staff of NHRC and PATH Canada. The data was entered using FOXPRO 2.6 for DOS and analyzed using EPI INFO version 6.0. The SRS team visited 566 households, in which 35% of the respondents were the Head of the household and 46% were a spouse, the remainder were sons, daughters or other. In the CS, all the 200 interviews were carried out with the child’s mother. In the SRS 68.4% of the households owned one or more mosquito net. In the CS 71% of households owned one or more nets. The total number of households visited was 566. From this total, there were 462 children aged 04. The percentage of children living in a net household was 63.2%. Male children of this age group in net owning households were reported to sleep under nets 98.0% of the time, compared to 89.6% female children from the SRS. In general, with increasing age group, there were fewer people sleeping under nets. For all age groups, 78.1% of females in net owning households slept under nets, compared to 67.5% males. Out of the 200 households interviewed in the cluster survey, the total number of children aged 04 was 248, and 62.1% of the children in all households were reported to be sleeping under nets (Table 2). Similar to the SRS, more males aged 04 in net owning households were sleeping under nets (97%) compared to females (87.6). The total percentage of people sleeping under nets in net owning households was 53.9%. Again more females than males were reported to be sleeping under nets (77.4%, 68.4%, respectively). (Table 1 here) (Table 2 here) Statistical comparison between the results of the simple random survey and the cluster survey From table 1 and table 2, net usage is given as a proportion of netowning population. To assess whether the two surveys give different results is to calculate the differences in proportions by survey and include the confidence intervals of these differences for 33 the stratified and overall results (Kirkwood, 1990). The results of the surveys will be different if the 95% confidence interval do not include zero. If 95% interval includes zero, then it implies that the results of the two surveys are comparable at the 95% confidence level. (Table 3 here) Discussion Coverage is seen as one of the most important means of monitoring net use. Whereas this is relatively easy to achieve in trial situations (NIBP 1993), it is sometimes difficult for program managers at the district level to monitor coverage. The issue of selecting accurate sample for conducting surveys has been a problem in most districts because of nonexisting good sample frames. The NHRC provides an ideal situation where a simple random survey could be compared to a cluster survey because of NDSS data source. The results from the surveys suggest that there was no difference between the proportion of households owning one or more nets as presented in the SRS and CS respectively. The difference between the two proportions is 2.4%, 95% CI = (9.8% to 5.0%). It will be noticed from table 4 that the stratified analysis of the difference between proportions of the two surveys, except for the age group 40+ for the males, show that there is no significant difference between the methods in terms of net usage. One method could be used instead of both. If logistically one survey is more superior, then there is good reason to carry out that type of survey rather than the other. Conducting a CS does not require a rigorous sampling framework and it is easier to be adopted and used by district health managers. The CS will provide district managers an added opportunity of collecting information on Expanded Programme on Immunization (EPI) such as infant immunization coverage and tetanus toxoid immunization of women. Although the CS data were processed and analysed by using computer packages (FOXPRO 2.6 for DOS and EPI INFO version 6.0.), this can be done manually. It is quite possible to tabulate the population and coverage figures by hand. It is anticipated that the CS can be used with a sample size of 210 for communities with a high or low net use. On the other hand, when conducting a SRS the sample drawn must be according to the approximate percentage of existing net use. However, care should be taken when combining surveys for malaria control and EPI. Programme managers must ensure that equal attention is paid to both areas when training and at the stage of data collection. Although this survey did group children under 5 years of age together, it would be important that subsequent studies subdivide the under 5’s into under 24 months as well as the under five’s in order to provide detailed information on coverage of risk group. It is important to note that using the cluster survey technique to collect data on ITN coverage may result in getting less than the expected 210 interviews. This could occur if several mothers have twins or other household members have to stand in for children whose mothers are not at home 34 at the time of interview. To overcome this issue, it may be necessary to oversample in order to obtain the required 210 interviews for the ITN coverage analysis. In communities where baseline sociodemographic information does not exist, it will be essential that the opportunity be used to get quantitative data on the characteristics of different strata of the population. In a base line you may want to identify current net users, or in the case of areas where net programme exist, new net purchasers and the evaluation of the scale IEC promotion campaign and details of coverage would be useful information to collect. Note The confidence interval for the difference between two proportions is given by c.i.= (p1p2)+/1.96*sqrt((p1(1p1)/n1+(p2(1p2)/n2)) where p1, p2 are the two proportions n1, n2 the sample populations of the two proportions 1.96 is the 5% point of the standard normal distribution. The table below shows the results; 35 References Adongo P., Akweongo P., Reed K, and Binka F. N. (1996) An assessment of the availability of bednets in Ghana. A report submitted to PATH Canada, Ottawa. Afari E, Akanmori B., Nakano T. And OforiAdjei D. (1992). Plasmodium falciparum resistance to chloroquine in vivo in the three ecological zones in Ghana: Transactions of the Royal Society of Tropical Medicine and Hygiene 86 231232 Binka F. N., et al. (1996) Impact of permethrin impregnated bednets on child mortality in Kassenanankana district, Ghana. Tropical Medicine and International Health. Vol. 1 No. 2. pp 147154. Binka F. N. and Adongo P. (1997). Acceptability and use of insecticide impregnated bednets in norhtern Ghana. Tropical Medicine and International Health. Vol. 2 No. 2. pp 499507. Gyapong M., et al (1996). Introducing insecticide impregnated bednets in an area of low bednet usage: an exploratory study in northeast Ghana. Tropical Medicine and International Health. Vol. 1 No. 3. pp 328333. Kirkwood, B. R., (1990). Essentials of Medical Statistics. Blackwell Scientific Publications. pp 85. NIBP (National impregnated bednet program) Report on the (1992) Bednet impregnation process. NIBP, MRC Fajara, The Gambia. Ngom, P., Awasana A. A., Bawah A. A., Owusu_Adjei S., and Binka F. N. (1993). The Navrongo Demographic Surveillance System. Documentation note, 31, Navrongo Health Research Centre. WHO (1991) The EPI coverage survey. Training for mid level managers. Expanded programme on immunization. World Health Organization. 36 Table.1 Simple random survey (SRS) Female Agegp Total pop Net owning pop Net N(%) N(%) Users N Total pop N(%) Male Net Owning Pop N(%) Net Users N Total N(%) 0 – 4 227 (60.8) 154 (89.6%) 138 235 (65.9) 158 (98) 155 462 (63.2) 5 – 15 369 (50.4) 247 (75.3%) 186 362 (51.3) 244 (76) 186 731 (50.8) 16 – 39 520 (54.0) 350 (80.3%) 281 317 (34.3) 213 (51) 109 837 (46.5) 40+ 230 (49.6) 170 (67.1%) 114 260 (33.8) 182 (48) 88 490 (41.2) Sub total 1346 (53.4) 921 (78.1%) 719 1174(67.8) 797(67.5) 538 2520 (60.6) Table 2. Cluster Survey (CS) Agegp Total pop N(%) Female Net owning pop Net N(%) Users N Total pop N(%) Male Net Owning Pop N(%) Net Users N Total N(%) 0 – 4 128 (60.9) 89 (87.6) 78 120(63.3) 78 (97.0) 76 248 (62.1) 5 – 15 143 (58.0) 111 (74.7) 83 133 (57.8) 107 (71.9) 77 276 (58.0) 16 – 39 203 (54.6) 145 (76.0) 110 122(28.6) 82 (42.6) 35 325 (44.6) 40+ 58 (53.4) 46 (67.3) 31 74 (51.3) 63 (60.3) 38 132 (52.3) Sub total 532 (56.9) 391(77.4) 303 449(50.3) 330 (68.4) 226 981 (53.9) Table 3. Comparison between the results of the simple random survey and the cluster survey on usage Agegrp 0 4 5 15 16 39 40+ Overall Female Diff (%) (p_SSp_CS) 2.0 C. I. (4.8, 8.8) 0.6 4.2 0.3 0.7 (7.0, 8.2) (1.7,10.1) (10.3,9.7) (3.1,4.5) Male Diff (%) (p_SSp_CS) 1.0 4.1 8.4 12.3 0.9 C. I. (2.1,4.1) (3.5,11.7) (1.1,17.9) (22.6,2.0) (5.5,3.7) 37 12 Appendix E Cluster sampling population data Cluscod EGA EGC EED EEF EEG EGB EGG EGE EGD EFF EFG EGF EEA EAD EEB EEE EEC EAE EAF EFA EFD EFB EFC NFF NFD NFG NFB NFC NFE EAC EAB EAA EAG EBA EDC Popn 415 328 297 285 192 459 371 410 414 326 610 409 341 338 529 650 667 667 590 651 660 605 526 740 673 481 599 405 722 367 514 338 465 384 499 Cumm_pop 415 743 1040 1325 1517 1976 2347 2757 3171 3497 4107 4516 4857 5197 5724 6374 7041 7708 8298 8949 9609 10214 10740 11480 12153 12634 13233 13638 14360 14727 15241 15579 16044 16428 16927 Cluster_number 1 2 3 38 Cluscod EDA EBB EBF EBH EDD EDG EDH EFH SEI EFE SEA SEB SEC ECG EDF EDE EBG EBE EBC ECA EDB EBD ECB ECC ECE SEE SEF SED SEG ECF ECD SFF SFA SFG SFE SFH SDA SFC SFD SFB SDC SDE Popn 373 506 286 458 415 585 358 411 259 383 531 409 452 503 450 440 310 301 321 537 308 336 328 617 381 326 556 464 480 513 496 291 391 459 519 379 336 479 298 453 345 542 Cumm_pop 17300 17806 18092 18550 18965 19550 19908 20319 20578 20961 21492 21901 22353 22856 23306 23746 24056 24357 24678 25215 25523 25859 26187 26804 27185 27421 27977 28441 28921 29434 29930 30221 30612 31071 31590 31969 32305 32784 33082 33535 33880 34422 Cluster_number 4 5 6 7 39 Cluscod SDD NFA NCG NCE NCC NCD NCF NDF NDG NGB NCA NCB NGC NGA NGG NAB NDA NDB NDD NDC NDE NAA NAC NAE NGD NGE NGH NGF WFA WFB WFD WFE WFC NAD NEA NEB NEC NEF NEE NED NBD Popn 358 657 687 711 1094 525 521 478 472 562 705 915 627 844 497 501 630 400 741 556 730 601 847 780 534 1134 265 765 666 561 622 726 577 479 508 439 756 814 651 540 753 Cumm_pop 34780 35437 36124 36835 37929 38454 38975 39453 39925 40487 41192 42107 42734 43578 44075 44576 45206 45606 46347 46903 47633 48234 49081 49861 50393 51529 51794 52559 53225 53786 54408 55134 55711 56190 56698 57137 57893 58707 59358 59898 60651 Cluster_number 8 9 10 11 12 13 40 Cluscod NBF NBG NBE SBA NBC SBB SBD SBF SCA SCC SCB SBG SCF SCD SDG SDF SDI SDH SCG SDB SAK SCE SAA SAC SAD SBC SBE SBH SAB SAJ SGS SGT SGP SGR SGQ SGN SAE SAF SAG SGM SGK SGL SGJ SHH SHJ Popn 479 508 439 756 814 561 540 753 430 739 448 365 711 449 445 278 290 483 562 389 470 692 491 648 358 585 555 365 674 629 951 404 833 962 780 811 708 694 660 593 588 504 724 500 56 Cumm_pop 61130 61638 62077 62833 63647 64208 64748 65501 65931 66670 67118 67483 68194 68643 69088 69366 69656 70139 70701 71090 71560 71252 72743 73391 73749 74334 74889 75254 75928 76557 77508 77912 78745 79707 80487 81298 82006 82700 83360 83953 84541 85045 85769 86269 86325 Cluster_number 14 15 16 17 18 19 41 Cluscod SHG SHE SHF SHD SHA SHB SHC SJA SJC SJB SJD WEA WEB WEC NAF NEG NBB NBA WFF WEE WEF WFG WED TBB TBD TBA TBC WDF WDG WDE WDA WDX WCE WDY WDZ WDC WCF WDB WCC WCA Popn 578 669 721 775 594 646 611 852 834 526 843 639 609 526 642 512 674 564 762 523 665 719 739 478 11 918 399 599 609 514 347 182 574 710 446 425 490 498 516 495 Cumm_pop 86903 87572 88293 89068 89662 90308 90919 91771 92605 93131 93974 94613 95222 95748 96390 96902 97576 98140 98902 99425 100090 100809 101548 102026 102037 102955 103354 103953 104562 105076 105423 105605 106179 106889 107335 107760 108250 108748 109264 106759 Cluster_number 20 21 22 23 24 42 Cluscod WBF WBD WBE WBA WBB WBC WAF WAE WAC WAD WAA WAB WGA WGB WGC WGD CAA CAB CAC CAD CAE CAF CAG CAH CAI CAJ CAK CAL CAM CAN CAP CAQ CAR CAS CAT CAU CAV CAW CBA Popn 344 647 557 678 789 451 348 631 550 335 543 458 840 1175 846 553 667 845 1198 624 739 906 530 500 623 314 455 635 1162 641 733 712 233 222 421 579 211 39 158 Cumm_pop 110103 110750 111307 111985 112774 113225 113573 114204 114754 115089 115635 116090 116930 118105 118951 119504 120171 121016 122214 122838 123577 124483 125013 125513 126136 126450 126905 127540 128702 129343 130076 130788 131021 131243 131664 132243 132454 132493 132651 Cluster_number 25 26 27 28 29 30 43


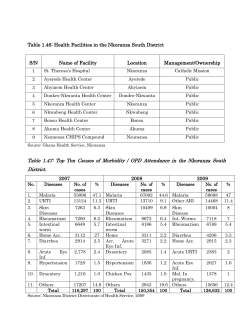


© Copyright 2026