
Strategic Plan - St. Johns River Water Management District
St. Johns River Water Management District 4049 Reid Street ▪ P.O. Box 1429 Palatka, FL 32178-1429 Phone: (386) 329-4540 floridaswater.com District Strategic Plan (FY 2015–FY 2019) Contents I. Overview………………………………………………………………………………………………………………………………………………………………………………………………………………….6 St. Johns River Water Management District Overview………………………………………………………………………………………………………………………………………………….6 About the Strategic Plan……………………………………………………………………………………………………………………………………………………………………………………………….7 Strategic Priorities………………………………………………………………………………………………………………………………………………………………………………………………………..8 Regional Water Supply Plans — Development and Implementation…………………………………………………..…………………………………………………………………..17 Minimum Flows and Levels — Development and Prevention and Recovery Strategies…………………………………………………………………………………………..18 North Central Florida Water……………………………………………………………………………………………………………………………………………………………………………………19 North Florida Water……………………………………………………………………………………………………………………………………………………………………………………………….20 North Florida Water (continued)…………………………………………………………………………………………………………………………………………………………………………….21 Central Florida Water……………………………………………………………………………………………………………………………………………………………………………………………..22 Central Florida Water (continued)…………………………………………………………………………………………………………………………………………………………………………..23 Water Conservation………………………………………………………………………………………………………………………………………………………………………………………………..24 Sea Level Rise………………………………………………………………………………………………………………………………………………………………………………………………………….25 Middle and Lower St. Johns River……………………………………………………………………………………………………………………………………………………………………………26 Middle and Lower St. Johns River (continued)………………………………………………………………………………………………………………………………………………………..27 Northern Coastal Basins………………………………………………………………………………………………………………………………………………………………………………………….28 Northern Coastal Basins (continued)……………………………………………………………………………………………………………………………………………………………………….29 Apopka/Upper Ocklawaha Basins……………………………………………………………………………………………………………………………………………………………………………30 Upper St. Johns River………………………………………………………………………………………………………………………………………………………………………………………………31 Indian River Lagoon Protection……………………………………………………………………………………………………………………………………………………………………………….32 Indian River Lagoon Protection (continued) ………………………………………………………………………………………………………………………………………………………..….32 Page 3 District Strategic Plan (FY 2015–FY 2019) Springs Protection…………………………………………………………………………………………………………………………………………………………………………………………………..34 Springs Protection (continued) ……………………………………………………………………………………………………………………………………………………………………………….35 Flood Protection……………………………………………………………………………………………………………………………………………………………………………………………………..36 Land Management Enhancement……………………………………………………………………………………………………………………………………………………………………………37 Land Management Enhancement (continued) ……………………………………………………………………………………………………………………………….………………………38 Agriculture Partnership………………………………………………………………………………………………………………………………………………………………………………….……….39 Agriculture Partnership (continued)………………………………………………………………………………………………………………………………………………………………………..40 Cost-share……………………………………………………………………………………………………………………………………………………………………………………………………………….41 Outreach…………………………………………………………………………………………………………………………………………………………………………………………………………………42 Water Resources Data Systems……………………………………………………………………………………………………………………………………………………………………………….43 Water Resources Data Systems (continued) …………………………………………………………………………………………………………………………………………………………..44 Water Resources Assessments………………………………………………………………………………………………………………………………………………………………………………..45 Water Supply Planning and Project Implementation……………………………………………………………………………………………………………………………………………….46 Water Supply Planning and Project Implementation (continued)……………………………………………………………………………………………………………………………47 Regulatory Services…………………………………………………………………………………………………………………………………………………………………………………………………48 Regulatory Services (continued) ……………………………………………………………………………………………………………………………………………………………………………..49 Surface Water Projects……………………………………………………………………………………………………………………………………………………………………………………………50 Public Works……………………………………………………………………………………………………………………………………………………………………………………………………………51 Land Resources……………………………………………………………………………………………………………………………………………………………………………………………………….52 Land Resources (continued) ……………………………………………………………………………………………………………………………………………………………………………………53 Administration………………………………………………………………………………………………………………………………………………………………………………………………………..54 Page 4 District Strategic Plan (FY 2015–FY 2019) Administration (continued) ……………………………………………………………………………………………………………………………………………………………………………………55 II. Five-Year Strategic Budget……………………………………………………………………………………………………………………………………………………………………………………..56 Appendix A — Strategic Plan Annual Work Plan Report (FY 2013‒2014) ……………………………………………………………………………………………………………………….64 Page 5 District Strategic Plan (FY 2015–FY 2019) I. Overview St. Johns River Water Management District Overview In 1972, the Florida Legislature established five water management districts. Each district has responsibilities in four broad categories: water supply, water quality, natural systems management and flood protection. Florida’s water management districts are primarily funded with ad valorem taxes. Each district is governed by a Governing Board, whose members are appointed by Florida’s Governor and confirmed by the Florida Senate. Board members serve for four years as regional or at-large representatives. The Governor and Legislature have approval authority over the districts’ budgets and there is general oversight at the state level by the Florida Department of Environmental Protection (DEP). The St. Johns River Water Management District (District) encompasses all or part of 18 counties in northeast and east-central Florida that includes 119 local governments and a total population of 4.8 million (as of 2014). The District operates from its headquarters in Palatka, and service centers in Palm Bay, Maitland and Jacksonville. Mission Statement of the District Ensure the sustainable use and protection of water resources for the benefits of the people of the District and the state of Florida. Page 6 District Strategic Plan (FY 2015–FY 2019) About the Strategic Plan In April 2013, the District’s Governing Board adopted a strategic plan to replace the District Water Management Plan consistent with Section 373.036(2)(e), Florida Statutes (F.S.). As also outlined in Section 373.036(2)(e), F.S., the strategic plan is updated annually, is for a minimum five-year planning horizon and identifies goals, strategic priorities, strategies, success indicators, milestones/deliverables and funding sources for the District. This document is the annual update to the strategic plan and establishes a new five-year period of fiscal year (FY) 2015–2019. This plan includes 26 strategic priorities that are further delineated as “initiatives” (15 total) and “continuing core programs (CCPs)” (11 total). Initiatives are a focused surge of activity targeted to complete a series of tasks. The 15 initiatives are focused on applied science, and capital and cooperative projects. The CCPs implement ongoing science, regulation, data collection and management; operations and maintenance of District assets; and provide cost-share funding and technical, administrative and communications assistance to all District programs. The Strategic Priority section of this document is organized to provide detailed work plans with milestones and deliverables and success indicators for each strategic priority. The Five-Year Strategic Budget identifies expenses for the planning period, as well as an analysis of revenue sources, both known and unknown, needed to implement the plan. Finally, the Strategic Plan Annual Work Plan Report for FY 20132014, a “report card” of how well the District achieved its FY 2013‒2014 milestones/deliverables and success indicators is included as an appendix to this plan. District Core Mission Areas Page 7 District Strategic Plan (FY 2015–FY 2019) Strategic Priorities District staff continue to review processes and practices for continuous improvement opportunities. This review has resulted in the identification of modified strategic priorities compared to last year’s plan. The District has determined that the Regional Water Supply Planning and Minimum Flows and Levels (MFLs) ― Prevention/Recovery Strategy Initiatives will be realigned to shift from a districtwide approach to a geographical, sub-regional focus. Beginning in FY 20152016, the two initiatives will conclude and the water supply planning and prevention/recovery strategies components from the concluded initiatives will be undertaken by the Central Florida Water and North Florida Water initiatives; as well as a newly identified regional initiative, North Central Florida Water. Other Water Supply Planning and Minimum Flows and Levels efforts, not associated with these regional initiatives, will be conducted as a part of Water Resource Assessments Continuing Core Program. Additionally, the District has identified Water Conservation, Sea Level Rise and Agriculture Partnerships, for additional emphasis. This emphasis is organizing the efforts currently occurring and adding additional focus. A detailed description of these new strategic priorities is included in Figure 1, Page 9. It is expected that several of the 15 initiatives will conclude during the five-year strategic planning period. New initiatives will be identified and incorporated into subsequent strategic plans. It should be noted that even though an initiative may conclude during the strategic planning period, projects associated with the initiative may continue. Figure 1 on the next page, visually depicts the 26 strategic priorities and identifies through colors the link between the priorities and the District’s core mission areas. While each initiative has been assigned a primary core mission area, most overlap into other areas. The black lines and dots indicate links between the concluded initiatives and CCPs, which will continue the work. Page 8 District Strategic Plan (FY 2015–FY 2019) Figure 1. Strategic Priorities Page 9 District Strategic Plan (FY 2015–FY 2019) The 26 strategic priorities are summarized below and are organized by primary core mission area/goal or continuing core program. Core Mission Area Water Supply Page 17 Strategic Priority Description Regional Water Supply Plans To develop and implement technically sound, science-based solutions to ensure the availability of sufficient water for existing and future reasonable-beneficial uses and natural systems in coordination with key stakeholders and partners. To ensure that MFLs will be met while providing for sufficient water supplies. 20 MFLs ― Development and Prevention and Recovery Strategies North Central Florida Water Initiative North Florida Water Initiative 22 Central Florida Water Initiative 24 Water Conservation 25 Sea Level Rise Water Quality 26 Goal: To protect and improve water quality within the District. 28 Middle and Lower St. Johns River Water Quality Improvement Northern Coastal Basins Goal: To implement a regional strategy to provide sufficient water for users and the environment. 18 19 30 Lake Apopka and Upper Ocklawaha River Basin 31 Upper St. Johns River Restoration 32 Indian River Lagoon Protection Ensure a sustainable water supply and protect water resources in North Central Florida in collaboration with key stakeholders. Ensure sustainable water supplies and protection of groundwater-dependent natural systems in partnership with key stakeholders in the District’s north Florida region. Work in partnership with Central Florida Water Initiative stakeholders to identify and further develop the Regional Water Supply Plan projects to meet existing and future water demands within the central Florida area while sustaining water resources and related natural systems. Develop and implement water conservation practices and projects in a cooperative manner with key stakeholders for all water user categories. Investigate water supply implications, estuarine water quality and coastal wetlands impacts associated with sea level rise. Protect the water quality and ecological value of the middle and lower St. Johns River through science-based planning and prioritized implementation of nutrient and other pollution reduction projects by leveraging District, local, state and federal resources. Enhance and protect the water quality and ecological habitat of the coastal basins of northeast Florida by leveraging District resources and developing cooperative working partnerships with federal, state, local and other stakeholders. Restore the ecological, recreational and economic value of Lake Apopka and the Upper Ocklawaha River Basin by reducing nutrient levels and refining lake level management consistent with flood protection priorities. Develop and implement integrated strategies and protocols that optimize flood control, protect and enhance natural ecosystems, improve water quality and provide for water supply for the upper St. Johns River. Protect and restore the water quality and ecological habitat of the Indian River Lagoon by leveraging District resources and working with the National Estuary Program and its partners. Page 10 District Strategic Plan (FY 2015–FY 2019) Core Mission Area Flood Protection Page 34 Strategic Priority Description Springs Protection 36 Flood Protection and Levee/Structure Rehabilitation Utilize District resources to develop and coordinate the protection and restoration of major springs. Develop a System-wide Improvement Framework (SWIF) for levee and water control structure maintenance and restoration, and leverage the SWIF to institute standardized levee and water control structure operations, maintenance and inspection protocols. 37 Land Management Enhancement Identify and implement restoration and vegetation management projects on Districtowned lands to enhance long-term ecologic and hydrologic conditions. 39 Agriculture Partnership 41 Cost-share 42 Outreach 43 Water Resources Data Systems 45 Water Resources Assessments 46 Water Supply Planning and Project Implementation 48 Regulatory Services Ensure that agricultural and District stakeholder needs are met in the shared goal of sustainable use and protection of water resources for the benefits of the people of the District and the state of Florida. The implementation of a coordinated and focused program to leverage District funds by engaging partners in sharing the expense of cost-effective water management projects. The communication of District projects, issues and activities; technical assistance and support; and relationship development with external stakeholders. Includes federal, state and local elected officials and their staffs; news media, professional and community groups, special interest groups and the general public. The planning, design, construction, maintenance, collection and processing of water resources data. Includes hydrologic, hydrogeologic, water quality, water quantity and biological data networks established for long-term monitoring of water resources. The analysis and review of data to assess the condition of water resources and the effectiveness of water management and restoration programs. Includes hydrologic conditions reporting, surface and groundwater assessments, status and trends assessments and participation in the statewide sea level rise and climate change task force. To develop and implement technically sound, science-based solutions to ensure the availability of sufficient water for existing and future reasonable-beneficial uses and natural systems in coordination with key stakeholders and partners. The implementation of District rules to issue permits for consumptive use of water and land development affecting environmental resources. Includes compliance and monitoring activities and implementation of a water shortage program. Goal: To prevent increases in flooding and operate and maintain the District’s regional flood control projects. Natural Systems Goal: To protect and improve natural systems within the District. Continuing Core Programs Goal: To provide an organizational structure and tools to deliver efficient and cost-effective services. Page 11 District Strategic Plan (FY 2015–FY 2019) Core Mission Area Page 50 Strategic Priority Description Surface Water Projects 51 Public Works 52 Land Resources 54 Administration Implement surface water projects under way at the conclusion of the Indian River Lagoon initiative. The operation and maintenance of District physical assets. Includes levees, canals, water control structures, navigation structures and roads on District-owned lands. The maintenance of District-owned lands. Includes real estate services, fire management, public use and recreation, invasive species management and security. The provision of administration and physical support. Includes financial and business systems, human resources, information technology, facilities, transportation and equipment and emergency management. Page 12 District Strategic Plan (FY 2015–FY 2019) The below graphic provides a snapshot of the 15 initiative-related strategic priorities summarized by applied science, capital and/or cooperative projects over the five-year planning period. Page 13 District Strategic Plan (FY 2015–FY 2019) The next sequence of graphics identifies milestones/deliverables associated with each initiative-related strategic priority. Page 14 District Strategic Plan (FY 2015–FY 2019) Page 15 District Strategic Plan (FY 2015–FY 2019) Detailed information (description, strategies, milestones/deliverables and success indicators) for each of the 26 strategic priorities is provided on the subsequent pages. Page 16 District Strategic Plan (FY 2015–FY 2019) Regional Water Supply Plans — Development and Implementation Develop and implement technically sound, science-based solutions to ensure the availability of sufficient water for existing and future reasonablebeneficial uses and natural systems in coordination with key stakeholders and partners. (Realigned to Continuing Core Programs after FY 20142015.) Strategy Regional Water Supply Plans (The District’s Water Supply Plan has a districtwide focus and is comprised of regional plans that are updated as needed — at a minimum, once every five years. Water supply plans identify future water supply needs for at least a 20-year planning horizon, and programs and projects needed to ensure sustainable supplies.) FY 14‒15 Region 1 – North Florida and Region 2 – North Central Florida planning efforts under way FY 15‒16 Milestones/Deliverables FY 16‒17 FY 17‒18 FY 18‒19 Activities transferred to other Strategic Priorities Regional 3 – Central Florida Water Initiative solutions plan incorporated into plan Success Indicators: 1. Progress toward meeting future water demands in each of the four water supply planning regions o Target: Continued development and implementation of projects in partnership with water users o Measure: Number of projects Water made available (million gallons per day [mgd]) 2. Implement water conservation strategies to improve water use efficiencies o Target: Public water supply — Decrease in residential per capita water usage o Measure: Annual residential water usage per capita o o Target: Measure: Agricultural water supply — Increase in percentage of agricultural acres utilizing efficient irrigation methods Percent change in acres due to change in irrigation method Page 17 District Strategic Plan (FY 2015–FY 2019) Minimum Flows and Levels — Development and Prevention and Recovery Strategies Protecting water resources from significant harm due to water withdrawals by establishing necessary and sufficient minimum flows and levels (MFLs), re-evaluating MFLs as needed, and collaboratively developing technically, environmentally and economically feasible strategies to ensure at-risk water bodies achieve their MFLs. (Realigned to Continuing Core Programs after FY 20142015.) Strategy FY 14‒15 MFLs Setting (S) and Re-evaluation (R) (MFLs are established to define sustainable water use while protecting the water resources from significant harm caused by permitted withdrawals.) FY 15‒16 Milestones/Deliverables FY 16‒17 FY 17‒18 FY 18‒19 Green Springs (Volusia County) Silver Springs/Silver River (Marion County) Activities transferred to other Strategic Priorities Re-evaluate Lakes Kerr and Tahoe (Marion County) Success Indicators: 1. MFLs setting and re-evaluation o Target: Protect water resources from significant harm due to water withdrawals by establishing necessary and sufficient MFLs and re-evaluating existing MFLs as needed o Measure: Percentage of annual Priority List and Schedule milestones met on schedule Page 18 District Strategic Plan (FY 2015–FY 2019) North Central Florida Water For the Marion County/North Lake County region, develop and implement technically sound, science-based solutions to ensure the availability of sufficient water for existing and future reasonable-beneficial uses and natural systems in coordination with key stakeholders and partners. Strategy North Central Florida Regional Water Supply Plan FY 15‒16 N/A Begin Preparation of draft plan (The District is developing a Water Supply Plan for Region #2 that includes North Lake and Marion Counties.) Silver Springs/ Silver River and Lower Ocklawaha River Prevention / Recovery (P/R) Strategy Milestones/Deliverables FY 16‒17 FY 14‒15 Completion of draft plan FY 17‒18 FY 18‒19 N/A N/A Finalize the plan N/A Completion of the updated draft P/R strategy N/A N/A N/A Implement projects Implement projects Implement projects Implement projects Implement projects N/A Complete investigations Complete preliminary design Complete final design Project construction (Strategies for Silver Springs, Silver River and Lower Ocklawaha MFLs.) Implementing near-term Strategies (Identify potential near-term projects to help meet future water demand.) Ocklawaha Recharge Project / Alternative Water Supply Project (AWS) (Identify potential long-term projects to help meet future water demand.) Success Indicators: 1. Implement near-term strategies (e.g. water conservation, reuse and lower aquifer production) prior to MFL P/R strategy plan approval o Target: Offset impacts from groundwater withdrawals o Measure: Project related offsets (in million gallons per day [mgd]) Page 19 District Strategic Plan (FY 2015–FY 2019) North Florida Water To ensure sustainable water supplies and protection of groundwater-dependent natural systems in partnership with key stakeholders in the District’s north Florida region. (Realigned to Continuing Core Programs after FY 20162017.) Strategy North Florida-Southeast Georgia Regional Groundwater Flow Model (Develop the next generation regional-scale groundwater flow model for north Florida using the most appropriate science.) North Florida Regional Water Supply Plan (The District and Suwannee River Water Management District are collaborating to develop a water supply plan for a region that includes 14 counties.) North Florida Water Resource Development Project (Identify potential projects to help meet future water demand.) Clay-Putnam Lakes Prevention/Recovery Strategy (Clay and Putnam counties) FY 14‒15 Complete initial calibration and predictive scenarios Complete water resources assessment and compile project options Determine potential concepts and partners and begin investigation(s) N/A Milestones/Deliverables FY 15‒16 FY 16‒17 Perform updates Continued to the steady-state development of model data sets for the transient model Develop data sets for the transient model Complete draft Provide draft plan plan for Public review Continue investigations Initiate selected projects identified in strategy Formulate strategies and determine current benefits and partners for implementation of future projects Initiate selected projects identified in strategy FY 17‒18 FY 18‒19 Activities transferred to other Strategic Priorities Activities transferred to other Strategic Priorities Activities transferred to other Strategic Priorities Activities transferred to other Strategic Priorities (Strategy for the lakes Geneva, Brooklyn and Cowpen MFLs.) Page 20 District Strategic Plan (FY 2015–FY 2019) North Florida Water (continued) Success Indicators: 1. Develop a new regional groundwater model for use by the District and Suwannee River Water Management District (SRWMD) for evaluating future water use demands in both planning and permitting o Target: Replacement of existing models with this new model o Measure: Percent complete 2. Complete a draft District-SRWMD jointly developed regional water supply plan for the area encompassed by the North Florida Regional Water Supply Partnership (NFRWSP) o Target: Submittal of methods, results and draft document by the District and SRWMD for external review o Measure: Percent complete Discussion and review by external stakeholders (i.e., NFRWSP Stakeholder Advisory Committee and North Florida Utility Coordination Group) Page 21 District Strategic Plan (FY 2015–FY 2019) Central Florida Water Work in partnership with Central Florida Water Initiative (CFWI) stakeholders to identify and further develop the Regional Water Supply Plan (RWSP) projects to meet existing and future water demands within the central Florida area while sustaining water resources and related natural systems. (Realigned to Continuing Core Programs after FY 20162017.) Strategy Taylor Creek Reservoir (TCR) Improvement Project (A project to change the current reservoir operating schedule and corresponding water levels. Raising the water level would increase the water supply yield from the reservoir.) CFWI Solutions Strategies Plan (This plan will be incorporated into the CFWI Regional Water Supply Plan. The plan will provide relevant project information to further develop specific water supply projects through partnerships with water users.) CFWI Water Resource development projects (CFWI draft plan calls for water management districts to continue water resource development in CFWI in addition to ongoing TCR and C-1 projects. Primary focus is aquifer recharge for MFLs prevention/recovery, operational aquifer storage and recovery, and pilot demonstration projects to implement potable reuse.) FY 14‒15 Complete 30% detailed design of levee improvements Preparation of draft plan N/A Milestones/Deliverables FY 15‒16 FY 16‒17 Complete detailed Continue design of levee construction improvements Begin construction Completion of draft plan (November 2015) Feasibility investigation and design of projects FY 17‒18 FY 18‒19 Activities transferred to other Strategic Priorities N/A Activities transferred to other Strategic Priorities Feasibility investigation and design of projects Activities transferred to other Strategic Priorities Build cooperative projects with partners Page 22 District Strategic Plan (FY 2015–FY 2019) Central Florida Water (continued) Success Indicators: 1. Completion of the jointly developed CFWI Solutions Strategies Plan o Target: Approval of plan by the District Governing Board o Measure Percent complete 2. Develop and implement projects to meet future water demands in central Florida o Target: Continued advancement of projects in partnership with SFWMD, SWFWMD and CFWI water users o Measure: Number of projects Percent complete of design/construction Water made available (million gallons per day [mgd]) 3. Implement water conservation strategies to improve water use efficiencies o Target: Public water supply — Decrease in residential per capita water usage o Measure: Annual residential water usage per capita SFWMD = South Florida Water Management District SWFWMD = Southwest Florida Water Management District Page 23 District Strategic Plan (FY 2015–FY 2019) Water Conservation Develop and implement water conservation practices and projects in a cooperative manner with key stakeholders for all water user categories. (Concludes after FY 20162017.) Strategy Water Conservation (Develop and implement water conservation practices and projects in a cooperative manner with key stakeholders for all water user categories.) FY 14‒15 Formulation of team and team charter FY 15‒16 Inventory and analysis of current District efforts, along with potential new opportunities Institute mechanism for coordinated implementation of District efforts Milestones/Deliverables FY 16‒17 Strategy report with recommendations on current and new District conservation efforts Begin implementation of strategy (revise/continue/discontinue current conservation efforts and begin new efforts) FY 17‒18 FY 18‒19 Strategic Priority concludes Success Indicators: To be developed. Page 24 District Strategic Plan (FY 2015–FY 2019) Sea Level Rise Investigate water supply implications, estuarine water quality and coastal wetlands impacts associated with sea level rise. (Concludes after FY20172018.) Strategy Sea Level Rise Impact Assessment FY 14‒15 Formulation of team and team chair Milestones/Deliverables FY 15‒16 FY 16‒17 FY 17‒18 Inventory and Inventory and Strategy report analysis of current analysis of current with District efforts District efforts recommendation FY 18‒19 Strategic Priority concludes Success Indicators: To be developed. Page 25 District Strategic Plan (FY 2015–FY 2019) Middle and Lower St. Johns River Protect the water quality and ecological value of the middle and lower St. Johns River through science-based planning and prioritized implementation of nutrient and other pollution reduction projects by leveraging District, local, state and federal resources. (Realigned to Continuing Core Programs after FY 20152016.) Strategy Tri-county Agricultural Area Water Management Partnership (Assisting farmers and growers in Flagler, Putnam and St. Johns counties in the Lower St. Johns River Basin in the implementation of projects that contribute to improving the health of the St. Johns River and conserving groundwater resources.) Nutrient Loadings Reduction (Assessments and projects to reduce nutrient inputs to the middle and lower St. Johns River from major contributing tributaries and watershed areas.) FY 14‒15 Implement the cost-share program for new best management practices (BMPs) on additional acreage Lake George gizzard shad harvest Assessment, engineering and design on other cost-effective nutrient reduction Milestones/Deliverables FY 15‒16 FY 16‒17 FY 17‒18 FY 18‒19 Implement the cost-share program for new Activities transferred to other Strategic Priorities BMPs on additional acreage Lake George gizzard shad harvest Activities transferred to other Strategic Priorities Assessment, engineering and design on other cost-effective nutrient reduction Page 26 District Strategic Plan (FY 2015–FY 2019) Middle and Lower St. Johns River (continued) Success Indicators: 1. Reduced frequency, duration and densities of harmful algal blooms in freshwater sections o Target: Does not exceed 40 mg/L for more than 40 days per year o Measure: Chlorophyll–a concentrations 2. Obtain and/or maintain the following established surface water quality standards: Dissolved oxygen (DO) level that supports healthy fish communities in the lower St. Johns River o Target: Achieve the lower St. Johns River site-specific alternative criteria (SSAC) o Measure: Continuous DO Reduced total phosphorous (TP) concentrations in Lake Harney and Lake Monroe and the river in between so that annual average concentrations do not exceed 0.070 mg/l. o Target: Annual average does not exceed 0.070 mg/L o Measure: TP concentrations 3. Implement cost-effective nutrient loading reduction projects o Target: Cost-effective nutrient reduction projects o Measure: For each new project, estimated load reductions and total life cycle cost Page 27 District Strategic Plan (FY 2015–FY 2019) Northern Coastal Basins Enhance and protect the water quality and ecological habitat of the coastal basins of northeast Florida by leveraging District resources and developing cooperative working partnerships with federal, state, local and other stakeholders. (Realigned to Continuing Core Programs after FY 20152016.) Strategy Estuarine Habitat Rehabilitation (Implement priority habitat restoration and enhancement projects, including saltmarsh, mangrove and oyster restoration.) Watershed Management Plan (Develop watershed management plan, including water quality and habitat restoration components, as well as data needs assessment and recommendations.) Shoreline Program (Develop, receive endorsement and partner with local stakeholders to implement a shoreline stabilization and management program.) FY 14‒15 Construct Phase 6 North Peninsula State Park saltmarsh restoration (to the extent of grant funding availability) Implement enhanced data gathering Complete year 1 of shoreline program Milestones/Deliverables FY 15‒16 FY 16‒17 FY 17‒18 FY 18‒19 Complete construction associated with 2013 NOAA Activities transferred to other Strategic Priorities Coastal Habitat Restoration Grant Complete plan Activities transferred to other Strategic Priorities Complete year 2 of shoreline program Activities transferred to other Strategic Priorities Prepare evaluation report of living shorelines and techniques Page 28 District Strategic Plan (FY 2015–FY 2019) Northern Coastal Basins (continued) Success Indicators: 1. Complete and implement Watershed Management Plan o Target: Complete plan by end of FY 2015‒2016 o Measure: Percent complete of plan 2. Obtain local government endorsement of shoreline program and projects o Target: Local government endorsement of shoreline and other cost-share projects o Measure: Number of cost-share projects and local dollars matched Page 29 District Strategic Plan (FY 2015–FY 2019) Apopka/Upper Ocklawaha Basins Restore the ecological, recreational and economic value of Lake Apopka and the Upper Ocklawaha River Basin by reducing nutrient levels and refining lake level management consistent with flood protection priorities. (Realigned to Continuing Core Programs after FY 20152016.) Strategy Lake Level Management (Develop lake level regimes that, when practicable, avoid extreme low water levels and maintain higher on average conditions with priority for maintaining flood protection and protecting ecological systems.) Water Quality and Restoration Projects (Utilize legislative appropriations for projects that include innovative technologies for water quality improvement, habitat restoration to improve water clarity and recreational fisheries, and focused nutrient-enriched sediment removal.) Emeralda Marsh Area 3 Reconnection (Reconnection of 500 acres of restored wetlands to Lake Griffin by lowering levees or breaching levees.) Lake Apopka North Shore (LANS) (Infrastructure improvements to bring additional water into the LANS to improve storage in the basin.) FY 14‒15 Evaluate flood impacts Begin construction of selected projects Reconnection design and permitting Construct gated inflow at lake level canal FY 15‒16 Implement regulation schedules Milestones/Deliverables FY 16‒17 Continue project monitoring Reconnect Area 3 pending monitoring results Repair weir, upgrade pumps and ancillary improvements FY 17‒18 FY 18‒19 Activities transferred to other Strategic Priorities Activities transferred to other Strategic Priorities Activities transferred to other Strategic Priorities Activities transferred to other Strategic Priorities Success Indicators: 1. Long-term water quality trends referenced by the Basin Management Action Plan o Target: Meet the target concentrations established total maximum daily loads for total phosphorous (TP) o Measure: Five-year running average based on data collection and loading estimates 2. Implementation of revised lake level management strategies o Target: Evaluate the potential for higher on average lake levels o Measure: Percent complete in the implementation of regulation schedules (approximately 10 percent) Page 30 District Strategic Plan (FY 2015–FY 2019) Upper St. Johns River To develop and implement integrated strategies and protocols that optimize flood control, protect and enhance natural ecosystems, improve water quality and provide for water supply for the upper St. Johns River. (Realigned to Continuing Core Programs after FY 20162017.) Strategy Fellsmere Water Management Area (FWMA) (FWMA will add an additional 10,000 acres of restored wetlands to the headwaters of the St. Johns River.) Environmental Water Control Plan (This plan establishes the operational protocols to meet environmental criteria for the Upper St. Johns River Basin.) St. Johns Marsh Conservation Area (SJMCA) Hydrologic Restoration (Structural and/or internal improvements designed to improve the hydrology of the SJMCA [23,200 acres] thereby reducing over drainage of the organic soils.) Milestones/Deliverables FY 16‒17 N/A FY 14‒15 Continue construction of project features FY 15‒16 Complete construction of priority features Complete plan revisions N/A N/A Complete construction of two C-40 canal plugs and repair of E-7 plug as part of interim plan Two-dimensional model and final plan development Implementation of final restoration plan FY 17‒18 FY 18‒19 Activities transferred to other Strategic Priorities Activities transferred to other Strategic Priorities Activities transferred to other Strategic Priorities Success Indicators: 1. Complete construction of FWMA and SJMCA improvements o Target: Operation of completed Upper St. Johns River Basin (USJRB) project o Measure: Percent complete of construction of remaining project features 2. Complete revisions to the Environmental Water Control Plan o Target: Incorporate the revised Environmental Water Control Plan into the U.S. Army Corps of Engineers’ Final Water Control Manual for the USJRB project o Measure: Percent complete of the revised Environmental Water Control Plan Page 31 District Strategic Plan (FY 2015–FY 2019) Indian River Lagoon Protection Protect and restore the water quality and ecological habitat of the Indian River Lagoon by leveraging District resources and working with the National Estuary Program and its partners. (Realigned to Continuing Core Programs after FY 20172018.) Strategy Algal Bloom Investigation (An enhanced scientific effort to gain a deeper understanding of the lagoon’s nutrient dynamics and to enhance predictive modeling capabilities for improved management techniques.) Wheeler Stormwater Park (A regional 30-acre stormwater treatment park to remove nutrients and sediments from the Sottile Canal prior to discharge into the St. Sebastian River and the lagoon.) C-10 Reservoir (C-1 Rediversion, Phase 2) (Upgrading the pumping capacity of the C-1 Rediversion pump stations to divert additional storm water from the lagoon to the St. Johns River.) Eau Gallie River Dredging (Removing approximately 625,000 cubic yards of muck from the Eau Gallie River main stem and Elbow Creek.) FY 17‒18 Complete investigation Complete phase 1 expansion N/A N/A Finalize design Construction 50% complete Complete construction FY 15‒16 Complete year 2 investigation Complete weir construction Complete phase 2 pond Submit permit applications (A 1,500-acre reservoir that will receive untreated storm water from the Melbourne Tillman canal system, provide treatment and redivert the water back to its historical watershed, the St. Johns River.) Sawgrass Lake Pump Station Upgrades Milestones/Deliverables FY 16‒17 Complete year 3 investigation FY 14‒15 Complete year 1 investigation Initiate construction Complete construction N/A N/A N/A Begin design and permitting Complete design Initiate dredging Complete dredging FY 18‒19 Activities transferred to other Strategic Priorities Begin construction Page 32 District Strategic Plan (FY 2015–FY 2019) Indian River Lagoon Protection (continued) Success Indicators: 1. Enhanced science and understanding o Target: Algal bloom investigation complete by end of FY 2016‒2017 o Measure: Percent complete of investigation 2. Improve nutrient reduction to Indian River Lagoon o Target: Increase rediversion from the lagoon to the St. Johns River through construction of Sawgrass Lake pump upgrades and C-10 Reservoir o Measures: Total annual re-directed flow volume and the percentage of redirected basin flow Page 33 District Strategic Plan (FY 2015–FY 2019) Springs Protection Utilize District resources to develop and coordinate the protection and restoration of major springs. (Realigned to Continuing Core Programs after FY 20162017.) Strategy Springs Protection Initiative Science (A multi-disciplinary approach that includes a combination of monitoring, modeling and scientific investigations is necessary to fully address the decline of springs in terms of flow rates and water quality.) Springs Protection Initiative CostShare Projects (Includes a sum of the cost-share funding to be solicited by outside entities to provide funding for projects that support the goals and objectives of the Springs Protection Initiative.) FY 14‒15 Continue and initiate experimental research elements Solicit cooperators Combine with DEP funds Contract development and management Milestones/Deliverables FY 15‒16 FY 16‒17 Continue Continue experimental experimental research elements research and reporting Initiate identification of Continue cost-effective, identification of science-based cost-effective, restoration science-based projects restoration projects Solicit cooperators Solicit cooperators Combine with DEP funds Combine with DEP funds Contract development and management Contract development and management FY 17‒18 FY 18‒19 Activities transferred to other Strategic Priorities Activities transferred to other Strategic Priorities DEP = Florida Department of Environmental Protection Page 34 District Strategic Plan (FY 2015–FY 2019) Springs Protection (continued) Success Indicators: 1. Achieve sufficient scientific understanding to direct cost-effective, long-term solutions for restoration of major springs o Target: Execute science work plan in budget and on schedule o Measure: Percent of budget expended; percent of projects complete 2. Actively improve water quality and quantity in major springs via leveraging of District financial resources o Target: Continued, aggressive cost-share project improvements in partnership with local governments and utilities o Measure: Number of projects Money invested (District and collectively) Nitrogen reduction achieved Groundwater offset/increase achieved Page 35 District Strategic Plan (FY 2015–FY 2019) Flood Protection Develop a System-wide Improvement Framework (SWIF) for levee and water control structure maintenance and restoration, and leverage the SWIF to institute standardized levee and water control structure operations, maintenance and inspection protocols. (Realigned to Continuing Core Programs after FY 20152016.) Strategy System-Wide Improvement Framework (SWIF) FY 14‒15 SWIF development FY 15‒16 SWIF submitted and approved by USACE Rehabilitation on S-96 and S-96B Rehabilitation on S-164 gates and concrete (To remedy system deficiencies identified by U.S. Army Corps of Engineers [USACE] inspections of levees.) Flood Protection Levee and Structure Maintenance (The District operates and maintains 103 miles of federal flood protection levees and water control structures. The District repairs and rehabilitates the levees and water control structures on a scheduled basis for the purpose of maintaining a safe flood control system.) Routine and Prescriptive Inspection and Maintenance Protocols (The District inspects and performs preventive maintenance on all of its flood control systems. The District is working on improving the inspection and preventive maintenance by developing improved inspection and maintenance protocols.) Complete phase 1 of levee restoration Complete phase 2 of levee restoration Update or create technology tools N/A Milestones/Deliverables FY 16‒17 FY 17‒18 FY 18‒19 Activities transferred to other Strategic Priorities Activities transferred to other Strategic Priorities Activities transferred to other Strategic Priorities Success Indicators: 1. Federal flood protection infrastructure meets USACE acceptable standards o Target: USACE rating of “minimally acceptable” (or better) within five-year SWIF implementation period o Measure: Routine inspection reports indicate continued progress on correcting deficient items 2. Flood protection levees and water control structures provide level of service as designed o Target: Federal levee cross-sections are restored and major water control structures are rehabilitated to as-built condition or better, and placed into routine inspection and maintenance cycles o Measure: Completion of restoration of the levee segments and rehabilitation of the water control structures as identified in the project plans Page 36 District Strategic Plan (FY 2015–FY 2019) Land Management Enhancement To identify and implement restoration and vegetation management projects on District-owned lands to enhance long-term ecologic and hydrologic conditions. (Concludes after FY 20162017.) Strategy Develop Geographic Information System (GIS) Technology and Spatially Linked Abilities (Enhance technology to manage restoration and invasive plant management activities focused on Carolina willow and old world climbing fern.) Survey, Identify and Prescribe Treatments (Develop GIS database structure to facilitate the development of baseline assessments of invasive plant infestations, survey and monitoring of treatments, post treatment monitoring, and to provide a platform to perform analysis to plan vegetation management strategies.) Florida Department of Transportation (FDOT)-Funded Mitigation Projects (Implementation of regional mitigation projects on District lands that are funded by FDOT to compensate for adverse environmental impacts of transportation projects.) Planning Documents (District staff develop planning documents to prioritize and coordinate the treatment of Carolina Willow and other invasive plants.) FY 14‒15 Identify and develop survey methods and protocol Conduct surveys and treatments; compile and analyze data Milestones/Deliverables FY 15‒16 FY 16‒17 Develop treatment Develop planning data collection tools and protocol criteria and posttreatment monitoring protocol Conduct surveys Complete UAV and treatments; willow survey pilot compile and project analyze data Conduct surveys and treatments; compile and analyze data Identify, plan and direct implementation of FDOT-funded projects on District lands Prepare compendium on the treatment of Carolina willow and the restoration and enhancement of herbaceous marshes Prepare Carolina willow Management Plan FY 17‒18 FY 18‒19 Strategic Priority concludes Strategic Priority concludes Strategic Priority concludes Revise District Invasive Plant Management Plan Strategic Priority concludes Page 37 District Strategic Plan (FY 2015–FY 2019) Land Management Enhancement (continued) Success Indicators: 1. Improve GIS-based technology capabilities for identifying, managing and planning restoration and invasive plant management activities on District lands o Target: Identify, develop and implement use of spatially linked techniques for condition assessments, survey and monitoring efforts, data storage, evaluation and planning of restoration and invasive plant management projects o Measure: Percent complete of identified tasks 2. Restoration and invasive plant management survey and treatment o Target: Survey Upper St. Johns River Basin and Ocklawaha River Basin for presence and coverage of Carolina willow and old world climbing fern; treat a minimum of 7,000 acres per year of old world climbing fern; treat a minimum of 5,000 acres per year of Carolina willow o Measure: Percent of annual survey and treatment acres complete 3. Management plans o Target: o Measure: Develop plans that detail strategies for Carolina willow management and District invasive plant management activities to improve ecologic and hydrologic conditions Annual completion of identified documents, drafts and plans Page 38 District Strategic Plan (FY 2015–FY 2019) Agriculture Partnership Ensure that agricultural and District stakeholder needs are met in the shared goal of sustainable use and protection of water resources for the benefits of the people of the District and the state of Florida. Strategy Districtwide Agricultural Cost Share Program (Provide financial assistance to assure sustainability of agriculture within the District while engaging farmers in the shared goal of water conservation and nutrient reduction.) FY 14‒15 Roll out of the districtwide agricultural costshare program By Middle Lower St. Johns River Initiative Tri-County Agricultural Area (TCAA) Water Management Partnership N/A (Assisting farmers and growers in Flagler, Putnam and St. Johns counties in the Lower St. Johns River Basin in the implementation of projects that contribute to improving the health of the St. Johns River and conserving groundwater resources.) Districtwide Expansion of the Agricultural BMP Optimization Model (Financial assistance is necessary to assist farmers and growers sustain agricultural production and water quality and conservation goals. The BMP Optimization Model will provide resource managers a decision tool to evaluate cost-share applications and assure cost effectiveness.) N/A Milestones/Deliverables FY 15‒16 FY 16‒17 FY 17‒18 Develop program Solicit applications Solicit applications for districtwide Ag and select projects and select projects Cost Share for funding for funding Solicit applications and select projects for funding Develop and manage contract Implement the cost-share program for new best management practices (BMPs) on additional acreage Enhance the existing agriculture BMP optimization model for TCAA to be used to evaluate BMP cost and nutrient reduction effectiveness FY 18‒19 Solicit applications and select projects for funding Develop and manage contracts Develop and manage contracts Develop and manage contracts Implement the cost-share program for new BMPs on additional acreage Implement the cost-share program for new BMPs on additional acreage Implement the cost-share program for new BMPs on additional acreage Districtwide expansion of agricultural BMP optimization model to include Marion County Districtwide expansion of agricultural BMP optimization model to include remaining 14 counties Apply the agricultural BMP optimization model to evaluate BMP cost and nutrient reduction effectiveness associated with the districtwide Ag cost-share program Page 39 District Strategic Plan (FY 2015–FY 2019) Agriculture Partnership (continued) Success Indicator: 1. Agriculture Advisory Committee o Target: Increase communication between agricultural industry and the District o Measure: Number of meetings held and presentation of minutes to the Governing Board 2. Agricultural Assistance o Target: Provide assistance to the agricultural community for CUP and ERP permitting and exemption determination o Measure: Number of agricultural assistance activities documented in E-Reg 3. Outreach to Agricultural Producers o Target: Increase visibility of District as a partner to the agricultural community o Measure: Number of speaking engagements and collaborative meetings attended 4. Implement cost-effective water conservation and nutrient loading reduction projects o Target: Cost-effective water conservation and nutrient reduction projects o Measure: For each new project, estimated load reductions and water savings per total life cycle cost Page 40 District Strategic Plan (FY 2015–FY 2019) Cost-share The implementation of a coordinated and focused program to leverage District funds by engaging partners in sharing the expense of cost-effective water management projects. Includes annual cost-share funding solicitation and implementation of legislatively funded cooperative projects. Strategy FY 14‒15 Continue cost-share funding program (The implementation of a coordinated and focused program to leverage District funds by engaging partners in sharing the expense of cost-effective water management projects, including alternative water supply, water quality improvements and water conservation. Includes annual cost-share funding solicitation and implementation of legislatively funded cooperative projects,) Success Indicator: 1. Cost-share funding o Target: o Measure: Milestones/Deliverables FY 16‒17 FY 17‒18 Ongoing (Annual project solicitation and ranking process) FY 15‒16 FY 18‒19 Provide cost-effective funding for projects that will result in water conservation, alternative water supply development, water quality/nutrient-loading and water resource development Number of cost-share contracts approved by the Governing Board Dollars per pound of nutrient removal Dollars per million gallons per day (mgd) of water supply developed Page 41 District Strategic Plan (FY 2015–FY 2019) Outreach The communication of District projects, issues and activities; technical assistance and support; and relationship development with external stakeholders. Includes federal, state and local elected officials and their staffs; news media, professional and community groups, special interest groups and the general public. Strategy Public Communications (Proactively communicate and distribute information about District issues, programs and projects to the media, public and stakeholders.) Intergovernmental and Support (Provide water resource information and support to federal, state and local elected officials and their staffs.) Technical Assistance (Provide technical assistance to local governments, regional planning councils and state agencies.) Milestones/Deliverables FY 14‒15 FY 15‒16 FY 16‒17 FY 17‒18 FY 18‒19 Disseminate accurate and timely information through website, news releases, newsletter, social media and other appropriate methods Provide information and support on water resource issues and District programs and projects through meetings, presentations, tours and other appropriate methods Provide technical assistance through review of comprehensive plans, developments of regional impact and proposed federally funded projects/studies Success Indicators: 1. Public communications o Target: Meet or exceed public communications contacts from previous fiscal year o Measure: Number of contacts completed compared to previous fiscal year 2. Intergovernmental and support o Target: Meet or exceed governmental contacts from previous fiscal year o Measure: Number of federal, state and local government contacts completed compared to previous fiscal year 3. Technical assistance o Target: o Measure: Complete all reviews and requests for technical support by the required deadline Percentage completed by the required deadline Page 42 District Strategic Plan (FY 2015–FY 2019) Water Resources Data Systems The planning, design, construction, maintenance, collection and processing of water resources data. Includes hydrologic, hydrogeologic, water quality, water quantity and biological data networks established for long-term monitoring of water resources. Strategy Database/Telemetry Network (The District operates and maintains more than 1,100 telemetry monitoring stations [including new water quality stations]. Obtaining data via telemetry delivers more value and is cost-effective relative to costs for ongoing maintenance and repair.) Biological Monitoring (District staff complete toxicity tests and biological surveys to ascertain the health of aquatic communities.) Well Construction Milestones/Deliverables FY 14‒15 FY 15‒16 FY 16‒17 FY 17‒18 FY 18‒19 Convert 60 radio Convert up to 60 radio telemetry sites to cellular telemetry telemetry sites to cellular telemetry; convert 15 MOSCAD systems to Campbell Scientific Monitor 20 monthly and 60 seasonal seagrass transects; collect toxicity samples for all reported/observed algal blooms Construct two Lower Floridan aquifer monitoring wells per year (The District constructs wells for exploratory testing of water quality.) Water Quality Monitoring Collect 5,500 surface water and groundwater samples for delivery to laboratory (The District’s water quality monitoring network is comprised of approximately 420 long-term sampling stations located on rivers, streams and lakes and 400 wells throughout the District’s service area. Stations are sampled for a variety of analytes, including nutrients, major ions and physical measurements.) Hydrologic Monitoring Collect hydrologic data from all District stations with less than 1 percent missing archival data (The District operates and maintains more than 2,000 monitoring stations and processes data from more than 350 additional sites. More than 8 million measurements are collected, verified, processed and stored each year.) Laboratory/Sample Analyses Analyze 5,500 samples for approximately 200,000 analytes and store in final databases (The District’s laboratory analyzes ambient samples. Results from 200,000 analytes are stored at the District in a dedicated database and are also uploaded to the U.S. Environmental Protection Agency’s national Storage and Retrieval [STORET] database.) Page 43 District Strategic Plan (FY 2015–FY 2019) Water Resources Data Systems (continued) Success Indicators: 1. Well construction o Target: o Measure: Expansion of the Lower Floridan aquifer monitoring network Number of new Lower Floridan aquifer wells 2. Water quality monitoring o Target: 75 percent of samples analyzed, uploaded and approved by analyst within 50 percent of hold time after sample login o Measure: Percentage of samples approved by analyst within 50 percent of hold time after sample login Page 44 District Strategic Plan (FY 2015–FY 2019) Water Resources Assessments The analysis and review of data to assess the condition of water resources and the effectiveness of water management and restoration programs. Includes hydrologic conditions reporting, surface and groundwater assessments, status and trends assessments and participation in the statewide sea level rise and climate change task force. Strategy Milestones/Deliverables FY 15‒16 FY 16‒17 FY 17‒18 FY 18‒19 Annual water resources status and trends reports Annual water quality assessments for DEP basin management action plans and total maximum daily loads updates Indian River Indian River Indian River Indian River Indian River Lagoon seagrass Lagoon drift algae Lagoon seagrass Lagoon drift algae Lagoon seagrass assessment assessment assessment assessment assessment Complete EastComplete Central N/A N/A Complete Water Central Florida Springs Model Supply Impact Transient Model Study water Complete North quality model Florida / enhancements Southeast Georgia Model FY 14‒15 Water Resource Assessments (Analyses and assessments of ecology, groundwater, surface water and minimum flows and levels within the District, including the upper, lower and middle St. Johns River basins, Lake Apopka, Upper Ocklawaha, Orange Creek, Indian River Lagoon and Northern Coastal basins.) Success Indicators: 1. Status and trends o Target: o Measure: 2. Regional modeling o Target: o Measure: Determine the status and trends of District water quality and environmental data Annual reports Determine water use and water demand effects on the groundwaters of east-central Florida Fully calibrated and operating East-Central Florida Transient Groundwater Model Page 45 District Strategic Plan (FY 2015–FY 2019) Water Supply Planning and Project Implementation Develop and implement technically sound, science-based solutions to ensure the availability of sufficient water for existing and future reasonable-beneficial uses and natural systems in coordination with key stakeholders and partners. Identification of Water Supply Planning Regions The five water supply planning regions (shown in Figure 2) together encompass the entire District, and the District is currently, or will be, conducting water supply planning in each of these regions. As part of each regional water supply plan, the District intends to include an update to the applicable portion of its most recent districtwide water supply assessment. The results of the updated assessment will determine the extent of planning conducted in a particular planning region. Each plan, including the relevant updated assessment, will be updated every five years. Planning will also be supported by an annually updated districtwide baseline estimate of population and water use for the next 20 years. Figure 2. Water Supply Planning Regions Page 46 District Strategic Plan (FY 2015–FY 2019) Water Supply Planning and Project Implementation (continued) Strategy FY 14‒15 Regional Water Supply Plans N/A (The District’s water supply planning approach is comprised of five regional plans that will be updated as needed – at a minimum of once every five years. Plans identify future water supply needs for at least a 20-year planning horizon, and programs and projects to ensure sustainable supplies.) Implementation of water resource development projects N/A Milestones/Deliverables FY 15‒16 FY 16‒17 FY 17‒18 Region 4 (Brevard, Region 1 ― North Region 4 plan Indian River and Florida and Region completed Okeechobee 2 ― North Central counties) planning Florida plans effort under way completed Implementation of projects Region 5 (Volusia County) plan under way Implementation of projects Implementation of projects FY 18‒19 Region 5 (Volusia County) plan completed Region 3 ― Central Florida Water Initiative plan ― initiate five-year update Implementation of projects Success Indicator: To be developed. Page 47 District Strategic Plan (FY 2015–FY 2019) Regulatory Services The implementation of District rules to issue permits for consumptive use of water and land development affecting environmental resources. Includes compliance and monitoring activities and implementation of a water shortage program. Strategy Consumptive Use Permitting (The District authorizes water use through the issuance of consumptive use permits [CUPs].) Environmental Resource Permitting (The District authorizes new development or construction activities through the issuance of environmental resource permits [ERPs].) FY 14‒15 Consumptive Use Permitting Consistency (CUPcon) Implementation CUPcon Phase II rulemaking State Wide Environmental Resource Permitting (SWERP) Phase II implementation FY 15‒16 CUPcon Phase II Implementation UMAM implementation Milestones/Deliverables FY 16‒17 N/A FY 17‒18 N/A FY 18‒19 N/A N/A N/A N/A Uniform Mitigation Assessment Methodology (UMAM) rulemaking Compliance and Enforcement Activities This strategy has continuous/ongoing milestones/deliverables (District permits are issued with conditions that must be followed, including compliance inspections.) Agricultural Assistance Team This strategy has continuous/ongoing milestones/deliverables (The District formed the Agricultural Assistance Team in March 2011 to streamline the permitting process and enhance assistance provided to the agricultural community.) Page 48 District Strategic Plan (FY 2015–FY 2019) Regulatory Services (continued) Success Indicators: 1. Efficiency o Target: o Measure: Promote the submittal of permit applications using e-permitting Maintain an online submittal rate exceeding 80 percent for all permit types 2. Efficiency o Target: o Measure: Process ERP applications in an efficient manner Issue ERP with a median of 30 days or less (receipt to issuance) 3. Efficiency o Target: o Measure: Process CUP applications in an efficient manner Issue CUP with a median of 36 days or less (receipt to issuance) 4. Efficiency o Target: o Measure: Conduct compliance site inspections in an efficient manner Conduct 3,500 site inspections or more per year 5. Efficiency o Target: o Measure: Provide efficient agricultural assistance to permittees Provide assistance to 100 permittees or more per year Page 49 District Strategic Plan (FY 2015–FY 2019) Surface Water Projects Design, construction, operation and maintenance of surface water projects that improve water supply and/or water quality. Strategy Surface Water Project Implementation FY 14‒15 N/A FY 15‒16 N/A Milestones/Deliverables FY 16‒17 N/A FY 17‒18 N/A FY 18‒19 To be identified in future plans Success Indicator: To be developed. Page 50 District Strategic Plan (FY 2015–FY 2019) Public Works The operation and maintenance of District physical assets. Includes levees, canals, water control structures, navigation structures and roads on District-owned lands. Strategy FY 14‒15 Operation and Maintenance Milestones/Deliverables FY 15‒16 FY 16‒17 FY 17‒18 Continue operation and maintenance activities FY 18‒19 (Complete project operations and maintenance as directed in the Bureau of Public Works’ work plan.) Structure Maintenance N/A N/A N/A N/A (The District repairs and rehabilitates water control structures on a scheduled basis for the purpose of maintaining a safe flood control system.) Levee Maintenance (The District operates and maintains 103 miles of federal flood protection levees and water control structures. The District repairs and rehabilitates the levees on a scheduled basis for the purpose of maintaining a safe flood control system.) Rehabilitation on S-96A and S-96C gates and Moss Bluff Dam Complete phase 3 of levee restoration Rehabilitation on S-96B concrete Complete phase 4 of levee restoration Rehabilitation on S-96C concrete N/A Success Indicator: 1. Operation and maintenance activities o Target: Identify and complete operation and maintenance activities for District physical assets on a fiscal year basis o Measure: Completed operation and maintenance activities each fiscal year 2. Flood protection levees and water control structures provide level of service as designed o Target: Federal levee cross-sections are restored and major water control structures are rehabilitated to as-built condition or better, and placed into routine inspection and maintenance cycles o Measure: Completion of restoration of the levee segments and rehabilitation of the water control structures as identified in the project plans Page 51 District Strategic Plan (FY 2015–FY 2019) Land Resources The maintenance of District-owned lands. Includes real estate services, fire management, public use and recreation, invasive species management, restoration and security. Strategy Lake Apopka Habitat and Access Improvements (Dredging to improve boating access, dock improvements, parking, restrooms and basic facilities for public use.) Access to District Lands (Six projects have been identified to provide increased public access to District lands.) FY 14‒15 Complete wildlife drive improvements Install picnic pavilions at Moses Creek, Orange Creek and Longleaf Flatwoods Construct two remaining picnic structures Land Management Activities (Primary management activities are invasive plant management and prescribed burns.) Conduct 52 prescribed burns completed on 11,000 acres Milestones/Deliverables FY 15‒16 FY 16‒17 FY 17‒18 Complete N/A N/A dredging and continue dock and facilities improvements Construct fishing N/A Construct fishing pier and boat pier and boat launch at the C-1 launch at the C-10 area and levee area of Three crossing in the Forks Three Forks Conservation Area Conservation Area in Brevard County FY 18‒19 N/A N/A Construct a culvert access to Area VII of the Emeralda Marsh Conservation Area Conduct ongoing invasive plant management Conduct ongoing prescribed burns Treat 4,000 acres of invasive plants Operation and Maintenance Continue operation and maintenance activities (Contracted services for mowing, aerial application on invasive plants, tree planting, security services and helicopter services for prescribed burns.) Page 52 District Strategic Plan (FY 2015–FY 2019) Land Resources (continued) Strategy FY 14‒15 Adaptive Management of Wetland Restoration Areas Milestones/Deliverables FY 15‒16 FY 16‒17 FY 17‒18 Continue adaptive management activities FY 18‒19 (Facilitating the application of science in the restoration process.) Success Indicators: 1. Land management o Target: Measure: Healthy managed ecosystems on District lands Percent of District property rated Level 1 or Level 2 (out of 4) on scale of Ecological Condition Class 2. Operation and maintenance activities o Target: Identify and complete operation and maintenance activities on District lands on a fiscal year basis o Measure: Completed operation and maintenance activities each fiscal year Cost per acre Page 53 District Strategic Plan (FY 2015–FY 2019) Administration The provision of administration and physical support. Includes financial and business systems, human resources, information technology, facilities, transportation and equipment and emergency management. Strategy Continuous Improvement (Ensure strategic priorities are aligned with the District’s vision; enable and empower the organization to drive continuous improvement.) FY 14‒15 Enable process optimization through expansion of the Six Sigma Green Belt process Improve resource allocation using project management software (Daptiv) Workforce Development (A workforce development plan was adopted in FY 2012‒2013.) Ongoing alignment enhancements and improvements Update workforce development plan FY 15‒16 Ongoing process optimization through Six Sigma Green Belt projects Milestones/Deliverables FY 16‒17 FY 17‒18 Ongoing process Ongoing process optimization optimization through through Six Sigma Green Six Sigma Green Belt projects Belt projects FY 18‒19 Ongoing process optimization through Six Sigma Green Belt projects Ongoing alignment enhancements and improvements Ongoing alignment enhancements and improvements Ongoing alignment enhancements and improvements Ongoing alignment enhancements and improvements N/A Update workforce development plan N/A N/A Page 54 District Strategic Plan (FY 2015–FY 2019) Administration (continued) Strategy FY 14‒15 FY 15‒16 Milestones/Deliverables FY 16‒17 FY 17‒18 FY 18‒19 Facilities Management (Maintenance and repair activities on District-owned office, warehouse and maintenance buildings.) Emergency Management (The District maintains an emergency management program in which staff coordinate emergency response efforts with local governments and state and federal agencies. In addition, staff handle recovery and mitigation efforts to return District facilities to normal operation after a disaster.) Continue administration activities Financial and Business Systems (Process accounting, budge, and procurement transactions and maintain records to demonstrate legal and regulatory compliance.) Innovative Technology Solutions (Innovative technology that improves the overall efficiency and effectiveness of the District’s programs.) Success Indicators: 1. Cost-effectiveness o Target: o Measure: Provide cost-effective and efficient support for the District’s programs Support services costs as a percentage of the District’s total costs 4. Continuous improvement o Target: Optimize District staff resource allocation and processes o Measure: Number of Green Belt projects identified and completed Percent implementation of the resource module in Daptiv Page 55 District Strategic Plan (FY 2015–FY 2019) II. Five-Year Strategic Budget The strategic budget reflects the five-year work plans developed by teams for each of the 15 initiative-related strategic priorities. The work plans identify specific projects for each initiative-related strategic priority. The projects are loaded into the District’s management and reporting tool to allow effective oversight. Projections for the continuing core programs-related strategic priorities are primarily a continuation of the level of effort included in the FY 2014‒2015 program budget adjusted for funding transfers of remaining efforts from concluded initiatives. A goal of the five-year strategic budget is to ensure adequate fiscal resources exist for the District to meet its core missions in a fiscally responsible manner. Fundamental to the District’s long-term fiscal health is the expectation that each fiscal period will be self-sustaining, with recurring revenues sufficient to fund recurring expenditures. This budgetary concept, which inhibits the use of “one time money” to fund operations, is referred to as “structural integrity.” The detailed work plans provide an effective means for staff to analyze the funding requirements and to evaluate potential revenue sources, including redistribution of fund balances to maintain a structurally balanced budget. Table 1 on the next page provides the funding requirements for each of the Strategic Priorities by year for the planning period; whereas Figure 3, on page 58, groups the funding requirements for each fiscal year by Initiative, the Cost-Share Continuing Core Program and the remaining Continuing Core Programs. Page 56 District Strategic Plan (FY 2015–FY 2019) Table 1. Five-Year Strategic Budget Detail Page 57 District Strategic Plan (FY 2015–FY 2019) Five-Year Strategic Budget (FY 2015FY 2019) $180 $160 $140 In Millions $120 $100 $80 $60 $40 $20 $FY 2014-2015 FY 2015-2016 Core Continuing Program FY 2016-2017 Cost-share FY 2017-2018 FY 2018-2019 Initiative Figure 3. Five-Year Strategic Budget Summary Page 58 District Strategic Plan (FY 2015–FY 2019) Financial Resources The District’s FY 2014‒2015 budget is structurally balanced. After identifying all known revenue sources for the five-year period (see Figure 4 below) and comparing with planned expenditures (see Strategic Budget Detail, Table 1, page 57), a funding a shortfall for FY 2015‒2016 through FY 2018‒ 2019 exists that will require additional funding from External Revenue Sources. Figure 5 summarizes the total amount for each revenue funding source for the total planning period. Five-Year Revenue Projections by Funding Source In Millions $180 $160 $140 $120 $100 $80 $60 $40 $20 $Amended FY 14-15 Projected FY 15-16 District Sources Projected FY 16-17 Use of Fund Balance Projected FY 17-18 Projected FY 18-19 External (Existing) Figure 4. Five-Year Revenue Projections by Funding Source Page 59 District Strategic Plan (FY 2015–FY 2019) Five-Year Revenue ― All Sources $109.6 District In Millions $70.3 Fund Balance $446.6 External (Existing) $139.8 External (Unappropriated) Total = $766.3 Million Figure 5. Five-Year Revenue All Sources Below are detailed descriptions of the funding sources. District Sources ― $446.6 million The District collects approximately $89 million per year in recurring revenues, used primarily to support its continuing core programs. As a matter of policy, the District limits recurring operating expenses to 90 percent of the recurring revenues, thereby creating approximately $8.9 million per year of cash flow to support the cost-share program. The District’s future revenue capacity is positive, with a current millage of 0.3164, which is below the statutory cap of 0.6 mil. The financial planning assumption for property tax revenues, the District’s largest revenue source, is based on the projected rolled-back rate. The rolled-back rate calculation, as defined in Florida Statutes, essentially provides the same tax revenue as the previous year plus tax revenue from new construction. The District is projecting continued positive state and local economic trends that will support sustainable local revenue growth. Page 60 District Strategic Plan (FY 2015–FY 2019) Fund Balance Fund balance is classified using a hierarchy based primarily on the extent to which a government is bound to observe constraints imposed on the use of the resources reported in governmental funds. Fund balance classifications, under Governmental Accounting Standards Board Statement 54 (GASB 54), are Nonspendable, Restricted, Committed, Assigned and Unassigned. These classifications reflect not only the nature of funds, but also provide clarity to the level of constraint placed upon fund balance. Fund balance can have different levels of constraint, such as external versus internal compliance requirements. In accordance with GASB 54, Fund Balance Reporting and Governmental Fund Type Definitions, the District classifies governmental fund balances as follows: Nonspendable Fund Balance ― Includes fund balance amounts that cannot be spent either because they are not in spendable form or because of legal or contractual requirements. Inventory assets and prepaid items are typical balances that are reported in this category. Spendable Fund Balance ― o Restricted ― Includes fund balance amounts that are constrained for specific purposes which are externally imposed by providers, such as creditors or amounts constrained due to constitutional provisions or enabling legislation. Debt service reserves, state of Florida Specialty Licenses Tag revenues, proceeds from the sale of capital assets originally purchased with state and/or federal grant funds and long-term maintenance mitigation endowment funds set aside to fund land management activities are typical balances that are reported in this category. o Committed ― Includes fund balance amounts that are constrained for specific purposes through Governing Board resolutions and can only deplete or change the commitments through a Governing Board resolution or an expenditure authorized by contract. Long-term projects/programs, long-term cooperative agreements, the District’s Economic Stabilization Reserve and Monetary Judgments Reserve are typical balances that are reported in this category. o Assigned ― Includes fund balance amounts that are intended to be used for specific purposes that are neither considered to be restricted nor committed. Fund Balance may be assigned through the following: Formal Budget Adoption Resolution and encumbrances/contractual obligations/grants to local governments/memorandums of understanding/agreement authorized by the District’s executive management that are not otherwise restricted or committed. o Unassigned ― Includes residual positive fund balance within the General Fund which has not been classified within the other above mentioned categories. Fund Balance Utilization ― $139.8 million The Governing Board has directed the spend-down of accumulated fund balances. As such, the District has “committed” through formal Governing Board action, $136 million of fund balance of which $118.5 million is available for use in direct support of strategic priorities between FY 2015 and FY 2019. The development of the Annual Strategic Plan provides an opportunity to review existing committed fund balances and reallocate according to changing priorities and other information not previously foreseen. Page 61 District Strategic Plan (FY 2015–FY 2019) Table 2 below demonstrates an achievable committed fund balance utilization or “spend-down” plan. Amendments to the committed fund balance are made as part of the Governing Board’s final budget adoption in September of each year. This year, as information becomes available between the April 2015 committed fund balance spend-down plan and the September 2015 Governing Board action, adjustments will be proposed. Table 2. Committed Fund Balance Five Year Utilization Schedule 9/30/14 Balance with Proposed Adjustments as of April 2015 $4,030,000 FY 2014-15 $0 FY 2015-16 $0 FY 2016-17 $0 FY 2017-18 $0 FY 2018-19 $0 Remaining Balance $4,030,000 $10,954,000 $0 $0 $0 $0 $0 $10,954,000 Potential adverse monetary judgments and legal fees $2,500,000 $0 $0 $0 $0 $0 $2,500,000 North Central Florida Water $5,139,318 $0 $500,000 $1,225,000 $2,349,943 $1,064,375 $0 North Florida Water Initiative $2,382,500 $2,382,500 $0 $0 $0 $0 $0 $839,184 $100,000 $739,184 $0 $0 $0 $0 $3,025,235 $2,308,556 $716,679 $0 $0 $0 $0 Committed Economic Stabilization Fund Future Major Structure Rehabilitation Central Florida Water Initiative Middle and Lower St. Johns River Water Quality Improvement Northern Coastal Basin $695,640 $0 $695,640 $0 $0 $0 $0 Lake Apopka and UORB Restoration and Lake Level Management Upper St. Johns River Basin Restoration $2,499,321 $1,097,127 $1,402,194 $0 $0 $0 $0 $13,927,381 $8,852,382 $1,675,000 $3,399,999 $0 $0 $0 Indian River Lagoon Protection $23,935,843 $6,098,700 $7,800,000 $6,350,000 $3,687,143 $0 $0 Springs Protection $3,235,673 $1,731,727 $1,503,946 $0 $0 $0 $0 Flood Protection – Levee/Structure Rehabilitation $4,661,392 $1,300,000 $3,361,392 $0 $0 $0 $0 Land Management Enhancement $4,446,098 $1,449,000 $1,500,000 $1,497,098 $0 $0 $0 $20,063,362 $14,782,605 $4,354,360 $275,000 $100,000 $551,397 $0 $5,700,000 $787,316 $3,500,000 $1,412,684 $0 $0 $0 Lower Floridan Monitoring Network $16,000,000 $2,570,974 $3,020,581 $2,445,263 $3,070,000 $4,893,182 $0 Public Works and Water Supply Projects $11,965,053 $0 $0 $800,000 $4,943,105 $6,221,948 $0 $136,000,000 $43,460,887 $30,768,976 $17,405,044 $14,150,191 $12,730,902 $17,484,000 Remaining Balance at Fiscal Year End $92,539,113 $61,770,137 $44,365,093 $30,214,902 $17,484,000 Cooperative Projects Funding Program Land Management / Acquisition Total In addition to the utilization of committed fund balance, the five-year plan includes using assigned ($0.8 million) and restricted ($20.4 million) fund balances for a total fund balance utilization of $139.8 million. Page 62 District Strategic Plan (FY 2015–FY 2019) External Revenue (Known) ― $70.3 million The District receives revenues from local, state and federal appropriations and grants. The FY 2015 budget includes approximately $36 million of such revenue. For FY 20162019, an additional $34.3 million in awarded/appropriated or recurring external revenues sources are included in the Five-Year Revenue Projections. Cumulatively, this $70.3 million represents available resources to fund District projects between FY 2015 and FY 2019. External Revenue (Unappropriated) ― $109.6 million The funding shortfall for FY 20152019 can be met by receipt of additional external revenue from local, state and federal sources. Staff evaluated expenditures to determine which ones would be suitable for partnership with state or federal grants. The five-year plan is built with the understanding that if these funds do not come to fruition, these projects will need to be reevaluated. Summary The District’s strategic planning process is ongoing and iterative. As soon as this plan is complete, a structured process of reviewing and adjusting the District’s strategic budgeting and project implementation will begin. The first year of this plan is for FY 20142015 and is structurally balanced. For future years in this plan, the District identified anticipated and needed projects. In some cases, projected project needs exceed planned and programmed funds leaving an anticipated deficit. The unfunded projects are lower priority than funded projects and the District actively investigates alternative funding sources to meet all of the projected needs. Alternative funding sources include nonrecurring sources such as state and federal cost-share programs, local government matches and grants. Uncertainty of project needs and funding sources increases through the planning horizon. The District uses this planning technique as a way to iteratively plan, fund and prioritize anticipated project needs. As alternative funding is identified, it is aligned with specific project needs. As the District enters the annual budgeting process, which requires a balanced budget, some project needs may be dropped, reduced in scope or planned further in the future. By planning this way, the District maintains an aggressive work plan that is flexible enough to align future alternative funding sources with planned project needs without having to re-plan and re-prioritize anticipated project work in mid-year. If funds are identified, the planned work is accomplished. If alternative funding cannot be found, the work plans will be appropriately adjusted. All of this takes place during the annual strategic planning process, the product of which is this strategic plan. Page 63 District Strategic Plan (FY 2015–FY 2019) Appendix A — Strategic Plan Annual Work Plan Report (FY 2013‒2014) The Strategic Plan Annual Work Plan Report for FY 20132014, a “report card” of how well the District achieved its FY 2013‒2014 milestones/deliverables and success indicators is available at floridaswater.com/ConsolidatedAnnualReport.pdf. Page 64

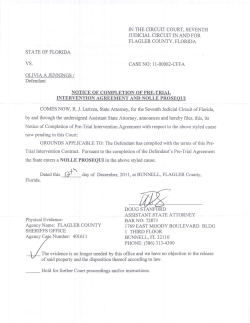
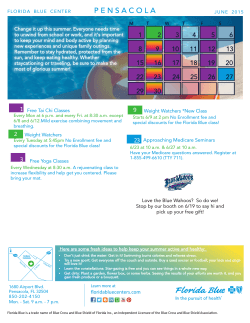
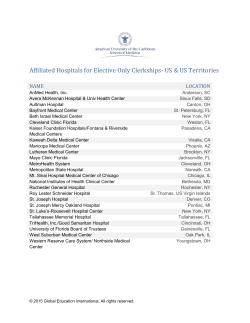

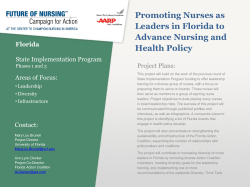
© Copyright 2026