
My Car, My Way Cars Online 12/13
Automotive the way we see it
My Car, My Way
Cars Online 12/13
Today’s consumers want it all: Industry-altering
technologies, green cars and alternative “ownership”
options, and truly responsive personalization.
Contents
Introduction 3
Executive Summary
4
Industry-alerting Technologies
7
Green Cars and Alternative “Ownership” Options 21
Truly Responsive Personalization
29
Conclusions and Recommendations
42
Connected cars: The transition from “extra” to “expected” will likely be rapid. “Google me” — Car shoppers go online first (and second and third).
Social media gains power (family and friends lose some).
Is it Spring in the auto industry? “Green” is growing. Interest in electric vehicles is up, but consumers’ perceptions are off. Is car sharing the next wave (or at least ripple) for drivers living in big cities? Dealers are still the center of the car buying experience — for better or worse! Communication counts, but only if it’s done right.
Celebrate! Loyalty is up for OEMs and dealers.
Service is a lot more than repair work.
2
8
15
18
22
24
26
30
35
37
39
Automotive the way we see it
Introduction
E
very year, Capgemini’s annual global
automotive study asks consumers what they
want in the car buying and ownership experience.
And every year, the survey respondents — this
year, more than 8,000 consumers from Brazil,
China, France, Germany, India, Russia, United
Kingdom, and the United States — say they want
more: more features and functions, more service
and convenience, more information and choice.
But what exactly does “more” mean in 2012?
That’s where the story gets interesting.
Cars Online 12/13 points to trends in
consumer attitudes and expectations which
suggest new opportunities for industry
stakeholders — automotive manufacturers and
dealers — to find the right balance for buyers who
want it all: the latest technologies, the newest
car type and “ownership” alternatives, and truly
responsive personalization.
In a typical scenario, today’s car shopper starts
on the Web; in fact, 94 percent of the surveyed
consumers do online research early in the car
buying process. That information gathering process
includes checking out the commentary on social
media sites: 71 percent of all respondents rated
user-generated content as “important” or “very
important” in their decision-making process (59
percent of those in mature markets and 83 percent
in developing markets). By the time buyers get to
a dealer’s showroom, they’re already well-informed
and that affects their expectations about everything
from dashboard technologies to bottom-line prices.
My Car, My Way
In interactions with Original Equipment
Manufacturers (OEMs) and dealers — virtual and
face-to-face, during every step of the buying
process — consumers want to be recognized for
what they are: individuals who have more choices
than ever; who want more features, more fuel
economy, and excellent vehicle performance; who
know they can easily change brands and dealers
to get “my car, my way.” It’s a great time to be a
car shopper!
While many of the findings in this report are
presented in aggregate, we discovered significant
differences among consumers in developing
markets versus those in mature markets. Because
the contrasts are both pervasive and critical to an
understanding of the overall data, we point them
out in most sections of the report.
Cars Online 12/13 is Capgemini’s 14th annual
survey. Each year, we are surprised by the vigor
in the industry, despite ongoing, global economic
challenges. The buying of a car is still a passionate,
personal pursuit — and today’s consumers are
eager to share their opinions on products and
experiences, on the high points and the low, on
what they love and what they hate. Our hope is
that OEMs and dealers can use the insights in
this report to get closer to consumers, to gain an
understanding of what they like and what they
don’t, and to use that understanding to thrive next
year and beyond.
3
Executive Summary
C
apgemini’s Cars Online research examines
consumer-driven trends in the industry,
including the way technology is altering both
products and processes, the emergence of
innovative transportation options and alternatives
that could change the industry for better or worse,
and the demand for personalization from both
OEMs and dealers at every stage of the buying
lifecycle. In short, 2012 consumers want it all.
Here are the top nine findings from this year’s survey
of more than 8,000 consumers.
Industry-altering Technologies
1
“Connect me” technology enhances
the ownership experience. Consumers
expect their new cars to have all the technology
they’re used to everywhere else in their lives —
applications for work and recreation, delivered
through dashboards that belong to the family of
desktops, laptops, tablets, and smartphones.
(Not surprisingly, those buyers who want a
“connected car” are also more likely to value having
a smartphone loaded with apps). Of greatest interest
are applications directly linked to vehicle safety
and the driving experience. To get “connected
car” features, buyers are willing to share data with
OEMs and dealers, which presents potentially
rich opportunities for closer relationships
with customers.
2
OEMs and dealers need to put their
“best (virtual) foot forward”: 94 percent
of shoppers browse online first. The first place a
buyer is likely to find “my car” is on the Internet:
OEM and dealer websites and search engines are
top sources of information for buyers. The web
gives consumers the power to compare, configure,
calculate, and communicate: the shopping
experience is enhanced, but an unresponsive
OEM or dealer is at a disadvantage. While actually
buying a car online is still relatively rare, consumers
4
do purchase accessories and parts. Not surprisingly,
the #1 reason behind online transactions is price.
3
Word gets around, fast: Social media
influences consumers, for better or worse
(especially in developing markets and among
“younger” buyers). Checking out Facebook, Twitter,
YouTube, and other social media channels are
common practice among today’s car shoppers. As
each year passes, positive and negative comments
have an increasingly higher influence on what
product people buy and where they buy it. Building
trust in a brand or business begins online.
Green Vehicles and Alternative
“Ownership” Models
4
“Green” is growing (but shoppers are
frustrated by barriers). Interest in hybrids
and electric vehicles (EVs) is growing, from 15
percent in 2011 to 22 percent in 2012. The
greatest expressed intent to buy a hybrid vehicle
comes from consumers in France (28%) and China
(42%). But consumers are wary of EVs for three
reasons: a relatively high total cost of ownership,
inconvenient re-charging, and a relatively limited
range. Only 32 percent of consumers think full
electric vehicles will be a viable buying option
within two years, compared to 42 percent who
thought so in 2011. Since consumer sentiment is
mixed (and since perceptions may not be 100%
accurate), everyone with a stake in the game
— OEMs, dealers, and governments — needs
to work together to instill confidence in “green”
vehicles and promote their benefits, both economic
and environmental.
5
The idea of not owning a car is getting
some traction among urban consumers.
Survey respondents agree: car sharing (and other
alternatives) could mean cost savings; for younger
drivers, greater flexibility is almost as important.
Either way, some consumers are warming up to
the idea of not owning a car, especially in urban
Automotive the way we see it
and densely populated areas where congestion,
pollution, and the high cost of ownership make a
different choice especially attractive. Early entrants
now have a foothold in a burgeoning market place,
while startups are floating new and different
business models.
Truly Responsive Personalization
6
The best dealers seamlessly connect the
virtual and the physical. Despite the digital
transformation that is occurring in the automobile
and other industries, the dealer is still an integral
part of car buying. But because of their online
resources, consumers are better informed and
more independent than ever. To continue being
relevant, dealers should offer more and better
service, beginning with a showroom that’s both
informative and entertaining. Shoppers increasingly
expect advanced and interactive tools, such as
3-D configuration, touch screens, and automated
data transfer to mobile devices — to provide a
differentiated, personalized buying experience.
7
Loyalty — to brands and dealers — is
on the rise. Over the past few years, OEMs
and dealers have worked hard to improve the
customer experience, and it seems that their
efforts are paying off. Overall, loyalty is up from
last year’s survey. (A point of interest: the owners
of premium cars are more loyal than their “volume
brand” counterparts.) A well-crafted service
contract should unite OEM and dealer in delivering
satisfaction, enabling them to respond to regional
differences and specific customer demands. In
addition, after-sales service is the fourth most
important reason for choosing a vehicle (after
reliability of the brand, price of the vehicle, and
safety), according to 88 percent of the survey
respondents (compared to 81 percent in 2011 and
77 percent in 2010); here, customer satisfaction in
the service bay means likely future sales.
8
Short, but not necessarily sweet:
consumers are crushing the buying cycle.
The longer shoppers browse online, the less time
they spend visiting dealers. As the first visit moves
closer to the moment of purchase, the dealer’s
window for interacting with customers is narrowing.
Worse yet, if consumers are not happy with the
first “touch point” — the OEM’s or dealer’s website
— they’ll walk away before they even get to a
showroom. Seventy-four percent of the 2012 survey
respondents said they would go elsewhere if an
OEM or dealer were too slow in answering an online
question; 81 percent said the same if an answer
was of poor quality. (In 2011, those numbers were
68 percent and 76 percent, respectively.)
9
Post-sale communications should
be relevant and personal. No single
communication type or channel is favored
by consumers, but 48 percent of the survey
respondents said they want information about the
About Capgemini’s Cars Online 12/13 study
Capgemini worked with ORC International, a global research firm, to conduct the survey for
Cars Online 12/13. All analysis and interpretation of the data were made by Capgemini.
Fieldwork was conducted in August and September 2012.
The survey respondents totaled more than 8,000 consumers in eight countries: Brazil, China,
France, Germany, India, Russia, the United Kingdom (UK), and the United States (US). All were
in the market for a car: 21 percent planned to buy or lease within two months, 37 percent in
two-to-six months, and 42 percent in seven-to-12 months. The composition of the consumer
sample in each country was based on projectable national samples representative of the
in-market vehicle-buying population in terms of region, age, and gender.
My Car, My Way
5
cars they’ve purchased and that such information
could affect their loyalty. OEMs and dealers should
know the what, when, and how of communicating
with each customer, which means it is probably
time to investigate robust, flexible content
management systems.
years, as strict austerity measures and high
unemployment weaken the economy and stifle
consumer demand.3 In today’s shrinking world and
connected, global industry, problems in Europe
could ripple out, causing downward adjustments
to economic forecasts everywhere.
It’s not news that the struggling
global economy has been tough on
auto sales
More than ever, automotive companies — OEMs
and dealers, in mature markets and developing
ones — are putting the customer front-and-center
(as have leaders in other industries; think WalMart, Amazon, and Apple). And every year these
customers get more sophisticated and more
demanding. Right now, consumers in mature
and developing markets differ in many ways (as
is evident throughout this report); but all of them
have (or will eventually have) more information,
more choices, and more power.
The real rate of GDP growth in developing
markets (specifically Brazil, Russia, India, and
China) has dropped from eight percent in 2010
to below five percent in 2012. In response, each
country has introduced strategies to bolster its
automotive industries.
Brazil has renegotiated old free trade agreements
to stem the flood of imports from China and
Mexico.1 Russia, a new WTO member, has
lowered import duties on vehicles, while offsetting
this with a recycling fee to stabilize domestic
vehicle prices in the short term. OEMs in India
and China are targeting mature markets. But
the cloud’s lining is silver indeed for developing
markets: industry projections say that, within
seven years, 60 percent of the growth will come
from them, while mature markets are expected
to make up only 15 percent of growth in the
same period.2
While growth in the US should be slow and
steady, the short-term outlook for Europe is
stark — at best, growth that is slow or slightly
negative; at worst, a double-dip recession
and euro zone default. Regional auto industry
executives are warning that Europe will likely
not see improvement for at least the next two
It’s inevitable: the already heated competition
for vehicle sales will just get hotter. But so will
innovation, as buyers are potentially dazzled with
new vehicle types, buying models, and in-car
technologies. OEMs and dealers around the
world are devising strategies that bring together
differentiated products and relevant customer
experiences — strategies that reflect and exploit
their understanding of the probable, the possible,
and the yet-to-be-imagined.
The next steps for playing well in the ever changing
game that is today’s auto industry are found in this
report: “My Car, My Way.”
1
Samantha Azzarello and Blu Putnam, “BRIC Country Update: Slowing growth in the face of internal
and external challenges,” CME GROUP Market Insights (July 25, 2012)
2
“Strategic Questions for Automotive Business Planners,” Polk (December 2012)
3
“Auto Makers Dig In as Europe Redlines, Emerging Markets Lose Luster,” 2013 Automotive
Outlook: International (October 22, 2012)
6
Automotive the way we see it
W
hat’s the effect of technology on the
automotive industry?
The answer is evident in both products
and processes.
New cars have embedded technologies that
enhance the owner’s experience. Just watch a
TV commercial: the cars are all about styling and
features, especially the “bells and whistles” (from
GPS systems to wireless access, from back-up
cameras to satellite radio/telematics). At the
same time, shoppers have at their fingertips the
power of online browsing: a buyer can compare
everything, from everywhere — at home, on a
plane, in a dealership — at any time.
The industry has changed already because of
technology, and it will only change more.
Industry-altering
Technologies
My Car, My Way
7
Connected cars: The transition
from “extra” to “expected”
will likely be rapid.
“C
onnected cars” link the driver and vehicle to
the environment through the Internet and
wireless networks. Examples of connected
technologies include dynamic navigation systems,
remote vehicle diagnostics, automatic notification
of emergency resources, an apps store, and
on-demand, real-time access to music and news.
Fifty-one percent of consumers in all markets
anticipate that their next cars will be connected
(this total combines 13 percent who already have a
connected car and 38 percent who want one
— these consumers can be known as “connected
car enthusiasts”).
As a rule, consumers in developing markets are
keener about technology; this hold true for
“connected car” enthusiasts. In developing
markets, 64 percent of consumers want connected
services; in China that number jumps to 78 percent.
In bold contrast, a significant number of German
consumers (49%) haven’t even heard of the
“connected car” concept. Only 17 percent of the
survey respondents said they’re “not interested” in
connected car services (Figure 1). One possible
suggestion: OEMs should consider launching
select services to consumers in the more receptive
regions of the world.
8
Which types of connected car features are most
important to buyers? (See the sidebar for an
explanation of what’s included in each category).
Among interested consumers, greater safety is the
#1 category (78%), an enhanced driving
experience is #2 (71%); real-time vehicle
diagnostics/customer care is #3 (66%); and
infotainment is last (55%). Let’s take a closer look
at that data (Figure 2).
Although the vehicle diagnostics/customer care is
ranked #3, the specific features within that
category generated a lot of interest. For example,
75 percent of consumers said they want a
“service reminder,” while 81 percent want the
connected car to “monitor condition of parts and
give automated warnings.” These types of offers
“bend the curve” toward empowering owners to
be proactive in fixing problems (hence the old
truism: “An ounce of prevention is worth a pound
of cure.”) This is in direct contrast to the original
approach to telematics, which was to use the
technology to sell features to customers. Of
course, these diagnostic functions direct the
driver to the dealer; in the end, that increases
loyalty and the likelihood of future purchases.
Automotive the way we see it
Figure 1: Familiarity with Connected Car Services (% saying)
Mature Markets
11
U.S.
27
13
U.K.
27
11
France
21
24
22
38
7
20
Developing Markets
23
20
14
Germany
31
21
Russia
48
9
Brazil
40
12
India
47
40%
Next car will have
connected services
Already use
connected car services
13
58
20%
17
10
60%
49
8
15
7
15
48
20
0%
10
20
15
22
China
37
14
22
All Markets
13
16
16
10
12
7
9
23
9
38
11
5
17
11 4
80%
13
100%
Not interested in
connected car services
Not heard of
connected car services
Don’t know
Source: Capgemini
Figure 2: Preferred Connected Car Categories (% saying important/very important)
78
70
Safety
87
71
61
Driving experience
80
66
Vehicle diagnostics/
customer care
51
80
55
39
Infotainment
69
0%
10%
All Markets
20%
30%
Mature Markets
40%
50%
60%
70%
80%
90%
100%
Developing Markets
Multiple responses
allowed
Multiple
responses
allowed
Source: Capgemini
Source:
Capgemini
My Car, My Way
9
Features in connected cars: Which
matter most to consumers?
While infotainment grabs media attention, it’s not
particularly sought by car shoppers. One possible
explanation is that current options, like satellite
radio or the option of connecting a smartphone to
play a personal playlist, already provide a great
in-car entertainment environment. Thus, owners are
already satisfied in this area and look to the
connected car to satisfy still unmet needs. (Also,
perhaps they can’t imagine how the entertainment
systems in the connected car would be significantly
better). In fact, the lowest rated connected service
is “social media apps” (e.g. Facebook, Twitter),
averaging only 44 percent (24 percent in mature
markets; 62 percent in developing markets). The
reason? Since smartphone alternatives deliver
social media, consumers could perceive that service
as redundant (similar to the infotainment category).
How to use, how to pay?
A large majority of consumers want core car
functionality (safety, driving experience, and
diagnostics/care) to be easily accessible on
dashboard screens, preferably controlled by voice
commands. For infotainment services, consumers
are almost evenly divided between smartphone
“docking” and the dashboard (Figure 3). In many
ways, the connected car’s dashboard is itself “just
another device” in a customer’s collection of
desktops, laptops, tablets, and smartphones. Of
course, for the OEM and dealers, a connected car
offers unprecedented opportunities for direct,
customer-specific, targeted marketing. (See
the section, “Communication counts, but only
if it is done right,” for a discussion of
post-sales communication).
When asked how they want to pay for connected
car services, consumers’ answers differed by
market. Among those in mature markets, the most
popular payment type, by a wide margin, is
“included in the price of the vehicle.” In developing
markets, no single option stands out: transactionbased payment is the most popular, followed by a
monthly fee. The good news for OEMs? Only 15
percent of consumers in all markets said they
expect the technology to be free.
10
Safety
• Direct connection to roadside assistance
• Emergency assistance (automated
emergency/break-down call, speak to
an agent)
• Information on speed limits and active
speed control by car
• Automated warnings (e.g. roadblocks,
ice, traffic jam, accident) and reaction (e.g.
alternative route)
Infotainment
• Wi-Fi hotspot for passengers to connect to
personal devices
• Social media apps (e.g. Facebook, Twitter)
• Personal playlist (access via cloud)
• Movies, music, games
• Mobile office (e.g. connection to work email)
• Point of interest search (e.g. parking,
restaurants, hotels)
• Concierge services
Driving experience
• Individualized route planning (e.g. scenic views, good restaurants)
• Smart and real-time navigation system
• Route recorder for economical driving
Vehicle diagnostic/customer care
• Service reminder
• Monitor condition of parts in car and give
automatic warnings
• Automated service appointment
scheduling
• Contact nearest dealer
• Contact vehicle manufacturer/call center
for personal assistance
• Usage-based insurance
Types of data: Which would
consumers be willing to share?
• Identification of driver — Personal
(such as name)
• Driving habits —Speed, temperature,
use of dashboard functions
• Vehicle diagnostics and
consumption— Mileage, fuel, oil,
water, brake fluid
• Driving routes, locations, and
distance traveled
• Entertainment preferences —Music,
movies, games
• Usage of connect features —
Frequency, duration, location,
personal preferences
Automotive the way we see it
Figure 3: Preferred Devices for Connected Car Categories (% saying)
Safety
21
26
Tablet
Infotainment
33
11
62
12
Vehicle diagnostics
/customer care
Driving experiance
68
Dashboard
39
53
14
41
20
Dont’ Know
Source: Capgemini
Give and take: Customers are willing
to give up some privacy for perks
Connected cars require data sharing: in fact, one
without the other is impossible. But are
consumers willing to share personal and vehicle
information with OEMS and dealers? Yes, if they
understand why it’s necessary. Consumers in
developing markets are more willing to share data
(86%) than are consumers in mature markets
(62%). Only 20 percent of respondents supported
unrestricted sharing (Figure 4).
Figure 4: Willingness to Share Connected Car Data with OEMs and Dealers (% saying)
All Markets
25
28
Mature Markets
Developing Markets
12
20
38
14
22
29
27
31
28
75%
26
62%
86%
No Data Sharing
Yes, but only anonymous data for research and statistics
Yes, but only for an incentive or service in exchange
Yes, without restrictions
Source: Capgemini
My Car, My Way
11
Figure 5: Willingness to Share Personal Data with Manufacturer or Dealer (% saying)
Mature Markets
46
U.S.
U.K.
24
48
22
49
France
Brazil
India
China
0%
No data sharing
23
31
28
12
26
36
23
17
25
20%
21
28
31
31
40%
31
60%
8
15
17
23
24
All Markets
20
19
33
9
11
20
25
80%
Yes, but only anonymous data for research and statistics
Yes, but only if I get an incentive or service in exchange
Source: Capgemini
22
47
10
11
19
26
Germany
Russia
19
23
41
Developing Markets
20
Yes, without restrictions
13
100%
34
23
28
Automotive the way we see it
At the country level, the data gets more interesting.
Forty-seven percent of consumers in Germany are
“most reluctant” to share personal data (one of six
data types explored in the survey - see sidebar on
page 10), while 31 percent of consumers in India
are willing to share that data without any
restrictions (Figure 5). (Overall, consumers in
developing markets are less concerned about
data privacy). Of course, 28 percent of the survey
respondents are willing to share information
anonymously; 27 percent are inclined to share
when there’s an incentive (Figure 4). Nonetheless,
45 percent of the survey participants said they
would not want their data shared with third
parties, such as insurance firms, travel agencies,
or advertising companies.
Clearly, the case has to be made to buyers: what
kind of data needs to be shared and why? Overall,
car owners are more willing to divulge information
that’s related to their driving habits and/or necessary
for vehicle diagnostics. And they are more willing to
share data under practical arrangements; that is,
when giving means getting (when sharing data
with OEMs and dealers results in direct benefit to
them). For example, with data on an owner’s
driving habits, an OEM could provide tips to
increase fuel efficiency.
Is there an app for that?
Smartphone applications for cars are, not
surprisingly, a very recent innovation in industry.
But consumers already love them! Seventy-seven
percent of connected car enthusiasts (that is,
owners or potential owners) said they consider
apps to be “very important” or “extremely
important” (only 56 percent of “non-owners” said
the same). Here are the features desired in an app
across six categories.
Smartphone Features by Category
Care Information
Vehicle Information
Driving Support
• Service reminders when
maintenance is due
• Service scheduling support
(e.g. to easily schedule required
maintenance with preferred
dealership)
• Special offers and promotions
from manufacturer and/or
dealer
• Manufacturer vehicle
notifications (e.g. vehicle or
accessory recalls and warranty
changes)
• Vehicle owner’s manual with easy
navigation
• Explanation of vehicle features (e.g.
Q&A on most requested information
on car features by new owners)
• Video instruction (e.g. for more
complex vehicle operations such as
changing a flat tire or jump starting
another vehicle)
• Instrument panel and driver
information console supplemental
information (e.g. explaining lights,
indicators, messages)
• Car care tips
• Vehicle health information (e.g. status of vehicle
operations)
• Diagnostic trouble code (e.g. dynamically provide
supplemental information when specific instruction is
important such as contacting dealership immediately
or stop driving vehicle)
• Remedial action support (e.g. identify most likely
causes of a specific situation with prompts as
necessary to identify driving conditions, packaging
of information with analysis for service technician,
sending to servicer via email)
• Live vehicle data display (e.g. dynamically changing
display of vehicle metrics such as driving efficiency for
fuel economy and performance-related information
including RPM, power and thrust)
Remote Support
Communications
New Vehicle Purchase
• Remotely sound horn and turn
on lights to find car
• Remotely start and stop vehicle
• Remotely lock and unlock
vehicle doors
• Parked car locator (using GPS)
• Locate stolen vehicle
• Call roadside assistance (easy-toaccess single click)
• Single click to call dealership (e.g.
about appointments, questions)
• Vehicle configurator
• Vehicle locator with configurator (find vehicles
matching configuration)
• Schedule a test drive
• Vehicle showroom (e.g. explore vehicles using
touchscreen, pictures and videos to understand
features, see vehicle “in action”)
My Car, My Way
13
Driving support is the most preferred at 71
percent, followed closely by care information, and
remote support. Across all categories, consumers
in developing markets express much more interest
in smartphone features (Figure 6).
Some OEMs are further ahead in providing these
capabilities to customers, but the sky is still the
limit in finding ways to use smartphone apps to
enhance the car ownership experience. In these
early days, smartphone/connected car capabilities
may overlap; this should not be interpreted as
convergence (that is, consumers wanting one or
the other) but rather as enrichment (that is, certain
customers will want both).
connections to owners — connections that
haven’t been possible (but have been desirable)
before now. In the past, post-purchase
communication with owners was typically limited
and negative (or neutral, at best): for example, to
resolve a product or customer service dispute/
issue or to respond to a request for information
about a vehicle or part. But a smartphone app
opens up the door for the OEM/dealer to establish
a direct, personal relationship with the customer.
The OEM could provide vehicle-specific benefits
relevant to the owner; the dealer could make sure
that service delivery is easy and convenient. The
right communication, at the right time, would
increase customer loyalty to the brand and the
OEM/dealer franchise.
Smartphone applications provide a unique
opportunity for OEMs/dealers to have one-to-one
Figure 6: Smartphone Categories of Features (% saying important/very important)
71
61
Driving Support
81
70
60
Care Information
80
68
58
Remote Support
79
66
55
Communication
76
65
Vehicle Information
51
79
62
New Vehicle Purchase
48
77
0%
20%
All Markets
Multiple responses allowed
Source: Capgemini
14
40%
Mature Markets
60%
80%
Developing Markets
100%
Automotive the way we see it
“Google me” —
Car shoppers go online first
(and second and third).
I
n 2012, 94 percent of consumers used the Web
to research automobiles (97 percent in
developing markets and 91 percent in mature
markets) — perhaps the most profound car buying
trend of the past 10 years. In 2002, only 20
percent of survey participants said they went
online before purchasing a car.
Forty-seven percent of consumers check OEM
websites before purchasing a car. Among the other
top sources of information are search engines and
information websites (Consumer Reports, What
Car, Schwacke, Argus). In addition, consumers
probe OEMs’ and dealers’ social media sites, as
well as third-party automotive blogs and forums,
looking for vehicle features and rating, reputations
for fairness and customer care, drivers’ satisfaction
levels, and other types of information.
The websites of OEMs and dealers should help
consumers narrow their choice and make a
decision by allowing them to compare vehicles
and configurations, calculate and compare sticker
prices, and put together a customized “dream”
car using interactive modeling tools. With growing
importance, the consumer should be able to get
My Car, My Way
a real quote online; 20 percent of the survey
respondents said they want this capability, that’s
almost double from one year ago (Figure 7). Here,
there’s a noticeable difference between the two
markets: 24 percent of consumers in mature
markets said they want online quoting (up from
15 percent in 2011); 17 percent in developing
markets said the same (up from nine percent in
2011). While Web functions have been in play for
years, OEMs and dealers should not take them for
granted but should, instead, be sure that the
information on their sites is easy-to-access,
accurate, and complete.
But not many shoppers are buying
cars online — yet
Overall, the interest in purchasing a car online has
held steady for the past three years: 39 percent of
survey participants (48 percent in developing
markets; 31 percent in mature markets) said they
would consider buying a car over the Internet.
When asked about buying alternatives to a
dealership, 45 percent of the survey respondents
would consider buying their car directly from the
OEMs, if it were possible (Figure 8).
15
Figure 7: Most Important Website Options (% saying important/very important)
32
Ability to compare
vehicles
30
29
Car configurator
24
27
Full range of product information
and vehicle selection
26
24
Retail list price be
available online
23
19
20
Ability to get a quote
17
Ability to locate a car anywhere
in the country that meets my
exact specifications
28
29
24
14
13
14
3-D product presentation
11
Ability to schedule test drives
11
13
15
12
13
12
Trade-in value information
for used vehicles
0%
34
26
24
Cost calculator for my
desired vehicle
33
16
8
5%
All Markets
10%
15%
Mature Markets
20%
25%
30
35
Developing Markets
Multiple responses allowed
Source: Capgemini
16
Actual online sales of new vehicles are rare
because the car purchasing process is complicated
and because almost all jurisdictions require the
involvement of a dealer. Also, as long as online
sales models do not offer the “feel” of a “real”
purchasing experience, most shoppers want to visit
a dealer. (Of course, a dealership doesn’t have to
be the only option for a test drive location; 73
percent of the survey respondents said they could
imagine and be comfortable with an alternative).
the majority of consumers still ranked “dealer” as
the #2 choice as seller (after the OEM). In the US,
car buyers named the dealer their top pick, while in
developing markets, consumers said they favor
non-traditional sources (direct from the manufacturer,
50 percent; car rental, 21 percent; and retail store,
28 percent). These preferences likely reflect two
characteristics of developing markets: (1) buyers are
less experienced and (2) dealers are not necessarily
conveniently located.
All consumers, from developing and mature
markets alike, agreed: the two reasons to buy a car
online are for a better price (45%) and, a distant
second, for an easier and faster transaction (24%).
Yet when asked about alternatives to dealerships,
In China and India specifically, buyers are
significantly more willing to look at channels other
than a traditional dealer, with top choices being
the manufacturer, an independent online vendor,
and a retail store.
40
Automotive the way we see it
Figure 8: Alternatives to Buying From a Dealer (% saying likely/very likely)
50
50%
45
40
40%
30%
31
27
20% 19
28
25
24
21
20
21
17
16
11 12
10%
23 24
7
10
5
2
3
2
0%
All Markets
Mature Markets
Developing Markets
Car rental company
Directly from manufacturer (Call center, Website)
I would only buy from a car dealership
Independent online vendors (e.g. Amazon)
Mobile salesman coming to my home
Retail Store
Petrol Station/Gas station
Other
Multiple responses allowed
Source: Capgemini
Some OEMS and dealers are trying to simplify the
buying process so that most of the transaction
could be completed on-line, without the buyer
stepping onto the dealer’s lot. Like other trends
tracked in Cars Online over the years, the interest
in on-line buying will likely increase, as OEMs and
dealers get more creative and as customer
expectations evolve.
Parts are another story
The purchasing of parts and accessories online
is strong:
n Fifty-nine percent of the surveyed consumers
said they’re “likely” to buy parts (such as
batteries, spark plugs, and tires) over the
Internet (from a dealer, manufacturer site, or
eBay) —an increase from 2011, when 56
percent said the same. (In developing markets,
the 2012 total was 66 percent, up from 65
percent last year; in mature markets, it was 51
percent, up from 48 percent).
My Car, My Way
Sixty-six percent of consumers said they would
be “likely” to purchase accessories (such as floor
mats, specialty mirrors, and seat covers) over
the Internet (up from 62 percent in 2011). In
developing markets, the number was 73 percent
(up from 70 percent last year); in mature markets,
it was 60 percent (up from 55 percent).
n
Everyone agreed: the #1 reason to buy parts and
accessories online is a price discount.
To win (or keep) this business, OEMs should be
proactive: take a good look at their online presence;
review the competition from parts companies and
auction sites; understand the unique value of
genuine OE parts; make the transaction easy for
buyers; and work with their dealer network to
distribute parts and accessories.
17
Social media gains power
(family and friends lose some).
Importance of user-generated content
by age and market
Age in
Years
Mature
Market
Developing
Market
18-34
35-49
50+
65%
57%
55%
85%
83%
76%
I
n the 2012 survey, 83 percent of respondents in
developing markets rated user-generated content
as “important” or “very important” (in mature
markets, 59 percent said the same). Consumers in
China are at the top end of this group (most likely to
value social media); those in Germany are at the
bottom (Figure 9). A closer look at the data shows
that, in developing markets, the perceived
importance of social media has increased
somewhat over the years.
Consumers in developing markets are 50 percent
more likely to purchase because of positive
comments, and 35 percent less likely to purchase
because of negative comments, than are shoppers
in mature markets. In this area — that is, the use of
social media — the survey also exposed a not
surprising gap between younger and older
consumers (see the sidebar for specific data). At the
same time, the influence of “family and friends”
dropped to sixth place, from fifth place in 2011 and
second place in 2010. Of course, there are
exceptions by country: consumers in India still rate
“family and friends” as “most important.”
18
Automotive the way we see it
friends” are “most important”), other options
(specifically, the car dealer, search engines, and
OEMs’ web sites) just bumped ahead in line. In
mature markets, the decrease in influence of
“family and friends” is absolute — down to 30
percent this year, a new low and a decrease in
rank to seventh (from sixth last year and fourth for
three years before).
The likely explanation for the greater enthusiasm
for social media among buyers in developing
markets is threefold: (1) they are relatively
inexperienced and, therefore, more likely to gather
as much information, from as many sources, as
possible; (2) the car buying population is younger
and, therefore, more likely to value user-generated
content; and (3) in these markets, buyers of all
ages rely on the Web for information (Figure 10).
Other sources of information deemed important by
the survey respondents include search engines
(“most important” in Russia and China) and
motoring/automotive publications (“second most
important” in France and China). OEMs and dealers
wanting to improve business in these countries
should keep these findings in mind (Figure 11).
Just as important, for the first time ever in
developing markets, the influence of “family and
friends” dropped — precipitously and definitively
— from first place (2008 to 2011) to fourth place.
While the overall percentages stay relatively the
same from year to year (with an average of 43
percent of consumers saying that “family and
Figure 9: Importance of User-Generated Content in Dealer and Brand Sites (% saying important/very important)
100%
93
82 83
80%
76
69
64
59
60%
62
54
60
58
54
80
83
78
80 81
All Markets
73
73
67
65
63
8383
79
86
58
57
61
56
65
71
39
40%
71
65
73
20%
2010
2011
na
hi
C
a
di
In
il
az
Br
ia
ss
Ru
y
D
e
M velo
ar p
ke in
ts g
G
er
m
an
ce
an
Fr
U
.K
.
.
.S
U
M
M
a
ar tur
ke e
ts
0%
2012
Source: Capgemini
My Car, My Way
19
Figure 10: Use of Social Media and Other Online Tools (% saying)
Third-party automotive blog or
discussion forum
Manufacturer social media sites
42
13
Online video or photo
sharing service
Professional social networking sites
32
11
32
9
Informational/encyclopedia site
with user-generated content
32
15
Personal social networking sites
28
8
Social messaging/micro-blogging services
24
8
RSS feeds
15
4
Social bookmarking sites
14
4
5
None of these
Developing Markets
44
15
Dealer social media sites
Mature Markets
45
31
0%
39
10%
20%
30%
40%
50%
Multiple responses allowed
Multiple
responses allowed
Source:
Capgemini
Source: Capgemini
Figure 11: Use of Information Sources to Research Vehicle (% saying)
Information Sources
All
Markets
Mature
Markets
U.S.
U.K.
France
Germany
Developing
Markets
Russia
Brazil
India
China
Car dealer (both new and used cars)
56
63
64
64
61
64
49
39
57
52
47
Vehicle manufacturer websites
47
49
56
55
35
49
46
45
42
51
46
Information websites/Independent car
valuation services
39
43
54
43
35
39
35
39
19
38
44
Search engine
39
32
32
36
27
35
46
52
34
48
51
Dealer websites
38
37
44
44
29
32
38
41
39
37
37
Family and friends
36
30
29
32
26
33
43
36
38
52
47
Specialist motoring/automotive press
35
34
17
37
42
39
37
35
32
34
49
Web forums, blogs or internet discussion
groups
23
15
13
19
17
13
30
35
17
26
43
TV advertising
22
14
16
13
12
13
31
18
27
45
35
Print advertising
22
15
18
18
10
15
28
19
27
39
25
Auto shows
22
13
10
09
19
14
32
24
21
38
44
Independent e-tailer sites
19
18
11
13
14
34
19
21
11
20
24
Manufacturer or dealer social media page
16
07
07
08
07
06
24
22
19
29
28
Car dealer (used cars only)
14
14
10
17
11
17
14
09
15
17
15
Non-specialist motoring/automotive press
13
8
05
11
06
09
17
21
9
15
24
Source: Capgemini
20
Automotive the way we see it
B
y 2015, each of the top 20 cities in the world will have a population of 10
million or more. The implications — for congestion, pollution, crowding,
and the cost of owning a car — are staggering.
Not surprisingly, among our survey respondents, urban consumers are most
interested in vehicles powered by alternative fuels or advanced technologies
(that is, “green” vehicles) and other transportation solutions (such as car
sharing). In some markets, new and emerging public policies — in the form
of tax incentives, driving privileges, and special parking permits — are
encouraging people to think in new ways about how they get from A to B.
Green Cars
and Alternative
“Ownership” Options
My Car, My Way
21
Is it Spring in the auto industry?
“Green” is growing.
C
by-market story. Half of the respondents in
developing markets would consider a green
vehicle, but only 29 percent of those in mature
markets said the same (Figure 12).
onsumers’ enthusiasm for electric and hybrid
cars is growing.
When asked — “What type of vehicle will you
purchase?” — 39 percent of the survey
respondents said a “green” one (up from 29
percent in 2011). A deep dive into the data tells the
Consumers in Brazil expressed the greatest intent
to buy an alternative to the conventional vehicle
Figure 12: Next Vehicle to Purchase/Lease (% saying)
Vehicle Type
All
Mature
Markets Markets
U.S.
U.K.
France Germany
Developing
Markets Russia Brazil
India China
Conventional vehicle (gasoline/petrol, diesel)
61
71
77
84
56
68
50
76
32
48
43
Non-conventional “Green Vehicle”
39
29
23
16
44
32
50
24
68
52
57
Alternative fuel vehicle (e.g. natural gas,
bio-diesel, ethanol)
15
8
5
3
10
13
21
7
46
24
9
Hybrid vehicle-electric and combustion engine
(e.g. Chevy Volt/Opel Ampera, Toyota Prius)
18
16
13
10
28
15
20
14
7
17
42
Full electric vehicle (e.g. Nissan Leaf)
4
3
3
1
3
3
6
2
8
9
4
Other
2
2
2
2
3
1
3
1
7
2
2
Source: Capgemini
22
Automotive the way we see it
Figure 13
Reasons for Purchasing a “Green Vehicle” (% saying)
Fuel economy
50
Impact on the environment
Other cost benefits
33
Reasons against Purchasing a “Green Vehicle” (% saying)
Cost/price
64
Inconvenient
re-charging
53
Range
50
Performance
1
31
12
Image/status symbol
4
Reliability/quality
28
Safety
19
Design
Other
1
Other
16
2
1 e.g. tax credit, avoid congestion charges, etc.
All Markets
All Markets
Source: Capgemini
Multiple responses allowed
Source: Capgemini
(68%), followed by the Chinese (57%). In India, 52
percent of consumers are open to the idea; in
France, that number is 44 percent. In mature
markets, the number of consumers intending to
“buy green” drops precipitously: US (23%), the UK
(16%). In other words, while the UK and France are
separated by a channel, their views on hybrid and
electric vehicles could not be further apart; and
while China and Brazil have oceans between
them, their enthusiasm is similarly high.
The arguments in favor of a green car include fuel
economy (50%) and environmental impact (the
motivation for 33 percent of those favoring electric
or hybrid cars). But cost pops up again when
consumers cited their #1 reason not to buy a
green vehicle (Figure 13), since these types of
vehicles are premium priced.
My Car, My Way
23
Interest in electric vehicles
is up, but consumers’
perceptions are off.
W
hen the participants were asked their
opinions about only “all electric cars”
(versus hybrid vehicles), interest was cautious.
When asked — “Thinking about the car you will
purchase/lease next, which one of the following
categories describes it best?” — only four percent
of all the survey respondents answered “full
electric vehicle,” a small bump up from three
percent last year. The likely explanation for this
lukewarm response is that consumers think EVs
are not viable yet, despite major pushes by OEMs
and governments to get electric cars on the road.
What about the near-term future? Forty-two
percent of consumers in developing markets said
they expect EVs to be a viable option within the
next two years. Only 22 percent of consumers in
mature markets said the same (Figure 14). The
Nissan Leaf, a highly popular EV, has yet to be
released in the developing markets included in this
Cars Online study, so maybe consumers in these
countries have a reason to be more optimistic.
Nonetheless, in both markets, consumers were
more positive one year ago (49 percent and 34
percent, respectively). The same top three reasons
24
cited for not buying a green vehicle can be applied
to an EV – that is price, an inconvenient or nonexistent recharging process, and range per charge.
Yet, actual sales belie the market’s perception:
that is, adoption rates for EVs are strong. During
the launch of two plug-in vehicles in the US, sales
were greater than those for a popular hybrid
during its comparable two-year introduction a
decade earlier — this despite the fact that options
for charging the vehicle away from home are still
limited (and having such options is key to getting
the benefit of driving as far as possible on a
electric charge). Also, some EV owners modified
electrical outlet in their home, which likely commits
them to future purchases.
In previous years’ studies, consumers said “home”
would be their #1 choice of place for charging an
EV. This year, when asked about other possible
locations, the #1 choice was someplace other
than work (that is, “public locations”). Clearly,
these cars are not imagined as limited; rather, they
need to be as flexible and free-ranging as gasfueled vehicles. An established charging
Automotive the way we see it
infrastructure, such as public charging stations,
would go a long way to increasing enthusiasm for
EVs. Sixty percent of the survey respondents said
they would like to “pay as you go” for a charge
(suggesting public charging stations akin to gas
stations); 34 percent said they favor a flat rate.
To overcome barriers to EV acceptance, OEMs
have to collaborate with governments, electric
utilities, electric vehicle equipment suppliers, OE
suppliers, and most of all with each other. A
growth in popularity of plug-in vehicles would
strain the current grid. But the construction of
additional electric supply could very well increase
rates, and higher peak charging costs could
negate the expected benefits from EVs.
Collaboration should have as its objective the
development of “smart grid” technologies that
would distribute energy efficiently.
Figure 14: Full-Electric Vehicles as a Viable Buying Option in less than 2 Years (% saying)
70
64
60
60
42
40
40
35
34
31
30
22
20
61
All Markets
50
49
50
58
38
34
32
29
22
19
18
16
42
10
10
G
na
hi
C
a
di
In
il
az
Br
ia
ss
Ru
er
m
an
ce
Fr
2012
y
D
e
M velo
ar p
ke in
ts g
2011
an
.
U
.K
.
.S
U
M
M
a
ar tur
ke e
ts
0
Source:
Capgemini
Source:
Capgemini
My Car, My Way
25
Is car sharing the next
wave (or least big ripple) for
drivers living in big cities?
The new “car culture” generation
One of the study’s sources tells this
first-hand story:
“My daughter is a junior at a state university
45 minutes from Motor City, U.S.A. (Detroit,
Michigan). Last fall she moved into a house off
campus in downtown Ann Arbor. To my
surprise, right away she signed up for Zipcar.
“She paid the fee with her smartphone (of
course, using an app is second nature to her,
if not to her parents) and — voila! – She had
wheels when needed, say for grocery
shopping, without having to ask friends for a
ride or call a taxi.
“Our family embodies ‘car culture’: we have
four cars in our driveway, including the Volt.
So, in that context, car sharing is a real
— and welcome —next step, just right for
its payment flexibility, relatively low cost,
and lifestyle convenience.”
26
T
he greatest interest in alternative transportation
models is in developing markets, where
consumers express a consideration — for vehicle
sharing, mobility packages, ride share services,
and intermodal — double that of their
counterparts in mature markets (Figure 15). A lot of
the reason for that is urban congestion.
Vehicle sharing is the hourly rental of a nearby
vehicle; the fee includes gas and insurance. In
densely populated areas with good public
transportation, expensive parking, and high
insurance rates, owning a car can be a downright
hassle. As an alternative, car sharing gives the
consumer headache-free access to a vehicle
when it’s needed — no more, no less. If (or when)
car sharing catches on, the benefits could be
amazing: one well-shared car could replace 10-15
vehicles on the street.
Automotive the way we see it
Figure 15: Likelihood to Consider Alternatives to Traditional Ownership (% saying likely/very likely)
22
31
20
23
25%
25%
0%
0% 50%
50%
75%
75%
63
58
56
64
Developing Markets
Mature Markets
Vehicle-Sharing Program
Mobility Package
Ride-Share Service
Intermodal
Source: Capgemini
My Car, My Way
27
Younger consumers (18-34) give vehicle sharing a
“thumbs up”: about half say they would consider an
alternative to buying (their enthusiasm is more than
twice that of consumers aged 50+). When asked
why, the younger group said they like the greater
flexibility and lower costs in sharing. (Not
surprisingly, vehicle sharing is popular on college
campuses — read the sidebar story).
burgeoning marketplace, a fact that challenges
startups to devise competitive, alternative
business models. For example, in a peer-to-peer
rental model, a company acts as a broker —
providing customers with a way to access the
vehicles, pay with credit or cash, and sign up for
insurance coverage — while individual owners
offer up their cars for hourly/daily rent.
In mature markets, consumers in France and
Germany are more likely to consider vehicle
sharing than are their counterparts in the US and
UK. In developing markets, China and India lead
the way in enthusiasm for car sharing, with Brazil
and Russia trailing considerably (Figure 16).
One peer-to-peer example — GetAround.com —
has a clearinghouse of more than 10,000 vehicles
for sharing in San Francisco, San Diego, Austin,
Portland, and Chicago. Companies like this can get
off the ground fast: GetAround.com expanded to its
current size in less than one year without the same
capital outlay as other car sharing programs. And
for GetAround.com more rapid growth is likely, as
the enterprise has formed partnerships with, and
secured funding from, some high profile investors.
Rental players like Avis (with its newly acquired
brand, Zipcar) and Hertz (with its Hertz on
Demand business) have a foothold in this
Figure 16: Likelihood to Consider a Car Sharing Program (% saying)
Mature Markets
U.S.
U.K.
22
19
19
12
14
France
Germany
22
25
28
9
51
57
21
33
22
23
47
27
26
19
79
20%
40%
Neither likely or nor unlikely
60%
80%
17
15
16
13
23 39
44
66
China
Source: Capgemini
47
24
India
Likely (Very likely or likely)
70
31
Brazil
0%
All Markets
69
16
Developing Markets
Russia
59
5
100%
Unlikely (Not at all likely or not likely)
41
20
38
Automotive the way we see it
Truly Responsive
Personalization
As customers spend more time on the Web to kick off the buying process
— looking at cars, researching features and functions, comparing prices,
and joining forums to gauge user satisfaction with brands — the visit to the
dealer’s showroom is moving ever closer to the moment of purchase. As one
survey respondent said, “I’m kicking tires online.”
Today’s car buyers are, as a rule, more informed and more demanding. As
one survey respondent wrote, “Dealers have to stop thinking they’re smarter
than the customer.” Another complained, “I generally know more about the
car than the salesperson does.” Comments like these say more about a
dealer’s behavior than his or her expertise. When a shopper — loaded with
research from multiple, often contradictory sources — hits the dealer with
dozens of questions, the dealer can be caught off guard. Appropriate training
— not in the automobile’s feature and functions, but in customer relationship
management — could close this gap between perception and reality.
My Car, My Way
29
Dealers are still the center
of the car buying experience
— for better or worse!
I
ncreasingly, consumers feel the power and
confidence that come from having information
before they walk into a dealer’s showroom. So,
it’s not altogether surprising that the window of
opportunity to sell a car through face-to-face
persuasion is closing (at least a bit). Seventy
percent of consumers surveyed said that they
make their first visit to a dealer visit within two
months before a purchase. Across all markets,
40 percent of buyers plan their first visit within
only one month of purchasing a vehicle (Figure 17).
Many consumers visit several dealerships to
“compare and contrast” offers and to narrow
their choices.
But there’s good news for dealers
One-to-two months before a purchase, only 15
percent of shoppers have made up their minds.
Two-to-four weeks before, only 18 percent are sure
of what they want. And two weeks before, only 33
percent are sure of what they want (“I have decided
on the vehicle and I am ready to purchase”), as
illustrated in Figure 18. That means 67 percent are
still undecided! And those buyers can be
influenced, right up to the last moment. This
uncertainty goes a long way toward explaining why
dealers are the top information source for
30
consumers researching vehicles (56 percent in
2012 versus 49 percent in 2011 and 34 percent in
2010). But it’s a fine line. As one respondent said,
“I like to look at cars without pressure.”
For the first time ever, dealers are considered
the #1 source of information by consumers in
both mature and developing markets (56 percent
of respondents overall agree, an increase of 65
percent since 2010), as illustrated in Figure 19. In
mature markets, dealer influence jumped 80
percent since 2010; specifically, 64 percent of
shoppers in the US, UK, and Germany depend
on the dealer (compared to 39 percent in Russia
and 47 percent in China). Five years ago, dealers
were ranked #7. The likely cause for this remarkable
shift? More than ever, shoppers count on dealers
to make sense of everything they’ve read about
and heard about during their pre-buying
research process.
Who can sort things out? The dealer
While today’s consumers do a lot of research as
part of the shopping experience, they’re often
coming to the dealer’s showroom suffering from
information overload.
Automotive the way we see it
Figure 17: Dealership Visit Time before Planned Purchase/Lease (% saying)
14
26
All Markets
8
4
12
23
Mature Markets
30
21
10
4
16
Developing Markets
3
< 2 weeks
10%
2-4 weeks
1-2 months
30
29
15
7
0%
30
18
2-4 months
20%
4-6 months
30%
40%
6-12 months
Source: Capgemini
Figure 18: Current Shopping Activity Compared to Time to Purchase Vehicle (% saying likely/very likely)
2 - 4 Weeks
1 - 2 Months
2 - 4 Months
4 - 6 Months
Time to purchase next vehicle
< 2 Weeks
6 - 12 Months
0%
32
16
30
18
26
28
18
27
30
15
30
30
31
26
29
31
26
20%
40%
1
25
27
28
33
60%
1
3
9
7
5
80%
Initial gathering of information about what vehicles are available
Narrowed down to a "short list" of vehicles
Deciding between two or three specific vehicles
I have decided on the vehicle I am ready to purchase
3
6
9
100%
I have not even begun to look
Source: Capgemini
My Car, My Way
31
Figure 19: Importance of the Dealer as an Information Source from 2010 to 2012 (% saying important/very important)
34
All Markets
+65%
49
56
35
Mature Markets
+80%
57
63
33
Developing Markets
+48%
40
49
0%
10%
2010
20%
2011
30%
40%
50%
60%
70%
80%
2012
Source: Capgemini
the buyer reconcile conflicting information). Most
dealers do a good job of this. But some survey
respondents provided feedback like this: (1) from
the US, “I didn’t like the dealer thinking I hadn’t
already done my research and trying to explain
to me what I had already read on the Internet”;
(2) from France, “Fuel consumption is too high
relative to the information provided by the
dealership”; and (3) from Russia, “There was a
discrepancy of information/opinions about the
same car, at the same dealer — a contradiction
or disagreement — it wasn’t clear who
to believe.”
Developing markets look at a third more
information sources on average than consumers
in mature markets, when researching a vehicle.
When asked “What’s your biggest frustration in car
buying?” one Russian said “the enormous amount
of information that needs to be processed before
making a selection” while another wrote “lots of
contradictory information.” Consumers look to
dealers to help them make sense of it all.
Another big reason consumers lean on dealers is
the cost of a car (potentially staggering for many
buyers). Thirty percent of buyers in developing
markets will spend more than 50 percent of their
income on a vehicle (in mature markets, 12
percent will do the same). Naturally, with an
investment this large, the buyer is anxious to
make the best and right decision.
Working independently and with OEMs, dealers
can use online resources to help the shopper put
everything in perspective and to improve the
in-showroom experience. In other words, dealers
can still make a decisive difference by creating a
personalized, comfortable, satisfying shopping
experience. A dealer’s success in putting buyers
(and browsers) at ease depends on two behaviors:
The dealer should recognize and acknowledge
customers’ research as adding value to the
conversation (for example, the dealer can help
n
32
The dealer should be careful that the shopper
isn’t already exhausted. When asked about
frustrations during shopping/buying, one
consumer in the UK said, “The time you have to
spend researching around and shopping
around.” Often, by the time they get to the
dealer, shoppers have hit a “saturation point”: to
avoid overwhelming them even more the dealer
should let the buyer lead the conversation.
n
Today’s car shopper lives in a
“wired” world
As shoppers become more “wired” — being
online, all the time — they expect dealers to be
the same.
Automotive the way we see it
Does the information they’re getting match across
channels? If it doesn’t, trust can fly out the window.
Once in the showroom, they want multi-sensory,
content-rich interactions (Figure 20).
Today’s consumers want a digitally enhanced
shopping experience which integrates the virtual
world (where they’ve already checked out the car,
tabulated costs, and blogged with owners) with
the “metal and rubber” world of the showroom.
Figure 20: Preferred Services in the Showroom (% saying)
50%
42
40%
36
34
33
29
30%
25
Interactive touch screens-pictures/videos
3D virtual vehicle configurator
18
20%
Tablet for me to use
14
Virtual test drive stations
Wi-Fi hotspots for my mobile device
PC with internet access
10%
Ability to transfer data to my mobile device
Other/Don’t know
0%
70%
All Markets
60%
50%
40%
40
39
33
28
30%
21
20%
22
26 27
20
12
34
22
17
45 45
42
36
27
25
20
25
24
16
10
9
10%
22
39
33
32
32
30
21
20
18
17
24
27 26
25
14
0%
Mature Markets
U.S.
U.K.
France
Germany
69
70%
60%
50%
40%
44
43
34
30 28
30%
20%
42
15
10%
42
32
28
17
10
41
37
38
27
23
15
34
28
16
44 42
39
38
37
27
15
58
56
51
51
33
32
23
18
6
10
2
0%
Developing Markets
Russia
Brazil
India
China
\Multiple responses allowed
Source: Capgemini
My Car, My Way
33
One survey respondent said she would like to see
“reviews from people who had already purchased
the car, ideally in a video – I’d prefer to hear from
owners rather than experts.”
As a first step, a dealer wanting to differentiate his
or her showroom should investigate digital tools,
such as interactive touch screens, 3-D configuration
software, and virtual test-drive programs.
Consumers in the US, the UK, France, Russia, and
Brazil said that an interactive touch screen is their
top tool; all the consumers in developing markets
picked the virtual test drive as their #1 or #2 choice,
while consumers from Germany liked 3-D
configuration software best. In general, consumers
in developing markets are more enthusiastic about
digital enhancements in the showroom; OEMs and
dealers should consider piloting specific services in
those regions most receptive to their use.
First contact can make (or break) a sale
— and that first contact is probably online.
Good “customer care” in the showroom is one
thing, but before consumers even get that far
they’re expecting attention online (Figure 21) —
virtual service matters!
Seventy-four percent of the respondents said
n
they would “go elsewhere” if they did not get a
timely response from an online request to a
dealer or OEM (compared to 68 percent who
said the same last year). And by “timely” 54
percent meant “four hours or less” (faster than
last year).
Eighty-one percent of the respondents said they
n
would “go elsewhere” if they did not get a high
quality response from a dealer or OEM (up from
76 percent in 2011).
Clearly, everyone is on the hook to react to online
browsers with the same attention and
professionalism they’d show a face-to-face
shopper. If they don’t, today’s consumer will
click away – right to the competition. As one
survey respondent wrote, “I feel I have to contact
five-to-seven dealers to find a good one — one
with good prices, good sales people,
good service, and a good showroom.”
Figure 21: Look for Another Dealer, Manufacturer or Both Based (% saying)
Response Took too Long
68
All Markets
65
Mature Markets
74
72
73
75
Developing Markets
Poor Qualty Response
All Markets
76
Mature Markets
72
Source: Capgemini
34
2012
0%
81
82
81
Developing Markets
2011
81
20%
40%
60%
80%
100%
Automotive the way we see it
Communication counts,
but only if it’s done right.
B
racketing the buying experience are
opportunities to talk to customers: before
the sale through the website and after the sale
through targeted, direct communications. In every
case, consumers expect authentic, personal
communication and attention.
OEMs and dealers want to communicate with the
buyer after a sale for many reasons: to provide
vehicle specifications through owner’s manuals
and quick reference guides; to inform the owner
about recalls or service schedules; to build brand
awareness through newsletters and magazines;
and to develop a relationship with the customer
through offers, promotions, events, and other
activities. Among the 16 different types of postsale communication, none was universally favored
by the survey respondents. Yet, the top ranked
ones included information about vehicle just
purchased (48%), alerts about special sales offers
(35%), and service reminders (35%) (Figure 22).
My Car, My Way
When it comes to communication method,
consumers do not prefer ”regular mail” or “voice
mail” or “texts” or “phone calls” or “in-car
(dashboard) messages” — rather “all of the above”
is the right approach. This does not suggest a
desire for a lot of communication, all the time;
instead, consumers want to be contacted with the
right content, at the right time, through the right
channel, based on each person’s preferences.
The most obvious conclusion: the OEM and dealer
need to ask the customer! The survey asked
consumers who found communication important
whether it would affect their decision to buy
another car from the same OEM/dealer (see Figure
22 for their answers). A personalized communication
strategy requires an investment, first in getting to
know each customer’s wants and needs, and then
in building a flexible content management system
capable of supporting a customer-specific program.
35
Figure 22: Important and Channel Preference for Post-Sale Communication (%)
All Markets
Type of Communication
Importance
Preferred Channel
Useful
Increase
Loyalty
Regular E-mail
mail
Mobile
phone
Text /
SMS
In car
message
Brochures/information about the vehicle that you bought/leased
48
24
48
40
3
5
4
Alerts about special sales, offers, promotions, etc.
35
20
11
64
9
14
2
Service reminders
35
16
12
45
13
19
11
Alerts and information about vehicle or accessory recalls
34
14
18
54
12
11
5
Detailed post-service report and follow-up by dealer
31
18
20
59
11
7
3
Post-test drive survey
30
16
10
65
13
9
3
Welcome pack after purchase/lease
30
14
45
33
11
8
3
Customer satisfaction survey after purchase
29
15
11
66
14
7
2
Personalized repurchase offer/promotion matched to your needs two
years after purchase
27
18
24
52
12
10
2
Customer satisfaction survey after service
24
12
10
67
13
8
2
Personalized communication/gift after a complaint
22
10
37
32
22
7
2
Brand magazine
18
8
45
34
9
9
2
Invitations to special events, open house days, etc.
17
8
25
53
10
10
2
Newsletters
15
7
16
62
9
11
2
Invitation to exclusive owners’ clubs
14
6
25
46
14
12
3
Other sales offers
11
5
19
61
7
10
3
Source: Capgemini
36
Automotive the way we see it
Celebrate! Loyalty is up
for OEMs and dealers.
L
oyalty grew from 2011 to 2012 — a remarkable
10 percentage points for brands and six
percentage points for dealers. In mature markets,
the bump is even greater for brands — up
15 percentage points!
For the car buyer in 2012, “service” means
customer care – not just in the repair shop, but in
the showroom, during the sales process, and
through pre- and post-sales communication. In this
larger context, service begets trust, and trust
grows loyalty. What does good service look like?
Here’s how one U.S. consumer described her
dealer’s behavior: “The service is excellent;
follow-up is excellent. We have an assigned service
manager: he knows us; he knows our car. Really,
he’s kind of like family now.” But, at the other
extreme, in describing poor customer service, one
respondent was poetic: “In the dealer’s showroom,
I felt like a fish in a shark pond.”
Customer goodwill begins with the buying
process. Among consumers, overall satisfaction
levels have reached new heights: 74 percent of the
survey respondents said they were “satisfied” or
“very satisfied” with their most recent shopping
My Car, My Way
experience (Figure 23). On average, the numbers
trend a little higher in developing markets.
When it comes to loyalty, franchise dealers have
an advantage for vehicle repairs and especially in
mature markets. Next in rank are independent
full-service stations. Specialty service shops and
other options, such as self-service and family and
friends, have decreased in consumer favor,
certainly because of the technological complexity
of today’s new cars.
What is loyalty and how is
it measured?
In the Cars Online 12/13 study, “loyalty” means two
types of consumer behavior: (1) the repurchase of a
brand or model and (2) the purchase of another car
(any brand/model) from the same dealer. Purchase
intention (the focus of this study) is clearly forwardlooking view: the findings reflect consumers’
anticipation of their next car (thus, the loyalty
metrics in this study might not correlate exactly
with those of the more accurate research of OEMs
which looks at actual sales).
37
Figure 23: Satisfaction with the Overall Buying Process (% say satisfied/very satisfied)
90%
80%
70%
67
69 70
76 77
72 74
61
60%
64
80 81 81
67
54
48
50%
40%
30%
20%
10%
0%
All Markets
2008
2009
Mature Markets
2010
2011
Developing Markets
2012
Source: Capgemini
That said, when the survey asked participants —
“How likely are you to purchase the same make as
your primary car?” — 71 percent of consumers in
all markets said they would (up from 61 percent in
2011). In mature markets, 69 percent said “likely”
or “very likely” (up from 54 percent in 2011); in
developing markets, 73 percent said the same (up
from 69 percent in 2011). Each of these numbers
represents a five-year high across markets.
When the survey respondents were asked —
“How likely are you to purchase from the same
dealer?” — 54 percent of consumers in mature
markets replied “likely” or “very likely” (up from 45
38
percent in 2011) — another five-year high for
mature markets! Given these numbers, it’s not
surprising that the answer “not at all likely to
purchase” is at a three-year low across the board.
While many factors drive loyalty, the survey looked
at three: the quality of post-sale communications,
the value of service contracts, and satisfaction with
the buying and service processes. Positive trends
in all three factors strongly suggest that the trend
— “loyalty is up” — is no fluke but, rather, the result
of OEM/dealers collaboration in planning and
executing programs, particularly in mature markets.
Automotive the way we see it
Service is a lot more
than repair work.
A
fter-sale service is more important than
ever because buyers are keeping their cars
longer (the reasons for that range from better
quality vehicles to an economic downturn). In fact,
according to an industry report from Polk, the
number of cars a typical US consumer will own in
a lifetime could drop as much as 25 percent. Given
these trends, the way survey respondents answered
this question — “How do you decide on the car you
want?” — was hardly a surprise: 88 percent ranked
“after-sales service” among the top five deal-makers
(or breakers) along with “reliability of brand” (94%),
“price of vehicle” (91%), “safety” (90%), “quality of
interior” and “exterior styling”(both at 87 percent).
Service satisfaction has increased each of the last
four years for all customers (Figure 24). Sixty-two
percent of consumers are likely to purchase a
vehicle from the dealer who services their current
vehicle, up from 56 percent one year ago. Also,
the favored location for service is the franchise
dealership, according to 64 percent of the survey
respondents (compared to 49 percent last year).
The top three reasons for choosing a specific
service provider are quality (35%), proximity to
home (21%), and price (19%), as illustrated in
My Car, My Way
Figure 25. As more customers are more pleased
with the service experience, and as more
consumers choose the franchised dealer as the
preferred service provider, loyalty increases.
So, how does a dealer do better than that? By
leveraging smartphones and connected car
services to boost satisfaction even more. The
two features that support after-sales — service
reminders and parts/conditions monitoring — are
highly valued by consumers. These (and related)
features would make it easier for customers to
practice preventative maintenance, thereby (ideally)
increasing the life of the car and decreasing the
total cost of ownership.
Echoing previous years’ reports, the Cars Online
12/13 confirms that for a dealer to build, keep, and
grow customer loyalty, he or she needs a welldesigned service contract. Seventy-five percent of
consumers said that the service contract influences
their purchasing decision. A stunning 90 percent of
customers in developing markets, and 62 percent
in mature markets, said they are more likely to
buy from a manufacturer or dealer with an “ideal”
service contract.
39
Figure 24: Satisfaction with Most Recent After-sales or Service Experience (% say satisfied/very satisfied)
80%
70%
76
73 73
71
69
66
75
72
74
78
75
78
60%
50%
40%
30%
20%
10%
0%
All Markets
2009
Mature Markets
2010
2011
Developing Markets
2012
Source: Capgemini
Figure 25: Primary Reason for Vehicle Servicing Location (% saying)
Mature Markets
20
22
U.S.
18
21
U.K.
19
23
6
France
20
21
9
Germany
22
Developing Markets
18
19
7
40
Russia
19
18
5
40
Brazil
27
India
18
China
0%
Price
5
29
23
20%
Location/proximity to home
29
1 6
14
6
1 6
9
3
8
32
2 5 23
5
36
17
80%
Location/proximity to work
21
5 22
5
40
60%
14
10
7
43
9
14
18
31
7
40%
13
2
30
5
23
3
2
8
13
24
30
5 11
41
100%
Quality of service
Rating of servicing location (given by accreditation agency)
Existing relationship
Extended hours of operation (evening hours and weekends)
Other
Source: Capgemini
40
9
7
All Markets
13
99 13
19
5
23
35
17
21
38
7
Automotive the way we see it
contracts that recognize their needs and the
exigencies of the local environment and (2) say that
a good service contract would “positively influence
their buying decision.”
But what constitutes “ideal” in a
service contract?
In mature markets, a replacement vehicle (a
“loaner”) is a “most wanted” feature (required by
50 percent of consumers in this group), followed
by an extended warranty and free inspections
(Figure 26). In developing markets, consumers also
want these considerations, but the majority (52%)
most value vehicle insurance (compared to only 18
percent in mature markets). Generally, customers in
developing markets generate a higher demand for
service contracts, but that varies from one country
to the next. Overall, customers (1) want service
Of course, it’s one thing to promise great
maintenance service, and quite another to deliver it.
In developing markets, 40 percent of consumers
said that “quality” is, by far, the primary reason
for choosing a service provider (only 18 percent
said “price”). OEMs and dealers need to monitor
themselves against the high standards they’ve set.
One survey respondent made a good suggestion:
“Better coordination between manufacturer and
mechanic to improve technical quality of service.”
Figure 26: What Consumers Want in a Vehicle Service Contract (% saying)
Replacement vehicle when own car
is being serviced
44
41
Extended warranty
36
Inspection included
35
Towing/roadside assistance included
34
Repair/labour included
31
Tyre/Tire replacement included
29
Wear parts included
Leasing/financing of vehicle
23
24
Other repairs included
Customer care (e.g. access to premium connect online,
VIP treatment, access to exclusive events, etc.)
0%
49
45
39
40
35
35
27
29
18
Vehicle insurance
Mature Markets
50
17
10%
20%
52
29
30%
40%
50%
60%
Developing Markets
Multiple responses allowed
Source:
Capgemini
Multiple reponses
allowed
Source: Capgemini
My Car, My Way
41
Conclusion and
Recommendations
T
his year’s study shows that consumers want
it all: industry-altering technologies, green
cars and alternative “ownership” options, and
truly responsive personalization. What does that
suggest? OEMs and dealers have to be poised
for new and expanding opportunities to be “on
the spot” — in the right place (which is increasingly
virtual), at the right time (which is increasingly 24/7),
with the right combination of products and services.
Here are a few reasonable steps to consider based
on the findings from Cars Online 12/13.
Adopt a customer-obsessed culture
The world’s most successful companies share a
common characteristic: they’re obsessed with
their customers. The progress made in the past 20
years in the auto industry might be attributable to
the same focus: win the satisfaction of customers
by making a great product, at a fair price, backed
up by high quality buying/owning experience. In
fact, the two factors influencing whether a person
will buy a particular car are (1) the features of the
vehicle (such as safety, reliability, styling, and
performance) and (2) the customer experience of
buying/owning.
While the value of each — the car and the experience
— varies by individual buyer, this year’s survey reveals
a perspective important to dealers and OEMs: that is,
a quality customer experience is better than price
discounts and incentives for generating sales,
improving loyalty, and enhancing the brand
Be sharp online
Given the ubiquity and power of the Web — as a
rich source of information; as a forum for trend
setters, opinion-trackers, and consumers eager to
share experiences; as a shopping mart where
buyers can instantly compare products, prices,
and service performance; and as a post-sales
connection to customers — OEM and dealers
must continue to master this channel. Information
on the website needs to be accurate and relevant;
everyone should consider incorporating usergenerated content on the website. Direct
communication with customers needs to reflect
42
each one’s preferences, not just in content but
also in channel and timing.
Digital leads are good leads! A website is often an
OEM’s or dealer’s first contact with an interested
shopper. “Quick wins” can come from a timely,
quality response to digital leads. (On the other
hand, each year shoppers are more unforgiving if
their inquiries are not addressed quickly and
thoroughly). It’s hard to believe that some OEM
and dealers still struggle in this area: the average
response time to an inquiry is 24 hours or more,
while a significant percentage of leads are not
pursued at all (or responses are inadequate or
ill-considered). Excellent IT systems and tools are
sub-optimized if the dealer’s lead management
process is sub-par. OEMs and dealers should
collaborate on developing and implementing best
practices for lead management and for postimplementation monitoring.
Build meaningful relationships
with customers
Consumers who live in a “wired” world expect an
amazing amount of personalized attention. Luckily,
the technologies that create these expectations can
also be used to meet them. For example,
connected car technologies — yes, it’s only a
matter of time until these are “standard” —
generate a lot of “big data” for OEMs and dealers:
why not use it to develop real, mutually
advantageous relationships with customers,
perhaps by reaching out with value-added (but free)
information, by addressing a car owner’s needs
proactively, or by tailoring post-sale messaging to
reflect each customer’s expressed interests?
Major planning is needed to make possible the
collection, analysis, use, and sharing of the data.
OEMs and dealers need to work together to
ensure that customer value is at the center of this
effort. Customer loyalty to brands and dealers is up:
it’s a good time to build on that momentum.
Embrace new technologies
Consumers want a seamless buying experience,
in which online and offline channels are fully
Automotive the way we see it
integrated. This expectation has at least three
important implications:
1) The showroom experience should be enhanced
with new, digital technology that enriches the
shopper’s access to information and enables
dealers to take full advantage of the limited time
available to engage with consumers.
2) OEMs and dealers need to capture their
customers’ channel preferences and then use
this information to personalize post-sale
communications. Short of doing this, OEMs
should use predictive analytics and rule-based
engines to build customer segment profiles
which would, in turn, make possible successful,
targeted messaging.
3) OEMs should continue to improve the “mobility”
experience, since smartphone consumers
want to use apps for such services as online
reminders and scheduling. The good news?
Mobile solutions provide a competitive
differentiation and establish a one-to-one
connection with the customer.
Consider more online selling
Consumers are buying parts and accessories
online, searching for transactions that are cheaper,
more convenient, and risk-free. But third-party
suppliers are getting most of this business. OEMs
could use their built-in distribution locations (that is,
their dealers) and leverage their IT systems as the
basis for an online shopping channel.
When dealer personnel are involved with selling/
distributing products online, it does more than
United States
Michael Boruszok
[email protected]
John Bagazinski
[email protected]
Brazil/Latin America
Jenner Marques
[email protected]
generate revenue; it also creates an opportunity to
develop an active relationship with actual or
potential customers. As for selling cars online,
OEMs and dealers need to enhance their websites
with sophisticated tools to support these buying
activities: interacting with the dealer’s staff, getting
price quotes, negotiating, and evaluating a trade-in.
Be prepared for even more
technological advances
In the future, will a car drive itself from the factory
floor to its owner’s driveway? Yes! The technology
in connected cars, coupled with advanced and
still-emerging vehicle sensors, are paving the way
for driverless cars and, along with them, the
promise of reduced urban congestion and
pollution, to say nothing of a productive morning
commute! Right now, small fleets of driverless cars
are being tested in different markets. Industry
leaders are capturing data from these pilots,
establishing future standards for design and
safety, and continuing to dream of a “better” car.
The lesson learned? As Mark Twain said, “The
secret of getting ahead is getting started.”
Capgemini’s Cars Online 12/13 study presents
the headline findings of our annual automotive
consumer research. The survey data gives rise to
use insights about consumers’ expectations and
desires — insights you can adapt and apply to
achieve better business outcomes. To take a
deeper dive into our Cars Online research or to
explore its implications for your company’s
position in a dynamic industry, please contact:
China
Will Zhang
[email protected]
India
Floyd D’Costa
[email protected]
France
Marianne Raymond
[email protected]
Germany/Russia
Markus Winkler
[email protected]
Björn Harms
[email protected]
United Kingdom
Andrew Yearsley
[email protected]
“© Copyright 2013 Capgemini U.S. LLC. All rights reserved. The information contained herein is general in nature and is not intended, and should not be construed, as professional
advice or opinion provided to the user. This document does not purport to be a complete statement of the approaches or steps, which may vary according to individual factors and
circumstances, necessary for a business to accomplish any particular business goal. This document is provided for informational purposes only, on an ìas-isî basis.”
My Car, My Way
43
Automotive the way we see it
About Capgemini
With more than 125,000 people in 44 countries, Capgemini is one of the
world’s foremost providers of consulting, technology and outsourcing
services. The Group reported 2012 global revenues of EUR 10.3 billion
(more than $13 billion USD).
Together with its clients, Capgemini creates and delivers business and
technology solutions that fit their needs and drive the results they want.
A deeply multicultural organization, Capgemini has developed its own
way of working, the Collaborative Business ExperienceTM, and draws on
Rightshore®, its worldwide delivery model.
Learn more about us:
www.capgemini.com
About Capgemini Consulting
Capgemini Consulting is the global strategy and transformation
consulting organization of the Capgemini Group, specializing in advising
and supporting enterprises in significant transformation, from innovative
strategy to execution and with an unstinting focus on results. With the
new digital economy creating significant disruptions and opportunities,
our global team of over 3,600 talented individuals work with leading
companies and governments to master Digital Transformation, drawing
on our understanding of the digital economy and our leadership in
business transformation and organizational change.
Find out more at: www.capgemini-consulting.com
About Capgemini’s Automotive Practice
Capgemini’s automotive practice serves 14 of the world’s 15 largest vehicle
manufacturers and many of the largest automotive largest automotive suppliers.
More than 2,500 automotive specialists generate value for companies through
global delivery capabilities and industry-specific service offerings such as
Integrated Lead Management, B2C Web Strategy, Service and Parts Management,
Supplier Transformation, Optimization of Dealer-Focused Operations, Electric
Vehicles and Mobility Services, Application Outsourcing for Automotive for
Automotive Manufacturers, and Global Emerging-Market Sourcing.
For more information go to: www.capgemini.com/automotive
The information contained in this document is proprietary. ©2013 Capgemini. All rights reserved.
Rightshore® is a trademark belonging to Capgemini.
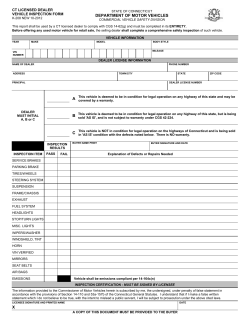


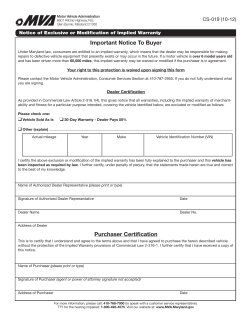
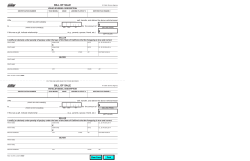

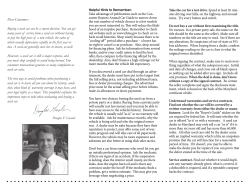


© Copyright 2026