
Full Text Original
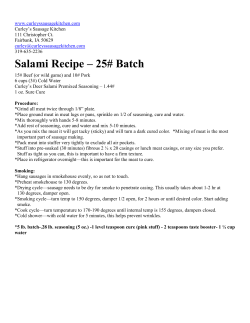
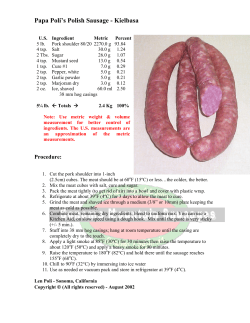
http:// www.jstage.jst.go.jp / browse / jpsa
doi:10.2141/ jpsa.0130149
Copyright Ⓒ 2014, Japan Poultry Science Association.
Changes in Chemical-Physical Index and Microstructure
During Dry-cured Duck Processing
Daoying Wang1, 2, Muhan Zhang1, Weimin Xu1, Huan Bian1, Fang Liu1,
Zhiming Geng1, Yongzhi Zhu1 and Xinglian Xu2
1
Institute of Agricultural Products Processing, Jiangsu Academy of Agricultural Sciences, Nanjing 210014, PR China
2
Key Laboratory of Meat Processing and Quality Control, Ministry of Education,
Nanjing Agricultural University, Nanjing 210095, PR China
Dry-cured duck is a high quality meat product processed by the traditional dry-curing procedure. The objective
of this paper was to study the physical-chemical parameters and microstructure of the duck muscle during the
manufacturing process. Thirty six ducks were used in this study and samples were taken after dry salting, marinating,
piling, and drying for 6 days and 12 days. The increase in NaCl, TBA, protein, fat, and shear force were observed
whereas water, cooking loss, L*, a*, b* and myofiber diameter decreased during the whole process. It showed the
quality parameters such as NaCl, TBA, shear force and water were strongly correlated and associated with the
microstructural changes of the muscles.
Key words: chemical-physical index, dry-cured duck, microstructure, processing, traditional
J. Poult. Sci., 51: 220-226, 2014
Introduction
Traditional Chinese dry-cured duck is a well known local
delicacy in China and Southeast Asia due to its tasty flavor
and texture, and has a history of over 300 years (Li, 1988). In
Nanjing city alone, about five million dry-cured ducks are
consumed annually (Li, 1988). Similar to dry-cured Jinhua
ham, dry-cured duck is produced by dry curing, marinating,
piling and drying naturally but the period of its production is
shorter than that of hams (Xu et al., 2008).
The chemical-physical index and microstructure changes
that occur during the processing of dry-cured duck associated
with proteolysis, lipolysis and lipid oxidation processes could
contribute to the final taste and texture of the dry-cured meat
product. The control of complex biochemical reactions
which lead to the development of the typical sensory traits
and texture of dry cured products depends largely on the
manufacturing process (Toldra and Flores, 1998). The
manufacture and physical-chemical characteristics of drycured meat products such as hams and sausages have been
studied in many previous studies (Toldra and Flores, 1998).
Lorenzo et al. (2010, 2013) has reported the physic-chemical characteristics of dry-cured duck, however, there is a lack
Received: August 5, 2013, Accepted: September 30, 2013
Released Online Advance Publication: November 25, 2013
Correspondence: Dr.Y. Zhu, Institute of Agricultural Products Processing,
Jiangsu Academy of Agricultural Sciences, Nanjing 210014, PR China.
(E-mail: [email protected])
of information about the physical and chemical changes that
occur throughout the dry-cured duck manufacturing process.
The microstructure of the dry-cured duck and its relationship
with the chemical-physical characteristics is also quite few.
The biophysical methods such as scanning electron microscopy (SEM) and transmission electron microscopy (TEM)
have been applied to study the structure of a wide variety of
foods, and it’s known the quality of meat products is closely
related to their microstructure (Monin et al., 1997; PerezAlvarez et al., 1999). Therefore, the objective of this study
was to track the chemical-physical parameters, microstructure, and their inter-relationships in the manufacture process
of traditional Chinese dry-cured duck.
Materials and Methods
Sample Preparation
Thirty-six lean-type Cherry Valley ducks from a commercial feedlot were slaughtered humanely in a commercial meat
processing company (Jiangsu Yurun Food Ltd.), each of
which was about 2.0 kg. After chilling for 2 h, dry-cured
ducks were processed as follows: duck carcasses were drysalted for 24 h (salt content: 6.5% of carcass weight), marinated in brine for 24 h (saturated salt solution), piled for 48 h
and then dried at 2℃-10℃ in a well-ventilated room for 6 to
12 days (Xu et al., 2008). Sampling stages, processing time,
average temperature and relative humidity (RH) is shown in
Table 1. At the end of each processing stage (including raw),
six carcasses were selected for chemical-physical index and
Wang et al.: Changes in Dry-cured Duck
221
Sampling stages, processing time, average temperature and RH during the processing of dry-cured duck
Table 1.
Sampling stage
Raw
Dry-salted
Marinated
Piled
Dried for
6 days
Dried for
12 days
Processing time / d
Mean temp. / ℃
Mean RH / %
1.0
6 . 04
63 . 88
2.0
9 . 08
92 . 83
3.0
6 . 95
95 . 60
5.0
3 . 60
72 . 38
11 . 0
5 . 76
84 . 24
17 . 0
3 . 47
60 . 42
microstructure analyses. The breast muscles were removed
from the carcasses for physical-chemical measurement or
stored at −40℃ for microstructure analysis.
Determination of Microstructure
The microstructure of meat samples was determined using
a scanning electron microscope (SEM) according to Chang et
al. (2010) with slight changes. The procedure for SEM
analysis was conducted as follows: Pieces (2×2×0.5 mm)
were excised from muscle samples and fixed in 2.5% glutaraldehyde in 0.1 M phosphate buffer (pH 7.3) at room temperature. The specimens were then rinsed with 0.1 M phosphate buffer (pH 7. 3) and dehydrated for 15 min in 50%,
70%, 80% and 90% ethanol, respectively and three times in
absolute ethanol for 30 min each, then rinsed in isopentyl
acetate and ultradehydrated by critical point with CO2 (1100
psi, 31.5℃) in a POLARON E3000 instrument (Watford,
United Kingdom). Then they were gold-coated using
POLARON E6100 Equipment and observed in SEM (S4800, Hitachi High-Technologies Corporation, Tokyo, Japan).
The diameters of 50 randomly selected myofibers were measured as the maximum dimension perpendicular to its long
axis.
Determination of Chemical Index
Salt, protein, fat and water were determined following the
International Organization for Standardization (ISO) recommended method 1841-1 (ISO, 1996), 937 (ISO, 1978), 1443
(ISO, 1973), 1442 (ISO, 1997), respectively.
Lipid oxidation of all samples was assessed by the 2thiobarbituric (TBA) method according to Sorensen and
Jorgensen (1996). Ten grams sample was homogenized with
30 ml of a 7.5% trichloroacetic acid (TCA) solution containing 0.1% propylgallate (PG) and 0.1% ethylenediaminetetraacetic acid, disodium salt (EDTA) for 30 s in an Ultra
Turrax blender (9500 rpm) and filtered through a Whatman
filter No. 42. Equal 5 ml volumes of filtrate and 0.02 M TBA
solution were mixed with glassed stopped tubes and incubated in a water bath at 100℃ for 40 min before cooling to
room temperature under running cold tap water. The absorbance was measured at 532 nm using spectrophotometer.
TBARS were calculated from a standard curve of malondialdehyde (MDA), freshly prepared by acidification of TEP
(1,1,3,3-tetraethoxypropane) in the range from 0.02 μg/ml to
0.3 μg/ml and expressed as mg of MDA per kg sample.
pH was measured from meat homogenates (2 g meat+18
ml distilled water) using a pH meter equipped with an electrode (Fernandez et al., 2002). The pH meter was stand-
ardized by a two point method against buffer standards of pH
6.86 and pH 4.0.
Determination of Physical Index
The meat color (L*, a*, b*) was measured using a Colorimeter (CR 400, Minolta, Japan). The colorimeter was calibrated using a standard white ceramic tile before measuring
each sample.
To measure the cooking loss of the samples, each breast
fillet was weighted accurately prior to cooking. After cooking, the breast fillets were cooled to the internal temperature
of room temperature and wiped with blotting paper to remove excess water and weighted immediately. Cooking loss
was calculated as
Cooking loss (%)
=[(raw weight−cooked weight)/raw weight]×100
After measurements of cooking loss, the same muscles
were then used for the determination of shear force. Shear
force was determined through the application of the Meullenet-Owens razor shear (MORS) test (Meullenet et al., 2004),
using a texture analyzer (TVT-300XP, TexVol Instruments,
Viken, Sweden) equipped with a razor blade with a height of
24 mm and a width of 8.9 mm. Muscle strips were cut across
the fiber axis. The crosshead speed was set at 2 mm/s, and
the test was triggered by a 10 g contact force. The shear was
perpendicular to the axis of muscle fibers. In each treatment,
the MORS test value was determined in triplicates at predetermined locations on each of the fillets.
Statistical Analyses
The changes of chemical-physical index were evaluated by
one-way analysis of variance techniques where these measurements were as dependent variables and the processing
stage as independent variables. And means of the measurements at different processing stages were compared using the
Duncan’s multiple-range test at the significance level of 0.05.
Correlation coefficients among all the variables were evaluated by descriptive analysis of correlations. All statistical
analyses were performed by SPSS 18.0 (Argyrous, 2011).
Results and Discussion
As can be observed from the SEM photograph (Fig. 1 &
Fig. 2), after 6 days of drying, the muscle showed higher extent of hollows in both transverse and longitudinal directions
in comparison with the raw muscle because of the salt
diffusion and water loss. The hollows weakened the water
retaining capacity of the muscle, and caused the increase in
TBA as the interior surface of the muscle was exposed to the
222
Journal of Poultry Science, 51 (2)
Fig. 1. SEM (transverse section, 1000×) micrographs of pectoralis
muscle through the processing of dry-cured duck.
air. The raw muscle had adhesive surface, while the drycured muscle appeared to be dry. In the raw muscle, the
fibers were firmly attached to one another by the endomysial
connective tissue and the myofibrils inside the cells are
strongly attached to each other and sarcolemma. While in
the dry-cured muscle, the endomysial connective tissue was
not intact, and the myofibril bundles and plasmatic membrane was apparently separated as a result of the degradation
or denaturation of membrane and proteins that join the membrane to the myofibrils. The proteolysis of myosin, actin and
other myofibrillar proteins throughout the drying stage has
been reported in many studies (Toldra et al., 1993; Tabilo et
al., 1999). Besides this reason, the high salt concentration
might have caused partial solubilization of myofibrillar pro-
teins, resulting in the weakness of the muscle structure
(Sultana et al., 2008).
Table 2 shows chemical-physico properties, color parameters and instrumental texture measurements during the manufacture of dry-cured duck breast. There is no significant
change in pH value in dry-cured duck meat during the whole
process (P>0.05). The final pH might be due to the integrated consequence of ammonia and amine generation
(Hughes et al., 2002), and proteolytic activity of endogenous
cathepsins (Verplaetse, 1994).
As we expected, NaCl content increased with the processing days from 0.29% to 8.92% (Table 2). This is similar
to Lorenzo et al. (2010) who obtained the sodium chloride
content of around 7.5±1.22% in 21 days dry-cured duck
Wang et al.: Changes in Dry-cured Duck
223
Fig. 2. SEM (longitudinal section, 1000×) micrographs of pectoralis
muscle through the processing of dry-cured duck.
breast and lower than Lorenzo et al. (2013) who obtained
12.73±0.99% in dry-cured ducks after 28 days of ripening.
In the present study, the ducks were subjected to dry salting
and saturated brine, which has been reported to improve the
sensory properties such as greater firmness and retaining the
color (Birkeland et al., 2003; Gallart-Jornet et al., 2007).
NaCl has significant pro-oxidant effect in meat products
(Rhee and Ziprin, 2001). Salt accelerates lipid oxidation but
the mechanism of action is not fully elucidated. There is
evidence that chloride ions may displace iron ions from
binding macromolecules and make them available as initiators of lipid peroxidation (Rhee and Ziprin, 2001). Our
results showed that TBARS values of dry-cured duck increased markedly and it’s relevant with the salt content. The
TBARS value at the end of the process was much higher than
those by others. Fernandez and Rodriguez (1991) and Sarrage
et al. (2002) observed the value of 2.21 and 2 mg of malonaldehyde/kg in chorizo and dry cured loins respectively.
Lipid oxidation plays a key role in the overall aroma of drycured products because of the generated volatiles, however,
the high content of volatile compounds derived from lipid
oxidation also lead to the rancid flavor.
The water content in dry-cured duck muscle declined progressively from the marinating period and was highly correlated with NaCl diffusion (Table 2). The water loss caused
the hollows and the precipitation of salts on the surface of the
muscles in the SEM photograph. The result was higher than
those found by others in dry cured duck muscles that were
Journal of Poultry Science, 51 (2)
224
Table 2.
Sampling stage
Changes of chemical-physical index during dry-cured duck processing
Raw
Marinated
Dry-salted
e
Piled
c
Dried for 6 days
c
Dried for 12 days
NaCl (%)
0 . 29±0 . 07
2 . 07±0 . 15
5 . 65±0 . 10
6 . 11±0 . 40
7 . 54±0 . 15
8 . 92±0 . 11a
Protein (%)
17 . 16±0 . 01d
17 . 78±0 . 41d
19 . 95±0 . 17bc
20 . 57±0 . 64b
21 . 13±0 . 44b
22 . 20±0 . 61a
Fat (%)
1 . 90±0 . 18c
2 . 34±0 . 37a
2 . 40±0 . 35a
2 . 43±0 . 26a
2 . 49±0 . 19a
2 . 07±0 . 21b
d
c
c
b
a
TBA (mg/kg)
0 . 08±0 . 00
0 . 61±0 . 02
1 . 51±0 . 04
3 . 64±0 . 05
3 . 71±0 . 02a
0 . 74±0 . 01
Water (%)
77 . 29±1 . 27a
75 . 60±0 . 17a
68 . 97±0 . 56c
66 . 91±1 . 37cd
64 . 45±0 . 94d
71 . 34±0 . 25b
pH
6 . 05±0 . 15a
6 . 13±0 . 08a
6 . 24±0 . 23a
6 . 03±0 . 07a
6 . 26±0 . 20a
6 . 23±0 . 04a
a
b
c
d
bcd
L*
40 . 48±1 . 19
33 . 88±0 . 68
29 . 63±0 . 57
30 . 74±2 . 01
30 . 02±0 . 05cd
31 . 80±0 . 58
a*
18 . 60±0 . 94a
17 . 58±1 . 63a
17 . 55±0 . 79a
16 . 77±2 . 09ab
14 . 95±1 . 10b
18 . 32±1 . 21a
a
a
a
b
a
5 . 24±1 . 08
b*
4 . 85±0 . 82
2 . 47±1 . 17
4 . 36±1 . 47
3 . 88±0 . 66ab
4 . 55±0 . 55
Shear force (g)
1125 . 33±124 . 45c 777 . 83±115 . 53e 883 . 67±129 . 78d 1470 . 92±128 . 84b 1567 . 83±183 . 89ab 1759 . 58±236 . 80a
Cooking loss (%)
16 . 59±3 . 03a
6 . 57±1 . 04c
8 . 29±1 . 21bc
5 . 18±0 . 37c
5 . 06±0 . 28c
10 . 69±1 . 87ab
a
a
a
ab
b
Myofiber diameter
17 . 68±0 . 47
18 . 21±0 . 72
17 . 43±0 . 63
16 . 87±0 . 44
16 . 09±0 . 62b
16 . 12±0 . 45
(μm)
a-e
d
b
Means in the same row with different letters differ significantly (P<0.05).
Table 3.
Pearson correlation coefficients (r) of chemical-physical index during dry-cured duck processing
Protein
(%)
NaCl (%)
Protein (%)
Fat (%)
TBA (mg/kg)
Water (%)
pH
L*
a*
b*
Shear force (g)
Cooking loss
(%)
0 . 995*
1
Fat (%)
0 . 985**
0 . 976**
1
TBA
(mg/kg)
0 . 873*
0 . 875*
0 . 798
1
Water (%)
pH
−0 . 988**
0 . 627
−0 . 995**
0 . 569
0 . 566
−0 . 959**
0 . 616
−0 . 916*
−0 . 560
1
1
L*
a*
b*
−0 . 888*
−0 . 863*
−0 . 941**
−0 . 669
0 . 846*
−0 . 459
1
−0 . 764
−0 . 775
−0 . 673
−0 . 880*
0 . 818*
−0 . 480
0 . 599
1
−0 . 540
−0 . 592
−0 . 610
−0 . 327
0 . 576
0 . 293
0 . 595
0 . 269
1
Shear
force
(g)
0 . 734
0 . 786
0 . 664
−0 . 851*
−0 . 827*
0 . 188
−0 . 480
−0 . 760
−0 . 622
1
Cooking
loss (%)
Myofiber
diameter
(μm)
−0 . 737
−0 . 696
−0 . 735
−0 . 759
0 . 727
0 . 539
0 . 837*
0 . 760
0 . 230
−0 . 435
1
−0 . 879*
−0 . 905*
−0 . 818*
−0 . 931**
0 . 928**
−0 . 483
0 . 619
0 . 747
0 . 529
−0 . 936**
0 . 534
Note: * P<0.05,** P<0.01
dried for longer time (Lorenzo et al., 2010; Lorenzo et al.,
2013). The water content may also be influenced by the temperature and relative humidity of air (Arnau et al., 2003).
Cooking loss decreased significantly (P<0.05) during all
process but increased during marinating. In dry salting, the
intercellular water is extracted to the surface of the flesh,
while in brine salting, the meat is soaked in a solution which
reduces the outward diffusion of water (Rora et al., 2004).
Birkeland et al. (2004) showed fillets subjected to dry salting
had significantly higher liquid loss than that of marinating.
However, Barat et al. (2002) reported that brine salting had
great water losses when saturated brine was used.
Water content was negatively correlated with shear force
(Table 3), which was in accordance with other studies
(Monin et al., 1997; Virgili et al., 1995). This is due in part
to the fact that during the drying of meat products there is
product shrinkage proportional to the water loss, increasing
the dry matter content of the sample used in the texture
analysis (Potter, 1986). This may also explain the increase
in protein and fat content at the end of the drying process.
The shrinkage of the muscle also resulted in decreased
myofiber diameter as shown in the SEM photograph (Fig. 1
& Fig. 2). The fiber diameter is highly correlated with shear
force, water, and TBA values (Table 3). The fiber diameter
of the final product was more uniform and better ordered
than those at other stages, indicating the drying time is
enough to guarantee the salt permeate into the inner duck
muscle.
L* values decreased rapidly during the whole process and
it was significantly correlated with NaCl, protein, fat, and
water content (Table 3). The decrease in L* values might be
due to the browning reaction and loss of water during the
ripening (Ventanas et al., 2007). a* and b* values was
constant during the initial processing stages, but decreased
significantly from 6 days drying to 12 days drying. It was
inferred that the reason for decreased a* and b* values was
the formation of metmyoglobin when the muscle was exposed to air (Millar et al., 1994). From the SEM photograph
Wang et al.: Changes in Dry-cured Duck
(Fig. 1 & Fig. 2), with increasing extent of hollows, myoglobin in the interior surface of the muscle had more contact
with air, making it more easily to be oxidized to metmyoglobin.
During the processing of dry-cured duck, NaCl, water, tenderness, color, lipids and protein parameters showed dramatically changes with the exception of pH value. Water
content and cooking loss decreased significantly while NaCl,
shear force and TBA increased. The changes in microstructure of duck muscle were associated with the changes in
NaCl, water, TBA and shear force. The chemical-physical
study assisted with the microstructural study could contribute
to our knowledge of exactly what changes take place during
processing, and might be useful to define and optimize the
process.
Acknowledgments
This study was supported by National Natural Science
Foundation of China (31271891), Natural Science Foundation Program of Jiangsu Province (BK2012785) and Innovation of Agricultural Science and Technology of Jiangsu
Province (CX(13)3081).
References
Argyrous G. Statistics for research: with a guide to SPSS. 3rd ed.
SAGE Publications Ltd, London. 2011.
Arnau J, Gou P and Comaposada J. Effect of the relative humidity of
drying air during the resting period on the composition and
appearance of dry-cured ham surface. Meat Science, 65:
1275-1280. 2003.
Barat JM, Rodrigues-Varona S, Andres A and Fito P. Influence of
increasing brine concentration in the cod salting process.
Journal of Food Science, 65: 1922-1925. 2002.
Birkeland S, Skara T, Bjerkeng B and Rora AMB. Product yield and
gaping in cold-smoked Atlantic salmon (Salmo sallar) fillets as
influenced by different injection-salting techniques. Journal of
Food Science, 68: 1743-1748. 2003.
Birkeland S, Rora AM, Skara T and Bjerkeng B. Effects of cold
smoking procedures and raw material of cold smoked Atlantic
salmon (Salmo salar L.) fillets. Food Research International,
27: 273-286. 2004.
Chang HJ, Xu XL, Li CB, Huang M, Liu DY and Zhou GH. A
comparison of heat-induced changes of intramuscular connective tissue and collagen of beef semitendinosus muscle during
water bath and microwave heating. Journal of Food Process
Engineering, 34: 2233-2250. 2010.
Fernandez MCD and Rodriguez JMZ. Lipolytic and oxidative
changes in ‘Chorizo’ during ripening. Meat Science, 29: 99107. 1991.
Fernandez X, Neyraud E, Astruc T and Sante V. Effects of halothane
genotype and pre-slaughter treatment on pig meat quality. Part
1. Post mortem metabolism, meat quality indicators and sensory traits of M. Longissimus lumborum. Meat Science, 62:
429-437. 2002.
Gallart-Jornet L, Barat JM, Rustad T, Erikson U and Escrche I.
Influence of brine concentration of Atlantic salmon fillet salting. Journal of Food Engineering, 80: 267-275. 2007.
Hughes MC, Kerry JP, Arendt EK, Kenneally PM, McSweeney
PLH and O’Neill EE. Characterization of proteolysis during the
ripening of semi-dry fermented sausages. Meat Science, 62:
225
205-216. 2002.
ISO. Determination of total fat content. ISO standard 1443:1973. In
International Standards Meat and Meat Products. ISO, Geneva,
Switzerland. 1973.
ISO. Determination of nitrogen content. ISO standard 937:1978. In
International Standards Meat and Meat Products. ISO, Geneva,
Switzerland. 1978.
ISO. Determination of chloride content̶Part 1: Volhard method,
ISO standard 1841-1: 1996. In International Standards Meat
and Meat Products. ISO, Geneva, Switzerland. 1996.
ISO. Determination of moisture content, ISO 1442:1997 standard. In
International Standards Meat and Meat Products. ISO, Geneva,
Switzerland. 1997.
Li YJ. Nanjing traditional food. In “Meat, poultry and egg products,” pp. 6-37. Jiangsu Science and Technology Press, Nanjing, China. 1988. (in Chinese).
Lorenzo JM, Purrinos L, Temperan S, Bermudez R, Tallón S and
Franco D. Physicochemical and nutritional composition of drycured duck breast. Poultry Science, 90: 931-940. 2010.
Lorenzo JM, Bermudez R and Franco D. Lipolysis, proteolysis, and
physico-chemical modifications during ripening of dry-cured
duck breast. European Food Research and Technology, 236:
405-417. 2013.
Meullenet J, Jonville E, Grezes D and Owens CM. Prediction of the
texture of cooked poultry pectoralis major muscles by nearinfrared reflectance analysis of raw meat. Journal of Texture
Studies, 35: 573-585. 2004.
Millar S, Wilson R, Moss BW and Ledward DA. Oxymyoglobin
formation in meat and poultry. Meat Science, 36: 397-406.
1994.
Monin G, Marinova P, Talmant A, Martin JF, Cornet M, Lanore D
and Grasso F. Chemical and structural changes in dry-cured
hams (Bayonne Hams) during processing and effects of dehairing technique. Meat Science, 47: 29-47. 1997.
Perez-Alvarez JA, Sayes-Barbare ME, Fernandez-Lopez J and
Aranda-Catala V. Physicochemical characteristics of Spanish
type dry-cured sausage. Food Research International, 32: 599607. 1999.
Potter N. Food dehydration and concentration. “Food Science.” pp.
246-302. The Avi Publishing Company Inc., New York. 1986.
Rhee KS and Ziprin YA. Pro-oxidant effects of NaCl in microbial
growth-controlled and uncontrolled beef and chicken. Meat
Science, 57: 105-112. 2001.
Rørå AM, Furuhaug R, Fjaera S and Skjervold P. Salt diffusion in
pre-rigor filleted Atlantic salmon. Aquaculture, 232: 255-263.
2004.
Sarraga C, Carreras I and Garcia JA. Influence of meat quality and
NaCl percentage on glutathione peroxidase activity and values
for acid-reactive substances of raw and dry-cured longissimus
dorsi. Meat Science, 62: 503-507. 2002.
Sorensen G and Jorgensen SS. A critical examination of some experimental variables in the 2-thiobarbituric acid (TBA) test for
lipid oxidation in meat products. Z Lebensm Unters Forsch,
202: 205-210. 1996.
Sultana A, Roy NBC, Mizunoya W, Tatsumi R, Tabata IS, Rashid
H, Katayama S and Ikeuchi Y. Quality improvement of frozen
and chilled beef biceps femoris with the application of saltbicarbonate solution. Asian-Australasian Journal of Animal
Sciences, 21: 903-911. 2008.
Tabilo G, Flores M, Fiszman SM and Toldra F. Postmortem meat
quality and sex affect textural properties and protein breakdown of dry-cured ham. Meat Science, 51: 255-60. 1999.
226
Journal of Poultry Science, 51 (2)
Toldra F, Rico E and Flores J. Cathepsin B, D, H and L activities in
the processing of dry-cured ham. Journal of the Science of
Food and Agriculture, 62: 157‒161. 1993
Toldra F and Flores M. The role of muscle proteases and lipases in
flavor development during the processing of dry-cured ham.
Critical Reviews in Food Science and Nutrition, 38: 331-352.
1998.
Ventanas S, Estevez M and Delgado CL. Phospholipid oxidation,
non-enzymatic browning development and volatile compounds
generation in model systems containing liposomes from porcine Longissimus dorsi and selected amino acids. European
Food Research and Technology, 225: 665-675. 2007.
Verplaetse A. Influence of raw meat properties and processing
technology on aroma quality of raw fermented meat products.
In Proceedings of the 40th International Congress on Meat
Science Technology, Holand, pp. 45-65. 1994.
Virgili R, Parolari G, Schivazappa C, Bordini CS and Borri M.
Sensory and texture quality of dry-cured ham as affected by
endogenous cathepsin B activity and muscle composition. Journal of Food Science, 60: 1183-1186. 1995.
Xu W, Xu X, Zhou G, Wang D and Li C. Changes of intramuscular
phospholipids and free fatty acids during the processing of
Nanjing dry-cured duck. Food Chemistry, 110: 279-284. 2008.


© Copyright 2026