
Spring 2015 - Friends of the Lake
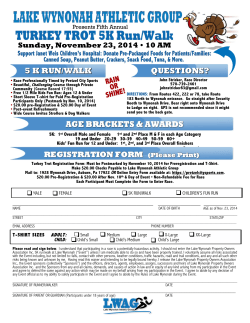
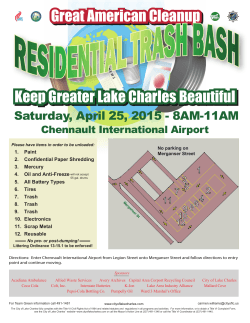
Lilly’s Letter
SPRING 2015
Photo by Lisa Rosenthal / Pinterest
Protecting & Enjoying Lake Lillinonah since 2003
Dear Friend,
As you look out over our deeply
frozen Lake Lillinonah, know that
there are lots of things percolating
under that icy surface… With this
newsletter, we wish to keep you
up-to-date on the variety of topics
that your membership is supporting.
Thank you again for being a Friend
of the Lake, and please visit our
website (www.friendsofthelake.org)
for more information about these
topics.
With Gratitude,
The Executive Board
UPDATE ON THE DANBURY WATER POLLUTION
CONTROL FACILITY
There has been significant progress in the
reduction of nutrients into our lake by the
Danbury wastewater treatment facility. Board
member Jeff Tinley has worked very hard
behind the scenes on this topic, and offers the
following summary for our members:
“The City of Danbury operates a municipal
water pollution control facility designed to
treat and discharge up to 15.5 million gallons
a day of effluent into Limekiln Brook, which
ultimately flows into Lake Lillinonah. Currently,
the Danbury facility discharges into a portion
of Limekiln Brook that has been identified on
Connecticut’s ‘List of Waters Not Meeting Water
Quality Standards.’ To address this impairment,
the Connecticut Department of Energy and
Environmental Protection (“DEEP”) developed
an interim nutrient management strategy
that focuses on removing phosphorus, since
phosphorus is the primary limiting nutrient
in freshwater systems. In 2014, DEEP issued a
tentative determination to approve Danbury’s
application for a renewed discharge
permit for the facility.
“The draft permit includes a compliance
schedule that will reduce phosphorus in the
effluent from the facility in two steps. The initial
step, which has already begun, is for Danbury
to meet a discharge limit from April through
and including October of 0.6mg/l per month.
The second step allows Danbury nine years to
plan, design and construct additional facility
improvements to meet a more stringent water
quality standard based limit. The limit that will
apply to the upgraded facility allows discharge
of 7.55 lbs/day of phosphorus, which equates to
0.10 mg/l multiplied by the seasonal average
flow of 9.05 MGD. DEEP based its decision to
adopt this two-step approach on its conclusion
that implementing the interim limit of 0.6 mg/l
now will result in a meaningful reduction in the
amount of phosphorus being discharged and
will provide a greater environmental benefit
than if DEEP had not imposed any interim limit,
but required the more stringent 0.10 mg/l limit
to be met within one permit cycle.
“In addition, in calendar year 2013 the
1
Danbury facility operated an improved nitrogen
removal system. This resulted in a net savings of more than $600,000 over the cost of
purchasing nitrogen credits if the system had
not been operating and in a payment from
DEEP to Danbury of $48,000 because the facility removed more nitrogen than was required
under the facility’s permit.”
ZEBRA MUSSEL UPDATE
As many of you have witnessed, the Zebra mussels are multiplying each year exponentially.
There are many reports throughout most of the
lake of increased populations on docks and
boats. FirstLight Power reports their presence
on the turbines at the Shepaug Dam, 100’ below
the surface of the water. We found them on the
entire length of the GLEON buoy sensor cable,
approximately 50’ down. The annual drawdown
should help keep Zebra mussels in check along
the shoreline, but we urge everyone with a boat
in the water to get a boat lift if possible. DO NOT
take your boat from this lake to another (noninfested) lake without thoroughly cleaning and
drying your boat and trailer first. Visit the CT
DEEP website for more information.
GLEON BUOY: SUMMARY OF
2014 RESULTS
Dr. Jennifer Klug of Fairfield University and
board members Rebekah White and Greg
Bollard collected data, maintained the buoy,
and studied the results during 2014. Professor
Klug presents the following summary:
“The buoy was deployed from late April
through mid-October 2014, recording water
temperature at 15 depths, dissolved oxygen
at the surface and near the bottom, specific
conductivity (a measure of dissolved ions), pH,
chlorophyll fluorescence (a measure of total
algae abundance), and phycocyanin fluorescence (a measure of cyanobacteria abundance).
2015 EVENTS
Save the Lake Day
May 23rd, 9AM, route 133 boat ramp,
Bridgewater.
Dine Around
July 25th.
Anniversary Party
August, TBD
Photo by Jeff Pranger / Google Maps
The buoy is anchored just south of the 133 Bridge. In season, a subset of the buoy data is available
at friendsofthelake.org/resources/data/.
The lake warmed slowly in our cool June and maxed out at ~82˚F in mid-July – a far cry from
some summers when the lake can reach 90˚F! One thing we pay close attention to is the oxygen levels in the bottom waters of the lake. This summer, there were periods of low oxygen in late July and
early September but most of the time the bottom had healthy amounts of oxygen. Our two measures
of algae abundance give us different information because each measures a different pigment found
in algae cells. Chlorophyll a is found in all types of algae and cyanobacteria so chlorophyll fluorescence give an estimate of total algae abundance. We saw two peaks in chlorophyll – one in early
spring during the period when diatoms are in high abundance and another in late July during the
Ceratium bloom. Phycocyanin is only found in cyanobacteria so phycocyanin fluorescence gives an
estimate of cyanobacteria abundance. Cyanobacteria are the blue-green colored species that cause
our common surface blooms. Phycocyanin data shows that cyanobacteria were common from early
July through mid-September. There was a large peak in phycocyanin in late July and early August.
Stay tuned for more information about water quality in 2014 after more data from the buoy and the
dock monitoring programs are analyzed!”
One of Dr. Klug’s Fairfield University students, Maria Galluzzo, helped study results from the
GLEON buoy and other water quality measurements taken from Lake Lillinonah last summer, and
offers the following information:
“Did you see a red cloud in the lake last summer? If so, we’d like to hear about it! In July of last
summer a red bloom was observed in the Shepaug and Rt. 133 area of the lake. Although related
to the “red tide” found in oceans, the red bloom in Lillinonah was caused by a non-toxic species Ceratium hirundinella. Ceratium are dinoflagellates that resemble the Eiffel tower and use a
flagellum to swim around. They perform vertical movement throughout the water column, bringing
with them nutrients as they move between the different layers of the lake. Observer (and FOTL
board member) Rebekah White described the red bloom as a “rusty reddish/brown color” found
in patches along the lake. This red bloom corresponds to a high concentration of Ceratium that
was microscopically analyzed in a sample taken at the buoy on July 23, 2014. While Ceratium are
commonly seen in samples taken throughout the summer this is the first time a visible bloom was
reported. Further analysis is needed to determine what may have caused this red bloom. If you
noticed the Ceratium bloom this summer, please email Maria Galluzzo at maria.galluzzo@student.
fairfield.edu and let her know where you saw it.”
Debris Collection Day
Late September, TBD
Friends of the Lake friendsofthelake.org
2
DEBRIS SURVEY RESULTS
FotL volunteers, with the support of the LLA,
performed a third annual debris survey on Lake
Lillinonah on September 20, 2014.
Using USDA Forest Service Guidelines for
sampling, estimation and analysis, the survey
showed that over 4,500 cubic yards of debris
remain on the shores of Lake Lillinonah. Our
survey also showed an increase from 2013 to
2014 of 1,576 cubic yards of debris. One factor
in this increase is likely due to the change of
location of the 41 plots from prior years. Though
both the prior and the current plots are randomly selected and evenly distributed around
the shoreline, it was the general consensus of
the participants of our prior studies that the
prior plots were not representative of the typical
shoreline. The new plots are placed approximately half-way between the prior plots, and
will be used during future surveys.
The true problem we have on
Lake Lillinonah – the thousands
of cubic yards of debris that
remain on the shoreline
FOTL will continue to perform annual debris
surveys, using the plots established this year,
to document the true problem we have on Lake
Lillinonah – the thousands of cubic yards of
debris that remain on the shoreline.
Here is the summary report provided by our
contractor, Connwood Foresters:
Data Collection: On 9/20/14, volunteers collected woody debris data for 41 sample plots
along the shore of Lake Lillinonah. Volunteers
traveled to each sample plot by boat. Sample
plots were randomly located and evenly distributed around the shore of the lake (~4600’
spacing). Plots were mapped with ArcView GIS
and then the lat/long coordinates of these plots
were located and flagged on 9/17/2014. The 41
plots are a 2% sample of the total length of the
shore (39.5 miles). These are new plot locations from the previous 2 years and are located
roughly half way between the old plot locations.
Each plot consists of 100’ of shoreline from the
water’s edge to the high water mark. At each
plot the following was recorded: average plot
width, adjacent land use, the dimensions of all
woody debris whose large end falls within plot,
dimensions of all woody piles whose center falls
within plot, and the decay class of each piece/
pile. Pieces must have a small diameter of more
than 1” and have over a half foot of length to be
recorded. Forks off a main tree stem are tallied
as separate pieces. Methods are based on USDA
Forest Service Guidelines: “Sampling Protocol,
Estimation, and Analysis Proceduresfor the
Down Woody Materials Indicator of the FIA
Program Report NRS-22”
Friends of the Lake friendsofthelake.org
Photo by Gloria Owens/ Flickr
RESULTS:
Adjacent Land Use: 6 residential plots (15%)
and 35 forested plots (85%)
Plot Size: Plots averaged 5’ wide and total
sampled plot area was 21,350 sqft. Plot Debris:
68,453 pieces having 55,172 cubic feet of material, with an average of 0.8 cuft/piece
Piles: 3,512 piles having 68,710 cubic feet of
material, with an average of 19.6 cuft/pile
Entire Lake: 123,882 cubic feet of material in
68,453 pieces and 3,512 piles
2012
2013
2014
Shore ft
208666
208666
208666
Plots
40
41
41
Sample ft
4000
4100
4100
Lake Cuft
101041
81328
123882
Lake Pieces
104750
91050
68453
Lake Piles
574
1171
3512
Friends of the Lake is a non-profit organization founded in 2003 to
improve Lake Lillinonah for the recreational enjoyment for those who
use it, to improve its water quality to the standards set forth in the
Clean Water Act, and for the long-term environmental protection of
this beautiful section of the Housatonic River and its watershed.
Friends of the Lake, Inc.
PO Box 403
Bridgewater, CT 06752
T (860) 210-8064 F (860) 210-9894
friendsofthelake.org
3
Join FOTL
Become a member of Friends of the Lake
SPRING 2015
MEMBERSHIP
Do you have a new neighbor? A friend or neighbor who might join our cause? Please let them know about Friends of the Lake, and ask them to help us!
Each new member helps strengthen our voice and fund the projects discussed above (and others, too!).
Thank you for your membership — please renew this year!
Looking forward to seeing you out on a cleaner, safer lake,
Jeffrey Silverman
Chairman
Friends of the Lake
Simply fill out the form below and mail it with a check made out to Friends of the Lake to:
Friends of the Lake
PO Box 403
Bridgewater, CT 06752
Membership Level
Annual Cost
Patron
$50
Family
$100
Lake Supporter
$500
Landscaper
$1,000
Lake Guardian
$2,500
Lake Protector
$5,000
Corporate
$5,000
Check One
First and Last Name
Company Name
Address Line 1
Address Line 2
Email
Phone
Please provide the name of your landscaper
Friends of the Lake friendsofthelake.org
4

© Copyright 2026