
nevada slot machines: historical hold percentage variations
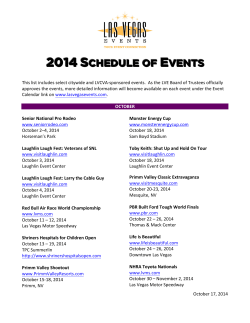
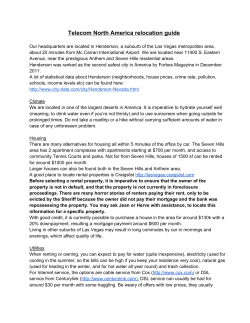
N EVADA S LOT M ACHINES :
H ISTORICAL H OLD P ERCENTAGE V ARIATIONS
ANNUAL AND MONTHLY HOLD PERCENTAGES, 2004-2015
CENTER FOR GAMING RESEARCH, JUNE 2015
Executive Summary
Hold percentage—the portion of money gambled that the casino retains—has a huge impact on casino
revenues. Even if handle (overall play) rises in a period, a decline in hold percentage can mean a drop in
casino revenues. Players naturally prefer a low hold percentage, which returns on average more money
to them, while casinos look to balance higher hold with the need to keep players happy.
Looking at the eleven largest (by revenue) reporting areas in Nevada, the geographic trend is clear: the
Las Vegas Strip has a significantly higher hold than other reporting areas, followed by South Shore Lake
Tahoe and Laughlin. At the bottom of the scale, North Shore Lake Tahoe, the Boulder Strip, and Reno
have progressively lower slot holds.
Though slot hold has increased, on average, since 2004, there has been a great deal of fluctuation in the
monthly hold, and on from month to month there is little predictability about exactly which way slot
hold is trending.
Contents
Definitions
Variance by Reporting Area
Variance by Year
Variance by Month
Statewide
LV Strip
Downtown LV
North Las Vegas
Laughlin
Boulder Strip
Mesquite
South Shore Lake Tahoe
North Shore Lake Tahoe
Elko
Reno
Monthly Hold Percentages
Preferred Citation
University Libraries | University of Nevada, Las Vegas
2
2
3
4
4
5
5
6
6
7
7
8
8
9
10
12
1
Definitions
Throughout this report, slot hold is understood as the average slot hold percentage (or win percentage)
for the period in question as released by the Nevada Gaming Control Board in its Gaming Revenue
Reports.
Statewide: Results for all non-restricted licenses throughout Nevada
Downtown: Downtown Las Vegas
LV Strip: Las Vegas Strip
NLV: North Las Vegas
Boulder: Boulder Strip (Las Vegas area)
SSLT: South Shore Lake Tahoe
NSLT: North Shore Lake Tahoe
Monthly data is for the period January 2004 to March 2014. Annual data is for the period 2004 to 2014.
Variance by Reporting Area
There is a consistent discrepancy between reporting areas in slot hold; hold in the area with the highest
reported hold, the Las Vegas Strip, is nearly 41% higher than the lowest reporting area, Reno.
Slot Hold by Reporting Area, January 2004 – May 2015 (Average)
Reporting Area
Las Vegas Strip
Laughlin
South Shore Lake Tahoe
Downtown Las Vegas
Statewide
Elko
Mesquite
North Las Vegas
North Shore Lake Tahoe
Boulder Strip
Reno
Average Hold
7.81
7.51
5.58
6.56
6.41
5.93
5.86
5.44
5.46
4.8
5.37
10.00
8.00
6.00
4.00
2.00
0.00
University Libraries | University of Nevada, Las Vegas
2
Variance by Year
Although there is a great deal of variability from month to month, in general slot hold percentages have
been climbing slightly over the past eight years. But on average, the Statewide slot hold increased by
11.96% from 2004 to 2014.
8
7
Statewide
6
Downtown
5
LV Strip
4
NLV
3
Laughlin
2
Boulder
1
Mesquite
0
2004 2005 2006 2007 2008 2009 2010 2011 2012 2013 2014
SSLT
Hold Percentage by Year
Year
2004
2005
2006
2007
2008
2009
2010
2011
2012
2013
2014
2015 YTD
Average
Change
Statewide Downtown
5.72
5.87
5.84
6.09
6.02
6.33
6.13
6.54
6.16
6.59
6.10
6.50
6.19
6.37
6.26
6.41
6.34
6.69
6.42
6.59
6.40
6.73
6.59
6.86
6.18
6.46
15.21%
16.80%
LV
Strip
NLV Laughlin Boulder Mesquite
6.52
4.97
6.21
4.86
5.21
6.56
5.27
6.41
5.03
5.70
6.82
5.53
6.60
5.24
6.18
6.92
5.63
6.74
5.27
6.33
7.03
5.64
6.74
5.20
5.64
7.09
5.82
6.86
5.07
5.59
7.22
5.86
7.12
5.21
5.64
7.34
6.09
7.17
5.23
5.60
7.47
6.18
7.44
5.42
5.72
7.56
6.21
7.27
5.58
5.67
7.41
6.25
7.48
5.64
5.80
7.87
6.31
7.63
5.53
5.89
7.15
5.81
6.97
5.27
5.75
20.64% 27.00% 22.83% 13.79%
13.13%
University Libraries | University of Nevada, Las Vegas
SSLT
Elko
6.41
5.42
6.69
5.68
6.90
5.71
7.02
6.18
7.40
6.22
6.60
6.24
6.90
6.11
6.51
6.20
6.44
5.92
6.22
5.88
6.18
5.90
5.82
5.95
6.59
5.95
-9.14% 9.70%
Reno
5.16
5.06
5.14
5.17
5.23
4.90
4.84
4.92
4.90
5.13
5.07
5.08
5.05
-1.55%
NSLT
5.89
5.91
5.71
5.49
5.79
5.58
5.58
5.45
5.59
5.61
5.61
5.51
5.64
-6.42%
3
Monthly Hold Percentages, January 2004 – May 2015
Month
Jan-04
Feb-04
Mar-04
Apr-04
May-04
Jun-04
Jul-04
Aug-04
Sep-04
Oct-04
Nov-04
Dec-04
Jan-05
Feb-05
Mar-05
Apr-05
May-05
Jun-05
Jul-05
Aug-05
Sep-05
Oct-05
Nov-05
Dec-05
Jan-06
Feb-06
Mar-06
Apr-06
May-06
Jun-06
Jul-06
Aug-06
Sep-06
Oct-06
Nov-06
Dec-06
Jan-07
Feb-07
Mar-07
Apr-07
May-07
Jun-07
Jul-07
Aug-07
Statewide
5.41
5.75
6.07
5.50
5.51
6.22
5.29
6.26
6.11
5.38
6.02
5.21
5.87
5.64
6.39
5.37
6.18
6.21
5.50
6.42
5.74
5.88
6.16
4.72
6.75
5.85
6.05
5.79
6.25
5.97
5.82
6.40
5.49
6.47
6.26
5.17
6.83
5.79
5.66
6.49
6.47
5.55
6.44
5.96
Downtown
5.48
6.12
5.72
5.86
6.09
5.69
5.76
6.12
6.22
5.88
6.05
5.48
5.57
5.94
6.71
5.62
6.56
6.26
5.83
6.52
6.33
6.18
6.52
5.14
6.39
6.07
6.45
6.34
6.96
5.92
6.41
6.32
5.75
7.22
6.60
5.46
7.05
6.15
6.07
7.28
7.01
5.50
7.37
6.23
LV Strip
6.52
6.59
6.86
6.41
6.11
7.30
6.20
6.87
6.83
6.30
6.74
5.59
6.80
6.27
7.22
6.16
6.94
6.99
6.18
7.27
6.46
6.65
6.94
5.09
8.14
6.61
6.74
6.70
6.94
6.94
6.53
7.28
6.09
7.41
7.12
5.63
8.30
6.40
6.43
7.34
7.45
6.03
7.18
6.72
NLV
4.03
5.10
5.97
3.51
4.85
5.79
3.84
6.24
5.49
4.09
5.67
5.17
5.11
5.28
5.76
3.65
6.28
5.89
4.20
6.46
5.00
4.98
6.39
4.02
6.49
5.44
5.53
4.78
6.20
5.02
5.11
6.57
4.32
6.31
6.07
4.54
6.59
5.26
4.38
6.15
6.28
4.50
7.18
5.17
University Libraries | University of Nevada, Las Vegas
Laughlin
6.00
6.30
6.27
6.45
5.94
6.51
6.15
6.42
6.28
6.17
6.40
5.81
6.59
6.20
6.63
6.46
6.48
6.69
6.25
6.55
6.66
6.09
6.60
5.75
6.95
6.54
6.59
6.68
7.16
6.33
6.32
6.95
6.28
6.94
6.76
5.58
7.18
6.65
6.62
7.15
6.80
6.42
6.92
6.80
Boulder
4.06
4.95
5.66
4.14
4.74
5.89
3.58
5.93
5.57
3.77
5.59
4.60
5.20
5.03
5.75
3.97
5.65
5.66
4.32
6.14
4.73
4.86
5.81
3.43
6.37
5.11
5.44
4.81
5.78
4.77
5.10
5.67
3.88
6.04
5.57
4.27
6.16
4.91
4.39
5.79
5.66
4.50
5.95
4.52
Mesquite
5.30
4.76
5.35
5.22
5.18
4.94
5.54
5.47
5.42
5.42
5.27
7.37
5.49
5.71
5.82
4.87
5.52
6.47
5.25
4.91
6.25
5.43
5.79
6.96
4.86
5.53
7.36
5.41
5.95
6.16
6.50
6.13
5.08
6.75
7.50
6.75
4.52
7.16
4.71
8.78
6.33
4.37
8.41
5.64
SSLT
4.95
6.11
7.02
5.56
6.43
5.86
5.16
8.32
8.35
5.11
6.29
5.29
3.99
5.37
10.22
6.44
7.34
6.67
6.89
7.64
7.17
7.36
5.58
4.84
9.05
7.04
5.06
8.17
6.27
6.94
6.33
8.04
6.36
7.99
6.69
5.13
9.63
6.96
4.31
6.10
9.12
7.36
7.21
7.04
Elko
4.70
5.25
5.44
5.21
4.90
6.06
5.07
5.69
5.51
5.59
6.02
5.29
5.73
5.73
5.80
5.70
5.86
5.74
5.79
5.92
5.43
5.59
5.69
5.27
6.03
5.87
5.47
5.76
5.62
5.54
5.62
5.84
5.67
5.85
5.82
5.52
5.87
6.02
6.01
6.10
6.21
6.23
6.26
6.22
Reno
4.77
5.00
5.17
5.21
5.41
5.23
5.10
5.43
5.30
5.09
5.24
4.85
4.70
4.83
5.24
5.11
5.15
5.19
5.15
5.25
5.04
5.01
5.13
4.72
4.83
4.95
5.11
5.27
5.38
5.07
5.33
5.11
5.27
5.23
4.91
5.00
4.71
5.02
5.16
5.39
5.23
5.30
5.04
5.37
NSLT
5.70
5.70
5.10
5.34
5.58
5.60
5.87
6.84
6.67
6.02
5.82
5.69
7.16
5.79
6.26
5.83
5.58
5.74
6.04
5.96
5.75
4.94
5.48
6.72
4.89
5.76
5.37
5.74
5.75
5.85
6.26
5.57
5.75
5.68
5.41
5.98
5.13
5.79
5.21
5.95
5.97
5.69
4.96
5.45
4
Sep-07
Oct-07
Nov-07
Dec-07
Jan-08
Feb-08
Mar-08
Apr-08
May-08
Jun-08
Jul-08
Aug-08
Sep-08
Oct-08
Nov-08
Dec-08
Jan-09
Feb-09
Mar-09
Apr-09
May-09
Jun-09
Jul-09
Aug-09
Sep-09
Oct-09
Nov-09
Dec-09
Jan-10
Feb-10
Mar-10
Apr-10
May-10
Jun-10
Jul-10
Aug-10
Sep-10
Oct-10
Nov-10
Dec-10
Jan-11
Feb-11
Mar-11
Apr-11
May-11
Jun-11
Jul-11
Aug-11
6.22
6.72
5.93
5.57
6.90
5.76
6.30
6.40
5.76
6.47
6.34
5.47
6.99
6.10
5.73
5.81
6.03
6.13
6.46
6.17
5.58
6.34
6.17
6.04
6.40
5.80
6.28
5.72
6.42
5.84
6.70
6.04
6.06
6.55
5.82
6.61
6.45
5.93
6.67
5.27
6.92
6.01
6.65
5.89
6.45
6.49
5.73
6.75
6.38
7.11
6.19
6.09
6.85
6.19
6.80
6.98
5.84
6.95
6.97
6.02
7.11
6.55
6.40
6.54
5.77
6.57
7.55
6.46
5.83
7.16
6.35
6.67
6.72
5.72
7.07
6.07
5.80
6.17
7.09
6.14
6.62
6.93
5.23
7.33
6.47
6.03
7.16
5.39
6.72
6.07
7.08
5.65
7.49
6.42
5.80
7.11
7.10
7.68
6.61
5.93
8.59
6.58
6.96
7.32
6.74
6.99
7.42
5.92
8.13
7.19
6.85
5.91
7.51
7.21
7.39
7.29
6.47
7.30
7.17
6.80
7.47
6.80
7.20
6.48
7.74
6.50
7.79
7.19
6.94
7.68
6.83
7.78
7.65
6.89
8.21
5.66
8.67
7.09
7.83
6.82
7.66
7.38
6.48
8.07
University Libraries | University of Nevada, Las Vegas
5.41
6.86
4.56
6.00
6.06
4.88
6.67
5.33
4.51
7.45
5.19
4.45
7.21
4.80
4.09
7.39
4.74
6.04
7.47
5.45
4.55
6.61
5.94
5.76
6.38
4.82
6.07
6.17
5.50
5.88
7.21
5.23
5.98
6.82
4.72
7.22
6.00
4.53
6.52
4.90
6.69
5.74
7.12
4.73
6.88
6.90
5.39
7.20
6.23
7.03
6.80
6.17
6.86
6.75
6.41
7.42
6.50
6.90
6.80
6.57
7.01
6.80
6.52
6.28
6.74
6.56
7.21
7.11
6.51
7.37
6.71
6.62
7.36
6.38
7.26
6.60
6.66
7.08
7.83
6.98
6.98
7.28
6.90
7.02
7.60
6.63
7.20
7.22
6.82
6.96
7.93
6.89
6.37
8.47
6.89
7.17
5.38
6.22
4.28
5.53
5.38
4.37
5.78
5.70
4.07
6.76
5.22
3.87
6.83
4.65
3.90
6.11
4.49
5.02
5.45
5.15
4.24
5.59
5.14
5.38
5.22
4.71
5.38
4.75
5.70
5.16
5.95
4.63
5.55
5.61
4.68
5.64
5.53
4.53
5.54
4.06
6.35
4.83
5.81
4.64
5.53
5.93
4.23
6.15
7.20
7.03
5.59
6.33
5.99
4.48
6.66
5.40
5.79
5.55
5.50
5.75
5.73
5.71
5.57
5.41
5.41
5.68
5.49
5.42
5.71
5.60
5.49
5.68
5.72
5.85
5.55
5.49
5.45
5.86
5.83
5.86
5.70
5.71
5.65
5.57
5.47
5.57
5.37
5.55
5.53
6.01
5.89
5.84
5.82
5.62
5.52
5.48
7.30
8.44
6.18
4.43
10.45
6.66
8.41
6.72
6.95
6.83
7.98
7.04
8.16
7.14
6.82
5.96
7.65
7.66
6.80
5.94
6.12
7.36
6.73
6.70
8.32
5.22
7.16
3.90
9.38
4.84
8.92
5.74
5.48
7.74
6.28
8.47
7.72
5.73
7.60
5.18
7.86
6.27
6.40
6.14
6.94
6.17
6.26
8.02
6.21
6.36
6.47
5.98
6.24
6.33
6.50
6.28
6.18
6.49
6.15
6.16
6.11
6.10
5.99
6.08
5.92
6.21
6.49
6.24
6.30
6.41
6.10
6.41
6.10
6.14
6.39
6.12
6.14
6.25
6.19
6.19
6.27
6.00
5.86
6.32
5.92
6.07
6.13
6.01
6.37
6.17
6.08
6.04
6.16
6.21
6.24
6.28
5.44
5.26
5.23
4.74
5.05
5.05
5.42
5.34
5.34
5.24
5.40
5.40
5.33
5.42
5.07
4.47
5.08
4.88
4.80
5.01
4.96
5.00
5.07
5.01
5.07
4.85
4.84
4.08
4.87
4.74
4.71
4.86
4.82
4.82
5.17
4.82
4.81
5.27
4.63
4.38
4.96
4.75
4.90
5.20
4.90
4.95
5.19
4.88
5.72
4.95
5.33
6.06
5.16
5.81
5.18
5.21
5.90
5.85
6.57
6.21
5.72
5.31
5.60
6.11
5.25
5.02
5.20
5.25
5.14
5.78
5.82
5.69
6.37
5.73
5.21
5.78
5.06
5.45
5.06
5.29
5.54
5.67
5.49
5.68
6.02
5.69
5.72
5.98
5.08
4.45
5.33
5.76
5.73
4.97
5.76
5.17
5
Sep-11
Oct-11
Nov-11
Dec-11
Jan-12
Feb-12
Mar-12
Apr-12
May-12
Jun-12
Jul-12
Aug-12
Sep-12
Oct-12
Nov-12
Dec-12
Jan-13
Feb-13
Mar-13
Apr-13
May-13
Jun-13
Jul-13
Aug-13
Sep-13
Oct-13
Nov-13
Dec-13
Jan-14
Feb-14
Mar-14
Apr-14
May-14
Jun-14
Jul-14
Aug-14
Sep-14
Oct-14
Nov-14
Dec-14
Jan-15
Feb-15
Mar-15
Apr-15
May-15
6.16
6.19
6.81
5.19
7.06
6.33
6.05
6.56
6.66
5.86
6.68
6.21
6.23
6.92
6.18
5.31
7.30
6.28
6.20
6.70
6.43
6.12
6.69
6.03
6.79
6.57
5.73
6.20
6.71
6.35
6.53
6.56
6.14
6.67
6.50
5.87
6.83
6.39
6.15
6.15
6.34
6.56
6.77
6.87
6.41
6.03
6.70
7.23
4.53
7.94
6.74
5.76
7.91
7.24
5.44
7.49
6.21
6.69
7.35
6.30
5.27
7.48
6.29
6.14
7.30
6.38
6.54
7.32
5.34
7.21
7.05
5.43
6.70
6.59
6.57
6.78
7.26
5.80
7.75
7.26
5.59
7.41
6.56
6.55
6.63
5.67
6.72
7.56
7.77
6.56
7.25
7.04
8.40
5.82
8.71
7.43
7.20
7.71
7.96
6.97
7.75
7.52
7.24
8.14
7.26
5.99
8.91
7.35
7.64
7.56
7.77
7.18
7.39
7.49
8.10
7.43
7.00
7.06
7.95
7.47
7.78
7.42
7.41
7.53
7.41
7.00
7.62
7.49
7.32
6.51
7.78
7.94
7.66
8.14
7.81
5.42
6.29
6.52
4.29
8.32
6.16
5.36
7.34
6.55
4.47
7.49
5.69
5.76
6.99
5.02
5.15
7.65
5.93
5.53
6.86
5.86
5.88
7.25
4.68
7.35
6.78
4.08
6.86
6.40
6.06
6.52
6.64
4.86
7.40
7.02
5.04
7.39
5.48
5.80
6.35
5.62
6.02
7.92
6.56
5.44
7.28
7.09
7.51
6.62
7.60
7.16
7.86
7.37
8.22
6.83
7.46
7.21
7.25
7.47
7.65
7.07
7.48
7.53
6.67
7.96
7.56
7.15
7.97
7.09
6.89
7.94
6.43
6.48
7.89
7.15
7.33
7.98
7.14
7.51
7.75
6.78
7.60
7.59
7.2
7.78
7.01
7.54
7.85
8.23
7.51
4.72
5.34
5.81
3.70
6.82
5.68
4.48
5.75
6.10
4.38
6.27
4.91
5.25
6.43
4.90
4.19
7.39
5.35
4.59
6.50
5.27
4.96
6.97
4.10
6.08
6.45
3.66
5.75
6.13
5.36
5.66
6.46
4.56
6.25
6.44
3.95
6.88
4.89
4.9
6.17
4.73
5.59
6.73
5.8
4.8
5.43
5.54
5.29
5.13
5.48
5.74
5.98
5.95
5.68
5.82
5.63
5.66
5.57
5.70
5.75
5.54
5.74
5.74
5.93
5.76
5.23
5.62
5.59
5.55
5.72
5.95
5.52
5.64
5.85
5.84
5.88
5.85
5.80
5.38
5.76
5.72
5.92
5.82
5.95
5.82
5.84
5.99
5.92
5.86
5.86
6.51
6.20
7.48
3.65
9.68
6.07
4.77
7.28
6.15
5.77
7.00
7.17
5.85
8.97
5.13
4.34
5.78
7.02
4.29
8.06
5.79
5.11
7.64
5.72
7.47
5.83
5.84
5.86
6.74
6.45
4.99
4.09
6.69
6.12
4.56
6.33
10.12
7.4
4.42
6.19
5.41
5.45
5.16
7.52
5.58
6.42
6.42
6.02
6.06
6.23
6.00
5.59
6.16
5.93
5.72
6.16
5.88
5.95
6.17
5.90
5.36
5.67
5.84
5.93
6.00
5.64
5.59
6.15
5.92
6.01
5.95
5.76
6.07
5.73
5.81
6.06
5.82
5.75
6.04
5.86
6.09
5.99
5.91
5.64
6.06
5.61
5.94
6.21
6.04
5.93
5.01
4.87
4.88
4.53
4.70
4.85
4.89
4.40
4.93
5.49
5.09
4.95
5.00
5.07
4.94
4.44
4.98
4.95
5.24
5.21
5.37
5.22
5.29
5.33
4.93
4.96
4.97
4.83
4.69
5.03
4.80
5.11
5.33
5.17
5.00
5.19
5.21
5.22
4.90
5.21
4.91
5.06
5.09
4.97
5.37
5.88
5.77
5.20
6.09
5.20
5.27
6.38
5.48
5.56
5.83
5.41
5.62
6.04
5.17
5.72
5.31
5.53
5.06
6.36
5.96
5.37
5.93
5.72
5.48
5.48
5.75
5.33
5.33
4.74
5.29
I 5.46
5.91
5.84
5.29
5.81
5.84
5.41
5.79
5.78
6.13
5.74
5.57
5.48
5.31
5.46
All data taken from Gaming Revenue Reports for their respective months; accessible at
http://gaming.nv.gov/gaming_revenue_rpt.htm
University Libraries | University of Nevada, Las Vegas
6
Data entry by Alexis Rajnoor.
Preferred citation:
David G. Schwartz. Nevada Slot Machines: Historical Hold Variations. Las Vegas: Center for Gaming
Research, University Libraries, University of Nevada Las Vegas, 2015.
Questions? Contact: Dr. David G. Schwartz, Director, Center for Gaming Research
phone (702) 895-2242 | [email protected]
University Libraries | University of Nevada, Las Vegas
7


© Copyright 2026