
Energy transfers (food chain and pyramis)
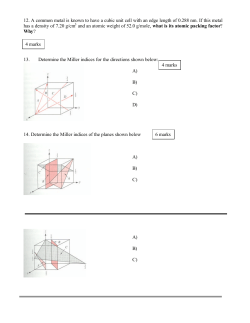
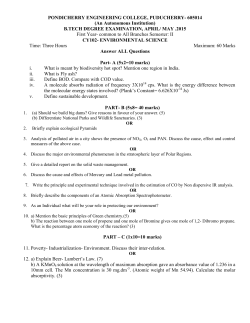
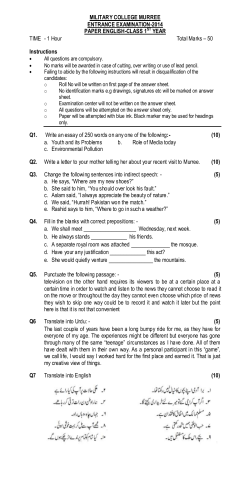
Energy transfers (food chain and pyramis)
105 minutes
105 marks
Page 1 of 38
Q1.
(a)
One food chain in the wood is:
Hazel tree nuts → squirrels → owls
(i)
What does this food chain tell us?
...........................................................................................................................
...........................................................................................................................
(2)
(ii)
Which one of the organisms in the food chain is a producer?
...........................................................................................................................
(1)
(iii)
This year the hazel bushes have produced very few nuts.
Explain, as fully as you can, how this might affect the populations of:
1. squirrels;
...........................................................................................................................
...........................................................................................................................
...........................................................................................................................
...........................................................................................................................
2. owls.
...........................................................................................................................
...........................................................................................................................
...........................................................................................................................
...........................................................................................................................
(4)
Page 2 of 38
(b)
An area of the floor of the wood 1 m² was fenced off so that animals could not reach it.
The graph below shows the depth of leaf litter (dead leaves) inside the fence over the next
few months.
Explain, as fully as you can,
(i)
why the depth of the leaf litter decreased;
...........................................................................................................................
...........................................................................................................................
...........................................................................................................................
(1)
(ii)
how this decrease happened.
...........................................................................................................................
...........................................................................................................................
...........................................................................................................................
(1)
(iii)
In which month does leaf litter disappear fastest? Explain why.
...........................................................................................................................
...........................................................................................................................
...........................................................................................................................
...........................................................................................................................
(2)
(Total 11 marks)
Page 3 of 38
Q2.
This is a simple food chain.
Lettuce plant → Slug → Frog → Heron
The diagram shows a pyramid of biomass for this food chain.
(a)
Write the names of the organisms in the food chain on the correct lines next to the
pyramid of biomass.
(1)
(b)
(i)
The slug obtains its energy from the lettuce plant. What is the source of energy for
the lettuce plant?
...........................................................................................................................
(1)
(ii)
What is the function of chlorophyll in a lettuce plant?
...........................................................................................................................
(1)
(iii)
The slugs ate some lettuce plants which contained 1620 kJ of energy. Only 10 per
cent of this energy is used by the slugs for growth. Use the formula to calculate how
much energy can be used by the slugs for growth. Show clearly how you work out
your final answer.
Amount of energy =
...........................................................................................................................
...........................................................................................................................
...........................................................................................................................
Amount of energy = ................................................... kJ
(2)
(Total 5 marks)
Page 4 of 38
Q3.
A fish farmer keeps trout in a large net in a lake.
The fish farmer feeds the trout on food made from soya beans.
When the trout are large enough the farmer sells them for food for people.
(a)
Draw a pyramid of biomass for the three organisms in this food chain.
Label the pyramid.
(2)
Page 5 of 38
(b)
It would be more energy efficient if people ate the soya beans rather than eating the trout.
Which two of the following are reasons for this?
Tick ( ) two boxes.
Some people do not like eating animals such as trout.
The trout release energy when they respire.
Soya bean plants release energy when they respire.
Some energy will be lost in waste from the trout.
Soya bean plants absorb energy during photosynthesis.
(2)
(c)
Suggest one advantage to the fish farmer of keeping the trout in a large net instead of
letting them swim freely in the lake.
........................................................................................................................
........................................................................................................................
(1)
(d)
Some trout die before they are large enough to be sold.
The dead trout contain carbon.
Use your knowledge of the carbon cycle to describe how this carbon is returned to the
atmosphere after the trout die.
........................................................................................................................
........................................................................................................................
........................................................................................................................
........................................................................................................................
........................................................................................................................
(2)
(Total 7 marks)
Page 6 of 38
Q4.
The picture shows a food chain.
(a)
Which diagram shows a pyramid of biomass for the food chain in the picture?
Tick ( ) one box.
(1)
(b)
The plants at the start of the food chain absorb energy.
Where does this energy come from?
Draw a ring around one answer.
the water
the sun
minerals
(1)
Page 7 of 38
(c)
Some energy is lost at each stage of the food chain.
Give two ways in which energy may be lost from the food chain.
1 .....................................................................................................................
........................................................................................................................
2 .....................................................................................................................
........................................................................................................................
(2)
(Total 4 marks)
Q5.
Green plants are found at the start of all food chains.
(a)
Complete the sentences.
(i)
The source of energy for green plants is radiation from the ..............
(1)
(ii)
Green plants absorb some of the light energy that reaches them for a
process called ............................................................
(1)
(b)
Draw a ring around the correct answer to complete each sentence.
chemical
(i) This process transfers light energy into
sound
energy.
electrical
(1)
carbon dioxide.
(ii) The process uses the gas
oxygen.
water.
(1)
carbohydrates.
(iii) The process produces carbon-containing compounds called
minerals.
salts.
(1)
Page 8 of 38
(c)
The amount of living material (biomass) at each stage in a food chain is less than at the
previous stage.
The diagram shows a food chain.
oak tree
caterpillar
blue-tit
hawk
Give two ways in which biomass is lost in this food chain.
Tick ( ) two boxes.
As carbon dioxide from the caterpillar
As food eaten by the hawk
As oxygen from the oak tree
As faeces (droppings) from the blue-tit
(2)
(Total 7 marks)
Q6.
In this question you will be assessed on using good English, organising information clearly
and using specialist terms where appropriate.
The diagram shows part of the carbon cycle.
Page 9 of 38
Describe how living things are involved in the constant cycling of carbon.
.................................................................................................................................
.................................................................................................................................
.................................................................................................................................
.................................................................................................................................
.................................................................................................................................
.................................................................................................................................
.................................................................................................................................
.................................................................................................................................
.................................................................................................................................
.................................................................................................................................
.................................................................................................................................
.................................................................................................................................
.................................................................................................................................
.................................................................................................................................
.................................................................................................................................
.................................................................................................................................
.................................................................................................................................
(Total 6 marks)
Q7.
There are two forms of peppered moth, dark and pale.
Birds eat the moths when the moths are resting on tree bark.
Pollution in the atmosphere may:
•
kill lichens living on tree bark
•
make the bark of trees go black.
(a)
Draw a ring around the correct answer to complete the sentence.
carbon dioxide.
Lichens are very sensitive to air pollution caused by
nitrogen.
sulfur dioxide.
(1)
Page 10 of 38
(b)
The photographs show the two forms of peppered moth, on tree bark.
Tree bark covered with lichens
Tree bark made black by pollution
© Kim Taylor/Warren Photographic
(i)
The dark form of the peppered moth was produced by a change in the genetic material of a
pale moth.
Use one word from the box to complete the sentence.
characteristic
clone
mutation
A change in genetic material is called a ...............................................................
(1)
(ii)
In the 19th century, pollution made the bark of many trees go black.
Explain why:
•
the population of the pale form of the moth in forests decreased
•
the population of the dark form of the moth in forests increased.
...............................................................................................................
...............................................................................................................
...............................................................................................................
...............................................................................................................
...............................................................................................................
...............................................................................................................
...............................................................................................................
...............................................................................................................
(3)
Page 11 of 38
(c)
(i)
The larvae (young) of the peppered moths eat the leaves of birch trees.
The diagram shows the food chain:
birch trees → peppered moth larvae → birds
Draw a pyramid of biomass for this food chain.
Label the pyramid.
(2)
(ii)
Which two reasons explain the shape of the pyramid you drew in part (c)(i)?
Tick ( ) two boxes.
Some material is lost in waste from the
birds
The trees are much larger than peppered
moth larvae
Peppered moth larvae do not eat all the
leaves from the trees
The trees do not use all of the Sun’s energy
(2)
(Total 9 marks)
Page 12 of 38
Q8.
In this question you will be assessed on using good English, organising information clearly
and using specialist terms where appropriate.
The diagram below shows a food web for some of the organisms that live on moorland.
Only a small percentage of the Sun’s energy captured by the heather is eventually incorporated
into the body tissues of the fox.
Explain, as fully as you can, what happens to the rest of the energy captured by the heather.
.................................................................................................................................
.................................................................................................................................
.................................................................................................................................
.................................................................................................................................
.................................................................................................................................
.................................................................................................................................
.................................................................................................................................
.................................................................................................................................
.................................................................................................................................
.................................................................................................................................
.................................................................................................................................
(Total 6 marks)
Page 13 of 38
Q9.
The diagram shows a pyramid of biomass drawn to scale.
(a)
What is the source of energy for the water plants?
.....................................................................................................................................
(1)
(b)
The ratio of the biomass of water plants to the biomass of insects is 5 : 1.
Calculate the ratio of the biomass of insects to the biomass of frogs.
Show clearly how you work out your answer.
.....................................................................................................................................
.....................................................................................................................................
ratio = .................... : 1
(2)
(c)
Give two reasons why the biomass of the frog population is smaller than the biomass of
the insect population.
1 ..................................................................................................................................
.....................................................................................................................................
2 ..................................................................................................................................
.....................................................................................................................................
(2)
Page 14 of 38
(d)
Some insects die.
Describe how the carbon in the dead insect bodies may be recycled.
.....................................................................................................................................
.....................................................................................................................................
.....................................................................................................................................
.....................................................................................................................................
.....................................................................................................................................
.....................................................................................................................................
.....................................................................................................................................
.....................................................................................................................................
.....................................................................................................................................
.....................................................................................................................................
(4)
(Total 9 marks)
Page 15 of 38
Q10.
Plankton live in the sea.
Animal plankton eat plant plankton.
Graph 1 shows how the populations of the plankton change through the year in the
seas around the UK.
Graph 1
Month
(a)
Basking sharks eat animal plankton. Basking sharks grow up to 8 metres long.
Look at the diagram and Graph 1.
Which is the correct shape for the pyramid of biomass to show the relationship between
plant plankton, animal plankton and basking sharks, in June?
Tick ( ) one box.
(1)
Page 16 of 38
Graph 1 is repeated here to help you answer the following questions.
Month
Graph 2 shows changes in some of the conditions in the upper layers of the sea around the UK.
Month
(b)
The population of plant plankton increases between February and April.
Suggest one reason for the increase.
Explain your answer.
........................................................................................................................
........................................................................................................................
........................................................................................................................
........................................................................................................................
(2)
Page 17 of 38
(c)
The population of animal plankton changes between April and July.
Suggest explanations for the changes.
........................................................................................................................
........................................................................................................................
........................................................................................................................
........................................................................................................................
........................................................................................................................
(2)
(d)
The concentration of mineral ions changes between February and December.
Suggest explanations for the changes.
........................................................................................................................
........................................................................................................................
........................................................................................................................
........................................................................................................................
........................................................................................................................
........................................................................................................................
........................................................................................................................
(3)
(Total 8 marks)
Page 18 of 38
Q11.
Students investigated a food chain in a garden.
The students found 650 aphids feeding on one bean plant.
Five ladybirds were feeding on the aphids.
Photograph supplied by Hemera/Thinkstock
(a)
(i)
Draw a pyramid of biomass for this food chain.
Label the pyramid.
(2)
(ii)
The biomass in the five ladybirds is less than the biomass in the bean plant.
Give two reasons why.
...............................................................................................................
...............................................................................................................
...............................................................................................................
...............................................................................................................
...............................................................................................................
...............................................................................................................
(2)
Page 19 of 38
(b)
The carbon in dead bean plants is returned to the atmosphere via the carbon cycle.
Describe this part of the carbon cycle.
...............................................................................................................
...............................................................................................................
...............................................................................................................
...............................................................................................................
...............................................................................................................
...............................................................................................................
...............................................................................................................
...............................................................................................................
...............................................................................................................
(4)
(Total 8 marks)
Q12.
An oak wood contained the following:
200 oak trees
150 000 primary consumers
120 000 secondary consumers
(a)
Draw and label a pyramid of biomass for this wood. (Your pyramid does not have to be
drawn to scale.)
(2)
(b)
A scientist estimated the total amount of energy flow through each level of the pyramid per
year.
The results were:
Energy absorbed by oak trees
4 600 000 kJ per m2 per year
Energy in sugar produced by trees
44 000 kJ per m2 per year
Energy transferred to primary consumers
2 920 kJ per m2 per year
Energy transferred to secondary consumers
700 kJ per m2 per year
(i)
Calculate the percentage of the energy absorbed by the trees that is transferred to
sugar by photosynthesis. Show your working.
Answer ................................. %
(2)
Page 20 of 38
(ii)
Suggest two reasons why a large proportion of the energy is not transferred to sugar.
1 ........................................................................................................................
...........................................................................................................................
2 ........................................................................................................................
...........................................................................................................................
(2)
(iii)
Give three reasons why some of the energy in the primary consumers is not
passed on to the secondary consumers.
1 ........................................................................................................................
...........................................................................................................................
2 ........................................................................................................................
...........................................................................................................................
3 ........................................................................................................................
...........................................................................................................................
(3)
(Total 9 marks)
Page 21 of 38
Q13.
A food chain has four organisms, A, B, C and D.
A → B → C → D
The table shows the amount of energy transferred by each organism in one year.
Organism
Energy transferred in kJ per year
A
87 000
B
14 000
C
1600
D
70
Explain, as fully as you can, why organism D would transfer much less energy than organism A.
...............................................................................................................................................
...............................................................................................................................................
...............................................................................................................................................
...............................................................................................................................................
...............................................................................................................................................
...............................................................................................................................................
...............................................................................................................................................
...............................................................................................................................................
...............................................................................................................................................
...............................................................................................................................................
...............................................................................................................................................
...............................................................................................................................................
(Total 5 marks)
Q14.
Scientists have found the following food web in the cold Antarctic Ocean.
Page 22 of 38
(a)
Humans are removing large numbers of the cod.
Some scientists argue that this could lead to a decrease in the numbers of squid and
penguins.
Others argue that the numbers of squid and penguins will stay the same.
Carefully explain each argument.
Why they might decrease.
.....................................................................................................................................
.....................................................................................................................................
.....................................................................................................................................
(1)
Why they might stay the same.
.....................................................................................................................................
.....................................................................................................................................
.....................................................................................................................................
(2)
(b)
The following information is about the biomass of the organisms in one of the food chains
in the web.
Draw and label a pyramid of biomass for this chain.
(2)
Page 23 of 38
(c)
Explain, as fully as you can, why the conversion of shrimp biomass into cod biomass is
more efficient than that of cod biomass into seal biomass in the cold Antarctic Ocean.
.....................................................................................................................................
.....................................................................................................................................
.....................................................................................................................................
.....................................................................................................................................
(3)
(d)
Boats from many countries fish the Antarctic Ocean. The cod are being overfished. If the
numbers of cod are to increase, the population must be carefully managed.
(i)
Suggest two control measures which would prevent a further drop in numbers,
...........................................................................................................................
...........................................................................................................................
(2)
(ii)
Suggest why one of your control measures would be difficult to put into practice.
...........................................................................................................................
...........................................................................................................................
(1)
(Total 11 marks)
Page 24 of 38
M1.
(a)
(i)
squirrels eat nuts;
each for 1 mark
owls eat squirrels
(2 marks for energy flow)
2
(ii)
hazel tree
gains 1 mark
1
(iii)
1 squirrel population would decrease;
because fewer nuts available as food
each for 1 mark
2
2 owl population would decrease;
because fewer squirrels available as food
each for 1 mark
2
(b)
(i)
digested/broken down;
(ii)
by microbes/reference to worm action;
each for 1 mark
2
(iii)
March
warmer/increased activity of worms/microbes;
each for 1 mark
2
[11]
M2.
(a)
In sequence:
heron
frog
slug
lettuce
1
Page 25 of 38
(b)
(i)
light / sun
ignore photosynthesis / respiration
cancel mark if water / ions etc given
do not accept heat
1
(ii)
traps / absorbs light
accept energy for light
do not accept collects / attracts
do not accept ‘traps sun’
1
(iii)
162
if correct answer, ignore working / lack of working
for 1 mark
2
[5]
M3.
(a)
three layer triangular pyramid
either way up (as blocks or triangle)
1
(soya / beans / food – trout / fish – people / human (in sequence)
ignore reference to producers /herbivores / consumers
award 1 mark only for a correct food chain with 2 correct arrows
showing energy flow
1
(b)
the trout release energy when they respire
1
some energy will be lost in waste from the trout
1
(c)
any one from eg
•
easy / easier to catch / more caught
allow easy / easier to monitor
•
easy / easier to feed
allow control food
•
no / less predation
allow less fishing / poaching
•
less energy loss
allow grow faster
•
less movement
ignore less space to move
do not allow easier to farm
1
Page 26 of 38
(d)
any two from:
•
microorganisms / bacteria /decomposers / microbes / fungi /detritus feeders
•
decay / rot / decompose / digest /break down
ignore biodegrade
•
(microorganisms) respire
do not award this mark if response implies the trout respire
•
turned into fossil fuels / named fossil fuels
•
carbon dioxide / CO2 released
2
[7]
M4.
(a)
bottom / third pyramid ticked
extra box ticked cancels the mark
1
(b)
the sun
extra ring drawn cancels the mark
1
(c)
any two from:
•
heat
ignore keeping warm
•
movement / named example internal or external
ignore digestion
•
respiration
do not allow for respiration
•
faeces / not all digested
allow waste for 1 mark if neither faeces nor excretion given (ie
waste + movement = 2 marks waste + faeces = 1 mark
•
excretion/ urine
•
not all of animal / all parts eaten
do not accept growth / reproduction
2
[4]
M5.
(a)
(i)
sun
ignore light
apply list principle
1
Page 27 of 38
(ii)
photosynthesis
apply list principle
allow approximate spelling
do not accept phototropism
1
(b)
(i)
chemical
1
(ii)
carbon dioxide
1
(iii)
carbohydrates
1
(c)
As carbon dioxide from the caterpillar
if more than 2 boxes ticked deduct one mark for each additional
incorrect box
1
As faeces (droppings) from the blue-tit
1
[7]
M6.
Marks awarded for this answer will be determined by the Quality of Written Communication
(QWC) as well as the standard of the scientific response. Examiners should also refer to the
information in the Marking guidance.
0 marks
No relevant content.
Level 1 (1-2 marks)
For at least one process either the organism that carries it out or the carbon compound used
or the carbon compound produced is described or for at least one organism either the carbon
compound it uses or the carbon compound it produces is described or at least one process is
named
Level 2 (3-4 marks)
For some processes (at least one of which is named) either the organisms involved or the
carbon compounds used or the carbon compounds produced are described
Level 3 (5-6 marks)
For at least one named process an organism and either the carbon compound used for the
process or the carbon compound produced by the process are described and for other
processes (at least one of which is named) either the organism or the carbon compounds
used or the carbon compounds produced are described (as in Level 2)
Page 28 of 38
Examples of Biology points made in the response:
•
(green) plants photosynthesise
•
photosynthesis takes in carbon dioxide
•
(green) plants use carbon to make carbohydrate / protein / fat / organic compounds /
named (e.g. enzymes / cellulose)
•
animals eat (green) plants (and other animals)
•
(green) plants respire
•
animals respire
•
respiration releases carbon dioxide
•
(green) plants and animals die
•
microorganisms decay / decompose / rot / break down / feed on dead organisms
•
microorganisms respire
[6]
M7.
(a)
sulfur dioxide
1
(b)
(i)
mutation
1
(ii)
pale form now (more) easily seen (by predators) or dark form now less easily
seen (by predators)
accept ref to camouflage
1
so pale form (more) likely to be eaten or dark form less likely to be eaten
1
so dark form (more likely to) breed / pass on genes
or
pale form less likely to breed / pass on genes
1
(c)
(i)
pyramid of three layers of diminishing size
either way up
1
three labels in food chain order
award 2 marks only if the pyramid is correctly labelled
accept trees / birch
accept (peppered) moth(s) / larvae
1
(ii)
some material is lost in waste from the birds
1
Page 29 of 38
peppered moth larvae do not eat all the leaves from the trees
1
[9]
M8.
Marks awarded for this answer will be determined by the Quality of Written
Communication (QWC) as well as the standard of the scientific response.
No relevant content.
0 marks
There is a brief explanation of at least two ways in which the
energy captured by the heather is transferred, which has little
clarity and detail. Credit may be awarded either for references
to general ways in which organisms transfer energy or to ways
in which specific organisms in the food web transfer energy.
Level 1 (1–2 marks)
There is some explanation of a range of the ways in which the
energy captured by the heather is transferred. Credit may be
awarded either for references to general ways in which
organisms transfer energy or to ways in which specific
organisms in the food web transfer energy.
Level 2 (3–4 marks)
There is a clear, balanced and detailed explanation of a large
variety of ways in which energy captured by the heather is
transferred Credit may be awarded either for references to
general ways in which organisms transfer energy or to ways
in which specific organisms in the food web transfer energy.
Level 3 (5–6 marks)
examples of biology points made in response
•
respiration releases energy (allow this point even if given for named organism) NB: to gain
full marks, candidates must gain this mark.
•
some energy lost in animals / named animal’s waste materials
•
some energy used in maintenance / repair (allow this point if given for named organism)
•
some energy used for movement (allow this point if given for named animal)
•
energy lost as heat to surroundings (allow this point if given for named organism)
•
some organisms die (rather than being eaten) (allow this point if given for named
organism)
•
reference to detritivores / microbes
[6]
Page 30 of 38
M9.
(a)
the sun / light / sunshine / solar
allow radiation from the sun
ignore photosynthesis / respiration
apply list principle
do not allow water / minerals / heat
1
(b)
2.5 (:1)
correct answer with or without working
ignore rounding with correct working
do not allow other equivalent ratios for both marks
evidence of selection of 10(insects) and 4(frogs) or 50 and
20 or 1 and 0.4 for 1 mark
if no other working allow 1 mark for 0.4:(1) on answer line
2
(c)
any two from:
allow for insects or frogs
allow energy for biomass
•
some parts indigestible / faeces
•
waste / examples of waste eg urea / nitrogenous
compounds / urine / excretion
•
movement / eg of movement
allow keeping warm
•
heat
•
not all eaten / eg of not all eaten
•
respiration
do not accept energy for respiration
2
Page 31 of 38
(d)
any four from:
•
(bodies) consumed by animals / named / scavengers / detritus feeders
•
microorganisms / bacteria / fungi / decomposers
•
reference to enzymes
•
decay / breakdown / decompose / rot
ignore digest(ion)
•
respiration
•
carbon dioxide produced
•
photosynthesis
•
sugar / glucose produced
accept other organic molecules
•
fossilisation / fossil fuels / named
•
combustion / burning
must be linked with fossilisation / fossil fuels
•
(burning) produces carbon dioxide
allow carbon dioxide produced once only
4
[9]
M10.
(a)
if more than one box is ticked award no mark
1
(b)
increasing / higher light / temperature
ignore references to months other than February – April
do not accept mineral / ions increase
1
more / increased photosynthesis
for both marks there must be a reference to ‘more’ at least once
(e.g. ‘more light for photosynthesis’ gains 2 marks)
allow 1 mark for reference to light and photosynthesis without an
idea of ‘more’
1
(c)
increase due to increase in plant plankton / food
ignore references to months other than April – July
1
Page 32 of 38
decrease due to fall in plant plankton / food or decrease as eaten by (basking)
sharks
allow decrease as eaten by predators / animals / fish
1
(d)
fall due to use / intake by plant (plankton)
ignore ref to no change section of graph
for fall allow March / April
ignore May / February
1
increase due to decay / decomposition / breakdown
for increase allow any month in range August to November
ignore December
1
of dead (plant / animal) plankton
allow of dead organisms / waste
1
[8]
M11.
(a)
(i)
triangular pyramid with 3 layers
may be as blocks or as triangle
ignore food chains and arrows
1
layers appropriately labelled:
bean / plant
aphid,
ladybird
labelled in food chain order must not contradict correct pyramid
allow correctly labelled inverted pyramid for 2 marks
1
(ii)
any two from:
(for aphid / ladybird)
ignore energy
•
not all digested / faeces
•
loss in urine
•
loss of CO2
ignore loss of CO2 from bean plant
•
not all eaten
if none of first 3 points given then allow waste (materials) / excretion
for 1 mark
2
Page 33 of 38
(b)
microorganisms / microbes / bacteria / fungi / decomposers / detritivores /named
do not accept germs
allow mould
ignore aphids
1
decay / breakdown / digest / decompose / rot (bean plant)
ignore eat
1
respiration (of microorganisms etc / aphids)
allow burning / combustion
1
carbon dioxide released (from respiration of microorganisms etc / aphids)
allow carbon dioxide released / produced (from burning /
combustion)
ignore other parts of the carbon cycle
ignore formation of fossil fuels
1
[8]
M12.
(a) levels in correct order
sizes correct
for 1 mark each
2
(b)
(i)
working
0.96% (correct answer = 2)
for 1 mark each
2
(ii)
2 of e.g.
heat up leaves
absorbed by non-photosynthetic parts
transmitted through leaves
any 2 for 1 mark each
2
(iii)
3 of e.g.
respiration of primary consumers
movement of p.c.
waste from p.c.
repair/growth of p.c.; heat losses to
surroundings
any 3 for 1 mark each
3
[9]
Page 34 of 38
M13.
any five from:
•
the amount of energy (in the biomass of organisms) is reduced at each
successive stage in a food chain
•
all of prey organism is not consumed
•
energy is ‘lost’ as the organisms’ waste materials
•
energy is transferred / lost during respiration
•
energy is transferred / lost as movement (kinetic energy)
•
energy is transferred / lost as heat (thermal energy)
•
energy is transferred / lost to the surroundings
•
the only energy transferred to a higher level is that which the organisms
have used in growing
statements about energy flow the wrong way are neutral
[5]
M14.
(a)
Decrease: seals will eat more squid and penguins
for 1 mark
1
Stay the same:
•
more shrimp/food for squid and penguins
ideas that
•
increase in squid and penguins balances the extra eaten by seals
•
seals find other prey (allow start to eat shrimps)
any two for one mark each
2
Page 35 of 38
(b)
allow
•
correct shape (doesn‘t need to be to scale)
•
correctly with organisms
(if wholly correct but inverted then credit 1 mark)
each for 1 mark
2
(c)
•
seals are mammals
•
idea that seals have (to maintain) a constant body temperature
[allow warm blooded]
•
heat losses to cold seas
•
more of food eaten used to replace heat loss
(credit use of figures i.e. 95% loss compared to 90%
or 5% efficient compared to 10%
or 20 : 1 conversion ratio compared to 10 : 1
with 1 mark)
any three for 1 mark each
3
(d)
(i)
ideas that
•
reduce number of fishing boats allowed
•
breed in captivity and then release
•
agree quotas [not an unqualified ‘ban’]
•
avoid breeding areas
•
avoid breeding seasons
•
increase size of net mesh/don’t catch small fish
•
limit catches of shrimps
•
cull seals
any two for 1 mark each
[allow any other reasonable answer]
2
Page 36 of 38
(ii)
•
breeding areas closer to some countries than others
•
difficult to police/easy to cheat/’poach’
•
difficult to agree quotas
•
some countries eat more fish than others
•
best weather for fishing maybe in breeding seasons
•
fisherman/trawlers need employment
•
big demand for cod
any one for 1 mark
[allow any other sensible response]
1
[11]
Page 37 of 38
Page 38 of 38


© Copyright 2026