
File
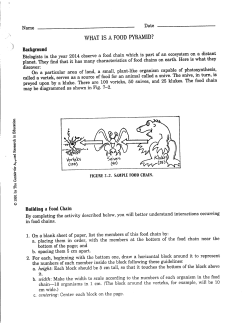
Q1.
Copepods are tiny animals which live in the sea.
During the day they live deep down near the sea bed.
At night they move up to the surface where they feed on tiny plants.
When the sun rises they move down to the bottom again.
(a)
Suggest why the tiny plants live near the surface of the sea.
.....................................................................................................................................
.....................................................................................................................................
(2)
(b)
Herring feed on copepods.
Where will herring be found during the day? Give a reason for your answer.
.....................................................................................................................................
.....................................................................................................................................
.....................................................................................................................................
(2)
(Total 4 marks)
Q2.
Figure 1 shows a food chain containing three organisms.
Figure 1
Page 1 of 12
(a)
(i)
In this food chain, name:
the predator; ......................................................................................................
the prey. ............................................................................................................
(2)
(ii)
What is the source of energy for the grass?
Draw a ring around one answer.
carbon dioxide
light
nitrates
water
(1)
(iii)
Figure 2 shows a pyramid of biomass for the organisms in Figure 1.
Write the names of the organisms on the correct lines in Figure 2.
Figure 2
(1)
(b)
Waste materials, like faeces from the animals, will decay,
(i)
What sort of organisms cause decay?
…………………………………………………………………………………
(1)
(ii)
Three of the following conditions help decay to occur rapidly.
Which conditions do this?
Draw a ring around each of the three answers.
aerobic
anaerobic
cold
dry
moist
warm
(3)
Page 2 of 12
(iii)
The list below gives four substances. Two of these substances are produced by
decay and can be used by the grass.
Which two substances are these?
Tick ( ) two boxes.
Carbon dioxide
Mineral salts
Oxygen
Protein
(2)
(Total 10 marks)
Q3.
This is a simple food chain.
Lettuce plant → Slug → Frog → Heron
The diagram shows a pyramid of biomass for this food chain.
(a)
Write the names of the organisms in the food chain on the correct lines next to the
pyramid of biomass.
(1)
(b)
(i)
The slug obtains its energy from the lettuce plant. What is the source of energy for
the lettuce plant?
...........................................................................................................................
(1)
(ii)
What is the function of chlorophyll in a lettuce plant?
...........................................................................................................................
(1)
Page 3 of 12
(iii)
The slugs ate some lettuce plants which contained 1620 kJ of energy. Only 10 per
cent of this energy is used by the slugs for growth. Use the formula to calculate how
much energy can be used by the slugs for growth. Show clearly how you work out
your final answer.
Amount of energy =
...........................................................................................................................
...........................................................................................................................
...........................................................................................................................
Amount of energy = ................................................... kJ
(2)
(Total 5 marks)
Page 4 of 12
Q4.
The picture shows a food chain.
(a)
Which diagram shows a pyramid of biomass for the food chain in the picture?
Tick ( ) one box.
(1)
(b)
The plants at the start of the food chain absorb energy.
Where does this energy come from?
Draw a ring around one answer.
the water
the sun
minerals
(1)
Page 5 of 12
(c)
Some energy is lost at each stage of the food chain.
Give two ways in which energy may be lost from the food chain.
1 .....................................................................................................................
........................................................................................................................
2 .....................................................................................................................
........................................................................................................................
(2)
(Total 4 marks)
Q5.
Green plants are found at the start of all food chains.
(a)
Complete the sentences.
(i)
The source of energy for green plants is radiation from the ..............
(1)
(ii)
Green plants absorb some of the light energy that reaches them for a
process called ............................................................
(1)
(b)
Draw a ring around the correct answer to complete each sentence.
chemical
(i) This process transfers light energy into
sound
energy.
electrical
(1)
carbon dioxide.
(ii) The process uses the gas
oxygen.
water.
(1)
carbohydrates.
(iii) The process produces carbon-containing compounds called
minerals.
salts.
(1)
Page 6 of 12
(c)
The amount of living material (biomass) at each stage in a food chain is less than at the
previous stage.
The diagram shows a food chain.
oak tree
caterpillar
blue-tit
hawk
Give two ways in which biomass is lost in this food chain.
Tick ( ) two boxes.
As carbon dioxide from the caterpillar
As food eaten by the hawk
As oxygen from the oak tree
As faeces (droppings) from the blue-tit
(2)
(Total 7 marks)
Page 7 of 12
Q6.
The photographs show a food chain from a seashore. The photographs are not to the same
scale.
Seaweed
© Getty Images/
Thinkstock
Limpet
Crab
© Paul Williamson/iStock/
Thinkstock
© twobluedogs/iStock/
Thinkstock
Gull
© Gabriela Insuratelu/
iStock
Students estimated the population and biomass of each of the organisms on part of a seashore.
The table shows the students’ results.
(a)
Organism
Population
Mean mass of one
organism in grams
Biomass of
population in grams
Seaweed
50
4000
200 000
Limpet
1200
30
36 000
Crab
100
90
9 000
Gull
2
900
(i)
Use the data in the table to calculate the biomass of the gull population.
...............................................................................................................
...............................................................................................................
Biomass = ................................... g
(1)
(ii)
Draw a pyramid of biomass for this food chain.
Label the pyramid.
(2)
Page 8 of 12
(b)
The biomass of the crab population is much less than the biomass of the limpet
population.
Suggest two reasons why.
1........................................................................................................................
..........................................................................................................................
2........................................................................................................................
..........................................................................................................................
(2)
(Total 5 marks)
Q7.
There are two forms of peppered moth, dark and pale.
Birds eat the moths when the moths are resting on tree bark.
Pollution in the atmosphere may:
•
kill lichens living on tree bark
•
make the bark of trees go black.
(a)
Draw a ring around the correct answer to complete the sentence.
carbon dioxide.
Lichens are very sensitive to air pollution caused by
nitrogen.
sulfur dioxide.
(1)
Page 9 of 12
(b)
The photographs show the two forms of peppered moth, on tree bark.
Tree bark covered with lichens
Tree bark made black by pollution
© Kim Taylor/Warren Photographic
(i)
The dark form of the peppered moth was produced by a change in the genetic material of a
pale moth.
Use one word from the box to complete the sentence.
characteristic
clone
mutation
A change in genetic material is called a ...............................................................
(1)
(ii)
In the 19th century, pollution made the bark of many trees go black.
Explain why:
•
the population of the pale form of the moth in forests decreased
•
the population of the dark form of the moth in forests increased.
...............................................................................................................
...............................................................................................................
...............................................................................................................
...............................................................................................................
...............................................................................................................
...............................................................................................................
...............................................................................................................
...............................................................................................................
(3)
Page 10 of 12
(c)
(i)
The larvae (young) of the peppered moths eat the leaves of birch trees.
The diagram shows the food chain:
birch trees → peppered moth larvae → birds
Draw a pyramid of biomass for this food chain.
Label the pyramid.
(2)
(ii)
Which two reasons explain the shape of the pyramid you drew in part (c)(i)?
Tick ( ) two boxes.
Some material is lost in waste from the
birds
The trees are much larger than peppered
moth larvae
Peppered moth larvae do not eat all the
leaves from the trees
The trees do not use all of the Sun’s energy
(2)
(Total 9 marks)
Page 11 of 12
Page 12 of 12


© Copyright 2026