
Ghana Fact Sheet - Denmark in Ghana
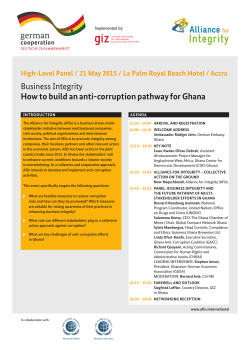
Embassy of Denmark, Ghana
67, Dr. Isert Road
North Ridge
Accra, Ghana
[email protected]
www.ghana.um.dk /commercial-services
EMBASSY OF DENMARK
GHANA
production as general economic activities slowed down. The
year ended with a budget deficit of 7%, deficit attributed to
over bloated public sector payroll and interest payment as
well as continuous decline in prices of major exports. Debt
sustainability also remains an issue with debt to GDP ratio of
about 60%. Given the numerous challenges facing the economy, the Government sought support from the IMF which
approved a 3 year (2015-2017) USD918 million credit facility.
The facility aims to restore debt sustainability and macroeconomic stability to foster a return to high growth and job creation, while protecting social spending.
General information
Capital city:
Accra
Surface area:
239,000 km2
Official language:
English
Population:
26,778,409 (Jan. 2015)
Head of State:
H.E. John D. Mahama
Economic overview
Annual change of real GDP (per cent)
2005
2006
2007
2008
2009
2010
2011
2012
2013
2014
2015
6.0
6.1
4.5
9.3
5.8
7.9
14.0
8.0
7.3
4.2
3.5
Source: World Economic Outlook Database April 2015, IMF.
Inflation: Annual per cent change in consumer prices
2005
2006
2007
2008
2009
2010
2011
2012
2013
2014
2015
15.1
11.7
10.7
16.5
13.1
6.7
7.7
7.1
11.7
15.5
12.2
International Trade
Ghana’s total imports were estimated to $10.02 billion and
exports to $15.56 billion in 2013. The EU (28 countries) accounted for 28.6% of the total imports and 24.0% of the
total exports.
Denmark and Ghana share a long standing relationship of
trade and commercial cooperation. In recent years, imports
of goods from Ghana to Denmark have exceded exports of
goods from Denmark to Ghana. The significant categories of
Danish export to Ghana are machinery and transport equipment, chemicals, pharmaceutical, food products, services
and technical knowhow. The major Danish imports from
Ghana are cocoa, oil seeds, fruit and biomass.
Trade between Denmark and Ghana
Source: World Economic Outlook Database April 2015, IMF
Ghana has experienced a strong economic growth over the
past 20 years, evidenced by its transition to lower middleincome status in 2010. In 2014, Ghana’s GDP was estimated
at $38.58 billion, corresponding to a GDP per capita of
approximately $1,474.
Agriculture employs more than 40% of the population and
contributes to roughly 25% of GDP, while the service sector
contributes 50% to GDP and employs approximately 40%
of the population. Manufacturing and industry accounts for
28% of GDP and employs 15% of the population. There is a
small capital intensive mining sector and a growing informal
sector. With its newly acquired status as an oil producing
nation, expected revenues from crude oil are projected to be
an important growth factor in the economy. Estimated oil
reserves have jumped to almost 700 million barrels. Today,
output averages around 110,000 barrels a day.
In 2014, Ghana’ economic growth rate reached its lowest
levels (4.2%) in many years and is expected to slow down for
a fourth consecutive year in 2015 to a modest 3.5%. The
350,000
(1,000 DKK)
300,000
250,000
200,000
150,000
100,000
50,000
0
2008
2009
2010
2011
2012
2013
2014
Import of goods from Ghana to Denmark
Export of goods from Denmark to Ghana
Source: Statistics Denmark, SITC2R4Y
Economic Partnership Agreement (EPA)
Ghana offers access to the market of the Economic Community of West African States (ECOWAS) which has an estimated population of 250 million people. The new Economic
Partnership Agreement (EPA) between the EU and Ecowas
is expected to gradually transform the relationship between
Ghana and the EU from one of dependency to one of mutual trade partners in the long run.
Embassy of Denmark, Ghana
67, Dr. Isert Road
North Ridge
Accra, Ghana
[email protected]
www.ghana.um.dk /commercial-services
EMBASSY OF DENMARK
Ease of Doing Business
Due to its liberal import policies as well as its economic
growth, Ghana offers expanding market opportunities. On
the World Bank’s list of the “Ease of Doing Business” in
2015, Ghana ranked 70th out of 189 countries, worldwide,
and 4th among African countries. The ranking is based on
indicator sets that measure and benchmark regulations affecting 10 different areas: starting a business, getting electricity,
dealing with construction permits, registering property, getting credit, protecting investors, paying taxes, trading across
borders, enforcing contracts and resolving insolvency.
Focus on Renewable Energy
The demand for electricity has been growing rapidly over the
past two decades. Ghana is seeking to expand, stabilize and
diversify its energy supply in a cost effective manner to accelerate the country's socio-economic development. The Renewable Energy Law has recently been enacted to facilitate
the development of renewable energy sources in Ghana in
order to improve supply security through diversification.
Demographic Overview
As a result of significant urbanization and rising middle-class
income, Ghanaian consumption patterns have changed towards a higher demand for goods and services contributing
to the overall well-being of society and a change of lifestyle
in the large youth population. In 2013, estimated 52.7% of
the population lived in urban areas.
Population by age and sex (2013)
Another strong indicator is what Ghanaians spend their
disposible income on.
18
16
14
12
10
8
6
4
2
0
Internet Users (per 100 people)
2004
2005
2006
Ghana
2007
2008
2009
2010
2011
2012
2013
Sub-Saharan Africa (all income levels)
Source: World Development Indicators 2014, World Bank.
Living Large: African Consumers' Spending Plans
Average increase or decrease (%)
Category
Clothing, footwear, accessories
Cars, automobiles
Baby and toddler products
Mobile electronics
Insurance
Beauty care
Home appliances
Home electronics
Healthcare
Take-out meals, restaurants
Breakfast cereals, foods
Packaged food
Coffee, tea
Wine
Snack foods
Soft drinks
Beer
Alcoholic beverages ex-beer/wine
Chocolate, candy
Ghana
50
49
47
25
44
14
19
20
-12
-7
20
2
5
-6
-17
-14
-11
-17
-27
Kenya
56
52
47
23
58
31
20
14
41
3
36
15
26
25
5
13
-6
-7
-19
Nigeria
43
39
25
36
18
22
15
18
0
-2
21
24
6
-12
2
-7
-18
-22
-7
Source: Boston Consulting Group (BCG), 2014
Corruption
Ghana's government has declared a “zero tolerance” for corruption. In 2015, Ghana’s score on the Transparency International’s Corruption Perception Index (CPI) was 48. The
CPI scores countries on a scale from 0 (highly corrupt) to
100 (very clean). Ghana was ranked 61st out of 175 countries.
Source: CIA World Factbook 2013.
Political Stability and Safety
An indicator of the increasing wealth of the population is
the declining amount of people living below poverty line,
from 51.7% in 1991/92 to 24.2% in 2012/13. The increase
in the number of internet users over the last decade could
indicate the rapid growing purchasing power of the Ghanaian population.
Ghana has since the introduction of constitutional democracy in 1992 been a stable democracy, and changes of government between the two dominant parties, National Democratic Congress (NDC) and the New Patriotic Party (NPP) have
generally been smooth. Ghana is overall considered a safe
country to visit and live in.


© Copyright 2026