
PDF - Great Lakes Virtual Water Accounting
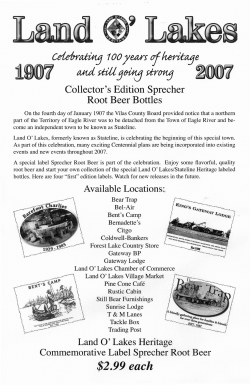
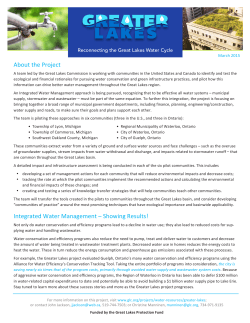
Introducing
VIRTUAL WATER
ACCOUNTING
to the
Great Lakes
The 21st Century Water Management Problem
M
ost of us have traditionally
assumed that water is an
“abundant” public good that
is freely available to all people living
and working around rivers, lakes and
streams. “Scarcity” is the absence of
abundance, and signals that there are
difficult choices, and tradeoffs that
must be made between economic,
social, and environmental uses for
costly and limited water resources1.
Even in the water-rich Great Lakes
region of North America, we are
beginning to experience scarcity in
some of our streams and wetlands.
This scarcity is first manifest when it
creates socio-environmental damages
during the warm summertime lowstreamflow season2. In this season,
fish and aquatic ecosystems may be
placed under stress if too much water
is removed for economic uses.
1
Water follows a complex and mostly
hidden path through society. We use
water to produce things that we need
and value, like food, cars and electricity. Centuries ago, when most of our
goods and services were produced
locally, the connections between water
use, ecosystems and our economy
were more easily seen and managed
for the common good. In the 21st
century, however, globalization has
created a world that is highly connected, in which the economic demands of
people in distant cities and continents
can create intense economic pressure
on our water resources through trade.
The people of the Great Lakes also
choose to outsource their water uses
through trade, such as when they buy
vegetables grown during the winter
in California. As global economic
development and trade, drought and
climate change increase water scar-
city around the world, these invisible
connections to Great Lakes water will
become ever more powerful.
In this connected world we make decisions about what to buy and sell, but
it is difficult to see the impacts of our
decisions on our water and environment. When water is scarce, are we
using our water in the wisest ways,
and are we getting the most benefit
out of it? Do we agree with how water
is being used, when we consider the
environmental impacts and economic
benefits? How does our choice to
pursue some business opportunities,
and not others, affect our economy
and our water resources? How do we
steward our rich water resources to
sustainably benefit an increasingly
water-scarce world, and ourselves?
How do we make sense of these questions in a highly connected world?
Zetland, D., 2011. The End of Abundance, Aguanomics Press.
Zorn, T. G., P. W. Seelbach, E. S. Rutherford, T. C. Wills, S.-T. Cheng, and M. J. Wiley. 2008. A regional-scale habitat suitability model to assess the effects of flow reduction on fish assemblages in Michigan streams.
Michigan Department of Natural Resources, Fisheries Research Report 2089, Ann Arbor.
2
Unveiling the Movement of Water
Through Society – the Virtual Water Accounting Solution
W
e need to visualize and account for the social, environmental and economic effects
of these connections on water resources near and far. Virtual Water Accounting provides a solution. Goods
and services contain “Virtual Water”3,4
(VW) in proportion to the impact that
their production made on the streams
and wetlands in the home watershed.
When virtual water is exported across
a watershed boundary as we sell corn
or cars, or when we bring tourists to
enjoy our lakes and rivers, we have
chosen to use our water resources to
benefit our trading partners in distant
locations, in exchange for money
(Figure 1). The opposite is also true;
when we import virtual water as we
buy electronics or tomatoes, we avoid
using our water resources and creating environmental impacts, but this
costs us money. Virtual water export
has economic benefits, but its social
and environmental costs depend on
exactly how, when, and where we use
the water. Virtual water imports may
offset and reduce those costs by avoiding water use.
Figure 1: Virtual water can be
exported from a watershed through
water embedded in, for example,
agricultural or manufactured goods,
produced in and exported out of the
watershed. Virtual water can also be
imported through goods produced in
another watershed where water was
consumed in the production of those
imported goods.
It takes a great deal of data to visualize these virtual water connections
and their effects on our economy and
water resources. Because water impact
“hotspots” occur in very specific places and times, the accounting requires
detailed data for economic production and trade, along with water use,
ecosystems, and stream flows.
Bringing Virtual Water Accounting to the Great Lakes –
the Kalamazoo Case Study and the Whole Basin
A
s a Great Lakes case study,
the Virtual Water Accounting
framework was applied to the
Kalamazoo River watershed, located
in southwest Michigan. Economic
data were coupled to water consumption data for the counties overlapping
the watershed.
Figure 2 illustrates the consumptive
water use and value intensity (an
estimated value of water use) for each
water use category, aggregated over
the counties. The largest consumptive
water users are the commercial and
thermoelectric sectors. However, the
value intensities indicate that industrial sector produces the largest economic
Figure 2: Consumptive water use and average value intensities
($/cubic meter) by category for the 10 counties.
3
Allan, T. (1993), Fortunately there are substitutes for water: Otherwise our hydropolitical futures would be impossible, paper presented at Conference on Priorities for Water Resources Allocation and Management,
Overseas Dev. Admin., London.
4
Hoekstra, A. Y., A. K. Chapagain, M. M. Aldaya, and M. M. Mekonnen (2011), The Water Footprint Assessment Manual: Setting the Global Standard. Earthscan Publishing. Water Footprint Network.
output per volume of water consumed.
While value intensity is only one metric for determining the value of water
use, it shows that, in this case, the
agricultural and thermoelectric sectors
apparently bring only small economic
returns. This is important when local
or regional governments are assessing
potential new water users and are concerned about allocating scarce water
resources most efficiently.
Since the county boundaries do not
coincide with the watershed boundaries, the water-using economic
activities at the county level were
conformed to watershed boundaries
through land use-water use relationships5. Figures 3a, b and c show the
imports, exports and net virtual water
flows in the watershed, total and by
county. The greatest virtual exports
are in Allegan and Kalamazoo counties, driven by agricultural and urban
water use, respectively. These areas
also correspond roughly to the areas
with highest water scarcity and are
indicated with the darkest colors in
Figure 3d. However, the virtual water
imports to these areas are also relatively high and thus virtually “offset”
the ecological water scarcity. In other
words, if the areas with heavy virtual water exports and ecologically
water scarcity also had to produce the
water-consuming goods and services
that are currently imported from outside the watershed, the ecologically
scarcity would be far more acute.
goods and services that are imported
into the counties, as opposed to
consuming those goods and services
generated within the county.
To compare virtual water flows
against water availability over
the Great Lakes, annual water
availability was estimated through a
simple water balance: mean annual
precipitation minus mean annual
evapotranspiration7. Figures 4b and
4c show virtual water exports and
net virtual water flows relative to
annual water availability. The results
in Figure 4b for annual virtual
water exports relative to annual
water availability show that in a few
counties, exports constitute more
than 5 percent of the average annual
water availability, but most are below
1 percent. While these numbers seem
Figure 3: Kalamazoo River watershed (a) imports, (b) exports, (c) total net
annual virtual water flows by county (normalized by area), and (d) ecological
scarcity (D/T) for low flow months.
Preliminary results were generated for the U.S. portion of the Great
Lakes basin. Figure 4a shows net
virtual flows by county, indicating
that all but one county is a net virtual
water importer 6. This result, as was
described earlier for the Kalamazoo
River watershed, is primarily due to
populations consuming relatively
high amounts of water-intensive
5
For example, the fraction of irrigated agricultural land in the portion of a county inside the watershed was used to scale the agricultural water use for that county.
6
Illinois counties (Cook and Lake) were excluded because of the complexity of tracking water withdrawals and eventual delivery of water in the area. The figure indicates that all counties are net importers.
Precipitation and evapotranspiration were mapped using long-term estimates of these quantities from the PRISM (http://www.prism.oregonstate.edu/) and USGS
(http://onlinelibrary.wiley.com/doi/10.1111/jawr.12010/abstract) databases for the US, respectively.
7
A
B
Annual net virtual flows by
county (Mm3/yr)
low, the ratio of exports to water
availability could be much higher
during low flow months. The results
in Figure 4c show that, like the
Kalamazoo River example, the virtual
water imports offset the exports so
that the net virtual water flows do
not contribute to reductions of water
Ratio of virtual water exports
to water availability
availability, except for one county.
Taken as a whole, the Great Lakes counties are not water scarce and are net
water importers. Commercial and industrial sectors produce the greatest return,
measured as economic value generated
per volume of water consumed.
C
Ratio of net virtual water
to water availability
Figure 4: (a) Annual net virtual
flows, (b) ratio of annual virtual
water exports to annual water
availability, and (c) ratio of net
annual virtual water flows to
annual water availability by
county for the U.S. portion of
the Great Lakes basin.
Inspiring a New Vision for Water Management
V
irtual Water Accounting adds a
new dimension to water management. It helps paint the big
picture of how water moves across the
landscape in the Great Lakes region
and through economy, and therefore, it
can inform economic development and
water use policy decisions. It provides
a means for benchmarking water sustainability by calculating value intensities and water scarcity footprints that
show hotspots where scarcity has been
caused by water use. It can be used to
educate waters users and the general
public on the value of water.
With Virtual Water Accounting, tough
questions can be tackled:
Can the Great Lakes region afford
to accommodate water uses that
yield lower economic value?
Can the Great Lakes region afford
to shift from being a new water
importer to being a net water exporter, without ecological impacts?
As a tool, Virtual Water Accounting
can be used by both industry and local
governments to plan for the future. For
Industries, it can enhance water footprinting and sustainability analyses.
Local communities can see how water
abundance or scarcity may impact
growth management scenarios.
For more information, contact:
Alex Mayer
Benjamin L. Ruddell
Stanley T. Mubako
Michigan Tech Center for
Water and Society
Michigan Technological University
[email protected]
Fulton Schools of Engineering
Senior Sustainability Scientist,
Global Insitute of Sustainability
Arizona State University
[email protected]
Center for Environmental
Resource Management
University of Texas at El Paso
[email protected]
Visit the project website at: www.glvirtualwater.net


© Copyright 2026