ABC
docz
Explore
Log in
Create new account
Download
Report
No category
Graphing better Impulse Response Functions for discrete
Q.9360 Case for sport camcorder Specifications
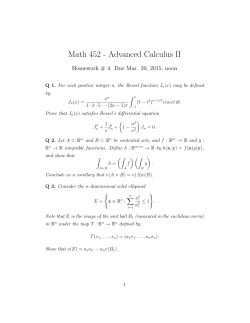
Math 452 Advanced Calculus II Homework 4
(702) 979-5398 MESSAGE TO CTIP MEMBERS AND SUPPORTE
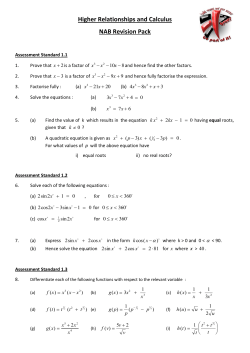
Higher Relationships and Calculus NAB Revision Pack
Document 263346
How To Install the SCX10 Rear Shock Relocation Kit Parts Included:
Sample Solutions to Quiz 3 for MATH3270A − y
Math 120 Sample questions for Test 2, with answers
Math 114 Worksheet for 30 Oct 3.3, 3.4, 4.1
Sample questions for Quiz 3. → R, given by
© Copyright 2026
About abcdocz
DMCA / GDPR
Report