
Preterm birth and cardiometabolic risk factors in adolescence
D 1293
OULU 2015
UNIVERSITY OF OUL U P.O. Box 8000 FI-90014 UNIVERSITY OF OULU FINLA ND
U N I V E R S I TAT I S
O U L U E N S I S
ACTA
A C TA
D 1293
ACTA
U N I V E R S I T AT I S O U L U E N S I S
Marika Sipola-Leppänen
University Lecturer Santeri Palviainen
Postdoctoral research fellow Sanna Taskila
Professor Olli Vuolteenaho
Marika Sipola-Leppänen
Professor Esa Hohtola
PRETERM BIRTH AND
CARDIOMETABOLIC RISK
FACTORS IN ADOLESCENCE
AND EARLY ADULTHOOD
University Lecturer Veli-Matti Ulvinen
Director Sinikka Eskelinen
Professor Jari Juga
University Lecturer Anu Soikkeli
Professor Olli Vuolteenaho
Publications Editor Kirsti Nurkkala
ISBN 978-952-62-0794-0 (Paperback)
ISBN 978-952-62-0795-7 (PDF)
ISSN 0355-3221 (Print)
ISSN 1796-2234 (Online)
UNIVERSITY OF OULU GRADUATE SCHOOL;
UNIVERSITY OF OULU, FACULTY OF MEDICINE;
NATIONAL INSTITUTE FOR HEALTH AND WELFARE;
DOCTORAL PROGRAMS IN PUBLIC HEALTH
D
MEDICA
ACTA UNIVERSITATIS OULUENSIS
D Medica 1293
MARIKA SIPOLA-LEPPÄNEN
PRETERM BIRTH AND
CARDIOMETABOLIC RISK FACTORS
IN ADOLESCENCE AND EARLY
ADULTHOOD
Academic dissertation to be presented with the assent
of the Doctoral Training Committee of Health and
Biosciences of the University of Oulu for public
defence in Auditorium 12 of Oulu University Hospital,
on 22 May 2015, at 12 noon
U N I VE R S I T Y O F O U L U , O U L U 2 0 1 5
Copyright © 2015
Acta Univ. Oul. D 1293, 2015
Supervised by
Docent Eero Kajantie
Docent Marja Vääräsmäki
Reviewed by
Professor Jarmo Jääskeläinen
Professor Markus Juonala
Opponent
Professor Liisa Lehtonen
ISBN 978-952-62-0794-0 (Paperback)
ISBN 978-952-62-0795-7 (PDF)
ISSN 0355-3221 (Printed)
ISSN 1796-2234 (Online)
Cover Design
Raimo Ahonen
JUVENES PRINT
TAMPERE 2015
Sipola-Leppänen, Marika, Preterm birth and cardiometabolic risk factors in
adolescence and early adulthood.
University of Oulu Graduate School; University of Oulu, Faculty of Medicine; National Institute
for Health and Welfare; Doctoral Programs in Public Health
Acta Univ. Oul. D 1293, 2015
University of Oulu, P.O. Box 8000, FI-90014 University of Oulu, Finland
Abstract
About 11% of infants are born preterm (before 37 weeks of gestation) worldwide. Adults born
preterm with very low birth weight show enhancement of cardiometabolic risk factors such as
elevated blood pressure and impaired glucose regulation compared with their peers born at term.
Not all the cardiometabolic risk factors related to preterm birth are known, or whether they apply
to those born less preterm, although about 80% of premature infants are born late preterm.
The association between preterm birth and cardiometabolic risk factors in adolescence and
adulthood was investigated in three cohort studies: The Helsinki Study of Very Low Birth Weight
Adults, the Northern Finland Birth Cohort 1986, and the ESTER study.
Preterm birth over its whole range has a long-term impact on a child’s health in later life: adults
born preterm with very low birth weight had lower resting energy expenditure, but higher resting
energy expenditure per unit lean body mass than their peers born at term. Adolescent girls born
before 34 weeks of gestation had higher blood pressure and boys have elevated levels of LDL
cholesterol and apolipoprotein B. Adults born preterm were more likely to be obese and to have
hypertension or metabolic syndrome than their peers born at term. In addition to conventional
biomarkers of cardiometabolic disorders, they had alterations in other cardiometabolic
biomarkers, such as uric acid and liver transaminases.
Adolescents and adults born preterm are at greater risk of developing cardiometabolic
disorders than their peers born at term. Most of the cardiometabolic risk factors related to preterm
birth are modifiable. Favorable early life circumstances of premature infants, such as optimal
nutrition and reduction of stress in neonatal intensive care units, might reduce the risk of later
cardiometabolic disorders. In addition, children and adults born preterm might particularly benefit
from primary prevention such as screening for additional risk factors and promotion of healthy
lifestyles.
Keywords: cardiometabolic risk factor, metabolic syndrome, premature infant, preterm
birth
Sipola-Leppänen, Marika, Ennenaikaisesti syntyneiden nuorten ja aikuisten
sydän- ja verisuonitautien riskitekijät.
Oulun yliopiston tutkijakoulu; Oulun yliopisto, Lääketieteellinen tiedekunta; Terveyden ja
hyvinvoinnin laitos; Kansanterveyden tutkijakoulu
Acta Univ. Oul. D 1293, 2015
Oulun yliopisto, PL 8000, 90014 Oulun yliopisto
Tiivistelmä
Noin joka yhdeksäs lapsi maailmassa syntyy ennenaikaisesti, ennen 37. raskausviikkoa. Keskosena syntyneillä aikuisilla on todettu enemmän joitakin sydän- ja verisuonisairauksien riskitekijöitä kuin heidän täysaikaisena syntyneillä ikätovereillaan. Näistä eniten on tutkittu etenkin
kohonneen verenpaineen ja heikentyneen sokerin siedon esiintyvyyttä, mutta kaikkia myöhempien sairauksien riskitekijöitä ei tunneta. Suurin osa aiemmista keskostutkimuksista on tehty
hyvin tai erittäin ennenaikaisesti syntyneillä, vaikka yli 80% keskosista syntyy lievästi ennenaikaisena. Ei ole juurikaan tutkimuksia siitä, ovatko sydän- ja verisuonitautien riskitekijät lisääntyneet myös tässä suuressa lievemmin ennenaikaisesti syntyneiden joukossa.
Eriasteisen ennenaikaisen syntymän vaikutuksia nuoruus- ja aikuisiän sydän- ja verisuonitautien riskitekijöihin tutkittiin kolmessa kohorttitutkimuksessa: Helsingin Pikku-K -tutkimuksessa, Pohjois-Suomen syntymäkohortti 1986 -tutkimuksessa sekä ESTER-tutkimuksessa.
Ennenaikaisella syntymällä sinänsä on pitkäaikaiset vaikutuksen syntyneen lapsen terveyteen myös nuoruudessa ja aikuisuudessa: Hyvin pienipainoisena ennenaikaisesti syntyneillä on
korkeampi lepoenergian kulutus rasvatonta painoyksikköä kohden kuin täysiaikaisena syntyneillä ikätovereilla. Hyvin ennenaikaisena (ennen 34. raskausviikkoa) syntyneillä tytöillä on 16-vuotiaina korkeampi verenpaine, ja pojilla suuremmat LDL-kolesterolin ja apolipoproteiini B:n
pitoisuudet. Keskosena syntyneet puolestaan täyttivät aikuisina todennäköisemmin lihavuuden,
verenpainetaudin ja metabolisen oireyhtymän kriteerit. Perinteisten sydän- ja verisuonitautien
riskitekijöiden lisäksi heillä oli muutoksia myös monissa muissa sydän- ja verisuonitautien
merkkiaineissa, kuten uraatin ja maksa-arvojen pitoisuuksissa.
Ennenaikaisesti syntyneillä nuorilla ja aikuisilla on suurentunut riski sairastua sydän- ja verisuonitauteihin myöhemmällä iällä. Näitä riskejä on mahdollista ennaltaehkäistä, minkä vuoksi
ennenaikaisesti syntyneet nuoret ja aikuiset voivat hyötyä terveellisistä elämäntavoista erityisen
paljon.
Asiasanat: ennenaikainen syntymä, keskonen, metabolinen oireyhtymä, sydän- ja
verisuonitaudit
To my loved ones
8
Acknowledgements
This work was carried out at the National Institute for Health and Welfare (THL), and
University of Oulu, Faculty of Medicine, Institute of Health Science during the years
2009 to 2015. This dissertation study is a part of the Helsinki Study of Very Low
Birth Weight Adults (HeSVA), Northern Finland Birth Cohort 1986 (NFBC 1986)
and the ESTER Preterm Birth Study. First and foremost, I wish to express my
gratitude to the participants of these studies, without whom this study would not exist.
I sincerely thank the Director of the Institute of the Health Science, Professor
Sirkka Keinänen-Kiukaanniemi and Director of THL, Professor Juhani Eskola, the
former head of THL, Professor Pekka Puska, the Head of the Department of Health,
Erkki Vartiainen, the Head of Chronic Disease Prevention Unit, Professor Markku
Peltonen, and former Head of the Diabetes Prevention Unit, Docent Jaana Lindström,
for providing excellent research facilities.
I wish to express my deepest gratitude to my amazing supervisors Docent Eero
Kajantie and Docent Marja Vääräsmäki for their excellent guidance throughout this
work and for their patient and encouraging advice in the world of medical research,
scientific writing and thinking. Eero, I especially appreciate your extraordinary ability
and knowledge and endless enthusiasm in the field of science. I have learnt so much
from you! Marja, your supportive attitude and smart advices have helped me
throughout the years of this project. I admire your ability to combine so smoothly
your career with the clinical and scientific expertise and the life outside the work.
I warmly thank the members of my thesis committee, Professor Riitta Veijola and
Professor Timo Strandberg for their time and experience. I greatly appreciate the preexaminers of the thesis, Professor Jarmo Jääskeläinen and Professor Markus Juonala
for careful review process, insightful comments and suggestions that definitely
improved the content of the thesis. Nick Bolton is acknowledged for revising the
English language of the thesis.
The material of this thesis was collected and processed in a huge network of
professionals. I am indebted to Professor Anna-Liisa Hartikainen and Professor
Marjo-Riitta Järvelin, who have initiated and developed the NFBC 1986 and Docent
Anna-Liisä Järvenpää, who have gathered the original VLBW cohort of the HeSVA. I
am very obliged for opportunity to study these data. I am grateful for Professor Johan
Eriksson, the excellent leader of the Idefix team, for sharing his intelligence to this
study. I want to express my gratitude for Docent Petteri Hovi for sharing the data and
wisdom, and contribution to this thesis. I am so thankful for the time you took to help
9
with my project and your effort to create fun and memorable moments within the
research team.
I warmly thank my office mate Marjaana Tikanmäki for all the enjoyable
conversations, for sharing the moments of failure and success, and for important peer
support – and of course for all the enormous work you have done for the ESTER
study. I would also thank with all my heart the other “Esters”, Hanna-Maria
Matinolli, Satu Miettola, Sarianna Vaara, Marjatta Takala, Sinikka Kursu and
Katriina Inget for your remarkable contribution to the ESTER study and for the
special moments outside the office (sometimes with books, excellent food and wine).
I am also grateful for Sigrid Rosten and Liisa Saarikoski for all the work you have
done for the ESTER study. I would like to sincerely thank all of my co-authors
Professor Sture Andersson, Professor Katri Räikkönen, Professor Aimo Ruokonen,
Docent Karoliina Wehkalampi, Docent Anneli Pouta, Docent Anu-Katriina Pesonen,
Docent Outi Mäkitie, Jouko Sundvall, Sonja Strang-Karlsson, Silja Martikainen, and
Risto Karvonen, for their valuable contributions to the original publications. I am so
thankful for all the fellow researchers and friends at the study group, especially Maiju
Mikkonen, Suvi Alenius, Pieta Näsänen-Gilmore, Nina Kaseva, Sanna Koivunen,
Tuija Männistö, Sanna Mustaniemi, Heli-Kaisa Saarenpää, Minna Salonen, Riikka
Pyhälä-Neuvonen, Soile Tuovinen, Jari Lahti, Marius Lahti, and Kati HeinonenTuomaala for collaboration and great company in congress trips and other occasions. I
feel privileged to work in such an outstanding research team.
I am also grateful to Docent Marita Valkama who introduced me the possibility
to do research, and got me interested about it. I am grateful for all my colleagues at
the Department of Pediatrics, for providing an atmosphere that was favorable for both
scientific and clinical work during this period.
Sincere thanks goes to my colleagues of Kastelli Research Center, especially
those on the third floor, for support and counseling during the working days, and
cheerful friendship. And all my friends outside work, thank you for the much-needed
brakes during this project and all the unforgettable moments we have shared. Above
all, I wish to express my loving thanks to Annamari and Sini for invaluable friendship
throughout the years. Thank you for always being there for me!
My parents, Annikki and Timo, it is hard to find words to express my gratitude
for your love, encouragement and support throughout my life. I also wish to express
my loving thanks to my beloved sister Annina and brother(-in-law) Saku, I have been
so lucky to have you beside me. You are priceless! My parents-in-law Anneli and
Jussi, thank you for taking care for our children with sincere joy and warmness when
10
I needed to concentrate on my work – or forget it. I warmly thank my other close
relatives for their support and shared moments.
Finally, my heartfelt thanks go to my closest loved ones. My smart and bighearted son Luka and adorable daughter Linda, you have taught me the most
important things in my life. And my husband Antti, I would not be where I am today
without your flexibility, help and endless support – You are my rock!
The largest part of this study has been made under the Doctoral Programs in
Public Health (DPPH), to which I want to express my thanks. This work was
supported financially also by Yrjö Jahnsson Foundation, Sigrid Juselius Foundation
The Finnish Medical Foundation, Finnish Paediatric Society, Finnish Concordia Fund
and University of Oulu Graduate School (UniOGS).
Oulu, March 2015
Marika Sipola-Leppänen
11
12
Abbreviations
ABP
AGA
ApoA1
ApoB
BIA
BP
CI
CVD
DBP
DOHaD
DXA
ELBW
EPT
FLI
FMBR
GA
HDL-C
HeSVA
HOMA-IR
hsCRP
ICD-10
IUGR
LBM
LBW
LDL-C
LGA
LPa
LPT
METh
MRI
NICU
NFBC
OGTT
OR
REE
Ambulatory blood pressure
Appropriate for gestational age
Apolipoprotein A1
Apolipoprotein B
Bioimpedance analysis
Blood pressure
Confidence interval
Cardiovascular disease
Diastolic blood pressure
Developmental origins of health and disease
Dual X-ray absorptiometry
Extremely low birth weight
Early preterm
Fatty liver index
Finnish Medical Birth Register
Gestational age
High-density lipoprotein cholesterol
the Helsinki Study of Very Low Birth Weight Adults
Homeostasis model assessment of insulin resistance
High-sensitivity C-reactive protein
International Classification of Diseases
Intrauterine growth retardation
Lean body mass
Low birth weight
Low-density lipoprotein cholesterol
Large for gestational age
Lipoprotein (a)
Late preterm
Metabolic equivalent hour
Magnetic resonance imaging
neonatal intensive care unit
Northern Finland Birth Cohort
Oral glucose tolerance test
Odds ratio
Resting energy expenditure
13
SBP
SD
SGA
TC
TG
VLBW
VLGA
WHO
14
Systolic blood pressure
Standard deviation
Small for gestational age
Total cholesterol
Triglyceride
Very low birth weight
Very low gestational age
World Health Organization
List of original articles
This thesis is based on the following publications, which are referred throughout the
text by their Roman numerals:
I
Sipola-Leppänen M, Hovi P, Andersson S, Wehkalampi K, Vääräsmäki M, StrangKarlsson S, Järvenpää AL, Mäkitie O, Eriksson JG & Kajantie E. Resting energy
expenditure in young adults born preterm ─ the Helsinki study of very low birth
weight adults. PLoS One.6(3):e17700.
II Sipola-Leppänen M, Vääräsmäki M, Tikanmäki M, Hovi P, Miettola S, Ruokonen A,
Pouta A, Järvelin M & Kajantie E (2014) Cardiovascular risk factors in adolescents
born preterm. Pediatrics 2014: 134(4): 1072—1081.
III Sipola-Leppänen M, Vääräsmäki M, Tikanmäki M, Matinolli H, Miettola S, Hovi P,
Wehkalampi K, Ruokonen A, Sundvall J, Pouta A, Eriksson JG, Järvelin M, Kajantie
E. Cardiometabolic risk factors in adults born preterm. Am J Epidemol. 2015: In press.
IV *Sipola-Leppänen M, *Karvonen R, Tikanmäki M, Matinolli H, Martikainen S,
Pesonen A, Räikkönen K, Järvelin M, Hovi P, Eriksson JG, Vääräsmäki M, Kajantie
E. Ambulatory blood pressure and its variability in adults born preterm. Hypertension
2015;65:615—621.
*Equal contribution.
15
16
Contents
Abstract
Tiivistelmä
Acknowledgements
9
Abbreviations
13
List of original articles
15
Contents
17
1 Introduction
21
2 Review of the literature
23
2.1 Preterm birth ........................................................................................... 23
2.1.1 Causes of preterm birth ................................................................ 25
2.1.2 Epidemiology of preterm birth ..................................................... 26
2.2 Cardiometabolic risk factors ................................................................... 30
2.3 Developmental Origins of Health and Disease (DOHaD) ...................... 32
2.4 Long-term cardiometabolic risk factors related to preterm birth ............ 33
2.4.1 Body size and composition ........................................................... 34
2.4.2 Resting energy expenditure .......................................................... 36
2.4.3 Blood pressure .............................................................................. 39
2.4.4 Lipid metabolism .......................................................................... 41
2.4.5 Glucose regulation ........................................................................ 45
2.4.6 Other cardiometabolic biomarkers ............................................... 45
2.4.7 Vascular structure and function .................................................... 46
2.4.8 Lifestyle ........................................................................................ 46
2.4.9 Summary ...................................................................................... 47
3 Aims
49
4 Subjects and methods
51
4.1 Helsinki Study of Very Low Birth Weight Adults (I) .............................. 51
4.1.1 The study population .................................................................... 51
4.1.2 Perinatal and neonatal data ........................................................... 53
4.1.3 Questionnaire................................................................................ 53
4.1.4 Clinical examination ..................................................................... 53
4.1.5 Resting energy expenditure and lean body mass .......................... 53
4.2 Northern Finland Birth Cohort 1986 (II–IV) .......................................... 54
4.2.1 The study population .................................................................... 55
4.2.2 Perinatal and neonatal data ........................................................... 56
4.2.3 Questionnaire................................................................................ 57
17
4.2.4 Clinical examination ..................................................................... 57
4.2.5 Laboratory analyses ...................................................................... 57
4.3 The ESTER Study (III, IV) ..................................................................... 58
4.3.1 The study population .................................................................... 58
4.3.2 Perinatal and neonatal data ........................................................... 60
4.3.3 Questionnaire ................................................................................ 60
4.3.4 Clinical examination ..................................................................... 60
4.3.5 Laboratory analyses ...................................................................... 61
4.3.6 Ambulatory measurements ........................................................... 62
4.3.7 Definitions of pre-hypertension, hypertension, fatty liver
index, obesity and metabolic syndrome ....................................... 62
4.3.8 Subjects included in the analysis and the attrition analyses ......... 64
4.4 Statistical methods .................................................................................. 66
5 Results
73
5.1 Body size and composition (I, II, III) ...................................................... 73
5.1.1 Body size and composition in adults born preterm with
VLBW (I) ..................................................................................... 73
5.1.2 Body size in adolescents born preterm in NFBC (II) ................... 73
5.1.3 Body size and composition of young adults born preterm
(III) ............................................................................................... 75
5.2 Resting energy expenditure (I) ................................................................ 78
5.3 Blood pressure (II–IV) ............................................................................ 79
5.3.1 Blood pressure in adolescents born preterm (II) ........................... 79
5.3.2 Blood pressure in young adults born preterm (III) ....................... 81
5.3.3 Ambulatory blood pressure in young adults born preterm
(IV) ............................................................................................... 82
5.3.4 Hypertension (II, III) .................................................................... 87
5.4 Lipid metabolism (II, III) ........................................................................ 87
5.4.1 Lipid profile of adolescents born preterm (II) .............................. 87
5.4.2 Lipid profile of young adults born preterm (III) ........................... 89
5.5 Glucose regulation (II, III) ...................................................................... 92
5.5.1 Glucose metabolism of adolescents born preterm (II) .................. 92
5.5.2 Glucose metabolism of young adults born preterm (III) .............. 93
5.6 Other metabolic biomarkers (III) ............................................................ 95
5.7 Metabolic syndrome (III) ........................................................................ 96
6 Discussion
99
18
6.1 Body size and composition (I–III) .......................................................... 99
6.2 Resting energy expenditure (I) .............................................................. 102
6.3 Blood pressure (II–IV) .......................................................................... 103
6.3.1 Ambulatory blood pressure and variability of blood
pressure....................................................................................... 104
6.3.2 Sex-specific analysis .................................................................. 105
6.3.3 Hypertension .............................................................................. 105
6.3.4 Possible mechanisms .................................................................. 106
6.4 Lipid metabolism (II, III) ...................................................................... 107
6.5 Glucose regulation (II, III) .................................................................... 108
6.6 Other metabolic biomarkers (IV) ...........................................................110
6.7 Metabolic syndrome (II, III) .................................................................. 111
6.8 Limitations and strengths of the studies ................................................. 111
6.9 Significance of the findings and future perspectives..............................113
7 Conclusions
117
References
119
Original articles
141
19
20
1
Introduction
Each year, 14.9 million infants worldwide, approximately one in nine live-born, are
born preterm, i.e. before 37 weeks of gestation (Goldenberg et al.. 2008, Blencowe et
al.. 2012, EUROCAT 2013). In Finland the proportion of premature infants is
smaller, 5.7% of all infants in 2013 (Vuori & Gissler 2014). Owing to the
development of neonatal intensive care in recent decades, the prognosis of infants
born preterm has changed dramatically and most of them survive to adulthood.
However, compared with the natural environment of the fetus, preterm infants
continue their development and growth in a substantially different environment
such as a neonatal intensive care unit (NICU). A growing body of evidence shows
that pre- and postnatal events have long-lasting effects on a child’s health: those
born smallest and most immature, such as those born with very low birth weight
(<1500 g) or very preterm (before 32 weeks of gestation), show enhancement of
cardiometabolic risk factors as adults, for example elevated blood pressure (Hack et
al. 2005, Hovi et al. 2010, Keijzer-Veen et al. 2010b, de Jong et al. 2012, Parkinson
et al. 2013), impaired glucose regulation (Hofman et al. 2004, Hovi et al. 2007), and
atherogenic lipid profiles (Parkinson et al. 2013). However, most of this evidence is
limited to these conventional cardiometabolic risk factors in the extreme groups of
adults with very low birth weight or born very preterm.
Most (about 70–80%) preterm infants are born moderately (at 32–36 weeks of
gestation) or late preterm (at 34–36 weeks of gestation) (EUROCAT 2013, Martin et
al. 2013, Vuori & Gissler 2014). However, only a few studies concerning adult
cardiometabolic risks have included the whole range of preterm births. The results of
these studies suggest that a linear relationship exists between shorter length of
gestation and higher blood pressure in adulthood (Järvelin et al. 1993b, Johansson et
al. 2005). If a similar “dose-response” relationship exists as regards other
cardiometabolic risk factors, even moderately increased risks in the much larger
group of people born late or moderately preterm could potentially reflect a larger
public health burden.
The focus of this thesis was to evaluate the association between preterm birth and
cardiometabolic risk factors in healthy adolescents and adults in three cohort studies,
using conventional risk factors, such as body mass and blood pressure, the established
components and criteria of metabolic syndrome, as well as emerging risk factors that
may reflect specific pathophysiological pathways, such as resting energy expenditure,
body composition, plasma apolipoproteins, uric acid, and markers of inflammation
and fatty liver disease.
21
22
2
Review of the literature
2.1
Preterm birth
Normal pregnancy usually takes an average of 40 weeks (or 280 days) counted from
the beginning of the woman’s last menstrual period. However the range in length of
gestation of live-born infants is wide, from 22 to over 43 weeks (Fig. 1). It is based on
the assumption that the length of the menstrual cycle is 28 days and ovulation occurs
on the 14th day after the last menstrual period. However, there are several limitations
of dating based on last menstrual period, such as uncertainty regarding the last
menstrual period date, menstrual disturbances including oligomenorrhea and delayed
ovulation and bleeding disturbance in early pregnancy. In recent decades it has
become increasingly common to verify the expected delivery date by means of
ultrasonography, usually in the first trimester, or at the latest before 20 weeks of
gestation.
Fig. 1. Gestational age distribution of live-born infants in Finland in 2013 (Vuori & Gissler
2014).
23
According to the International Classification of diseases: tenth revision (ICD-10) a
live birth occurs when a fetus, irrespective of gestational age, exits the maternal body
and subsequently shows any sign of life, such as voluntary movement, heartbeat, or
pulsation of the umbilical cord, for however brief a time and regardless of whether the
umbilical cord or placenta are intact (World Health Organization 2004). The cut-offs
for live birth vary between countries from 20 to 28 weeks (Blencowe et al. 2012). In
Finland the cut-off for live birth is 22+0 gestational weeks or birth weight ≥ 500 g
(Vuori & Gissler 2014). According to the number of completed gestational weeks
World Health Organization (WHO) categorizes births in three groups:
–
–
–
preterm (<37 gestational weeks)
term (37 to 41 gestational weeks)
post-term (≥42 gestational weeks). (WHO 1977)
An infant born too early (before 37 full gestational weeks) is called a preterm or
premature infant. Preterm birth is also traditionally categorized in smaller groups
according to length of gestation:
–
–
–
extremely preterm (<28 weeks)
very preterm (28 to 31 weeks)
moderately preterm (32 to 36 weeks) (Engle et al. 2007, Blencowe et al.
2012).
As most preterm infants are born at between 34 to 36 weeks, moderate preterm birth
was further split to focus on late preterm birth (34 to 36 completed weeks) by the
American College of Obstetricians and Gynecologists (Engle et al. 2007).
Especially before the time when ultrasonography was widely used, categorization of
preterm infants was based on birth weight:
–
–
–
extremely low birth weight, ELBW (<1000 g)
very low birth weight, VLBW (<1500 g)
low birth weight, LBW (<2500 g).
However, in this categorization low birth weight can be due to prematurity or being
born small for gestational age, or both. Birth weight in relation to gestational age has
been used as an indicator of intrauterine growth (Lee et al. 2003). There are several
national criteria used and they are very different from each other (Hadlock et al. 1991,
Ioannou et al. 2012, Papageorghiou et al. 2014):
24
–
–
–
small for gestational age, SGA (more than two standard deviations (SDs)
below the mean, or <10th percentile)
appropriate for gestational age, AGA (within ± 2SDs around the mean, or
within the 10th and 90th percentiles)
large for gestational age, LGA (more than 2SDs above the mean, or >90th
percentile).
2.1.1 Causes of preterm birth
The obstetric precursors of preterm delivery are categorized in three groups: 1)
spontaneous labor (40–45% of preterm births), 2) rupture of membranes (25–30% of
preterm births), and 3) “indicated”/iatrogenic labor (30–35% of preterm births) in
conditions that threaten the health or life of the mother or fetus (Goldenberg et al.
2008). Preterm birth is thought to be a pathological condition or syndrome with
multiple etiologies including inflammation, infection, uteroplacental ischemia or
hemorrhage, uterine over-distension, stress, and an immunological process (Romero
et al. 2006). The etiology is not fully understood and a precise mechanism cannot be
defined in most of the cases.
The risk factors of preterm birth include demographic characteristics, medical
history and lifestyle, pregnancy history, and medical conditions in the present
pregnancy (1.1.1.1.Table 1). Some of these risk factors may not be related to preterm
birth independently and preterm birth may be the outcome of the interaction of several
risk factors. There is also evidence of a genetic background to birth timing (Plunkett
et al. 2009) and spontaneous preterm birth (Plunkett & Muglia 2008, Wilcox et al.
2008, Haataja et al. 2011): women with a history of preterm labor have a more than 5fold risk of preterm labor in the next pregnancy (Bezold et al. 2013). The results of
register studies concerning siblings, half-siblings and/or twins have suggested that
both maternal and fetal genes have an effect on the length of gestation and/or the risk
of preterm birth (Lunde et al. 2007, York et al. 2013).
Although there have been many efforts to predict and prevent preterm birth,
means to avoid prematurity are scanty. Screening and minimization of the risks, for
example by treatment of bacterial vaginosis or urinary tract infections, may help in
reaching the optimal length of gestation. Bed rest has been a traditional nonpharmacologic treatment to prevent preterm births, but there is a lack of evidence for
its effectiveness. In addition, tocolytic therapy can be used to inhibit contractions in
cases of threatened preterm labor (Committee on Practice Bulletins—Obstetrics
2012).
25
Table 1. Risk factors of preterm birth.
Characteristics of the of mother
Low socioeconomic status or low educational attainment
Age <18 or >35 years
Low body mass index or poor nutritional status
Unmarried life
Smoking, alcoholism or drug use
Hard working conditions
High levels of psychological or social stress or exposure to objectively stressful conditions
Depression
Chronic disease
Ethnic background
Pregnancy history
Primipara
Previous second-trimester miscarriage or stillbirth
Previous preterm labor or infant with low birth weight
Previous operation of uterine cervix
Present pregnancy
Multiple pregnancy
Cervical insufficiency
Low inter-pregnancy interval (< 6 months)
Polyhydramnion or oligohydramnion
Abdominal surgery in the second or third trimester
Contractions
Placenta previa
Placental abruption
Hypertensive pregnancy disorder
Intrauterine growth retardation or malformation
Hepatic cholestasis of pregnancy
Vaginitis or cervicitis
Premature rupture of membranes
References: Olsen et al. 1995, Goldenberg et al. 2008, Blencowe et al. 2012, Romero et al. 2014.
2.1.2 Epidemiology of preterm birth
More than one in ten of all infants are born preterm: the worldwide prevalence of
preterm birth is 11.1%, i.e. 14.9 million births in 2010. However, the prevalence
ranges from 5% to 18% depending on the country (Blencowe et al. 2012). For
example, in Europe the rate varies from about 5% to 10% (EUROCAT 2013). In
Finland it has been low and relatively stable during the last ten years, being highest
26
(6.3%) around 2000, and in 2013 it was 5.7% (Vuori & Gissler 2014). In 2010 the
highest rates of preterm birth were in Southeast Asia (13.6%), South Asia (13.3%),
and Sub-Saharan Africa (12.3%) (Blencowe et al. 2012). The USA also has a high
preterm birth rate (12%) (Blencowe et al. 2012, Martin et al. 2013). There are also
differences in preterm birth rates between ethnic groups within countries: for example
among black Americans the rate was as high as 17.5%, when the rate was 10.9%
among white Americans (Blencowe et al. 2012). The incidence of preterm birth is
rising worldwide (Blencowe et al. 2012, Zeitlin et al. 2013).
Most preterm infants are born late preterm: For example in Finland 75.5% of
preterm infants (and 4.2% of all infants) were born late preterm in 2013 (Vuori &
Gissler 2014) and in the USA the rate was 70.8% (8.5% of all infants) in 2010 (Fig. 2)
(Martin et al. 2013).Preterm birth is more common among boys than girls – about
55% of all preterm infants are boys (Zeitlin et al. 2002). Boys born preterm are also at
a higher risk of neonatal mortality and long-term impairment (Smith 2000, Stevenson
et al. 2000, Kent et al. 2012).
Fig. 2. Proportions of early and late preterm births of all births in Finland (2011–2012)
and the United States of America (2010) (Martin et al. 2013, Vuori & Gissler 2013).
Mortality related to preterm birth
The intensive care of neonates born preterm has improved remarkably since the
1960s. In the late 1960s assisted ventilation was introduced, in the 1970s the use of
antenatal and postnatal glucocorticoids was started and in the 1980s the use of
27
exogenous surfactant started to prevent bronchopulmonary dysplasia and many other
conditions (Philip 2005). Most of the treatments were primarily focused on improving
the outcomes related to pulmonary problems. However, monitoring of the infant by
physiological and biochemical measurements the ability to provide nutrition
intravenously, and pharmacological manipulation were also important (Philip 2005).
In addition to advances in technology, skin-to-skin care (kangaroo mother care) and
breastfeeding have reduced infant mortality and morbidity (Lawn et al. 2010,
Flacking et al. 2012). However, over one million infants every year die as a result of
complications related to preterm birth. It is estimated that every third neonatal death
(<28 days after birth) is caused by preterm birth and it is the largest direct cause of
neonatal mortality and the second most common cause of death after pneumonia in
children under 5 years old (Liu et al. 2012). In the U.S. in 2010, 35.2% of infant
deaths were related to preterm birth (Mathews & MavDorman 2013) and in Europe
the neonatal mortality of infants born at <32 weeks accounts for 48% of all neonatal
deaths (EUROCAT 2013). Overall neonatal mortality is highest in developing regions
including Southeast Asia. However, the proportion of deaths related to preterm birth
is similar worldwide, about 30–36% of all neonatal deaths (Liu et al. 2012). In
Finland the perinatal mortality rate in preterm infants was 3.8% as in all infants it was
0.35% in 2013 (Vuori & Gissler 2014).
Most neonatal deaths occur during the 7 days after birth (“early neonatal” or
perinatal mortality). Gestational age correlates negatively to the perinatal and neonatal
mortality rate (Fig. 3). In infants born at <34 weeks the perinatal mortality rate was
3.5% and in infants born at 34–36 gestational weeks the rate was 0.6% in Finland in
2012. Although infants born late preterm are often referred to as “near term”,
mortality rates are higher than in term infants. For example, in the United States the
mortality rate of late-preterm infants was found to be 4.6 times higher than in term
infants (Engle et al. 2007). Those born preterm have an increased risk of mortality
throughout childhood, but not in adolescence (Swamy et al. 2008, Crump C 2011).
Again, in young adulthood, preterm birth has been associated with increased
mortality, even among individuals born late preterm (Crump C 2011). In spite of
increased mortality rates, most infants born preterm survive to adulthood.
28
Fig. 3. Perinatal mortality rate by gestational age in weeks in Finland in 2013 (Vuori &
Gissler 2014).
Morbidity related to preterm birth
Despite the developments in intensive care of preterm infants in past decades, preterm
survivors still have higher morbidity rates than infants born at term. Some of the
factors associated with preterm birth, such as intrauterine growth retardation (IUGR),
are related to morbidity of preterm infants. However, preterm infants are exposed to a
very different environment in their first weeks of postnatal life than if they would
have been in utero till term. In addition, most organs, such as the lung, brain and
kidneys, are immature and especially susceptible to the consequences of preterm birth
(Saigal & Doyle 2008). As with neonatal mortality, morbidity rates are also lower the
higher the gestational age is at birth (Bastek et al. 2008). However, late-preterm
infants are much more likely to show newborn morbidity than term infants (Bastek et
al. 2008, Committee on Obstetric 2008, Saigal & Doyle 2008, Shapiro-Mendoza et al.
2008, Kugelman & Colin 2013). Common neonatal complications of preterm
neonates are presented in Table 2.
29
In the first years of life, children born preterm with VLBW, and also those born
late-preterm, have more hospital readmissions than children born at term. Rates of
acute hospitalization decreases in adolescence (Saigal et al. 2001, Bird et al. 2010,
Korvenranta et al. 2010) and in early adulthood rates of hospitalization are similar to
those among term-born peers (Saigal et al. 2007), though they have higher rates of
chronic conditions than controls (Hack et al. 2002). The most frequently occurring
medical conditions in children and adults born preterm are asthma, recurrent
bronchitis, cerebral palsy, mental retardation, neurosensory impairment, and epilepsy
(Hack et al. 2002, Saigal et al. 2007, Moster et al. 2008, Korvenranta et al. 2010).
However, most of those who survive after preterm birth to reach adolescence and
adulthood are healthy.
Table 2. Common neonatal complications after preterm birth.
Respiratory distress syndrome and bronchopulmonary dysplasia
Persistent pulmonary hypertension of newborns
Pneumothorax
Patent ductus arteriosus
Apnea/bradycardia
Hyperbilirubinemia
Intraventricular or periventricular hemorrhage
Sepsis and other infections
Temperature instability
Hypoglycemia
Dehydration
Feeding difficulties and under-nutrition
Necrotizing enterocolitis
References: Wang et al. 2004, Philip 2005, Engle et al. 2007, Saigal & Doyle 2008.
2.2
Cardiometabolic risk factors
Cardiometabolic risk refers to a high lifetime risk for cardiovascular disease
(CVD) (Sipola-Leppänen et al. 2015). CVDs include diseases of the heart,
vascular diseases of the brain, and diseases of blood vessels. They can be
categorized into two groups according to their etiology to those developed as a
result of atherosclerosis (ischemic heart disease or coronary artery disease,
cerebrovascular disease, diseases of the aorta and arteries – including
hypertension and peripheral vascular disease) and others (congenital heart
disease, rheumatic heart disease, cardiomyopathies, cardiac arrhythmias) (Mendis
30
et al. 2011). The present work is concentrated on cardiovascular disease risks
related to atherosclerosis. Atherosclerosis is the underlying complex pathological
process in the walls of blood vessels that results in coronary heart disease and
cerebrovascular disease.
Table 3. Conventional cardiometabolic risk factors.
Behavioral
Tobacco smoking, including second-hand smoke
Physical inactivity
Unhealthy diet (e.g. rich in salt and calories)
Harmful use of alcohol
Metabolic risk factors
Raised blood pressure
Raised blood sugar
Dyslipidemias
Overweight and obesity
Inflammation
Hypercoagulation
Other
Low socioeconomic status
Advancing age
Male sex
Genetic disposition
Psychological factors (e.g. stress, depression)
Air pollution
References: Berenson et al. 1998, Brunzell et al. 2008, Mendis et al. 2011, Lim et al. 2012.
Atherosclerosis starts to develop as early as in childhood and adolescence due to
the overall effect of a number of risk factors (presented in Table 3) (Järvisalo et
al. 2001, Raitakari et al. 2003, Koskinen et al. 2009, Lewandowski et al. 2014).
Behavioral and metabolic risk factors play a key role in the etiology of
atherosclerosis (Mendis et al. 2011). Previous studies have shown that the fetal
period and childhood have a substantial effect on an individual’s risk of later
cardiovascular disease (see section 2.3). CVDs are the leading cause of death
worldwide, representing about 30% of all deaths globally and 47% of all deaths in
Europe, and the numbers are increasing (World Health Organization 2011,
Nichols et al. 2012). In Finland ischemic heart disease causes more than every
fifth death (21%, about 11,000 deaths [add time period], 53% men), though the
31
numbers have decreased in the past twenty years (Statistics Finland 2012). Most
cardiovascular diseases could be prevented by reducing the risk factors.
Metabolic syndrome is a combination of factors that multiply a person's risk of
heart disease, diabetes and stroke (Lakka et al. 2002, Onat et al. 2002). The risk
factors include central (abdominal) obesity, raised blood pressure, elevated fasting
plasma glucose levels, and dyslipidemias (high serum triglyceride, and low highdensity cholesterol (HDL-C) levels). Various diagnostic criteria for metabolic
syndrome have been in use, decided upon by different organizations (the WHO, the
National Cholesterol Treatment panel III, the International Diabetes Foundation and
the American Heart Association/National Heart, Lung, and Blood Institute), with the
same risk factors but different cut-off points. However, in 2009 these major
organizations proposed a Joint Interim Statement in an attempt to unify the criteria
(Alberti et al. 2009). The cut-off levels of these criteria are presented in section 4.3.7.
Obesity, particularly abdominal obesity, is a key component underlying many
characteristics of metabolic syndrome.
The prevalence of metabolic syndrome varies depending on the criteria used and
the population. In 2001–2002 , among adolescents born in Northern Finland, the
overall prevalence of metabolic syndrome according to the International Diabetes
Foundation pediatric definition was 2.4% (95% CI 2.0 to 2.8%) and according to the
International Diabetes Foundation adult definition the overall prevalence was lower,
1.7% (95% CI 1.3 to 2.0%) (Pirkola et al. 2008). In Finland the overall prevalence of
metabolic syndrome in young adults aged 24–39 years in 2001 was 10–15% and 6
years later in 30- to 45-year-old adults it was 15–23% depending on the metabolic
syndrome definition used. The prevalence of metabolic syndrome increased from
1.0% to 7.5% in 24-year-old participants between the years 1986 and 2001. The
increase was mostly driven by an increase in central obesity (Mattsson et al. 2007).
Cardiometabolic syndrome, on the other hand, is a constellation of metabolic
dysfunctional characteristics – cardiovascular, renal, metabolic, hemodynamic,
prothrombotic and inflammatory abnormalities (Castro et al. 2003, Govindarajan et
al. 2005).
2.3
Developmental Origins of Health and Disease (DOHaD)
In the 1980’s David Barker and his colleagues presented the theory that
undernutrition during gestation was an important early origin of adult cardiac and
metabolic disorders due to fetal programming that permanently shaped the body’s
32
structure, function and metabolism and contributed to adult disease (Gillman 2005,
Barker 2007). This theory was based on epidemiological studies of birth and death
records that revealed a high geographic correlation between rates of infant mortality
and certain classes of later adult deaths as well as an association between birth weight
and rates of adult death from ischemic heart disease (Barker & Osmond 1986, Barker
et al. 1989, Barker et al. 1993). The theory is often called “Barker’s hypothesis” and
it stimulated interest in the fetal origins of adult disorders, which expanded and led to
the formation of an International Society for Developmental Origins of Health and
Disease (DOHaD).
The hypothesis has been supported by a worldwide series of animal (Mcmillen &
Robinson 2005, Nuyt 2008) and epidemiological studies. These studies have shown
that those who are born with low birth weight have, for example, increased incidences
of cardiovascular disease and mortality (Barker et al. 1989, Osmond et al. 1993,
Forsen et al. 1997, Rich-Edwards et al. 1997, Kaijser et al. 2008), higher blood
pressure (Law et al. 1993, Law & Shiell 1996, Barker et al. 2001), increased rates of
hypertension (Barker & Osmond 1988, Barker 1992, Huxley et al. 2000, Järvelin et
al. 2004b, Johansson et al. 2005), and impaired glucose regulation or type 2 diabetes
(Hales et al. 1991, Robinson et al. 1992, Barker et al. 2002, Eriksson et al. 2006,
Whincup et al. 2008, Kaijser et al. 2009). In addition, length of gestation seems to be
associated with mortality from cardiovascular disease (Koupil et al. 2005) and
diabetes (Kaijser et al. 2009), which indicates similar metabolic consequences in
adults born preterm and those born with low birth weight.
2.4
Long-term cardiometabolic risk factors related to preterm birth
As with morbidity and mortality in infancy, the long-term impact of preterm birth is
usually inversely related to the gestational age at birth, with the greatest effects being
seen in those born very or extremely preterm. Most of the relevant follow-up studies
have been focused mainly on health during childhood.
In Swedish cohort studies low gestational age at birth was independently
associated with increased mortality in early childhood and young adulthood
(Crump C 2011), and preterm birth before 32 weeks was associated with an
almost twofold increased risk of cerebrovascular disease compared with that
among term-born individuals, while individuals born at 32–36 weeks were not at
increased risk (Ueda et al. 2014). In addition, in older people shorter length of
gestation has been associated with an elevated risk of cerebrovascular disease
(Koupil et al. 2005), but not with later ischemic heart disease (Koupil et al.
33
2005), or the association was found only when adjusted for birth weight (Kaijser et
al. 2008). However, studies on older people might be affected by survival bias, as the
survival rate of preterm infants was much lower several decades ago.
Because ischemic heart disease is not prevalent in young adults, relevant studies
are often concentrated on risk factors, not the full-blown syndrome. There are several
cohort studies of survivors who have been followed longitudinally from birth into
adolescence or adulthood. Most of them include subjects born with VLBW or VLGA
and subjects have been selected according to birth weight rather than gestational age,
mainly because gestational age was more uncertain in the era before routine antenatal
ultrasonographic examination. In addition, those individuals whose length of gestation
was determined ultrasonographically are now young adults.
2.4.1 Body size and composition
In the early postnatal period infants born preterm show substantial growth failure,
which is usually followed by a period of catch-up growth. The catch-up starts in early
infancy and usually stops at 2–3 years of age (Hack et al. 2003, Saigal et al. 2006).
Despite the catch-up, adults born preterm are on average shorter (Kistner et al. 2000,
Peralta-Carcelen et al. 2000, Weiler et al. 2002, Bonamy et al. 2005, Rogers et al.
2005, Saigal et al. 2006, Hovi et al. 2007, Rotteveel et al. 2008a, Indredavik Evensen
et al. 2009) and lighter (Kistner et al. 2000, Peralta-Carcelen et al. 2000, Rogers et al.
2005, Indredavik Evensen et al. 2009) than their controls (Virhe. Viitteen lähdettä ei
löytynyt.), and the catch-up for weight is more pronounced than that for height (Hack
et al. 2003, Saigal et al. 2006).
Catch-up in weight may lead to altered body composition in adulthood. For
example, in term-born individuals, the early catch-up weight gain has been shown to
be associated with later obesity (Ong et al. 2000), which is a key component
underlying many characteristics of metabolic syndrome and is a major health problem
throughout the world. Most of the studies on the body size of former preterm infants
concern adults born with VLBW or VLGA and they have reported lower weight in
adolescents and adults born preterm with VLBW or ELBW, which was explained by
lower lean body mass (LBM, aka fat-free mass, Table 5) (Peralta-Carcelen et al.
2000, Hovi et al. 2007). Although one group reported more adipose tissue in adults
born preterm (≤33 w) (Thomas et al. 2011), two others reported no difference in body
composition between adults born preterm (<32 wk or <1500 g) and those born at term
(Weiler et al. 2002, Rotteveel et al. 2008a). However, in studies on adults born
34
Table 4. Mean differences (with 95% CI or P value) in body size in adolescents and
adults born preterm compared with term-born controls.
Authors
Age
Subjects
Height (cm)
Weight (kg)
BMI
≤800 g
-7.9 (P<0.001)
-2.3 (P<0.01)
0.51 (NS)
Women
Rogers et al. 2005
~17
Saigal et al. 2006
21.5—
<1000 g -6.2 (-8.3, -4.0) -7.1 (-11.8, -2.4) -0.75 (-2.5, 0.99)
26.5
Hack et al. 2003
~20
<1500 g -1.2 (-3.2, 0.9)
-2.0 (-6.9, 2.8)
-0.5 (-2.1, 1.0)
Hovi et al. 2007
18─27
<1500 g -5.3 (-7.3, -3.2)
W: -8.5%
-2.4% (-6.7, 2.1)
(-12.9, -3.8)
Rotteveel et al. 2008
~20
<32 w
-2.0 (P=0.003)
-2.1 (P=0.12)
0.3 (P=0.94)
Edstedt Bonamy et al 2005
~16
≤34 w
-3 (P=0.03)
1 (P=0.76)
1 (P=0.23)
-9.1 (P<0.01)
-0.35 (NS)
Men
Rogers et al. 2005
~17
Saigal et al. 2006
21.5—
≤800 g -10.2 (P<0.001)
<1000 g
26.5
Hack et al. 2003
~20
-7.2 (-10.3, -
-6.5 (-11.7, -1.2) -0.15 (-1.8, 1.5)
4.1)
<1500 g -3.1 (-5.2, -1.1)
-10.5 (-14.8, -
-2.6 (-3.8, -1.3)
6.2)
Hovi et al. 2007
18—27
<1500 g -5.9 (-8.3, -3.5)
Rotteveel et al. 2008
~20
<32 w
Mathai et al. 2013
35.7
<37 w
-12% (-16.9, -
-5.9% (-10.4, -
8.8)
1.1)
-2.8 (P=0.003)
0.8 (P=0.12)
0.8 (P=0.94)
All: -1.5
M: 20 P=0.01)
5.8 (P=0.021)
-4.8 (P<0.05)
-9.1 (P<0.05)
NR
-3.8 (P<0.01)
-5.6 (P<0.01)
1.0 (NS)
(P=0.44)
Women and men
Peralta-Carcelen et al.
14.8 (1.8) ≤1000 g
2000
Inderavik Evensen et al.
~18
<1500 g
Weiler et al. 2002
16—19
<1500 g
-7.3 (P<0.05)
-5.7 (NS)
0.0 (NS)
Lewandowski et al. 2013
23—28
<1850g
-4.4 (P<0.001)
3.7 (P=0.33)
2.0 (P=0.003)
2009
Irving et al. 2000
~24
<2000 g
2 (NS)
6.8 (NS)
NR-
Kistner et al. 2000
23—30
<32 w
-3.2 (P<0.01)
-4.0 (P<0.01)
-0.5 (NS)
Thomas et al. 2011
18—27
≤33 w
-0.02
-1.69 (-6.8, 3.4)
-0.12 (-1.6, 1.4)
(-0.06, 0.03)
Mathai et al. 2013
35.7
<37 w
-1.5 (P=0.44)
5.1 (P=0.28)
2.2 (P=0.14)
Skilton et al. 2011
~32
<37 w
NR
NR
0.0 (P=0.66)
Abbreviations: NR, not reported; NS, not statistically significant.
35
preterm within the whole spectrum of preterm birth, adults born preterm have
been found to have a higher body mass index (BMI) and a more adipose body
composition (Table 5) (Breukhoven et al. 2012, Lewandowski et al. 2013, Mathai
et al. 2013). In addition, adults born preterm (<37 weeks) were more obese
compared with those born at term (39% vs. 14%, P=0.049) (Mathai et al. 2013).
However, some studies did not reveal any difference in body size (Irving et al.
2000, Thomas et al. 2011, Parkinson et al. 2013), or a difference was seen only in
men (Hack et al. 2003, Hovi et al. 2007). In addition to lower LBM and possibly
a more adipose body composition, adults born preterm have lower bone mineral
density (Hovi et al. 2009).
The body composition of adolescents and adults born preterm has been studied
by bioimpedance analysis (BIA), dual X-ray absorptiometry (DXA) and magnetic
resonance imaging (MRI) in previous studies. MRI allows determination of
anatomically defined compartments – for example, intra-abdominal versus
subcutaneous fat, and is one of the “gold standard” methods to assess body
composition. DXA is also a precise method that provides detailed information on
body composition (Woodrow 2007). BIA is used to measure the resistance to a weak
current (impedance) applied across extremities and provides an estimate of body fat
using an empirically derived equation. Although compared with MRI and DXA, BIA
is more likely to be affected by other factors such as position and posture of the
subject, the precision of the technique is high (Woodrow 2007). DXA and BIA do not
distinguish between visceral and subcutaneous fat tissue.
2.4.2 Resting energy expenditure
The mechanisms behind the altered body composition in former preterm infants
are not clear. Lean body mass is positively related to resting energy expenditure
(REE, or resting metabolic rate), which means the number of calories burned to
maintain basic life functions at rest (Weinsier et al. 1992, Wang et al. 2000).
Having a lower LBM, adults born preterm with VLBW would be expected to
have lower REE. However, the REE of adults born preterm has not been reported
before. There are inconsistent findings in studies comparing REE in children born
preterm and SGA with those born preterm and AGA (Mericq et al. 2009,
Sepúlveda et al. 2013). The association between LBW and REE in adulthood is
also unclear: in young adults there was no statistically significant difference in
REE between those born LBW compared with those born with normal birth
36
weight (Weitz et al. 2013). However, a study on Finnish adults (mean age 61.6
years) showed that birth weight is positively associated with adult REE
(Sandboge et al. 2012).
Within-individual REE is a very stable measurement: individual variability
ranges from 3% to 7.5% (Compher et al. 2006). However, between individuals there
are differences in REE and the results of previous studies have suggested that these
differences could be important contributors to the development of obesity (Ravussin
et al. 1988, Astrup et al. 1999). REE accounts for about two thirds of daily total
energy expenditure (Fig. 4) (Levine 2004). The remainder depends on an individual's
thermogenesis and physical activity, the amount of which varies substantially between
individuals according to their physical activity levels (Lowell & Spiegelman 2000).
Young adults born preterm with VLBW were reported to have lower rates of physical
activity energy expenditure in the Helsinki Study of Very Low Birth Weight Adults
(HeSVA) (Kaseva et al. 2012).
Fig. 4. Components of daily total energy expenditure.
37
38
18—24
Breukhoven et al. 2012
<37 w
<36 w
≤33 w
<32 w
<1500 g
<1500 g
≤1000 g
Study group
DXA
DXA
MRI
BIA
DXA
DXA
DXA
Method
M: 0.7 (NS)
NR
3.4 (P<0.01)
NR
0.9 (P<0.05)
2.2 (0.3, 4.1)
Total adipose tissue:
M: 0.2 (NS)
NR
W: -1.0 (NS)
NR
NR
W: -1.2
-1.9 (NS)
M: -12.7% (-17.1, -8.0)
W: -9.5% (-13.1, -5.7)
-4.1 (P≤0.01)
(95% CI or P value)
-4.6 (P≤0.01)
Fat mass (kg)
(95% CI or P value)
Lean body mass (kg)
6.0 (P=0.011)
NR
NR
M: -0.4 (NS)
W: 0.7 (NS)
2.5 (NS)
M: 0.0 (-2.1, 2.2)
W: -0.5 (-2.3, 1.2)
-2.9 (NS)
(95% CI or P value)
Percentage body fat
BIA, bioelectrical impedance analysis; DXA, dual X-ray absorptiometry; MRI, Magnetic resonance imaging; NR, not reported; NS, not statistically significant.
33.4—38.0
18—27
Thomas et al. 2011
Mathai et al. 2013
~20
16—19
Weiler et al. 2002
Rotteveel et al. 2008
18—27
14.8 (SD 1.8)
Age (y)
Hovi et al. 2007
Peralta-Carcalen et al. 2000
Authors
born at term.
Table 5. Mean differences in body composition measurements of adolescents and adults born preterm compared with their peers
2.4.3 Blood pressure
Office-measured blood pressure
An association between preterm birth and elevated blood pressure in later life has
been shown in many previous studies (Table 6). Most studies on adults born preterm
with low, very low or extremely low birth weight have shown higher systolic blood
pressure (SBP) in preterm subjects versus controls (Irving et al. 2000, Doyle et al.
2003, Hovi et al. 2007, Indredavik Evensen et al. 2009, Vohr et al. 2010) and higher
diastolic blood pressure (DBP) (Irving et al. 2000, Doyle et al. 2003, Hovi et al. 2007,
Vohr et al. 2010), and this has also been seen in adolescents (Pharoah et al. 1998).
However, Hack et al. found no statistically significant difference in BP in adults born
preterm with VLBW compared with controls born at term (Hack et al. 2005). Studies
on adolescents and adults born preterm at low gestational age have shown an
association between preterm birth and higher SBP levels in later life (Irving et al.
2000, Kistner et al. 2000, Rotteveel et al. 2008a, Keijzer-Veen et al. 2010b, Thomas
et al. 2011). The association is not particularly clear in studies including all subjects
born preterm (<37 weeks) (Table 6) (Barros & Victora 1999, Singhal et al. 2001b,
Järvelin et al. 2004a, Johansson et al. 2005, Dalziel et al. 2007, Cooper et al. 2009,
Lazdam et al. 2010, Rossi et al. 2011, Skilton et al. 2011, Tauzin et al. 2014). In
addition, in a meta-analysis that included 10 studies on children and adults born
preterm (mean age 17.8 years, range 6.3–22.4 years) and a mean gestational age of
30.2 weeks (range 28.8–34.1 weeks), the estimated office-measured SBP difference
was 2.5 mm Hg (95% CI 1.7–3.3 mm Hg) higher among preterm subjects versus
term-born controls (de Jong et al. 2012). In another meta-analysis that included
preterm adults, preterm birth was associated with an elevation of SBP of 4.2 mm Hg
(95% CI 2.8–5.7) (Parkinson et al. 2013).
An inverse linear association between gestational age and SBP has also been
shown. For example, -0.1 to -0.5 mm Hg changes in SBP per one-week increase in
gestational age have been reported (Siewert-Delle & Ljungman 1998, Leon et al.
2000, Järvelin et al. 2004b, Dalziel et al. 2007).
A few studies have revealed higher relative risks of hypertension in adults born
preterm compared with adults born at term, ranging from 1.2 to 2.5 (Johansson et al.
2005, Dalziel et al. 2007, Crump et al. 2011b). In addition, in the Northern Finland
Birth Cohort 1966, women born preterm had an approximately twofold risk of
39
gestational hypertension during their first pregnancies, but no increased risk of
preeclampsia (Pouta et al. 2004).
Several studies have concerned sex-specific analysis and most (Doyle et al. 2003,
Järvelin et al. 2004b, Hack et al. 2005, Cooper et al. 2009), but not all (Rotteveel et
al. 2008a, Thomas et al. 2011) have revealed a greater difference in women than in
men. A statistically significant interaction between preterm birth and sex on blood
pressure was seen in the Northern Finland Birth Cohort 1966 (Järvelin et al. 2004b).
In brief, both women and men born preterm had higher levels of office-measured
blood pressure than their peers born at term, but the difference was greater in women.
Ambulatory blood pressure
Studies on adults born preterm with VLBW (Doyle et al. 2003, Hovi et al. 2010,
Roberts et al. 2014) and born at <28 weeks (Roberts et al. 2014) have shown elevated
mean 24-h systolic ambulatory blood pressures (ABPs) (0). Doyle et al. (2003)
reported a statistically significant difference in all preterm subjects born before 28
weeks, and also a difference between women and men in a gender-specific analysis.
Again, in the Helsinki Study of Very Low Birth Weight Adults, gender-specific
analysis revealed a statistically significant difference in ABP in women only. A
gender-specific association in a meta-analysis was similar: women born preterm had a
3.5-mmHg (95% CI 1.4–5.6) higher systolic ABP than women born at term, but such
a difference was not seen in men (Parkinson et al. 2013). In contrast, another study of
young women born preterm (<32 weeks) did not reveal any statistically significant
difference in ABP (Kistner et al. 2000) (0). In a study on Turkish children (5–17 y),
preterm birth was associated with higher nocturnal systolic blood pressure, but not
with daytime or 24-hour BP (Cruickshank et al. 2013).
Variability of blood pressure
The variability of ABP is less studied. In HeSVA, the variability of daytime SBP, as
expressed by the SD of each individual’s measurements, was 1.1 mmHg (P=0.03)
higher in men born with VLBW compared with men born at term (Hovi et al. 2010).
In addition, a study concerning late preterm birth and BP in 4- to 13-year-old children
revealed higher 24-hour SBP and DBP, and higher daytime SBP and nighttime SBP
and DBP than in controls, but the investigators did not present the mean values of
ambulatory blood pressure (Gunay et al. 2014). The variability of 24-hour BP (Parati
40
1987, Frattola 1993) and SBP when awake (Tatasciore et al. 2007) independently
predicts organ damage, 24-hour SBP predicts atherosclerosis (Mancia et al. 2001),
and nighttime SBP variability is associated with cardiac event incidence in
hypertensive patients (Verdecchia et al. 1994).
2.4.4 Lipid metabolism
Dyslipidaemias represent a major risk as regards ischemic heart disease and stroke.
Globally, one third of cases of ischemic heart disease is attributable to high
cholesterol levels and hypercholesterolemia is one of the leading risk factors causing
burden of disease (Lim et al. 2012). Previous findings concerning later life serum
lipid levels of former preterm infants are inconsistent. Several studies have reported
no association between preterm birth and serum lipid levels in adulthood (Irving et al.
2000, Kistner et al. 2004, Finken et al. 2006, Rotteveel et al. 2008a, Hovi et al. 2011,
Skilton et al. 2011, Thomas et al. 2011). However, there are also findings that have
indicated a more atherogenic lipid profile in adults born preterm: Adults (aged 33.4–
38.0 years) born preterm (<37 w) had lower HDL-C concentrations and greater total
cholesterol (TC) to HDL-C ratios (Mathai et al. 2013). In a British cohort study
young adults (23–28 y) born preterm <1850 g had higher total cholesterol (TC), lowdensity lipoprotein cholesterol (LDL-C) and TG levels than their peers born at term
(Lewandowski et al. 2013). In addition, a study concerning measurement of lipids
after a meal showed that postprandial triacylglycerol levels were increased in men
born SGA (Rotteveel et al. 2008a). In the detailed HeSVA analysis of lipoprotein
profiles by nuclear magnetic resonance, young adults born with VLBW had
triglyceride-related differences in both VLDL and HDL-C subclasses compared with
their peers born at term (Hovi et al. 2013). In a meta-analysis, adults born preterm had
0.15 mmol/l (95% CI 0.01–0.30) higher fasting LDL-C concentrations (Parkinson et
al. 2013), but the difference was explained with one study (Lewandowski et al. 2013).
Furthermore, a one-week increase in gestational age (GA) has been associated
with 0.02 mmol/l lower TC levels in women, but not in men (Cooper et al. 2009) and
TG levels have been found to be inversely associated with GA in 11- to 15-year-old
children (Morley et al. 2000), but not in young adults (Dalziel et al. 2007).
41
42
163 + 169
1983
Johansson et al. 2005
Keijzer-Veen et al. 2010
NR
1982
1958
1969—1974
1966
Barros et al. 1999
Cooper et al. 2009
Dalziel et al. 2007
Järvelin et al. 2004
NR
Kerkhof et al. 2012
1982—1989
Thomas et al. 2011
Edstedt Bonamy et al. 2005
1983
Rotteveel et al. 2008
1970—1974
1973—1981
Irving et al. 2000
Kistner et al. 2000
1982—1985
1973—1975
Lewandowski et al. 2013
1978—1985
1980—1981
1977—1999
Hack et al. 2005
Hovi et al. 2007
1986—1988
Indredavik Evensen et al. 2009
Pharoah et al. 1998
195 + 208
1977—1982
Doyle et al. 2003
273 + 4356
311 + 147
279 + 2177
44 + 770
163 + 243
34 + 32
19 + 18
29 + 30
15 + 17
29 + 30
14 192 + 275 892
19 + 27
102+102
128 + 128
37 + 63
156 + 38
296 + 95
1989—1992
Vohr et al. 2010
No. of subjects + controls
Birth years
Authors and year
compared with controls born at term.
~31
~30
44–45
14–15
18–24
~16
18–27
~20
23–30
~20
~18
~24
23–28
~15
18–27
~20
~18
18+
~16
Age (years)
1.3 (1.2, 1.3)
33–36 wk.
<37 wk.
<37 wk.
<37wk.
<37 wk.
<36 wk.
≤34 wk.
≤33 wk.
<32 wk.
<32 wk.
W: 1.0 (P=0.25)
M: 0.0 (P=0.96)
M: 1.0 (P=0.59)
NR
2.44 (1.04, 3.84)
0.1 (P=0.9)
-2.8 (P<0.001)
5 (P<0.001)
5.9 (1.8, 10.1)
W: 2.7 (P=0.015)
3.5 (0.9, 6.1)
NR
0.1 (P=0.9)
2.3 (P<0.01)
9 (P<0.001)
6.5 (2.2, 10.8)
W: 6
M: 9 (P=0.001)
M: 19 (P<0.0001)
5 (P=0.155)
2.0 (-1.9, 5.9)
NR
5 (P<0.05)
4.2 (P<.001)
1.1 (−0.7, 2.9)
3.5 (1.7, 5.3)
0.4 (-1.4, 2.1)
2.2 (NS)
4.3 (1.0, 7.6)
1.9 (P=0.001)
W: 9
13 (P<0.001)
8.4 (4.1,12.7)
1.5 (1.3, 1.7)
29–32 wk.
<32 wk.
1.9 (1.3, 2.8)
7 (P<0.001)
8.4 (P<0.001)
3.2 (0.4, 6.0)
4.0 (1.5, 6.5)
1.9 (-0.2, 4.1)
6.5 (P<0.01)
8.6 (3.4, 13.9)
4 (P=0.003)
DBP (95% CI or P)
Mean difference
SBP (95% CI or P)
24–28 wk.
<2000 g
<1850 g.
≤1500 g
<1500g
<1500 g
<1500 g
<1500 g
600–1250 g
Study group
Table 6. Unadjusted mean differences (mmHg) in office-measured blood pressure in adolescents and adults born preterm
43
1984—1985
1982—1985
Tauzin et al. 2014
Singhal et al. 2001
216 + 61
16 + 15
253 + 835
44 + 336
25 + 41
52 + 32
No. of subjects + controls
13–16
~21
~32
~49
13–14
22–26
Age (years)
preterm
<37 wk.
<37 wk.
≤37 wk.
<37 wk.
<37 wk.
Study group
0.5 (NS)
10 (P<0.05)
1.5 (P=0.11)
3 (NR)
6 (P=0.04)
6.7 (P=0.006)
0 (NS)
4 (P<0.05)
0.4 (P=0.55)
0 (NR)
4 (P=0.03)
5.5 (P=0.0001)
DBP (95% CI or P)
Mean difference
SBP (95% CI or P)
Abbreviations: BP, blood pressure; DBP, diastolic BP; M, men; NR, not reported; NS, not statistically significant, SBP, systolic BP; W, women.
NR
1926—1927
Skilton et al. 2011
Siewert-Delle et al. 1998
NR
1982—1985
Lazdam et al. 2010
Rossi et al. 2011
Birth years
Authors and year
44
83+18
15+17
Kistner et al. 2000
73+20
5—17
20
~18
~18
18—27
~18
18—27
23—30
~18
18—27
<37 wk
<32 wk
<28 wk
<28 wk
<1500 g
<28 wk
<1500 g
<32 wk
<28 wk
<1500 g
Age (years) Study group
3 (P=0.26)
0.6 (-2.3, 3.6)
2.1 (0.0, 4.3)
DBP
1.5(-2.4, 5.3)
2.2 (NS)
3.5 (P=0.04)
3.2 (0.1, 6.4)
4.7 (1.4, 8.0)
0.8 (NS)
0.9 (P=0.60)
2.1 (0.3, 4.0)
1.1 (1.2, 3.5)
2.4 (0.2, 4.6)a -0.8 (-0.8, 2.5)a
6.4 (1.6, 1.1)
1.4 (P=0.10)
DBP
1.1 (P=0.38)
3 (P=0.26)
a
Adjusted for BMI
1.8 (P=0.08)
0.3 (P=0.84)
1 (P=0.92)
0.2 (P=0.92)
2 (P=0.31)
3.2 (-1.7, 8.1) 0.6 (-3.0, 4.2)
2.7 (P=0.05)
DBP
BP when asleep
SBP
NR
NR
NR
2.1 (NS)
4.2 (0.4, 8.0)
(0.7, 7.2)
3.9
-0.1 (NS)
0.5 (P=0.82)
2.8 (0.8, 4.8)
3.9 (P < 0.05)
3.6(-0.9, 8.1)
0.3 (NS)
0.8 (P=0.56)
2.0(-1.4, 5.5) 1.3 (-0.7, 3.3)
5.0 (1.6, 8.5) 1.5 (-1.0, 4.1) 3.6 (0.05, 7.1) 0.9 (-1.7, 3.6)
NR
6.7 (1.7, 11.7) 1.6 (-2.4, 5.7) 5.2 (0.5, 10.0) 1.2 (-2.8, 5.1)
0.6 (P=0.78)
5 (P=0.12)
4.5 (0.2, 8.6) 1.3 (-2.0, 4.5)
2.6 (P=0.05)
SBP
BP when awake
Mean difference in mmHg (95% CI or P value)
-0.4 (-3.4, 2.9) -1.3 (-3.7, 1.1)
4 (P=0.23)
3.8 (0.2, 7.8)
3.4 (0.4, 6.4)
SBP
24-hour BP
Abbreviations: BP, blood pressure; DBP, diastolic BP; M, men; NR, not reported; NS, not statistically significant; SBP, systolic BP; W, women.
*No. of subjects + controls.
29+30
41+27
136+120
Roberts et al. 2014
Keijzer-Veen et al. 2010
156+38
Bayrakci et al. 2012
118+120
Hovi et al. 2010
Doyle et al. 2003
Women and men
49+48
Hovi et al. 2010
Doyle et al. 2003
Men
69+72
Hovi et al. 2010
No.*
Doyle et al. 2003
Women
Authors and year
Table 7. Ambulatory blood pressure in children and adults born preterm compared with controls born at term.
2.4.5 Glucose regulation
Insulin resistance is a key component of type 2 diabetes and metabolic syndrome, and
low birth weight is associated with altered glucose regulation and diabetes (Eriksson
et al. 2006, Harder et al. 2007). However, the association between GA or preterm
birth and altered glucose metabolism in later life is inconsistent. Some studies have
revealed no difference in glucose regulation between adults born preterm vs. term
(Irving et al. 2000, Skilton et al. 2011, Thomas et al. 2011), because of a lack of
power, or a difference has been found only in those born preterm and SGA but not in
those born AGA (Rotteveel et al. 2008a). However, studies in prepubertal children
(Hofman et al. 2004, Kistner et al. 2012) and adults (Dalziel et al. 2007, Hovi et al.
2007, Pilgaard et al. 2010, Mathai et al. 2012) born preterm have shown decreased
insulin sensitivity, also shown by way of intravenous glucose tolerance tests (2004,
Kajantie et al. 2014), and higher fasting glucose (Lewandowski et al. 2013) and
insulin levels (Hovi et al. 2007, Lewandowski et al. 2013). Although GA was not
found to be associated with later diabetes in Finnish children and young adults
(Lammi et al. 2009), preterm birth increased the risk of diabetes in adulthood in other
studies (Lawlor et al. 2006a, Kaijser et al. 2009, Kajantie et al. 2010a, Pilgaard et al.
2010, Crump et al. 2011a).
2.4.6 Other cardiometabolic biomarkers
In addition to the established risk factors of cardiovascular disease listed in Table 3
(section 2.2) and those included in the criteria of metabolic syndrome, there are many
other measurable markers related to elevated CVD risk. Some previous studies have
concerned unconventional cardiometabolic risk factors possibly associated with
preterm birth and reflecting different underlying pathophysiological pathways of
CVD.
Inflammation seems to be a strong, independent risk factor of metabolic
syndrome and CVD in adults (Danesh et al. 1998, Pearson et al. 2003). However, the
predictive utility of high-sensitivity C-reactive protein (hsCRP) concentrations has
been questioned in a previous meta-analysis (Shah et al. 2009). Some investigators
have reported no difference in hsCRP or CRP levels in adults born preterm compared
with adults born at term (Skilton et al. 2011, Lewandowski et al. 2013).
Uric acid stimulates oxidative stress, endothelial dysfunction, inflammation and
vasoconstriction and is a strong predictor of type 2 diabetes and CVD, independent of
45
metabolic syndrome components (Fang & Alderman 2000). Liver transaminases and
non-alcoholic fatty liver disease are also biomarkers of these disorders, although the
literature is less consistent as to whether or not they are independent indicators of
pathology or general markers of metabolic syndrome (Sniderman et al. 2011, Lv et al.
2013). No reports have been published concerning uric acid and liver enzymes in
adults born preterm. However, one group reported differences in the levels of
(premorbid) urinary biomarkers (elevated levels of methylamines and
acetylglycoproteins; lower hippurate levels), metabolites associated with
inflammation in young adults born preterm (≤33 w) (Thomas et al. 2011).
2.4.7 Vascular structure and function
Some changes in vascular structure have been reported in young adults born preterm,
such as increased left ventricular mass and reduced function (Lewandowski et al.
2013) and impaired retinal vascularization in women (Kistner et al. 2002). Findings
concerning early markers of the atherosclerotic process, such as endothelial
dysfunction or arterial stiffness in adolescents and adults born preterm are conflicting.
Some studies have shown no association (Singhal et al. 2001b, Indredavik Evensen et
al. 2009, Kerkhof et al. 2012, Parkinson et al. 2013), and in contrast, some studies
have indicated a positive association (Bonamy et al. 2005, Bassareo et al. 2010, Hovi
et al. 2011), although in one of them the finding was limited to those with concurrent
fetal growth restriction (Skilton et al. 2011). Arterial stiffness is a key factor as
regards increased systolic and pulse pressure in adults.
2.4.8 Lifestyle
Many aspects of cardiovascular disease (see section 2.2) could be prevented by way
of a healthy lifestyle. Previous studies have suggested that the lifestyle of adults born
preterm, at least in those born with VLBW, is different from that in adults born
preterm. Adolescents and adults born preterm are less physically active than their
peers born at term (Rogers et al. 2005, Hack et al. 2007, Saigal et al. 2007, Andersen
et al. 2009, Kajantie et al. 2010b, Kaseva et al. 2012) and they have lower
cardiorespiratory and muscle strength (Rogers et al. 2005, Saigal et al. 2007). Low
physical activity level is a well-known risk factor of CHD and CVD (Shiroma & Lee
2010). In addition, adults born with VLBW have reported consuming fewer fruits,
vegetables, berries and milk products (HeSVA) (Kaseva et al. 2013). Low
consumption of fruit has been ranked among the five most important factors causing
46
the worldwide disease burden (Lim et al. 2012). In contrast, the results of some
studies suggest that adults born preterm are more cautious and show less risk-taking
behavior (Hack et al. 2002, Pesonen et al. 2008), lower rates of smoking (StrangKarlsson et al. 2008) and use of alcohol (Hack et al. 2002, Strang-Karlsson et al.
2008). These factors may protect them from CVD.
2.4.9 Summary
There is a lot of evidence that adolescents and adults born preterm have many risk
factors for later cardiovascular disease, such as higher blood pressure, impaired
glucose regulation, and altered body composition and lifestyle. However, the evidence
is not that consistent as regards all cardiometabolic risk factors, e.g. energy
metabolism, lipid metabolism and emerging cardiometabolic risk factors. In addition,
it is not clear whether these risks are similar in those born moderately versus late
preterm. Fig. 5 summarizes the main points of the association between preterm birth
and later cardiometabolic risk factors.
47
48
Fig. 5. Study framework.
3
Aims
The present study was designed to evaluate the cardiometabolic risk factors of
adolescents and young adults born preterm. The specific aims were:
1.
2.
3.
4.
To study whether adolescents/adults born preterm differ from those born at
term as regards cardiometabolic risk factors such as lower resting energy
expenditure, unfavorable body composition, elevated blood pressure, higher
plasma lipid levels, and altered glucose regulation (I–IV).
To examine whether these risk factors are present and similar in
adolescents/adults born early preterm (<34 weeks) and late preterm (34 to 36
weeks) (II–IV).
To see if these risk factors are different in men and women born preterm (I–
IV).
To see if these risks are attributable to perinatal factors, childhood
socioeconomic status or lifestyle (I–IV).
49
50
4
Subjects and methods
The thesis is based on data from three different studies: 1) the Helsinki Study of Very
Low Birth Weight Adults (I), 2) the Northern Finland Birth Cohort 1986 (NFBC
1986, II–IV) and 3) the ESTER Preterm Birth study (“Preterm birth and early life
programming of adult health and disease”, III, IV). Half of the subjects (585) in the
ESTER study are also members of the NFBC 1986 cohort.
4.1
Helsinki Study of Very Low Birth Weight Adults (I)
The Helsinki Study of Very Low Birth Weight Adults is a prospectively collected
longitudinal birth cohort study, the clinical assessment of which was conducted in
2004–2005 in Helsinki.
4.1.1 The study population
The original study cohort consisted of 335 VLBW infants who were born between
January 1978 and December 1985 and were discharged alive from the NICU of the
Children’s Hospital at Helsinki University Central Hospital, the only tertiary neonatal
care center in the province of Uusimaa, Finland (Järvenpää & Granström 1987). For
each VLBW survivor, the next available singleton term infant (gestational age >37
weeks), who was of the same sex and was not SGA was selected as a control.
Most (95.1%) of the VLBW individuals and 96.8% of the controls were traced
through the National Population Register Center of Finland. 255 VLBW individuals
and 314 control individuals born at term who were living in the greater Helsinki area
were invited to the first clinical visit and 166 (65.1%) of the VLBW individuals and
172 (54.8%) of the control individuals agreed to participate. The clinical study
participants had a lower rate of cerebral palsy at 15 months of age than the nonparticipants, but otherwise they did not differ as regards perinatal and neonatal data
(birth weight, length of gestation, maternal preeclampsia, and days of age at discharge
from the NICU) (Hovi et al. 2007).
In this study we included those with data on resting energy expenditure (REE)
assessed by indirect calorimetry and body composition assessed by dual energy X-ray
absorptiometry (DXA). REE could be measured in three of the four to five
participants per day because there was only one calorimeter available. Subjects were
selected randomly for the measurement and no one refused. DXA required a separate
visit and was not carried out in participants who were pregnant or had a foreign object
51
in the body, or had severe cerebral palsy or were unwilling to undergo the
examination. As a result, 116 VLBW individuals and 118 controls born at term had
data on REE and DXA and were included in this study.
We compared the subjects included in the analysis with those who did not have
appropriate data. Included subjects did not differ from the remaining subjects who
attended the clinical examination in any of the prenatal and birth characteristics,
except that they were more likely to be born from a singleton pregnancy (P=0.046). In
addition, their mean age, height, BMI, parental education, and smoking habits were
similar.
Fig. 6. Flow chart showing participants selected for the study (article I). Participants
who had both resting energy expenditure and lean body mass measured had similar
characteristics compared to those invited but who did not undergo these
measurements.
1
NICU denotes neonatal intensive care unit. Term subjects were
identified from the birth-hospital records for each very low birth weight (VLBW) infant.
2
Only those residing within distance of 110 km were invited. 3Lean body mass was not
measured, if the subject was pregnant, had foreign object in the body, had severe
cerebral palsy or was unwilling to undergo the examination. Reprinted with
permission; the same figure appears in PLoS One. 6(3):e17700.
52
4.1.2 Perinatal and neonatal data
Perinatal and neonatal data were collected from the hospital records. Gestational age
was assessed by last menstruation date or by Dubovitz score (Hovi 2011). The infants
born with VLBW had been weighed daily during their hospital stay. If the weight at
40 weeks of gestational age was missing from the records, we included the
interpolated value based on measurements available within 10 days before and 20
days after this time point in our analysis. We converted the weights into standard
deviation scores according to Finnish birth weight charts (Pihkala et al. 1989).
4.1.3 Questionnaire
The participants completed a detailed questionnaire on medical history, use of
medication, current smoking, parents’ education (as an indicator of socioeconomic
status, categorized into four levels according to information on the parent with the
higher education) and leisure-time physical activity assessed by means of questions
on exercise intensity (four categories), duration, and frequency (Hovi et al. 2007,
Kajantie et al. 2010b).
4.1.4 Clinical examination
The participants attended a clinical examination at a mean age of 22.5 y (range from
18.5 to 27.0). It was performed in the clinic at the National Public Health Institute
(now the National Institute for Health and Welfare) in Helsinki. The participants
fasted for at least 8 hours (Hovi et al. 2007). When the participant was in underwear,
nurses measured height and weight and BMI was calculated (weight/height2, kg/m2).
The nurses used a soft tape to measure waist and hip circumference: waist
circumference midway between the lowest rib and the iliac crest and hip
circumference at the level of the great trochanters.
4.1.5 Resting energy expenditure and lean body mass
Resting energy expenditure was measured by indirect calorimetry (Deltatrac II,
Datex, Helsinki, Finland) at rest. Indirect calorimetry is the most commonly used
method to measure REE, and Deltatrac equipment is well-established as being valid
and reliable (Tissot et al. 1995, Wells & Fuller 1998, Compher et al. 2006). The
reproducibility is very good: For example in young (18–35 y) non-lactating
53
Bangladeshi women the mean within-subject within-session variations was 3.0% and
within-subject between-sessions variation was 4.5% (Alam et al. 2005). The
measurement was performed after an overnight fast, after the subject had completed
the consent forms and undergone anthropometric and blood pressure measurements,
usually approximately 30 minutes after coming to the clinic. The measurement was
performed by one of the two trained nurses. At first the subject was connected to the
calorimetry device and rested about 10 minutes before the measurement started.
During the measurement the subject was wearing light indoor clothing, was still
fasting and lying in a bed in a comfortable semi-recumbent position and holding a
transparent plastic canopy, which covers the head of the participant. The device has a
computerized, open-circuit system to measure gas exchange by the air-dilution
method. REE was expressed as the amount of energy used in 24 hours (Dulloo &
Jacquet 1998, Jørgensen et al. 1998, Wang et al. 2000, Eriksson et al. 2002,
Heymsfield et al. 2002, Johnstone et al. 2005).
Lean body mass was measured at a separate visit by DXA (Hologic® Discovery
A, software version 12.3:3, Bedford, MA, USA) (Hovi et al. 2007, Hovi et al. 2009).
During the measurements the subjects were wearing underwear alone and they were
not allowed to wear any jewelry and other personal effects that could interfere with
the DXA measurement. If measurements contained artifacts which could affect the
accuracy of DXA they were excluded from the analysis. The ratio of REE to LBM
(REE/LBM) was calculated (Eriksson et al. 2002). Originally DXA was developed
for diagnosis of osteoporosis, but it also provides detailed and precise information
about body composition. It is a clinically applicable if not “bedside” method (Mazess
et al. 1990). It involves measurement of the relative attenuation of two different
energy X-rays and produces a three-component model of body composition including
fat, bone mineral, and lean tissue. Scans are relatively fast, with minimal radiation
exposure (Woodrow 2007). DXA is reliable and reproducible in the estimation of
LBM, and reproducibility of measurements is excellent, with r value of 0.98 (Lohman
et al. 2009). However, it does not distinguish between visceral and subcutaneous fat
tissue (Haarbo et al. 1991, Svendsen et al. 1993, Glickman et al. 2004).
4.2
Northern Finland Birth Cohort 1986 (II–IV)
The Northern Finland Birth Cohort 1986 (NFBC 1986) is a prospectively collected
longitudinal cohort of all births in the two northernmost provinces of Finland, with
mothers and children whose expected delivery date was between July 1st 1985 and
June 30th 1986. In total 9 479 children were born into the cohort, and 9 432 of them
54
were live-born. Mothers and children have been followed up since the mothers
enrolled at their first antenatal clinic visit, usually by the twelfth week of gestation
(Järvelin et al. 1993a, Pirkola et al. 2008).
Fig. 7. Participants in the study (article II).
4.2.1 The study population
At a mean age of 16 years, 6798 (74%) cohort members residing in Finland
participated in a clinical examination, which was conducted in 2001–2002 (Fig. 7). In
our analysis we included those 6642 subjects with data on length of gestation and at
least one of the following variables: BMI, waist circumference, blood pressure,
plasma lipids, plasma glucose and serum insulin. In total, 79 (1.2%) of the study
subjects included in the analysis were born early preterm (<34 weeks), 238 (3.6%)
were born late preterm (34 to <37 weeks) and 6325 (95.2%) were controls (≥37
weeks).
Subjects with insufficient data for analysis had a shorter length of gestation (0.27
weeks, P<0.001), were more likely to be born preterm (P<0.001), had a lower birth
55
weight (77 g, P<0.001) and a lower birth weight SD score (0.1 SD, P<0.001) and
were more likely to be born SGA (P=0.006).
4.2.2 Perinatal and neonatal data
Perinatal data were collected from healthcare records and questionnaires. The overall
incidence of preterm deliveries was 4.8%, of which 70.8% were spontaneous preterm
deliveries (Olsen et al. 1995). We confirmed length of gestation by reviewing original
hospital records (Vääräsmäki et al. 2009, Miettola et al. 2013). We calculated the
birth weight SD score on the basis of Finnish standards (Pihkala et al. 1989) and SGA
was defined as lower than 2 SD below the mean.
In 1985–1986, when the study subjects were born, routine determination of
length of gestation by ultrasonography was the practice in a number of towns and
municipalities in the region, but not in all. The cohort database included data
indicating length of gestation, which were collected from three sources:
1.
2.
3.
If the length of gestation was estimated or confirmed by ultrasonography
(before 20 weeks of gestation), it was obtained from maternal welfare clinic
records.
If ultrasonography was not performed, the length of gestation was estimated
on the basis of the last menstrual period, and it was collected from maternal
welfare clinic records.
The length of gestation was based on clinical decision-making and recorded
in full completed weeks in birth hospital records.
We looked at these variables and if there was a discrepancy, we reviewed the data
and medical records if needed.
The length of gestation was determined by ultrasonography in 3699 (39.2%)
cases, by last menstrual period in 5358 (56.8%) cases, and according to data in
hospital records, based on clinical decision-making with no information as to whether
this was based on ultrasonography or last menstrual period in 154 (1.6%) cases. We
were unable to confirm the length of gestation in 221 cases (2.3%).
We categorized the subjects into three groups according to their gestational age:
1.
2.
3.
56
<34 weeks of gestation (early preterm)
34 to <37 weeks of gestation (late preterm) (Engle et al. 2007)
≥37 weeks of gestation (controls).
4.2.3 Questionnaire
At the age of 16 the participants (and their parents) completed questionnaires on
medical history, medication, socioeconomic status and lifestyle. We used parental
educational attainment as an indicator of socioeconomic status and it was categorized
into four levels (dummy coded). Regular smoking (“Have you ever smoked
regularly?”) was transformed to a dichotomous variable. Physical activity was based
on questions on daily time spent in commuting and weekly time in light or moderateto-vigorous physical activity and transformed to total metabolic equivalent hours per
week (METh/wk), assuming 3 MET for light activity, 4 MET for commuting, and 5
MET for moderate-to-vigorous physical activity. The subjects assessed their pubertal
stage with the help of drawings representing different stages of the Tanner
classification (Tanner 1962).
4.2.4 Clinical examination
At the clinical examination weight (kg), height (cm), waist (cm) and hip
circumferences (cm) were measured. Blood pressure was measured from the right arm
after 15 minutes of rest with the subject sitting, by use of an automated oscillometric
device (Omron 705CP, Omron Corporation, Shiokoji, Horikawa, Kyoto, Japan) or
mercury sphygmomanometer if the first one failed. The mean of two measurements
taken two minutes apart was calculated.
4.2.5 Laboratory analyses
Fasting blood samples collected between 8:00 and 11:00 were analyzed within 24
hours of sampling at Oulu University Hospital laboratory by using a Cobas Integra
700 automatic analyzer (Roche Diagnostics, Basel, Switzerland): plasma glucose by
using an enzymatic reference method with hexokinase, TC, HDL-C, LDL-C, and TG
concentrations with an enzymatic, colorimetric method, and ApoA1 and ApoB with
an immunoturbidimetric method (Vääräsmäki et al. 2009). Samples for serum insulin
measurement were stored at -20 °C and analyzed by radioimmunoassay with
commercial reagents (Pharmacia Diagnostics, Uppsala, Sweden) within 7 days. We
used homeostasis model assessment values for insulin resistance (HOMA-IR) by
calculating them from paired fasting glucose and insulin levels by way of the
validated calculator program available at www.dtu.ox.ac.uk (Wallace et al. 2004).
57
4.3
The ESTER Study (III, IV)
The ESTER study (“Preterm birth and early life programming of adult health and
disease” and Maternal pregnancy disorders and child’s health in adulthood) is a birth
cohort study conducted in 2009 to 2011 in the two northernmost provinces of Finland.
The study has been carried out as a collaborative effort between the National Institute
for Health and Welfare, the Institute of Health Science in the University of Oulu, the
Northern Ostrobothnia Hospital District and the University of Helsinki. The ESTER
study consists of two sub-studies:
1.
2.
Preterm birth and early life programming of adult health and disease (the
ESTER Preterm Birth Study), and
Maternal pregnancy disorders and child’s health in adulthood.
Subjects born in 1985–1986 were recruited from NFBC 1986 and subjects born in
1987–1989 from The Finnish Medical Birth Register (FMBR), born in the same
geographical area. We selected all the subjects from NFBC 1986 who were born
preterm (<37 weeks of gestation), and those who were exposed to maternal
hypertension, preeclampsia or diabetes. In addition, we selected subjects
randomly from the FMBR with same criteria. Control group subjects were
selected randomly from both NFBC 1986 and FMBR. The total number of
subjects who attended the examination is 1161.
4.3.1 The study population
The present work is focused on the effects of preterm birth on cardiovascular risk
factors, so we included those born preterm and their randomly selected controls.
Subjects were categorized into three groups according to their gestational age:
1.
2.
3.
<34 weeks of gestation (early preterm, n=149),
34 to <37 weeks of gestation (late preterm, n=248) (Engle et al. 2007), and
≥37 weeks (controls, n=380). The control group also includes 16 subjects
technically born post-term (at 42 weeks 1 day or later).
The selection of the subjects included in the analysis is presented in Fig. 8 (for article
III) and Fig. 9 (for article IV).
58
Fig. 8. Flow chart of the study population (article III). All subjects recruited to the study
are born in Northern Finland in 1986-1989. In the Finnish Medical Birth Register data
83 individuals in the random control group with missing gestational age of whop 58
individuals did not participate and 25 participated to the ESTER study. 10 subjects
born early preterm, 1 subject born late preterm and 4 controls reported severe
disability and were excluded from the analysis. 5 subject born early preterm, 5
subjects born late preterm and 8 controls reported being pregnant and were excluded
from the analysis. 3 excluded subjects had more than one reason for exclusion.
Abbreviations: FMBR, Finnish Medical Birth Register; NFBC, Northern Finland Birth
Cohort. Printed with permission; the same figure appears in Am J Epidemiol 2015: In
press.
59
4.3.2 Perinatal and neonatal data
Perinatal data on members of the NFBC 1986 were collected as described previously
in section 4.2.2 (Järvelin et al. 1993b). We collected similar peri- and neonatal
variables concerning FMBR subjects from the patient records of hospitals and
maternal welfare clinics. We determined the length of gestation of NFBC and FMBR
subjects as described above (section 4.2.2). We recorded diagnoses of maternal
gestational diabetes, hypertension (gestational or chronic) and preeclampsia
(including superimposed) retrospectively according to prevailing medical guidelines.
The birth weight SD score was calculated according to Finnish standards (Pihkala et
al. 1989) and SGA was defined as lower than 2 SD below the mean.
4.3.3 Questionnaire
The participants completed questionnaires before the clinical visit electronically or
during or after the visit on paper. The questionnaire included questions about medical
history and medication including hormonal contraception, socioeconomic status and
lifestyle. We used parental educational attainment as an indicator of socioeconomic
status and it was categorized and dummy-coded (four levels). Physical activity was
assessed as described above (section 4.2.3). Daily smoking (yes/no) and the amount
of alcohol doses per week (0; 1 to 3; 4 to 9; ≥10) were categorized.
4.3.4 Clinical examination
The subjects participated in clinical examination at clinics in Oulu, Kemi, Kuusamo,
Raahe, Rovaniemi and Ylivieska. The participants had fasted overnight before the
clinical visit.With the subject in a sitting position and after five minutes’ rest, a
trained study nurse measured blood pressure (mm Hg) from the upper right arm, using
an automatic oscillometric blood pressure monitor (Intellisense M10-IT, cuff size 22–
42 cm; Omron Healthcare Co., Ltd., Kyoto, Japan). Three measurements were taken
and the mean was calculated. Height (cm) was measured three times; waist
circumference (cm, midway between the lowest rib and the iliac crest) and hip
circumference (cm, at the widest point of the hip) were measured twice. Using the
means of repeated measurements, BMI and the waist-hip ratio (WHR=waist
circumference/hip circumference) were calculated. We measured body composition
(weight, plus lean body mass, fat mass and percentage body fat) by segmental multifrequency bioelectrical impedance analysis (BIA; InBody 3.0, Biospace Co., Ltd.,
60
Seoul, Korea). It is based on the principle that lean mass, which is primarily an
electrolyte solution, conducts current better than fat mass. The method gives a
measure of the resistance to a weak current (impedance) applied across extremities
and provides an estimate of body fat using an empirically derived equation. BIA has
been shown to give accurate estimates of body components in different populations
with high reliability in repeated measurements (Bedogni et al. 2002, Malavolti et al.
2003, Sartorio et al. 2005, Gibson et al. 2008) and is practical in large
epidemiological studies . Correlations between BIA and DXA as regards percentage
body fat are generally good (Bolanowski & Nilsson 2001), but BIA tends to
overestimate percentage body fat in lean subjects and underestimates it in obese
subjects (Sun et al. 2005).
4.3.5 Laboratory analyses
The subjects fasted overnight and blood samples were collected at 8:00–11:00 a.m.
and 2 hours after a 75-gram oral glucose load. Some of the analyses were performed
at Oulu University Hospital laboratory: Plasma glucose (fasting and 2-hour), TC,
HDL-C and LDL-C, TG, uric acid, alanine aminotransferase, aspartate
aminotransferase, gamma glutamate, albumin and urea were analyzed by using an
Advia 2400 automatic chemical analyzer (Siemens Diagnostics, Terrytown, NY,
USA) and blood leukocytes by an automatic electronic cell counter (Abbott CELLDYN Sapphire, Abbott Diagnostics, USA).
Remaining samples were stored at -70 ºC. Other analyses were performed later at
the Disease Risk Unit of the National Institute for Health and Welfare: Serum
concentrations of insulin, lipoprotein (a) (LPa), ApoA1, ApoB, and hsCRP (values
>10 mg/l were excluded from analysis) were measured by using an Architect ci8200
analyzer (Abbott Laboratories, USA). The following methods were used:
chemiluminescent microparticle immunoassay (CMIA, Abbott Laboratories, USA)
for insulin, immunoturbidimetric methods (Abbott Laboratories, USA) for LPa,
ApoA1 and ApoB and a latex immunoassay (Sentinel Diagnostics, Italy) for hsCRP.
HOMA-IR values from paired fasting glucose and insulin levels were defined by
using a validated calculator program available at www.dtu.ox.ac.uk (Wallace et al.
2004).
61
4.3.6 Ambulatory measurements
To measure 24-hour blood pressure, volunteer subjects were given ambulatory blood
pressure (ABP) monitors with operating instructions (Spacelabs 90207, Spacelabs
Medical, Inc., WA, U.S.A.) after the clinical examination, if there were available
devices. The subjects wore the cuff on the non-dominant upper arm and carried the
device for 24 hours. The monitors measured their blood pressure every 20 minutes
during the day (7:00 to 22:00 h) and every 30 minutes at night (22:00 to 7:00 h).
Thirty-two (76.2%) subjects born early preterm, 47 (65.3%) subjects born late
preterm and 78 (75.7%) controls agreed to wear an accelerometer (GT1M; ActiGraph,
Inc., Pensacola, FL) on the wrist to measure the sleep–wake rhythm simultaneously
with the ABP monitor (Fig.9). They were instructed to keep a sleep log reporting their
bedtimes and wake-up times. After the measurements, the participants returned the
devices to the researchers for data download. We visually inspected the accuracy of
the sleep log against the raw accelerometry data. We removed the night-time data
with inconsistent (e.g., the participant was already sleeping at the reported bedtime) or
missing information on bedtimes. If the reported wake-up time was inconsistent (e.g.,
the participant was still asleep after the reported wake-up time) or missing, it was
visually estimated from the raw accelerometry data. Sleep onset time was estimated
by using ActiLife software (ActiLife 5.10.0; ActiGraph Pensacola, FL, USA), with
the Sadeh algorithm (Sadeh et al. 1994). For the 60 (27.6%) subjects who had no
accelerometry data, BP when sleep was defined as that between 01:00 and 07:00 h,
and BP when awake was defined as that between 09:00 and 23:00 h. In other words,
we excluded measurements taken between 07:00 and 09:00 h and between 23:00 and
01:00 h, because of the potential individual variability in bedtimes and wake-up
times.
We excluded from the analysis subjects with fewer than 15 BP measurements
when awake or fewer than eight BP measurements when asleep (O'Brien et al. 2000)
and these subjects were also excluded from 24-hour BP analysis. We calculated the
means of the subjects’ 24-hour, awake and asleep ABPs (mmHg) and SDs of BP
(mmHg, indicators of individual BP variability).
4.3.7 Definitions of pre-hypertension, hypertension, fatty liver index,
obesity and metabolic syndrome
The cut-off values of office-measured, ambulatory-measured and white-coat
hypertension are presented in Table 8. The definition of office-measured hypertension
62
Fig. 9. Flowchart of the study population (article IV). Printed with permission; the
same figure appears in Hypertension 2015;65: 615-621.
was based on the criteria of the European Society of Hypertension (ESH), the
European Society of Cardiology (ESC) and the American Heart Association
(Pickering et al. 2005, Mancia et al. 2013). We defined abnormal mean values of
ABP and white-coat hypertension according to criteria of the American Heart
Association and the British Hypertension Society (O'Brien et al. 2000, Urbina et al.
2008). We calculated the fall (or “dip”, %) of mean blood pressure from awake to
sleep blood pressure as: (mean awake blood pressure - mean sleep blood
pressure)/mean awake blood pressure * 100 (Verdecchia et al. 1994). If blood
pressure when asleep was less than 10% lower than when awake, the subject was
63
categorized as a “non-dipper” (Verdecchia et al. 1994). We defined the metabolic
syndrome according to the Joint Interim Statement (Table 8) (Alberti et al. 2009).
We calculated the fatty liver index (FLI), a proposed marker of non-alcoholic
fatty liver disease (Bedogni et al. 2006) as:
=
.
×
.
(
×
)
(
.
)
×
.
.
×
×
.
(
×
)
(
.
)
×
.
.
×
.
× 100
Abbreviations (units) in equation:
TG, triglycerides (mg/dl); 1 mg/ml = 18.0182 mmol/l
BMI, body mass index (kg/m2)
GGT, gamma glutamate (U/l)
WC, waist circumference (cm)
An FLI value of <30 rules out hepatic steatosis with 87% sensitivity and a
negative likelihood ratio of 0.2 and a value of ≥60 rules out hepatic steatosis with
86% sensitivity and a positive likelihood ratio of 4.3 (Bedogni et al. 2006). We
used an FLI value of >30 as a marker of intermediate or high FLI.
4.3.8 Subjects included in the analysis and the attrition analyses
We excluded those who were pregnant (n=21) or who reported having cerebral palsy
(n=8), mental disability (n=11) and/or several physical disability (n=5) from the
analysis of cardiometabolic risk factors (publication III), because these conditions
might have an effect on cardiometabolic risk factors. Finally, we had sufficient data
on cardiometabolic risk factors among 134 individuals born early preterm, 242 born
late preterm, and 344 controls who were born at term.
We compared those who participated with those who did not participate or who
were excluded from the analysis. In the late-preterm group and in the controls, women
were more likely to participate. In addition, among the late-preterm adults, those who
participated were more likely to be born to primiparous mothers. The participants and
non-participants did not differ as regards mothers’ age at birth, maternal hypertension
in pregnancy, maternal smoking, maternity hospital, length of gestation, birth weight
or birth weight SD score. We looked at the clinical data at 16 years of age among the
NFBC 1986 members. Those who participated in this study were more likely to have
64
Table 8. Definitions and cut-off values for hypertension, obesity and metabolic
syndrome.
Definition
Cut-off values
Pre-hypertension
≥120/80 mmHg
Hypertension (office-measured)
≥140/90 mmHg
Abnormal ambulatory blood pressure
24-hour
>135/85 mmHg
Awake
>140/90 mmHg
Sleep
>125/75 mmHg
White-coat hypertension
Both of the following criteria:
Office blood pressure
≥140/90 mmHg
Day-time ambulatory BP
<135/85 mmHg
Obesity
Body mass index
Metabolic syndrome
>30 kg/m2
3 of the 5 following criteria:
Waist circumference
≥94 cm in men; ≥80 cm in women
Triglycerides
≥1.7 mmol/l
HDL-C
<1.03 mmol/l in men;
<1.29 mmol in women
Blood pressure
≥130/85 mm Hg
Fasting plasma glucose
≥5.6 mmol/l or type 2 diabetes
participated in clinical examination at 16 years, but the participants and nonparticipants did not differ as regards BMI and parental educational attainment,
and the rates of physical and mental disability were similar within the groups.
Not all the participants wanted to wear an ABP monitor after the clinical visit, or
ABP data were missing for some other reason. We also excluded five pregnant
subjects (one early preterm, two late preterm, and two controls) and two controls who
were taking beta-blocker medication from the ABP analysis. Altogether, we had
sufficient data on ambulatory blood pressure measurements on 42 (28.2%)
participants in the early-preterm group, 72 (29.0%) participants in the late-preterm
group and 103 (28.9%) controls (P=0.98). The proportion of subjects with sufficient
ABP data was similar in every group. Women were more likely to have sufficient
ABP data than men in the control and early-preterm groups. The subjects invited to
the ESTER study who did not participate or who did not have sufficient ABP data
were more likely to have been exposed to maternal smoking during pregnancy
65
(P=0.04). Participants with and without sufficient ABP data were of similar age and
had similar parental educational attainment, BMI and office-measured BP. In the
early-preterm group and in controls, those without sufficient data were more likely to
smoke, and in the early-preterm group men without sufficient data were 3.1 cm
shorter than those with ABP data (P=0.02). To control for possible differences in
blood pressure levels in those without accelerometry we adjusted the mean
differences in ABP outcomes for use of an accelerometer.
4.4
Statistical methods
We performed statistical analyses with SPSS for Windows software, versions 16.0
(SPSS Inc., Chicago, Illinois) to 22.0 (IBM SPSS Statistics Version 22, USA). We
used logarithmic transformation to normalize skewed distributions to achieve
normality of all outcome variables except blood pressure, height and concentrations
of uric acid, albumin and urea. We also calculated the geometric means of those
variables which are the nth roots of the product of n values. Geometric standard
deviation corresponds to the relative change in a variable corresponding to one
standard deviation unit change in the logarithm of the variable. We assessed group
differences in background characteristics by using Student’s t test for continuous data
and Pearson’s χ2 test for categorical data. To assess differences between preterm
(VLBW/early-preterm/late-preterm) subjects and controls we used linear or logistic
regression models to adjust for covariates described in Fig. 10 and Table 9:
Covariates in linear regression models assessing the association between preterm
birth vs. REE and the REE/LBM ratio in adults born preterm with VLBW (I):
–
–
–
Model 1: Age and sex.
Model 2: Variables in Model 1and parental education and daily smoking.
Model 3: Variables in Model 2 and body fat percentage and self-reported
intensity, frequency and duration of leisure-time physical activity.
Covariates in linear regression models assessing cardiovascular risk factors in
adolescents born preterm (II):
–
–
–
–
66
Model 0: Unadjusted.
Model 1: Age.
Model 2: Variables in Model 1 and BMI and height.
Model 3: Variables in Model 2 and birth weight SD score, maternal smoking
during pregnancy, and educational level of more educated parent.
–
Model 4: Variables in Model 3 and smoking, physical activity and Tanner
pubertal stage.
Covariates in linear regression models assessing cardiometabolic risk factors in
adults born preterm (III):
–
–
–
–
Model 1: Age, cohort (NFBC or FMBR), and sex.
Model 2: Variables in Model 1 and parental and prenatal confounding factors
(including parental educational attainment as a proxy of childhood
socioeconomic position, maternal smoking during pregnancy, and birth
weight SD scores as indicators of fetal conditions during pregnancy), and, for
analyses of dichotomous and biochemical outcomes, parental history of
hypertension, diabetes, and myocardial infarction or stroke as proxies of
genetic susceptibility.
Model 3: Variables in Model 1 and current characteristics: height (for body
composition and blood pressure) or BMI (for blood pressure and biochemical
risk factors), physical activity, and smoking. For fatty liver index, these
adjustments also included current alcohol use.
Model 4: variables in Models 2 and 3.
Covariates in linear regression models assessing ambulatory blood pressure and
its variability in adults born preterm (IV):
–
–
–
Model 1: Age and sex. In addition, models for BP when awake and sleep also
included whether sleep was assessed by accelerometry.
Model 2: Variables in Model 1 and parental educational level, mother’s BMI
before pregnancy, gestational or chronic hypertension, preeclampsia, GDM,
and birth weight SD score.
Model 3: Model 1 and parental educational attainment, height, BMI, physical
activity, and smoking.
67
Fig. 10. Causal diagram (or direct acyclic graph) for the linear and logistic regression
models (Textor et al. 2011).
In addition, we reported some of the analyses with length of gestation as a
continuous variable. We tested whether the associations between preterm birth
and outcomes were similar in men and women by adding the interaction terms
sex*VLBW or sex*early preterm birth or sex*late preterm birth to the model. All
P-values were 2-sided.
68
69
≥37 weeks not SGA
Controls
GA at birth (wk)
GA at birth (wk)
Fasting glucose and insulin
Glucose regulation
diastolic ABP
markers
hsCRP, blood leukocytes
HOMA-IR
fasting and 2-hour insulin,
Fasting and 2-hour glucose,
ApoA1, ApoB
TC, LDL-C, HDL-C, TG, LPa,
awake and asleep systolic and
hypertension
Means and SDs of 24-hour,
diastolic blood pressure,
pressure
percentage body fat, obesity
lean body mass, fat mass,
Office-measured systolic and
TC, LDL-C, HDL-C, TG, ApoA1, ApoB
Inflammatory
Height, BMI, waist
circumference, waist-hip ratio,
≥37 weeks
GA at birth (wk)
late preterm (34 to 36 wk);
Early preterm (<34 wk);
23.3 (1.2)
ESTER
IV
Office-measured systolic and diastolic blood
Height, weight, BMI, waist circumference
≥37 weeks
late preterm (34 to 36 wk);
≥37 weeks
Early preterm (<34 wk);
late preterm (34 to 36 wk);
23.3 (1.3)
ESTER
III
Early preterm (<34 wk);
16.0 (0.4)
NFBC
II
Lipid metabolism
Blood pressure
composition
Body size and
Energy metabolism REE, REE/LBM ratio
variables
Main outcome
VLBW (<1500 g)
Predictor
years
(HeSVA)
22.5 (2.2)
Mean age (SD),
I
Cohort
Variable
Table 9. Study design in Articles I–IV.
70
pregnancy, gestational or
chronic hypertension,
preeclampsia (including
hypertension, b) diabetes, c)
coronary heart disease and/or
stroke, maternal smoking during
physical activity
duration of leisure time
intensity, frequency and
smoking, self-reported
reported physical activity, pubertal stage
BMI, height, smoking of the subject, self-
mother’s BMI before
parental history of a)
SD score
hormonal contraception
physical activity, daily smoking,
BMI, height, self-reported
physical activity, daily smoking
Height, BMI, self-reported
score
diabetes, birth weight SD
pregnancy, birth weight SD score superimposed), gestational
FMBR), sex, parental education, sex, parental education,
Age, sex, parental education, maternal
Age, use of accelerometry,
IV
smoking during pregnancy, and birth weight
Age, source cohort (NFBC or
Uric acid, albumin, and urea
glutamate, FLI
aspartate transaminase, gamma
Alanine aminotransferase,
III
Age, sex, parental
II
education
I
Mediators/modifiers Body fat percentage,
Confounders
Covariates
Other biomarkers
Fatty liver markers
Variable
71
diabetes; e) excluding those exposed to
maternal preeclampsia or gestational or
chronic hypertension. Additional adjustment
a) birth weight SD score; b) adjustment of the b) gestational diabetes
maternal preeclampsia.
Additional adjustment
for weight gain (SD)
from birth to term
hypertension, and preeclampsia,
gestational or chronic
adjustment for a) maternal
pregnancies. Additional
IV
disorder; b) born SGA
hypertensive pregnancy
exposed to maternal
Exclusion of subjects a)
cholesterol; TG, triglycerides; VLBW, very low birth weight (<1500 g) .
lipoprotein (a); NFBC, Northern Finland Birth Cohort 1986; REE, resting energy expenditure; SD, standard deviation; SGA, small for gestational age; TC, total
assessment values for insulin resistance; hsCRP, high-sensitivity C-reactive protein; LBM, lean body mass; LDL-C, low-density lipoprotein cholesterol; LPa,
gestational age; HDL-C high-density lipoprotein cholesterol; HeSVA, The Helsinki Study of Very Low Birth Weight Adults; HOMA-IR, homeostasis model
index; ESTER, Preterm birth and early life programming of adult health and disease ; FMBR, Finnish Medical Birth Register; FLI, fatty liver index; GA,
Abbreviations: ABP, ambulatory blood pressure; AGA, appropriate for gestational age; ApoA1, apolipoprotein A1, ApoB, apolipoprotein B; BMI, body mass
chronic hypertension
diabetes, preeclampsia, gestational or
full regression model for maternal gestational
SGA; d) exposed to maternal gestational
SGA, b) from multiple
with uncertain length of gestation; c) born
subjects born SGA vs.
III
Exclusion of subjects born a)
AGA; exposed to
II
Exclusion of subjects a) born post-term; b)
I
Additional analyses Comparison of VLBW
Variable
72
5
Results
The perinatal and neonatal characteristics of the study groups are presented in Table
11. In every cohort, subjects born preterm were more likely to be exposed to
preeclampsia of the mother, born from multiple pregnancy and be SGA, as expected.
To summarize the current findings, the results of each outcome variable group are
presented together.
5.1
Body size and composition (I, II, III)
5.1.1 Body size and composition in adults born preterm with VLBW (I)
Differences in body size and composition in adults born preterm compared with their
peers born at term (HeSVA) have been published before and are presented in the
Review of the literature (section 2.4.1). In short, adults born preterm with VLBW
were shorter and lighter and had lower lean body mass than their peers born at term
(Table 10).
Table 10. Mean values (SD) of lean body mass in women and men born with VLBW
and in controls born at term.
Measurement
Women
Men
VLBW
Term
P value
VLBW
Term
P value
Height (cm)
162.4 (8.0)
167.6 (6.3)
<0.001
175.9 (8.5)
180.7 (6.1)
0.003
BMI
21.8 (3.7)
23.0 (3.9)
0.064
22.1 (4.0)
23.9 (3.2)
0.020
Body fat percentage (%)
31.9 (6.2)
32.0 (5.6)
0.92
19.9 (6.4)
19.9 (5.4)
0.97
Lean body mass (kg)
38.9 (5.9)
43.5 (5.5)
<0.001
54.4 (8.9)
62.2 (8.4)
<0.001
5.1.2 Body size in adolescents born preterm in NFBC (II)
In NFBC, adolescent girls and boys born preterm had similar weight, height, BMI,
waist and hip circumference as their peers born at term (Table 12), even when
adjusted for SD for birth weight, age, parental education, smoking and physical
activity, and Tanner Pubertal Stage.
73
74
HeSVA
25 (21.6)
0 (0)
15 (19.0)***
-0.82 (1.4)***
1788 (461)***
32.0 (1.6)***
22 (27.8)***
12 (15.2)***
33 (41.8)
79
Early preterm
21 (8.8)***
-0.65 (1.2)***
2696 (494)***
36.0 (0.8)***
43 (18.1)***
24 (10.1)***
131 (55.0)
238
Late preterm
NFBC 1986
P values for the differences compared with controls: * P < 0.05; ** P < 0.01; *** P < 0.001.
Abbreviations: SGA, small for gestational age; VLBW, very low birth weight (<1500g).
SGA, n (%)
-1.38 (1.6)***
Birth weight SD score
0.08 (1.0)
40.1 (1.1)
3606 (469)
29.2 (2.3)***
1125 (223)***
Birth weight (g)
0 (0)
Gestational age (weeks)
n (%)
Multiple pregnancy,
21 (18.1)
10 (8.5)
24 (20.7)**
Maternal preeclampsia,
n (%)
45 (38.1)
44 (37.9)
Male, n (%)
Controls
118
VLBW
116
N
Groups
Study
health and disease”).
114 (1.8)
0.08 (1.0)
3619 (476)
40.0 (1.2)
86 (1.4)
289 (4.6)
3105 (49.1)
6325
Controls
22 (16.4)***
-0.73 (1.4)***
1786 (493)***
31.8 (2.0)***
32 (23.9)***
32 (23.9)***
65 (48.5)
134
Early preterm
30 (12.4)***
-0.63 (1.3)***
2674 (515)***
35.8 (0.8)***
34 (14.0)***
22 (9.3)***
120 (49.6)
242
Late preterm
ESTER
7 (2.0)
-0.02 (1.0)
3576 (483)
40.1 (1.2)***
4 (1.2)
16 (4.7)
168 (48.8)
344
Controls
Northern Finland Birth Cohort 1986 (NFBC 1986) and the ESTER Preterm Birth Study (“Preterm birth and early life programming of adult
Table 11. Perinatal and neonatal characteristics of the subjects in the Helsinki Study of Very Low Birth Weight Adults (HeSVA), the
Table 12. Mean (SD) in body sizes of girls and boys born early and late preterm, and
controls born at term.
Measurement
Sex
Early preterm
Mean (SD) P value
Height (cm)
Body mass index (kg/m2)
Waist circumference (cm)
Late preterm
Mean (SD)
P value
Controls
Mean (SD)
Girls
163.6 (6.3)
0.90
163.6 (5.3)
0.73
163.9 (6.0)
Boys
174.7 (7.9)
0.70
174.6 (7.1)
0.56
174.8 (6.8)
Girls
20.9 (1.2)
0.25
20.9 (1.2)
0.53
21.0 (1.2)
Boys
20.2 (1.1)
0.85
20.9 (1.2)
0.95
20.9 (1.2)
Girls
72.2 (1.1)
0.45
71.6 (1.1)
0.39
71.5 (1.1)
Boys
74.3 (1.1)
0.58
75.8 (1.1)
0.91
75.3 (1.1)
5.1.3 Body size and composition of young adults born preterm (III)
In the ESTER study, adults born early and late preterm had similar heights as their
peers born at term (Table 13.Fig. 11). However, when adjusted for confounders in
order to assess the total effect (sex, age, cohort, parental education, maternal smoking
during pregnancy, birth weight SD score) and direct effect (in addition to the
covariates in the total effect model, for height, physical activity, daily smoking) of
preterm birth, they were taller than the controls. Adults born early preterm also had
similar BMIs and LBMs as their peers born at term. However, they had higher waist
circumferences, waist-hip ratios, fat mass and body fat percentages (Table 13), but the
difference in fat mass was statistically significant in the model assessing the direct
effect of preterm birth on adult body composition. Adults born late preterm had
higher BMIs, waist circumferences, waist-hip ratios, fat mass and percentage body fat
(Table 13.Fig. 11). The differences remained similar when controlled for the
covariates. They also had higher LBMs, but the difference [3.6% (1.4, 5.8)] was
statistically significant only in the model assessing the total effect of preterm birth on
adult body composition. Adults born early and late preterm were about 2-fold more
likely to be obese than the controls: OR 2.2 (95% CI 1.1, 4.1) for early preterm and
OR 1.7 (95% CI 1.0, 3.1) for late preterm group when adjusted for age, sex and
source cohort (Table 22.Fig. 16).
75
76
77.3 (0.17)
0.83 (0.05)
42.6 (0.17)
17.9 (0.59)
28.7 (0.30)
Waist circumference (cm)
Lean body mass (kg)
Fat mass (kg)
Percentage body fat
22.8 (0.24)
Waist-hip ratio
163.4 (5.2)
BMI
Women
Height (cm)
Measurement
15.5 (0.42)
11.6 (0.65)
61.6 (0.15)
0.90 (0.04)
83.5 (0.13)
22.9 (0.17)
178.6 (7.0)
Men
6.2% (-0.4, 13.2)
8.5% (-0.1, 18.9)
-0.2% (-2.8, 2.5)
1.8% (0.7, 2.9)
3.6% (1.2, 6.1)
1.8% (-1.8, 5.3)
0.4 (-0.9, 1.6)
(95% CIs)
Mean difference
Early preterm
groups compared with controls born at term.
27.1 (0.27)
16.8 (0.46)
43.7 (0.14)
0.82 (0.04)
75.8 (0.12)
22.4 (0.18)
164.6 (5.8)
Women
17.1 (0.48)
13.2 (0.68)
61.8 (0.14)
0.91 (0.05)
84.7 (0.13)
23.9 (0.19)
177.7 (6.7)
Men
1.3% (-0.9, 3.5)
1.3% (0.4, 2.1)
3.3% (1.3, 5.3)
2.9% (0.1, 5.8)
0.5 (-0.6, 1.5)
(95% CIs)
Mean difference
8.0% (2.4, 13.8)
11.7% (3.7, 20.4)
Late preterm
26.0 (0.32)
15.7 (0.52)
43.2 (0.13)
0.81 (0.05)
73.7 (0.13)
22.0 (0.19)
164.0 (6.0)
Women
Men
15.4 (0.42)
11.5 (0.57)
61.5 (0.15)
0.90 (0.05)
82.3 (0.10)
23.0 (0.19)
177.6 (7.0)
Controls
preterm and mean differences in percent, except for height in cm, (95% CIs, adjusted for age, sex and cohort) between preterm
Table 13. Means for height and geometric means (SD) of body size and composition measurements in adults born early and late
Fig. 11. Mean percentage differences (except for height in cm) and 95% confidence
intervals (error bars) in body size and composition in adults born early and late
preterm compared with controls (zero line), adjusted for age, sex and cohort (whether
they are recruited from the Northern Finland Birth Cohort or the Finnish Medical Birth
Register).
77
To study whether or not perinatal conditions that may accompany preterm birth
contributed to later body size and composition, we reanalyzed the data by 1)
excluding those born SGA, 2) excluding those born after multiple pregnancy, and
3) adjusting the analyses for maternal gestational diabetes. This did not alter any
of the conclusions. We further adjusted the analyses for maternal hypertension in
pregnancy, and the differences in fat mass and body fat percentage attenuated the
differences among those born early preterm.
Further, we compared those born SGA to those born AGA within the preterm
groups. Adults born early preterm and SGA (EPT-SGA) were 4.0 cm (95% CI 1.2,
6.8) shorter and had 9.3% (95% CI 3.1, 15.2) lower LBM than adults born early
preterm and AGA (EPT-AGA) when adjusted for age, sex and cohort. Adults born
late preterm and SGA (LPT-SGA) were 4.9 cm (05% CI 2.6, 9.2) shorter and had
9.4% (95% CI 5.1, 13.7) lower LBM than adults born late preterm and AGA (LPTAGA). However, we found no statistically significant difference in BMI, waist
circumference, fat mass, or percentage body fat between SGA and AGA subjects in
early and preterm groups.
5.2
Resting energy expenditure (I)
We found that adults born preterm with VLBW had 6.3% (95% CI 3.2, 9.3) lower
REE, but 6.1% (95% CI 3.4, 8.6) higher REE per unit lean body mass (REE/LBM
ratio) compared with peers born at term when adjusted for age and sex (Table 14,
HeSVA). The differences in REE and the REE/LBM ratio were little affected after
adjustment for age, sex, parental education, daily smoking, body fat percentage and
the intensity, frequency and duration of self-reported leisure time physical activity.
The interaction between VLBW and sex on these outcomes was not statistically
significant (all P values >0.27), meaning that the association between preterm birth
with VLBW on REE and the REE/LBM ratio was similar in women and men.
Therefore we presented the results pooled for both sexes.
We carried out additional analyses to examine the effects of perinatal and other
clinical characteristics on energy metabolism. We reanalyzed the data after exclusion
of subjects a) born from multiple pregnancies, b) subjects with cerebral palsy,
developmental delay, or severe sensorineural deficit, or c) with regular usage of betasympathomimetic drugs. The results were similar.
78
Table 14. Mean (SD) resting energy expenditure (REE) and resting energy expenditure
per unit lean body mass (REE/LBM ratio) in women and men born preterm with very
low birth weight (VLBW) and controls born at term, and mean percentage differences
in percent (95% CIs) between adults born with VLBW vs. controls.
Measurement
VLBW; mean (SD)
Women
REE (kcal/24h)
Men
1442 (207) 1834 (253)
Term; mean (SD)
Women
Men
1520 (172) 1977 (237)
Mean difference
(95% CI)
-6.3%
(-10.4 to -2.0)
REE/LBM ratio (kcal/24h/kg)
37.4 (4.4)
33.9 (2.6)
35.1 (3.0)
31.9 (2.3)
6.2%
(3.5 to 9.0)
Further, we carried out additional subgroup analysis within the VLBW group.
Subjects born SGA (n=25) had a 6.2% (95% CI 0.15%, 11.5%) lower REE, but a
similar REE/LBM ratio as those born AGA (n=91) when adjusted for age and sex.
The difference in REE was attenuated after further adjustment for other
covariates. Within the VLBW group, individuals whose mothers had preeclampsia
during pregnancy, as compared with those whose mothers did not, had similar
REE values and similar REE/LBM ratios. In VLBW subjects a one SD unit
higher score in body weight at what would have been term (40 weeks of
postmenstrual age) corresponded to a 3.3% (95% CI 0.6%, 6.1%) increase in REE
and was not related to the REE/LBM ratio. However, the change in SD score
from birth to term was not related to REE or the REE/LBM ratio.
5.3
Blood pressure (II–IV)
The association between preterm birth and blood pressure in adolescence or adulthood
was reported in three articles: office-measured BP in Articles II and III and
ambulatory BP in Article IV.
5.3.1 Blood pressure in adolescents born preterm (II)
In NFBC 1986 we found statistically significant interactions between the associations
of early preterm birth and sex on SBP levels (P=0.009) meaning the association of
preterm birth on blood pressure in adolescence. Therefore we performed analyses
separately in boys and girls.
Girls born early preterm had higher SBP higher DBP than control girls (Table 15,
Fig. 12). The difference remained after adjusting for BMI, height, birth weight SD
score, maternal smoking during pregnancy, educational level of the more educated
79
parent, smoking of the subject, physical activity, and Tanner Pubertal Stage (full
model). However, we found no statistically significant difference in BP in girls born
late preterm compared with girls born at term. In addition, the difference in BP was
not statistically significant in boys born preterm (early or late) compared with
controls.
The association between length of gestation and blood pressure was inverse in
adolescent girls: a one-week greater length of gestation corresponded to 0.5 mmHg
(95% CI 0.3, 0.8) lower SBP and 0.2 mmHg (95% CI 0.0, 0.3) lower DBP. However,
this association was not seen in boys. We found no quadratic relationship between the
length of gestation and BP in either sex (all P >0.1).
Table 15. Means (SD) of systolic and diastolic blood pressure (SBP and DBP) in
adolescent girls and boys born early and late preterm, and controls born at term and
mean differences (95% CI) between preterm groups and controls adjusted for age.
Measurement
Early preterm
Mean (SD)
Mean difference
Late preterm
Mean (SD)
(95% CI)
Mean difference
Controls
Mean SD
(95% CI)
Girls
SBP (mmHg)
116.7 (9.5)
6.7 (3.2, 10.2)
111.8 (10.4)
1.7 (-0.6, 3.9)
109.9 (10.7)
DBP (mmHg)
70.3 (6.7)
3.5 (1.1, 5.8)
67.6 (6.7)
0.6 (-0.9, 2.1)
66.8 (7.2)
Boys
SBP (mmHg)
121.6 (15.4)
0.8 (-7.5, 5.8)
122.6 (14.1)
1.3 (-1.4, 3.5)
121.0 (12.1)
DBP (mmHg)
68.9 (9.2)
-0.1 (-3.6, 3.4)
68.4 (8.2)
-0.4 (-1.9, 1.2)
68.6 (7.9)
However, girls born EPT-SGA had 8.4 mmHg (95% CI 1.5, 15.4) lower SBP and
4.9 mmHg (95% CI 0.0, 9.7) lower DBP than girls born EPT-AGA. Girls born
LPT-SGA did not have statistically significant difference in blood pressure when
compared to girls born LPT-AGA. In addition, no statistically significant
difference was found in boys born EPT-SGA vs. EPT-AGA or in boys born LPTSGA vs LPT-AGA. We further reran the comparisons after excluding those born
SGA from preterm and control groups and the difference in BP was even greater
in girls born early preterm compared with controls. The results were similar when
subjects exposed to maternal GDM or maternal hypertensive pregnancy disorders
were excluded.
80
5.3.2 Blood pressure in young adults born preterm (III)
In the ESTER study adults born early preterm had higher SBP and DBP than the
controls (Table 16). The difference remained statistically significant when further
adjusted for
1.
2.
3.
age, sex, cohort, height, BMI, parental educational attainment, maternal
smoking during pregnancy, parent’s history of hypertension, diabetes, and
coronary heart disease or stroke, and birth weight SD score (total effect)
age, sex, cohort, height, BMI, self-reported physical activity and daily
smoking to control the bias caused by possible intermediate factors
total effect and intermediate factors (direct effect).
The interaction between preterm birth and sex on BP was not statistically
significant. For this reason we carried out the analysis simultaneously for women
and men.
We further adjusted the analyses for maternal hypertension in pregnancy.
Subjects exposed to maternal hypertension had 3.6 mm Hg higher systolic and 2.7
mm Hg higher diastolic blood pressure compared with those not exposed (adjusted for
the direct effect model). When adjusted for maternal hypertension, the differences in
systolic/diastolic blood pressures vs. those in the controls became attenuated to 1.9
(95% CI -0.3, 4.0)/1.7 mmHg (0.1, 3.3) for early preterm and 0.5 mmHg (-1.2,
2.3)/0.02 mmHg (-1.1, 1.6) for late preterm infants. However, the results remained
similar when we reran the analysis excluding those born SGA or born from multiple
pregnancy or those exposed to maternal GDM. We also compared those born SGA to
those born AGA within the early and late preterm groups and there were no
statistically significant difference in systolic or diastolic blood pressure.
Table 16. Mean systolic and diastolic blood pressures (SBP and DBP) in adults born
early and late preterm compared with controls born at term, and mean differences
(95% CI) between preterm groups and controls adjusted for age, sex and cohort
(NFBC or FMBR).
Measurement
Early preterm
Mean (SD)
Mean difference
SBP (mmHg)
118.9 (12.9)
DBP (mmHg)
77.8 (8.9)
Late preterm
Controls
Mean (SD)
Mean difference
3.0 (0.9, 5.1)
117.7 (13.4)
1.7 (-0.1, 3.4)
116.3 (12.7)
2.6 (0.9, 4.2)
76.5 (8.2)
1.2 (-0.1, 2.5)
75.5 (7.6)
(95% CI)
Mean (SD)
(95% CI)
81
5.3.3 Ambulatory blood pressure in young adults born preterm (IV)
In the ESTER study, adults born early preterm had higher 24-hour SBP and DBP,
higher SBP and DBP when awake and higher DBP when asleep versus controls when
adjusted for age, sex and use of an accelerometer (Table 17). The difference in 24hour and awake SBP remained similar when further adjusted for covariates (parental
educational level, mother’s BMI before pregnancy, gestational or chronic
hypertension, preeclampsia [including superimposed preeclampsia], gestational
diabetes, birth weight SD score, height, BMI, physical activity and daily smoking).
However, the differences in 24-hour DBP, and awake DBP and sleep SBP were not
statistically significant when controlled for perinatal factors (parental educational
level, mother’s BMI before pregnancy, gestational or chronic hypertension,
preeclampsia gestational diabetes and birth weight SD score). Adults born late
preterm had no statistically significant difference in mean ABP (0). A one-week
increase in the length of gestation was associated with approximately 0.6 mmHg (0.1,
1.0) lower 24-hour and awake SBP and 0.3 mmHg (0.04, 0.6) lower 24-hour DBP and
0.4 mmHg (0.1, 0.7) lower awake DBP. However, no statistically significant
association between length of gestation and sleep SBP or DBP was found.
We found no statistically significant interactions between the associations of
early or late preterm birth and sex on ambulatory blood pressure levels (P≥0.08),
except for awake SBP among late preterm (P=0.05). However, we further performed
analyses separately in women and men. Differences between adults born early
preterm and controls were seen in both sexes in awake SBP. In addition. women born
early preterm had higher 24-hour DBP and awake DBP than controls. However, men
born early preterm had higher 24-hour SBP than controls. Differences between adults
born late preterm and controls were seen only among men: men born late preterm had
higher 24-hour SBP and DBP than men born at term.
Maternal chronic and gestational hypertension during pregnancy was
independently associated with higher ABP, while maternal preeclampsia was not.
Therefore, we reanalyzed the data after excluding subjects exposed to maternal
hypertension during pregnancy, and the difference between adults born early preterm
and controls in 24-hour SBP attenuated to 5.4 mm Hg (95% CI 1.6, 9.2). Otherwise,
the differences remained similar. When subjects born with SGA were excluded from
the analyses, the differences in mean ABP between the early preterm and control
groups increased by 0.1–0.5 mm Hg,
82
Variability of ambulatory blood pressure
Adults born early preterm also had higher SDs of 24-hour SBP and DBP, SD of
awake SBP and DBP and SD of sleep DBP (Table 17). The differences were similar
when adjusted for covariates (parental educational level, mother’s BMI before
pregnancy, gestational or chronic hypertension, preeclampsia [including
superimposed preeclampsia], gestational diabetes, birth weight SD score, height,
BMI, physical activity and daily smoking), except for the SD of wake DBP adjusted
for perinatal factors (parental educational level, mother’s BMI before pregnancy,
gestational or chronic hypertension, preeclampsia, gestational diabetes and birth
weight SD score). Adults born late preterm had 0.8 mmHg (0.1, 1.4) higher SD of 24hour DBP, 0.8 mmHg (0.0, 1.6) higher sleep SBP and 0.6 mmHg (-0.2, 1.4) higher
SD of sleep DBP when adjusted for age, sex and use of an accelerometer (Table 17).
Otherwise, no statistically significant difference in SD of ambulatory blood pressure
was found between the late preterm group and controls. A one-week increase in the
length of gestation was associated with approximately 0.1–0.2 mmHg lower SD of
24-hour SBP and DBP, SBP and DBP and sleep DBP. We reanalyzed the data after
excluding subjects exposed to maternal hypertension during pregnancy, and the
differences in SDs of ABP remained similar. We further reran the analyses after
excluding subjects born SGA. The differences in the SDs of ABP attenuated by up to
0.2 mm Hg.
83
84
1.2 (-1.3, 3.7)
126.8 (13.1)
76.5 (8.4)
110.1 (11.8)
59.2 (6.0)
Awake SBP
Awake DBP
Sleep SBP
10.3 (2.5)
9.6 (2.5)
7.9 (2.5)
8.0 (2.5)
24-hour DBP
Awake SBP
Awake DBP
Sleep SBP
Sleep DBP
1.5 (0.6, 2.4)
0.7 (-0.2, 1.7)
1.0 (0.2, 1.7)
1.3 (-0.5, 2.1)
1.7 (0.9, 2.5)
1.7 (0.8, 2.7)
4.2 (1.6, 6.7)
6.4 (2.8, 10.1)
Abbreviations: DBP, diastolic blood pressure; SBP, systolic blood pressure.
12.6 (3.0)
12.3 (2.3)
24-hour SBP
SD of ambulatory BP, mm Hg
Sleep DBP
3.9 (0.3, 7.5)
71.2 (7.4)
3.2 (0.7, 5.7)
121.4 (12.7)
24-hour DBP
5.5 (1.9, 9.3)
(95% CI)
Mean difference
Early preterm, n = 42
Mean (SD)
24-hour SBP
Mean ambulatory BP, mm Hg
Measurement
(SDs) between early and late preterm adults compared with controls.
7.2 (3.0)
8.2 (3.2)
9.5 (2.4)
9.6 (2.5)
11.4 (2.1)
11.5 (2.7)
58.7 (7.0)
108.5 (11.5)
73.9 (6.5)
122.9 (12.0)
69.8 (6.2)
119.1 (12.0)
Mean (SD)
0.6 (-0.2, 1.4)
0.8 (0.0, 1.6)
0.5 (-0.1, 1.2)
0.5 (-0.2, 1.2)
0.8 (0.1, 1.4)
0.5 (-0.3,1.4)
0.6 (-1.5, 2.7)
1.3 (-1.8, 4.4)
1.9 (-0.2, 4.1)
2.0 (-1.2, 5.1)
0.9 (-1.3, 3.1)
2.7 (-0.5, 5.8)
(95% CI)
Mean difference
Late preterm, n = 72
6.4 (2.1)
7.3 (2.4)
8.6 (1.9)
9.1 (2.1)
10.7 (2.1)
11.0 (2.6)
58.2 (6.5)
106.4 (8.9)
72.7 (7.1)
120.8 (9.4)
68.2 (6.6)
116.3 (8.9)
Mean (SD)
Controls, n = 103
Table 17. Means (SD) and SDs of ambulatory blood pressure and mean differences (95 CIs) in means and standard deviations
Fig. 12. The mean difference and 95% confidence intervals (error bars) in office and
ambulatory measured blood pressure in adolescents and adults born early preterm
compared to controls (zero line) adjusted for age (and sex and cohort).
85
Fig. 13. The mean difference and 95% confidence intervals (error bars) in office and
ambulatory measured blood pressure in adolescents and adults born late preterm
compared to controls (zero line) adjusted for age (and sex and cohort).
86
5.3.4 Hypertension (II, III)
In the NFBC 1986 study we did not observe a pronounced risk of hypertension in
adolescents born preterm, but pre-hypertension was more common in the early
preterm group (17.7%) than in the controls (9.6%) (P<0.01). However, in the ESTER
study, adults born preterm were about two- to threefold more likely to have
hypertension, but the OR was statistically significant only in the early preterm group
(Table 22.Fig. 16): OR for the early preterm group 2.7 (95% CI 1.3, 5.3) and for the
late preterm group 1.7 (0.9, 3.2) adjusted for age, sex and cohort. In addition, adults
born early preterm were more likely to have hypertensive ABP when awake: OR 3.8
(95% CI 1.1, 13.7). However, the OR was not statistically significant when adjusted
for other covariates (age, sex, use of an accelerometer, parental educational level,
mother’s BMI before pregnancy, gestational or chronic hypertension, preeclampsia
[including superimposed preeclampsia], birth weight SD score, height, BMI, physical
activity and smoking).
5.4
Lipid metabolism (II, III)
The association between preterm birth and lipid profile in adolescence or adulthood
was different in women and men, so we performed analyses separately for both sexes.
In the adolescents the P value for interaction between early preterm birth and sex was
0.02 for LDL-C and it was 0.03 for ApoB. In addition, the P values for the interaction
terms sex and early preterm birth were 0.035 for HDL-C and 0.019 for ApoA1 (when
adjusted for age and sex).
5.4.1 Lipid profile of adolescents born preterm (II)
Among girls in NFBC, the lipid profiles were similar in all study groups. As for boys,
those born early preterm had higher mean TC, LDL-C, ApoB and TG levels than
controls when adjusted for age (Table 18). The differences remained similar when
controlled for covariates (age, BMI, birth weight SD score, maternal smoking during
pregnancy, parental education, smoking of the subject, physical activity and pubertal
stage), except for the TGs when adjusted for current lifestyle factors. Boys born late
preterm also had higher levels of TGs (Table 18), and when controlled for covariates
as well. Levels of HDL-C and ApoA1 were similar in boys born early/late preterm
and controls. In addition, among boys, a one-week greater length of gestation
87
corresponded to 0.5% (95% CI 0.1, 0.9%) lower TC, 1.0% (0.4, 1.6%) lower LDL-C
and 1.0% (0.4, 1.5%) lower ApoB levels, adjusted for covariates. There were no
quadratic relationships between length of gestation and lipid concentrations (all P
>0.1).
Table 18. Geometric means (geometric SD) of lipid levels in adolescent girls and boys
born early and late preterm and controls born at term, and mean percentage
differences (95% CIs) between preterm groups and controls adjusted for age.
Measurement
Early preterm
Late preterm
Controls
Geometric
Mean percentage
Geometric
Mean percentage
Geometric
mean (SD)
difference (95% CI)
mean (SD)
difference (95% CI)
mean (SD)
4.46 (1.18)
2.5 (-2.8, 8.1)
4.39 (1.46)
0.9 (-2.5, 4.5)
4.36 (1.19)
HDL-C
1.54 (1.23)
5.6 (-0.5, 12.1)
1.46 (1.22)
0.2 (-3.6, 4.2)
1.46 (1.21)
LDL-C
2.21 (1.34)
-0.8 (-8.1, 7.2)
2.27 (1.26)
2.0 (-3.0, 7.2)
2.24 (1.29)
ApoA1
1.45 (1.13)
2.9 (-1.3, 7.2)
1.42 (1.126)
0.3 (-2.4, 3.1)
1.41 (1.15)
ApoB
0.67 (1.34)
1.5 (-5.4, 8.9)
0.67 (1.24)
1.2 (-3.4, 6.0)
0.66 (1.27)
Triglycerides
0.72 (1.64)
-7.4 (-18.2, 4.7)
0.80 (1.55)
3.3 (-4.6, 11.9)
0.77 (1.49)
4.46 (1.18)
6.7 (0.2, 13.7)
4.39 (1.19)
2.2 (-1.0, 5.5)
4.36 (1.19)
Girls
Total
cholesterol
Boys
Total
cholesterol
HDL-C
1.54 (1.24)
-0.1 (-7.1, 7.4)
1.46 (1.22)
-2.6 (-6.1, 1.0)
1.46 (1.21)
LDL-C
2.21 (1.34)
11.7 (2.1, 22.3)
2.27 (1.26)
4.4 (-0.2, 9.3)
2.24 (1.29)
ApoA1
1.45 (1.13)
0.9 (-3.6, 5.7)
1.42 (1.16)
-1.0 (-3.3, 1.3)
1.41 (1.15)
ApoB
0.67 (1.3)
12.3 (3.1, 22.4)
0.67 (1.24)
5.0 (0.5, 9.6)
0.66 (1.27)
Triglycerides
0.72 (1.64)
19.2 (2.1, 39.1)
0.80 (1.56)
13.2 (4.7, 22.4)
0.77 (1.49)
Abbreviations: ApoA1, apolipoprotein A1; ApoB, apolipoprotein B; HDL-C, high-density lipoprotein cholesterol;
LDL-C, low-density lipoprotein protein cholesterol.
Boys born EPT-SGA had 17.6% (95% CI 2.9, 30.2) lower TC, 24.7% (95% CI
3.2, 41.4) lower LDL-C levels, and 24.5% (95% CI 5.1, 40.0) lower ApoB levels
than boys born EPT-AGA. We found no difference between boys born LPT-SGA
compared to boys born LPT-AGA in lipid levels. In addition, after excluding
those born SGA, among boys born early preterm, levels of TC were 10.4% (95%
CI 2.7–18.6%) higher, those of LDL-C 19.3% (7.7–32.2%) and those of ApoB
18.0% (7.2–29.9%) higher than in their controls. In addition, we reran the
88
analysis with adjustment only for birth weight SD score to assess the effect of
birth weight separately from the effect of other covariates: In boys born early
preterm, TC was 5.4% (-1.0–2.2%) higher, LDL-C was 10.3% (0.9–20.6%)
higher, ApoB was 8.7% (-0.2–18.4%) higher and TGs 16.7% (0.1–35.9%) higher
compared with controls. In boys born late preterm TG levels were 12.8% (4.2,
22.0%) higher. To assess the effect of maternal gestational disorders and
hypertensive pregnancy disorders, we reran the analyses after 1) excluding
subjects exposed to maternal gestational diabetes and 2) excluding those exposed
to maternal hypertension or preeclampsia, and the results remained similar.
Moreover, after further adjustment for a) maternal gestational diabetes, b)
preeclampsia and gestational or chronic hypertension with other covariates, the
results again remained similar.
5.4.2 Lipid profile of young adults born preterm (III)
In the ESTER study, women born early preterm had lower HDL-C and ApoA1
concentrations than the control women when adjusted for age and cohort (Table
19). The differences attenuated when further adjusted for covariates (BMI,
parental educational attainment, maternal smoking during pregnancy, parental
history of hypertension, diabetes and acute myocardial infarction or stroke, selfreported physical activity, daily smoking, birth weight SD score and hormonal
contraception, direct effect model): Levels of HDL-C were 7.2% (1.1, 12.9%)
lower and those of ApoA1 7.7% (2.3, 12.8%) lower in the early preterm group
compared with controls. No differences in triglyceride or total or LDL-cholesterol
concentrations were found in women born preterm compared with controls.
Associations between preterm birth and lipid profile were not present among men.
Within the subjects, no one used lipid-lowering medication.
We further compared adults born EPT-SGA to adults born EPT-AGA, and adults
born LPT-SGA to those born LPT-AGA, and no statistically significant difference
was found between groups. In addition, after exclusion of those born SGA or those
exposed to maternal antenatal disorders, or additional adjustment for maternal
antenatal disorders, the results remained similar.
89
Fig. 14. Mean percentage differences and 95% confidence intervals (error bars) in
lipid levels in adolescent girls and boys and young adult women and men born early
preterm compared with controls (zero line) adjusted for age, and in adults of the
source cohort (the Northern Finland Birth Cohort 1986 or the Finnish Medical Birth
Register.
90
Fig. 15. Mean percentage differences and 95% confidence intervals (error bars) in lipid
levels in adolescent girls and boys and young adult women and men born late preterm
compared with controls (zero line) adjusted for age, and in adults of the source cohort
(the Northern Finland Birth Cohort 1986 or the Finnish Medical Birth Register).
91
Table 19. Geometric means (geometric SD) of lipid levels in young adult women and
men born early and late preterm and controls born at term, and mean percentage
differences (95% CIs) between preterm groups and controls adjusted for age, sex and
cohort (NFBC or FMBR).
Measurement
Early preterm
Late preterm
Controls
Geometric
Mean percentage
Geometric
Mean percentage
Geometric
mean (SD)
difference (95%
mean (SD)
difference (95%
mean (SD)
CI)
CI)
Women
TC
4.58 (1.16)
-2.3 (-7.0, 2.6)
4.68 (1.17)
-0.4 (-4.2, 3.7)
HDL-C
1.59 (1.27)
-11.4 (-16.9, -5.6)
1.73 (1.23)
-3.2 (-8.1, 2.0)
4.70 (1.20)
1.79 (1.24)
LDL-C
2.70 (1.31)
1.3 (-6.6, 9.8)
2.66 (1.28)
0.0 (-6.4, 6.8)
2.66 (1.35)
ApoA1
1.53 (1.23)
-9.7 (-14.7, -4.5)
1.65 (1.20)
-2.9 (-7.3, 1.7)
1.69 (1-21)
ApoB
1.53 (1.-23)
1.5 (-5.6, 9.2)
0.75 (1.24)
-0.1 (-5.9, 6.0)
0.75 (1.31)
LPa, mg/l
99,9 (3.24)
4.9 (-25.5, 47.7)
88.7 (2.98)
-6.5 (-29.5, 23.9)
93.9 (3.25)
Triglycerides
0.97 (1.56)
1.5 (-11.3, 16.1)
1.01 (1.58)
5.1 (-5.8, 17.2)
0.97 (1.61)
4.46 (1.22)
Men
TC
4.49 (1.23)
1.3 (-4.3, 7.2)
4.55 (1.20)
2.6 (-2.0, 7.5)
HDL-C
1.36 (1.25)
-1.2 (-7.3, 5.2)
1.32 (1.21)
-4.1 (-8.9, 0.9)
1.37 (1.26)
LDL-C
2.76 (1.49)
0.0 (-8.8, 9.6)
2.91 (1.32)
6.3 (-1.4, 14.6)
2.76 (1.37)
ApoA1
1.35 (1.15)
-1.7 (-5.8, 2.7)
1.34 (1.14)
-2.0 (-5.5, 1.5)
1.36 (1.17)
ApoB
0.77 (1.38)
1.8 (-5.9, 10.1)
0.80 (1.27)
5.6 (-1.0, 12.6)
0.76 (1.31)
LPa, mg/l
85.8 (3.25)
-4.9 (-33.0, 34.8)
94.4 (3.17)
2.4 (-23.1, 36.4)
91.0 (3.19)
Triglycerides
0.95 (1.63)
6.4 (-6.5,21.0)
0.95 (1.56)
5.9 (-4.7, 17.6)
0.90 (1.51)
Abbreviations: ApoA1, apolipoprotein A1; ApoB, apolipoprotein B; HDL-C, high-density lipoprotein
cholesterol; LDL-C, low-density lipoprotein protein cholesterol; LPa, lipoprotein (a); TC, total cholesterol.
5.5
Glucose regulation (II, III)
5.5.1 Glucose metabolism of adolescents born preterm (II)
We found statistically significant interaction between late preterm birth and sex on
HOMA-IR values (P=0.036) in the adolescents, so we analyzed the differences
separately in girls and boys (NFBC). Girls did not show any difference in fasting
plasma glucose or serum insulin levels, or in HOMA-IR values, compared with their
controls.
Boys born late preterm had higher insulin HOMA-IR values than boys born at
term (Table 20). The differences became attenuated when adjusted for age, BMI,
height, birth weight SD score, maternal smoking during pregnancy, educational level
of the more educated parent, smoking of the subject, physical activity and Tanner
92
Pubertal Stage. The mean levels of fasting plasma glucose were similar between the
groups. When adjusted only for birth weight SD score, in boys born late preterm,
fasting insulin levels were13.2% (3.1, 24.3%) higher and HOMA-IR values 12.6%
(2.6, 23.6%) higher than in controls. Otherwise, within the boys born early preterm or
boys born late preterm, there was no statistically significant difference between SGA
and AGA in glucose metabolism. In addition, after exclusion of those born SGA or
those exposed to maternal antenatal disorders, or additional adjustment for maternal
antenatal disorders, the results remained similar.
Table 20. Geometric means (geometric standard deviations, SDs) concerning glucose
metabolism in adolescent girls and boys born early and late preterm, and controls
born at term, and mean percentage differences (95% CIs) between preterm groups and
controls adjusted for age.
Early preterm
Late preterm
Controls
Geometric
Mean percentage
Geometric
Mean percentage
Geometric
mean (SD)
difference
mean (SD)
difference
mean (SD)
(95% CI)
(95% CI)
Girls
fP-gluk
5.0 (1.08)
-0.2 (-3.3, 3.0)
5.1 (1.13)
1.1 (-1.0, 3.2)
5.0 (1.11)
9.8 (1.46)
0.2 (-11.2, 13.1)
10.2 (1.53)
5.7 (-2.4, 14.1)
9.8 (1.49)
1.26 (1.52)
0.2 (-13.1, 15.6)
1.31 (1.52)
4.5 (-4.6, 14.4)
1.26 (1.49)
5.3 (1.09)
0.9 (-2.4, 4.3)
5.3 (1.08)
-0.7 (-2.4, 1.0)
5.3 (1.10)
9.9 (1.46)
5.5 (-10.6, 24.5)
10.9 (1.70)
13.8 (4.7, 23.7)
9.6 (1.59)
1.37 (1.95)
14.1 (-8.0, 41.5)
1.42 (1.66)
13.2 (3.2, 24.3)
1.26 (1.58)
(mmol/l)
fS-insulin
(mU/l)
HOMA-IR
Boys
fP-gluk
(mmol/)
fS-insulin
(mU/l)
HOMA-IR
Abbreviations: fP-gluk; fastin plasma glucose; fS-insulin, fasting serum insulin; HOMA-IR, homeostasis
model assessment for insulin resistance.
5.5.2 Glucose metabolism of young adults born preterm (III)
No statistically significant interaction between preterm birth and sex on glucose
metabolism was found in young adults born preterm. Two subjects of the ESTER
study born late preterm reported having type 2 diabetes, so we excluded them from
the analyses of glucose metabolism. Adults born early preterm had 15.5% (-0.1, 33.6)
higher 2-hour serum insulin levels, but the difference was not statistically significant
93
(Table 21). Otherwise, adults born early preterm showed no differences in glucose
metabolism outcomes compared with controls born at term. Adults born late preterm
had 10.1% (1.9, 19.0%) higher fasting and 16.5% (3.0, 31.7%) higher 2-hour insulin
concentrations, and 9.8% (1.6, 18.6) higher HOMA-IR indices than the controls when
adjusted for age, sex and cohort. These differences became statistically nonsignificant when controlled for parental and prenatal factors (parental educational
attainment, maternal smoking during pregnancy, parental history of hypertension,
diabetes, myocardial infarction or stroke), or intermediate factors (BMI, self-reported
physical activity, daily smoking and birth weight SD score). Fasting and 2-hour
glucose concentrations were similar in all groups. Eight (3.3%) of the late preterm
subjects and 11 (3.2%) of the controls had impaired glucose tolerance (fasting glucose
6.0 to 6.9 mmol/l and/or 2-hour glucose 7.8 to 11.0 mmol/l) and one (0.4%) subject
born late preterm was found to have diabetes (fasting glucose >7.0 and/or 2-hour
glucose >11.0) in oral glucose tolerance tests (OGTTs). Adults born EPT-SGA had
71.3% (95% CI 16.3, 151.9) higher 2-hour insulin than adults born EPT-AGA.
Otherwise, there was no statistically significant difference in glucose metabolism
between EPT-SGA and EPT-AGA subjects or LPT-SGA and LPT-AGA subjects. We
further reanalyzed the data by 1) excluding those born small for gestational age, 2)
excluding those born in connection with a multiple pregnancy, and 3) further
adjusting the analyses for maternal gestational diabetes. This did not alter any of the
conclusions of the glucose metabolism.
Table 21. Geometric means (geometric SD) concerning glucose metabolism in young
adults born early and late preterm and controls born at term, and mean percentage
differences (95% CIs) between preterm groups and controls adjusted for age, sex and
cohort (NFBC or FMBR).
Measuremennt
Early preterm
Geometric
Mean percentage
Late preterm
Geometric
Mean percentage
Controls
Geometric
mean (SD)
difference (95% CI)
mean (SD)
difference (95% CI)
mean (SD)
fP-gluk
5.17 (1.09)
0.8 (-0.8, 2.4)
5.17 (1.10)
0.3 (-1.0, 1.6)
5.14 (1.09)
P-gluk 2h
4.90 (1.34)
-0.4 (-3.9, 3.2)
4.96 (1.29)
1.1 (-1.8, 4.0)
4.86 (1.27)
fS-insulin
7.27 (1.66)
8.8 (-1.0, 19.6)
7.40 (1.63)
10.1 (1.9, 19.0)
6.65 (1.51)
S-insulin 2h
24.89 (2.14)
15.5 (-0.1, 33.6)
25.08 (2.09)
16.5% (3.0, 31.7)
21.73 (2.04)
HOMA-IR
0.95 (1.66)
8.9 (-0.9, 19.7)
0.96 (1.63)
9.8 (1.6, 18.6)
0.87 (1.51)
Abbreviations: fP-gluk; fastin plasma glucose; fS-insulin, fasting serum insulin; HOMA-IR, homeostasis model
assessment – insulin resistance; fP-gluk 2h, 2-hour plasma glucose; fS-insulin 2h, 2-hour serum insulin.
94
5.6
Other metabolic biomarkers (III)
In addition to conventional risk factors, we studied emerging risk factors that may
reflect specific pathophysiological pathways, such as uric acid, markers of
inflammation and markers of fatty liver (Table 22). In the ESTER study, subjects born
preterm were 8- to 13-fold more likely to have an intermediate or high fatty liver
index, a proxy of non-alcoholic fatty liver disease: 3.9% of subjects born early
preterm, 2.5% of subjects born late preterm and 0.3% of the controls had an
intermediate or high fatty liver index. However, the ORs were statistically significant
in early preterm group only. Of the individual markers of fatty liver disease, plasma
concentrations of alanine aminotransferase were 15.0% (95% CI 6.4, 24.2%) higher
and those of aspartate transaminase were 11.7% (5.5, 18.2%) higher in those born late
preterm, but the differences were not statistically significant.
Table 22. Geometric means (geometric SD) concerning cardiometabolic biomarkers in
young adults born early and late preterm and controls born at term, and mean
percentage differences (95% CIs) between preterm groups and controls adjusted for
age, sex and cohort (NFBC or FMBR).
Measurement
Early preterm
Late preterm
Mean
Geometric
Mean
Geometric
mean (SD)
difference a
mean (SD)
difference a
mean (SD)
(95% CI)
Fasting plasma uric acid
314.3 (80.9)
(µmol/l)
High-sensitivity C-
20.1
(95% CI)
313.4 (74.5)
(7.9, 32.2)
1.19 (3.95)
reactive protein, mg/l
Blood leukocytes, 109/l
-3.4%
1.01 (3.59)
(-24.6, 23.7)
6.06 (1.31)
5.5%
25.5 (1.63)
aminotransferase, U/l
Plasma aspartate
9.3%
22.9 (1.34)
5.6%
291.7 (68.7)
-9.4
1.15 (3.59)
(-25.9, 10.7)
5.89 (1.29)
3.1%
5.67 (1.29)
(-1.2, 7,7)
26.6 (1.69)
(-0.6, 20.1)
transaminase, U/l
20.1
(10.7, 30.5)
(0.0, 11.2)
Plasma alanine
Controls
Geometric
15.0%
23.2 (1.67)
(6.4, 24.2)
24.2 (1.43)
(-1.5, 13.2)
11.7%
21.7 (1.44)
(5.5, 18.2)
Plasma albumin, g/l
47.1 (2.7)
0.6 (0.08, 1.0)
46.4 (2.4)
-0.1 (-0.5, 0.3)
46.5 (2.7)
Plasma gamma
19.1 (1.84)
3.5%
19.4 (1.81)
5.7%
18.4 (1.68)
5.44 (1.8)
0.3 (0.0, 0.5)
5.13 (1.1)
0.0 (-0.2, 0.2)
glutamate, U/l
Plasma urea, mmol/l
a
(-6.7, 14.8)
(-2.8, 15.0)
5.1 (1.3)
Mean differences are percentages except for fasting plasma uric acid, plasma albumin and plasma urea.
Concentrations of plasma uric acid, another marker of metabolic syndrome, were
20.1% (7.9, 32.2%) higher in the subjects born early preterm and 20.1% (10.7,
95
30.5%) higher in the late preterm group. In addition, plasma albumin
concentrations were 0.6 g/l (0.08, 1.0) higher and plasma urea concentrations
were 0.3 mmol/l (0.0, 0.5) higher in those born early preterm than in the controls,
but the difference was not statistically significant when adjusted for the model
used to assess the total effect of preterm birth (BMI, parental educational
attainment, maternal smoking during pregnancy, parental history of hypertension,
diabetes and myocardial infarction or stroke, self-reported physical activity, daily
smoking and birth weight SD score). As for markers of inflammation, the levels
of blood leukocytes were 5.5% (0.0, 11.2) higher in those born early preterm, but
the difference was not statistically significant when adjusted for covariates.
However, no difference in high-sensitivity C-reactive protein levels was found
between adults born preterm and controls, except for 18.8% (0.4, 33.4) lower
levels in the late preterm group when adjusted for the model used to assess the
direct effect of preterm birth.
5.7
Metabolic syndrome (III)
Of the 711 subjects of the ESTER study who were included in the analysis, 46
(6.5%) fulfilled the criteria of metabolic syndrome. Of the controls, 12 (3.5%) had
the syndrome (Fig. 16). Among those born early preterm, the number was 15
(11.5%), the odds ratio compared with controls being 3.97 (95% CI 1.76–8.62)
adjusted for sex, age and cohort. Among those born late preterm, the number was
19 (7.9%), odds ratio 2.5 (95% CI 1.2–5.43). The results were similar when
further adjusted for covariates.
96
Fig. 16. Prevalence of hypertension, obesity, metabolic syndrome and fatty liver
index >30 in adults born early and late preterm versus adults born at term (controls).
Printed with permission; the same figure appears in Am J Epidemiol. 2015: In press.
97
98
6
Discussion
We found that adolescents and young adults born preterm show enhancement of
cardiometabolic risk factors in several pathophysiological pathways (Fig. 17). While
the results of previous studies have suggested that those born smallest and most
immature have elevated levels of cardiometabolic risk factors, our study shows that
some of these risk factors are also present in the much larger group of people born
less preterm. Most of these risk factors were not explained by maternal pregnancy
disorders, size at birth, socioeconomic status, current body size, or lifestyle. Although
low birth weight is associated with later cardiometabolic risk factors, subjects born
preterm and SGA did not have different cardiometabolic risk factors in adolescence or
adulthood than subjects born preterm, except lower REE, lower SBP and DPB in
adolescence, and higher 2-hour insulin than adults born preterm and AGA. However,
the number of subjects born SGA is quite low for subgroup analysis.
6.1
Body size and composition (I–III)
Adolescents born preterm had similar body sizes and composition as their peers born
at term (NFBC 1986, II). Nevertheless, young adults born early and late preterm have
higher rates of obesity and higher waist circumferences than their peers born at term
(the ESTER study, III). However, previous findings have shown that adults born
severely preterm tend to be shorter compared with those born at term (Saigal et al.
2006, Indredavik Evensen et al. 2009) and tend to have a lower BMI as a result of
lower lean body mass and similar fat percentages (Hovi et al. 2007, Parkinson et al.
2013). The early preterm group in our analysis included only 46 (34.3%) subjects
born with VLBW (<1500 g), which may explain the difference between our study and
previous ones. This is supported by the findings of other studies that have included
subjects with all degrees of preterm birth and which have revealed higher BMI in
adults born preterm compared with controls (Lewandowski et al. 2013, Mathai et al.
2013). The results of our study and others suggest that very preterm birth has a
different effect on adult body size in comparison with late preterm birth.
Obesity, particularly abdominal obesity, is a key component underlying many
characteristics of metabolic syndrome and is a major health problem throughout the
world. The WHO defines obesity as abnormal or excessive fat accumulation that
presents a risk to health and it is commonly classified according to BMI. The 2010
Global Burden of Disease Study ranked high BMI among the four leading risk factors
for disability-adjusted life years in the Americas, Europe, the Middle East and
99
100
Fig. 17. Preterm birth and cardiometabolic risk factors in later life.
Australasia, and in recent decades it has increased the global disease burden by
81% (Lim et al. 2012). Much of this burden is associated with an increased risk of
cardiometabolic conditions. Numerous studies have shown an association
between obesity and various cardiovascular disease risk factors, such as diabetes,
hypertension, and dyslipidemias (Kopelman 2000, Mokdad et al. 2003). An
overweight condition in youth might have particularly long lasting impacts on
future health: being overweight in youth is associated with increased risks of type
2 diabetes, hypertension, dyslipidemia and carotid-artery atherosclerosis in later
life (Juonala et al. 2011, Koskinen et al. 2014).
BMI is a convenient marker of overweight conditions and obesity, but it is an
imperfect indicator of body fat, explaining only 25% of its variation. BMI also
reflects LBM, which has associations with a number of outcomes including all-cause
mortality (Gallagher et al. 1996). Thus, we also assessed body composition by means
of bioelectric impedance and showed that adults born preterm had a higher fat mass
and a higher percentage of body fat, and the difference compared with controls was
more pronounced in the late preterm group than in the early preterm group. The
finding is consistent with the results of previous studies on body size and composition
of former preterm infants. Studies with subjects born very preterm or with VLBW
have revealed lower LBM, but no difference in fat mass (Peralta-Carcelen et al. 2000,
Hovi et al. 2007), or no difference between preterm group and controls (Weiler et al.
2002, Rotteveel et al. 2008a), whereas those studies with subjects born less preterm
have shown a more adipose body composition (Breukhoven et al. 2012, Lewandowski
et al. 2013, Mathai et al. 2013). Additionally, in a recent meta-analysis it was
determined that there were no differences in fat percentages; again, this is likely to
reflect adults born severely preterm, as the mean gestational age of those born preterm
was 30.6 weeks (Parkinson et al. 2013), whereas the mean GA in the subjects born
early preterm was 31.8 weeks (SD 2.0) and in subjects born late preterm 35.8 weeks
(SD 0.8).
Our findings were not explained by socioeconomic status, maternal smoking
during pregnancy, birth weight SD score or antenatal disorders. However, we did not
have the growth data to investigate the effects of early growth on adult body size and
composition in the ESTER study. Catch-up growth in the first years of life is more
pronounced in weight gain than in growth in length, and may lead to altered body
composition. Epidemiological life-course studies have shown that a small body size at
birth and suboptimal early growth have an effect on cardiovascular and
cardiometabolic disorders in later life (Barker et al. 2005, Eriksson et al. 2006,
101
Huxley et al. 2007, Whincup et al. 2008). In addition to neonatal medical conditions,
infant growth is usually determined by nutrition in infancy. In the Helsinki study of
Very Low Birth Weight Adults, nutrient intake in the first three weeks of life,
especially higher energy, protein and fat intake, predicted higher LBM in adulthood
(Matinolli et al. 2014). The important role of early nutrition is supported by the
results of many animal studies, in which alterations in early nutrient intake produce
considerable life-long effects on risk factors of adult obesity and cardiometabolic
conditions (Gluckman et al. 2007, Robinson & Fall 2012, Desai et al. 2013).
Unfortunately, processing of the data on early nutrient intake in the NFBC 1986 and
the ESTER study was unfinished, and we were not able to use the data in the analysis.
Lifestyle factors, such as physical activity and daily smoking, did not clarify the
picture as regards altered body composition in adults born preterm.
6.2
Resting energy expenditure (I)
Body size and composition, especially lean body mass (LBM) have an influence on
an individual’s energy expenditure: LBM explains about 60% of the variation of REE
between individuals (Johnstone et al. 2005). Low energy expenditure may lead to
obesity (Ravussin et al. 1988, Astrup et al. 1999). We found that adults born preterm
with VLBW had lower REE, but higher REE per unit lean body mass. The difference
was not explained by differences in body fat percentage, smoking, childhood
socioeconomic status or physical activity, and it seemed to be associated with VLBW
birth per se rather than any related perinatal conditions. The association between
preterm birth and later energy expenditure is not well studied. In accordance with the
results of previous studies comparing those born with low versus normal birth weight
(Eriksson et al. 2002, Kensara et al. 2006), we found that the lower REE in VLBW
adults is largely attributable to their lower LBM. Although the higher REE/LBM ratio
in VLBW adults implies that they may have more metabolically active tissue than the
controls, previous studies of organ size have suggested that the metabolically most
active organs are particularly small in VLBW adults, for example the kidneys
(Keijzer-Veen et al. 2010a) and brain (Martinussen et al. 2009, Taylor et al. 2011).
With DXA and calorimetry we were unable to distinguish whether differences in the
REE/LBM ratio are due to higher metabolic rate of some specific organs or an overall
increase in metabolic rate in adults born with VLBW.
Within the VLBW group, subjects born SGA had lower REE, but similar
REE/LBM ratios as those born AGA when adjusted for age and sex. Our finding is
consistent with that in a previous study in which children born preterm and SGA had
102
lower REE (Sepúlveda et al. 2013). Another study, however, showed that children
born preterm and SGA had lower REE/LBM ratios (Mericq et al. 2009) than their
peers born preterm and AGA. Within the VLBW group individuals born SGA and
AGA differ in the conditions experienced before birth, although they have similar
experiences after preterm birth. It is therefore possible that the long-term effects of
adverse conditions during the period after preterm birth override those related to the
conditions leading to preterm birth, such as intrauterine growth restriction. However,
this should be interpreted with caution, since the study has limited power for
subgroup analyses such as comparison of those born SGA and AGA. Nevertheless,
the fact that an early growth pattern is important is also supported by our finding that
the change in weight standard deviation score from preterm birth to term birth was not
related to REE or the REE/LBM ratio, although a higher weight attained at 40
postmenstrual weeks (term) was related to higher REE through its association with
LBM.
One possible factor affecting altered energy metabolism in adulthood might be
early nutrition. After this study, data on early nutrient intake during the first nine
weeks of life of subjects born with VLBW were collected from the hospital records
and the association between early nutrient intake and adult REE and the REE/LBM
ratio was evaluated. Nutrient intake in the first weeks of postnatal life was
substantially below current recommendations. The lower energy, protein and fat
intake was associated with lower REE but a higher REE/LBM ratio. This supports the
view included in the DOHaD hypothesis that materno-fetal undernutrition influences
the metabolic phenotype later in life so that undernutrition during early life increases
metabolic activity, resulting in more active energy metabolism in adulthood
(Matinolli et al. 2014). This might explain at least part of the difference in REE in
adults born preterm with VLBW compared with their peers born at term. In addition,
a higher REE/LBM ratio might protect adults born with VLBW from obesity, but this
might not be the case in adults born less preterm. We were not able to measure REE
in the ESTER study. To our knowledge, no investigators have measured or reported
REE in adults born moderately or late preterm.
6.3
Blood pressure (II–IV)
We have shown that early preterm birth is associated with higher levels of blood
pressure in adolescent girls and young adults. Findings in most previous studies are
similar (Pharoah et al. 1998, Irving et al. 2000, Kistner et al. 2000, Doyle et al. 2003,
Hovi et al. 2007, Rotteveel et al. 2008a, Indredavik Evensen et al. 2009, Keijzer103
Veen et al. 2010b, Vohr et al. 2010, Thomas et al. 2011). In contrast, we did not find
any statistically significant association between late preterm birth and BP. The
association has not been clear in studies that have included subjects born less preterm
(Barros & Victora 1999, Singhal et al. 2001b, Järvelin et al. 2004a, Johansson et al.
2005, Dalziel et al. 2007, Cooper et al. 2009, Lazdam et al. 2010, Rossi et al. 2011,
Skilton et al. 2011, Tauzin et al. 2014). However, we found an inverse linear
association between GA and BP, which has been shown only in a few other studies
(Siewert-Delle & Ljungman 1998, Leon et al. 2000, Järvelin et al. 2004b, Dalziel et
al. 2007). Increased BP in children and adults born preterm has also been shown in
two meta-analyses (de Jong et al. 2012, Parkinson et al. 2013).
6.3.1 Ambulatory blood pressure and variability of blood pressure
In connection with the ESTER study, we found that young adults born early preterm
have higher mean BP in ABP measurements than their peers born at term. The
difference was present when both awake and asleep, but it might be more pronounced
when awake. In previous studies the difference has been smaller, for example 2.4–4.7
mmHg higher 24-hour SBP in children and adults born preterm (Doyle et al. 2003,
Hovi et al. 2010, Keijzer-Veen et al. 2010b, Roberts et al. 2014). In contrast to
previous studies (Doyle et al. 2003, Hovi et al. 2010) and the results of a metaanalysis (Parkinson et al. 2013) with gender-specific investigation, the difference was
greater in men than in women in our study. Ambulatory measurement of BP is
considered to be a more reliable approach to assessing blood pressure, because it is
less affected by the anxiety response, but it also includes responses to environmental
and lifestyle factors, such as physical activity (Verdecchia 2000, Kamarck et al. 2002,
Clement et al. 2003).
We also found higher individual variability of ABP in early preterm adults than
in their controls. There are only a few studies that have reported variability of ABP in
former preterm individuals and the findings are parallel (Hovi et al. 2010, Gunay et
al. 2014). Variability of BP is a key factor underlying the progression of organ
damage (Parati 1987, Frattola 1993), and the triggering of vascular events (Clement et
al. 2003). It also correlates with the development of hypertensive left ventricular
hypertrophy (Parati & Valentini 2006).
104
6.3.2 Sex-specific analysis
We found higher blood pressure in adolescent girls, but not in boys compared with
their peers born at term. In contrast, in ABP measurements in young adults the
differences were larger among men born preterm. This was seen in particular for the
adults born late preterm, in contrast to previous studies concentrating on those born at
an earlier gestational age. A few studies have presented gender-specific analyses and
most of them revealed a greater difference in women than in men (Doyle et al. 2003,
Järvelin et al. 2004b, Hack et al. 2005, Cooper et al. 2009), but not all (Rotteveel et
al. 2008a, Thomas et al. 2011). Statistically significant interaction between preterm
birth and sex on blood pressure was seen in the Northern Finland Birth Cohort 1966
(Järvelin et al. 2004b) as well as in our NFBC 1986 study, but not in the ESTER
study. Most previous studies have shown that masked hypertension is more common
in men (Bobrie et al. 2008, Hänninen et al. 2011), while white-coat hypertension is
more common in women (Ben-Dov et al. 2008). However, because of a lack of
statistical power, we could not test this in our data. It is possible that the contradictory
results in sex-specific BP analyses can be in part explained by men reacting
differently to factors related to office measurement, such as psychosocial stress, and
factors captured by the 24-h recording, such as subject’s physical activity.
6.3.3 Hypertension
Adolescents born early preterm were more likely to have prehypertension and young
adults born early preterm were more likely to have office-measured or daytime
hypertension in ABP than adults born at term. However, the OR for hypertension was
not statistically significant in adults born late preterm. Although an association
between preterm birth and BP has been reported in several papers, only a few studies
have reported more manifest hypertension in adults born preterm (Johansson et al.
2005, Dalziel et al. 2007, Crump et al. 2011b). Our subjects are relatively young, and
the association between preterm birth and blood pressure could be clearer later in life.
At least the association between low birth weight and blood pressure seems to
increase with age (Law et al. 1993).
Hypertension is a major risk factor of ischemic heart disease and stroke. It is one
of the most important causes of premature death worldwide (Mendis et al. 2011) and
a leading risk factor as regards the global disease burden, accounting for 9.4 million
deaths per year worldwide (Lim et al. 2012). A 3 to 5 mmHg increase in BP has been
translated into an estimated increase in cardiovascular deaths of 25% and a 32%
105
increase in stroke (Yusuf et al. 2000, Law et al. 2003). The magnitude of increased
BP in young adults born preterm is therefore notable.
6.3.4 Possible mechanisms
Hypertension has previously been attributed to an unfavorable genotype and lifestyle,
for instance an unhealthy diet, physical inactivity, smoking and stress. However, there
is strong evidence that early life factors such as preterm birth have an influence on
increased blood pressure later in life. Our findings were not explained by
socioeconomic status, lifestyle, body size or perinatal factors such as maternal
pregnancy disorders, maternal smoking or IUGR. However, gender, parental
educational attainment and maternal hypertension during pregnancy had the greatest
and statistically significant influence on adult blood pressure in those born preterm. In
our study maternal hypertension during pregnancy was associated with about 6
mmHg higher 24-hour ambulatory SBP in young adults born preterm, but it did not
explain the whole difference in BP compared with controls born at term. It has been
suggested that there is a common genetic background to preterm birth and
hypertension that partially explains elevated BP levels in former preterm infants.
However, a large twin study has shown that the twin with lower birth weight is more
likely to have hypertension in later life (Bergvall et al. 2007), suggesting that body
size at birth is related to later blood pressure.
Renal, vascular (e.g. arterial stiffness) and central regulatory (alteration of the
hypothalamic-pituitary-adrenal axis) factors have been suggested to be involved in the
developmental programming of BP (Nuyt 2008). At the time when preterm infants are
born, nephrogenesis in the kidney is still ongoing, with the majority of nephrons
normally formed from week 20 until 34 to 36 weeks of gestation (Hinchliffe et al.
1991), so it is possible that there are changes in the structural development of the
kidney in preterm infants such as smaller kidney size (Keijzer-Veen et al. 2010a) and
lower number of nephrons (Rodriguez et al. 2004). These changes may be related to
higher BP levels in adolescents and adults born preterm.
Changes in vascular structure (Kistner et al. 2002, Lewandowski et al. 2013) and
endothelial dysfunction or arterial stiffness in adolescents and adults born preterm
(Bonamy et al. 2005, Bassareo et al. 2010, Hovi et al. 2011) have been suggested to
be related to the higher BP levels as well as changes in the HPA axis (Kajantie &
Raikkonen 2010). However, in the HeSVA, adults born preterm with VLBW had
lower HPA-axis responses (Kaseva et al. 2014b) and similar or lower norepinephrine
responses (Kaseva et al. 2014a) to psychosocial stress, arguing against a major role of
106
these systems in mediating BP levels or variability in adults born preterm (Kajantie &
Raikkonen 2010). In addition, it has been shown that BP in adulthood is affected by
maternal nutrition during pregnancy (Roseboom et al. 2001, Hult et al. 2010, Gubhaju
et al. 2011), and postnatal nutrition might also have an effect on later BP in preterm
infants (Singhal et al. 2001a). Catch-up growth, with rapid weight gain, may lead to
higher BP (Rotteveel et al. 2008b, Vohr et al. 2010). However, the specific
mechanism behind elevated BP still remains unclear.
6.4
Lipid metabolism (II, III)
Our findings concerning the association of preterm birth and lipid metabolism are
inconsistent, as they have been in previous studies (Hovi et al. 2007, Lewandowski et
al. 2013, Mathai et al. 2013, Parkinson et al. 2013). In adolescence, boys born early
preterm had higher levels of serum TC, LDL-C and ApoB than boys born at term, and
boys born late preterm had higher levels of TGs. However, we found no difference in
girls born preterm compared with girls born at term. In contrast, women born early
preterm had lower levels of HDL-C and its precursor ApoA1 than women born at
term, but we found no difference in lipid levels in men.
Several investigators have reported no association between preterm birth and
serum lipid levels in adolescence or adulthood (Irving et al. 2000, Kistner et al. 2004,
Finken et al. 2006, Rotteveel et al. 2008a, Hovi et al. 2011, Skilton et al. 2011,
Thomas et al. 2011). However, there are also studies that have shown more
atherogenic lipid profiles in former preterm infants, such as higher LDL-C and TG
levels than in their peers born at term (Lewandowski et al. 2013, Parkinson et al.
2013), lower HDL-C and higher total cholesterol concentrations, and differences in
lipid levels after a meal (Rotteveel et al. 2008a) or as assessed in detailed lipid
profiling by way of metabolomics (Hovi et al. 2013). Differences similar to those that
we found in women born early preterm compared with women born at term have not
been reported in previous studies. However, in a Finnish study, SGA subjects (mean
age 20 years) had higher serum levels of LDL-C and higher LDL-C/HDL-C ratios,
and lower HDL-C concentrations than AGA subjects. In the SGA group, total and
LDL cholesterol levels correlated inversely with adult height SD score (Salonen et al.
2010).
The unfavorable lipid profile in boys born preterm was not explained by slow
fetal growth or other antenatal factors. The difference was even stronger when boys
born SGA were excluded, but was attenuated slightly when adjusted for birth weight
SD score. This suggests that the higher rates of slow fetal growth among those born
107
preterm could in part underlie the higher plasma lipid concentrations in boys born
preterm. In addition, slow fetal growth can have similar sex-specific associations as
preterm birth as regards lipid profile later in life. Previous studies have shown malespecific association between low birth weight and serum LDL-C levels in adolescents
(Kuzawa & Adair 2003) and TC in young adults (Mogren et al. 2001). In addition,
among the general population, low birth weight is associated with elevated levels of
TC among men, but not in women in meta-analysis (Lawlor et al. 2006b). The
mechanisms behind these sex-specific differences are not known. A part of the
difference could be explained by the differences in sex hormones and body
composition between women and men. The unfavorable lipid profile in adolescent
boys born preterm was not explained by socioeconomic status measured by parental
education, lifestyle (smoking or physical activity) or pubertal stage.
The difference in HDL-C and ApoA1 levels between women born preterm and
women born at term was not explained by perinatal factors, because it remained
similar when controlled for these factors. Part of the difference, but not all, was
explained by current body size and lifestyle, because it was attenuated when adjusted
for BMI, physical activity and daily smoking.
ApoB is the primary apolipoprotein component of LDL-C and it is independently
associated with increased risk of metabolic syndrome (Onat et al. 2007, Koskinen et
al. 2012). In addition, elevated LDL-C levels in youth (at 12–18 years age) predicted
coronary artery calcification in adulthood in the Young Finns Study (Hartiala et al.
2012). Decreased HDL-C levels are one of the key factors of metabolic syndrome.
Dyslipidemias are major risk factors of ischemic heart disease and stroke, and high
total cholesterol is one of the leading risk factors as regards death and disease (Lim et
al. 2012). Our findings suggest that adolescents and adults born preterm may have
altered lipid metabolism.
6.5
Glucose regulation (II, III)
Boys born late preterm had higher fasting insulin levels and HOMA-IR values than
controls; otherwise we did not find any differences between adolescents born preterm
and controls in outcomes used to assess glucose metabolism. In adults, late preterm
birth was associated with elevated fasting and 2-hour insulin levels and HOMA-IR
values, but not with glucose levels. Studies in prepubertal children (Hofman et al.
2004, Kistner et al. 2012) and young adults (Dalziel et al. 2007, Hovi et al. 2007,
Pilgaard et al. 2010, Mathai et al. 2012) born preterm have shown lower insulin
sensitivity, as clearly indicated by intravenous (Hofman et al. 2004) and oral glucose
108
tolerance tests, and also higher fasting insulin levels (Hovi et al. 2007). Although our
subjects were born at grater gestational weeks, they had parallel adverse metabolic
characteristics associated with impaired glucose regulation as those born severely
preterm. However, the differences we found in adults were smaller than in the
Helsinki Study of Very Low Birth Weight Adults (Hovi et al. 2007).
The DOHaD theory suggests that when a fetus is developing under suboptimal
conditions, it adapts to guarantee immediate survival by preserving vital functions at
the expense of other less immediately critical functions. For example, to preserve
glucose for vital organs it induces peripheral insulin resistance, thus disturbing the
development of other organs such as the kidneys and pancreas (Hales & Barker
2001). The differences in glucose metabolism in adolescents born late preterm versus
their peers born at term was not explained by perinatal factors such as maternal
pregnancy disorders. When adjusted only for birth weight SD score, the differences
were even greater. However, the differences in glucose metabolism between adults
born preterm and controls were not statistically significant when adjusted for parental,
prenatal and lifestyle factors. A main contributing factor to impaired glucose
regulation among adults born less preterm may be increased body fat with ectopic
distribution. In contrast, in the smallest preterm individuals, a main contributing
factor to impaired glucose regulation may be low muscle mass.
Abnormally low insulin sensitivity is called insulin resistance, which means that
tissues resist the activity of insulin on a regular basis, disabling efforts to remove
glucose from the circulation. The results of various prospective epidemiological
studies across several population groups indicate that type 2 diabetes progresses over
a continuum of worsening insulin action, beginning with peripheral insulin resistance
and ending with a loss of insulin secretion (Saltiel 2000). Our subjects in both studies
were young, and as expected, few of them fulfilled the criteria of type 2 diabetes or
impaired glucose tolerance. Studies in older adults have suggested that higher rates of
type 2 diabetes occur in those born preterm (Lawlor et al. 2006a, Indredavik Evensen
et al. 2009, Kaijser et al. 2009, Kajantie et al. 2010a). In addition to type 2 diabetes,
insulin resistance predicts atherosclerosis and cardiovascular events independently of
other risk factors including fasting glucose and lipid levels (Hanley et al. 2002).
Our study shows that abnormal metabolic characteristics are already present in
young adults. Our findings, together with the results of previous studies, are
consistent with the hypothesis that preterm birth is associated with type 2 diabetes
later in life.
109
6.6
Other metabolic biomarkers (IV)
Along with the conventional components of metabolic syndrome we found
alterations in a wide range of biomarkers that reflect different underlying
pathophysiological pathways. Uric acid concentrations were over 20% higher in both
the early- and late-preterm groups than in the controls. Uric acid stimulates oxidative
stress, endothelial dysfunction, inflammation and vasoconstriction and is a wellestablished strong predictor of type 2 diabetes and cardiovascular disease,
independent of other metabolic syndrome components (Fang & Alderman 2000). We
are unaware of any previous studies reporting uric acid concentrations in adults born
preterm.
Levels of liver transaminases were also higher in adults born preterm, and the
participants with a moderate or high fatty liver index, which is a proposed marker of
non-alcoholic fatty liver disease (NAFLD) (Bedogni et al. 2006), were almost all born
preterm. Previous studies have not reported liver transaminases in adults born
preterm. NAFLD is one cause of a fatty liver, occurring when triacylglycerol-rich
lipid droplets are deposited (steatosis) in the hepatocytes without excessive alcohol
use. However, NAFLD is usually diagnosed by ultrasonographic imaging and the
fatty liver index is an estimated value used to predict NAFLD, and based on BMI,
waist circumference, triglycerides and gamma glutamate: an FLI <30 rules out and an
FLI ≥60 rules in hepatic steatosis as detected by ultrasonographic imaging (Bedogni
et al. 2006). It may not reveal all cases of non-alcoholic fatty liver disease, because
the prevalence of NAFLD in our study was relatively low, being 20–30% in Western
European countries (subjects aged 20–83 years) (Targher et al. 2010) and 18.5% in
Finnish adults (34–49 years of age) (Suomela et al. 2014), and the prevalence is
higher in obese versus normal-weight adults. However, the subjects in these studies
were older, which may explain the difference in prevalence. Liver transaminases and
non-alcoholic fatty liver disease also predict cardiometabolic disorders, although the
literature is less consistent, as they are better independent indicators of pathology
rather than general markers of metabolic syndrome (Sniderman et al. 2011, Lv et al.
2013) and strong risk factors of type 2 diabetes (Fan et al. 2007, Yun et al. 2009).
Chronic subclinical inflammation is part of metabolic syndrome (Festa et al.
2000). As for markers of inflammation, levels of blood leukocytes were higher in
those born early preterm, but the difference was not statistically significant when
adjusted for covariates. In contrast, adults born late preterm had lower levels of highsensitivity C-reactive protein when adjusted for parental, prenatal and lifestyle factors
and BMI. In addition, adults born early preterm had higher plasma albumin and urea
110
concentrations, but the difference was not statistically significant when adjusted for
parental and prenatal factors. Previous studies have shown a positive association
between serum albumin and blood pressure levels (Hostmark et al. 2005) and
metabolic syndrome (Ishizaka et al. 2007, Cho et al. 2012). However, an inverse
relationship between serum albumin concentrations and cardiovascular disease
mortality has also been reported (Phillips et al. 1989). In addition to kidney function,
the plasma urea level can be an indicator of liver function, nutrition, and plasma
volume.
6.7
Metabolic syndrome (II, III)
In addition to elevated cardiometabolic risk factors in several pathophysiological
pathways, adults born preterm were 8- to 13-fold more likely to fulfill the criteria of
metabolic syndrome. This has not been reported in other studies before. The overall
prevalence of metabolic syndrome in our study population was 6.4%; as it was 1.7–
2.4% in 16-year old adolescents in Northern Finland in 2001–2002 (Pirkola et al.
2008), and it was 10–15% in Finnish adults aged 24–39 years in 2001 and it increases
with age (Mattsson et al. 2007). As mentioned before, metabolic syndrome is a
combination of factors that multiply a person's risk of heart disease, diabetes and
stroke (Lakka et al. 2002, Onat et al. 2002). It has been suggested that as the number
of cardiovascular risk factors increases, so does the severity of asymptomatic
coronary and aortic atherosclerosis in young people (Lewandowski et al. 2014).
6.8
Limitations and strengths of the studies
The present work is based on data from three different studies (HeSVA, NFBC 1986,
the ESTER study) with a wide spectrum of outcome measurements. An important
strength of the HeSVA study population is the prospective cohort with controls
matched by age, sex and birth hospital. However, the sample size of subjects born
with VLBW or early preterm is relatively small, but still the same size or larger than
in most previous studies. The main strength of the NFBC 1986 and the ESTER
studies is the study populations, which were chosen to include the whole range of
preterm births in a specific geographic area. The participation rate in the ESTER
study was relatively low, and selection bias cannot be excluded in either of the
studies. For example, adolescents born preterm were less likely to participate in the
NFBC 1986 clinical examination at 16 years of age, and it is possible that subjects
with impairments associated with preterm birth are underrepresented. In the ESTER
111
study, there was some difference in the proportion of the late preterm and control
groups recruited through the NFBC or the FMBR, for which reason we adjusted for
the recruitment cohort. Nevertheless, detailed non-participant analysis did not raise
any major concerns as regards selection bias in any of the studies. Moreover, while
we had sufficient power for most outcomes, power was limited for more rare
outcomes, such as moderate or high fatty-liver index. In addition, the number of
subjects born early preterm was too small for detailed subgroup analysis of maternal
pregnancy disorders or other SGA vs. AGA comparisons.
The subjects of the studies were born in the 1970s and 1980s, and they are the
first generation whose gestational age at birth has been increasingly confirmed with
ultrasonographic imaging. We paid particular effort in the NFBC 1986 and ESTER
studies to determine the lengths of gestation as accurately as possible. However, the
treatment of prematurely born infants in neonatal intensive care was different in the
1970s and 1980s than it is nowadays. Nevertheless, they represent a big population
group of today’s adults that have been exposed to deviant circumstances in the
perinatal period and are now at a higher risk of developing disease. Today’s
prematurely born infants have lower rates of morbidity and mortality in childhood,
and it is possible that they have lower rates of cardiometabolic risk factors in
adulthood. However, the associations between preterm birth and later cardiometabolic
risk factors were not explained by the medical conditions and treatment in the
neonatal period. Therefore, some of these cardiometabolic risk factors might exist in
today’s infants born preterm. On the other hand, our subjects are still too young to
allow study of the association between preterm birth and manifest cardiovascular
disease, and our findings are limited to early markers of cardiovascular disease.
Nevertheless, we have shown that young adults born early preterm have more
hypertension and metabolic syndrome than their peers born at term.
Another strength of the study is the comprehensive measurement of conventional
and emerging cardiometabolic risk factors. However, not all participants underwent
calorimetry and DXA; in HeSVa the availability of ABP monitoring was limited, and
not all subjects were willing to wear the equipment in the ESTER study. Therefore,
indirect calorimetry and ABP measurement were performed in subgroups of the
original cohorts. It is possible that these subgroups were not representative of the
original cohort. Furthermore, some subjects did not wear an accelerometer, and we
could not objectively determine their awake and sleep periods. This factor may
increase inaccuracy and lead to a more conservative estimate. Moreover, some of the
confounders and intermediate factors, such as parental history of disease, medication,
112
physical activity, smoking and pubertal stage were self-reported and some missing
values exist, which may further introduce inaccuracy.
Although we adjusted for several key confounders, there is a possibility of
residual confounding. For example, we had no data to distinguish between
spontaneous and medically-indicated preterm birth. Instead, we relied on proxy
measures, such as SGA or maternal hypertension in pregnancy, that, nevertheless, are
likely to cover a major proportion of indicated preterm deliveries. These things may
have resulted in less precise estimates. In addition, we did not have data on early or
current nutrition or growth, so we were unable to assess the effect of these factors on
cardiometabolic risk in adolescence or in adulthood. Further, collider stratification
bias is possible when intermediate factors, such as BMI, physical activity and
smoking are adjusted for in regression models; this is unlikely to have had any
significant effect, as these adjustments had a negligible effect on the results.
6.9
Significance of the findings and future perspectives
Adolescents and adults born preterm, including those born late preterm, have elevated
cardiometabolic risk factors in several pathophysiological pathways, including
hypertension and metabolic syndrome, compared with their peers born at term.
Together with the results of numerous previous studies, this may indicate a later risk
of cardiometabolic disorders such as type 2 diabetes and coronary artery disease in
adults born preterm. To date, previous studies have not revealed higher prevalence of
metabolic syndrome, resting energy expenditure or elevated levels of liver
transaminases in adults born preterm. Only a handful of previous studies have
concerned ABP in adults born preterm, and those studies have focused on subjects
born preterm with VLBW, or born very or extremely preterm, and even fewer have
reported variability of blood pressure. In particular, the cardiometabolic health of
adolescents and adults born late preterm has not been well studied. Many of the risks
have dose-response relationships and these risks are increased in those born late
preterm – in the group representing the majority of individuals born preterm. Timing
of the interruption of development is important as regards later outcome. Some of the
risk factors seem to be different in adolescents and adults born late preterm versus
those born in early gestational weeks, for example a more adipose body composition
and related factors. However, more studies on the cardiometabolic health of adults
born late preterm are needed.
Despite the large amount of evidence concerning elevated cardiometabolic risk
factors in adults born preterm, most previous studies have failed to show an
113
association between preterm birth and coronary artery disease or cerebrovascular
disease, although the risks of these diseases increase throughout life. The results of
studies on elderly people cannot be easily translated to infants born in recent decades,
because of the improvements in NICUs and, for example, the nutrition of preterm
infants. In addition, preterm infants born several decades ago were less likely to
survive to adulthood – survival was more selective than it is today. Therefore, longer
follow up is needed to investigate whether or not adults born preterm and treated in
modern NICUs have more cardiometabolic diseases.
In spite of the significant number of studies in humans and animals, the
mechanisms linking preterm birth and adult diseases are still incompletely
understood, probably because the pattern is so intricate. Theory of DOHaD proposes
that circumstances in utero (e.g. mother’s nutrition, psychosocial stress, pregnancy
disorders) or during infancy (e.g. disturbed development of organs, nutrition, growth,
neonatal morbidity and treatments) may induce changes in body size and structure,
metabolism, hormone secretion and gene expression. Those experiences during
critical periods of early development may have consequences on cardiometabolic
health through a lifespan. In addition to early life factors, there are several
intermediated factors in childhood and youth that may influence to cardiometabolic
risk factors in later life such as socioeconomic status including education, physical
activity, and nutrition. The limited number of subjects in the cohorts has not allowed
investigation of the mechanisms behind the risk and protective factors. For example,
collaboration of investigators and pooled data sets might illustrate these mechanisms
and throw light on the impact of all potential confounders. It has been suggested that
some genetic determinants are associated with preterm birth as well as with
cardiovascular diseases: Women with a history of premature labor have an elevated
risk of cardiovascular disease (Robbins et al. 2014). Sibling studies may give more
information as to whether or not there is a genetic background to these elevated risk
levels (D'Onofrio et al. 2013). It would also be interesting to investigate the impact of
early nutrition and growth on our findings, and whether they can be explained by
epigenetic mechanisms (Hanson et al. 2011Hanson et al. 2011, Wehkalampi et al.
2013). Although the mechanisms are unclear, the present data support the DOHaD
theory that developmental influences have lifelong effects on cardiovascular and
metabolic function.
Most of the cardiometabolic risk factors related to preterm birth are modifiable.
Favorable early life circumstances of premature infants, such as optimal nutrition and
reduction of stress in neonatal intensive care units, might reduce the risk of later
cardiometabolic disorders. In addition, children and adults born preterm might
114
particularly benefit from primary prevention such as screening of risk factors and
promotion of a healthy lifestyle.
115
116
7
1.
2.
3.
4.
5.
6.
Conclusions
Adults born preterm show enhancement of cardiometabolic risk factors
concerning several aspects such as body size and composition, energy
metabolism, blood pressure, glucose and lipid metabolism, and some
emerging cardiometabolic risk factors. They also have a 2.5- to 4-fold greater
risk of full-blown metabolic syndrome than those born at term.
Some of the risk factors are already elevated in adolescence, for example
blood pressure in girls and LDL cholesterol and apolipoprotein B levels in
boys born before 34 weeks of gestation.
These risks are also present in the large group of young adults born late
preterm, which is consistent with a dose-response relationship between the
degree of prematurity and metabolic syndrome. However, some of the risk
factors might be different in those born late preterm, such as adipose body
composition, and lower insulin sensitivity.
Preterm birth may have a different effect as regards cardiometabolic risk
factors in females and males, for example in blood pressure and lipid
metabolism.
Most of these elevated levels of risk factors are not attributable to lower
socioeconomic status, parental history of cardiovascular disease, maternal
pregnancy disorders, birth weight SD score, current body size, or life style.
In conclusion, adolescents and adults born preterm may be at a greater risk of
developing cardiometabolic disorders in later life. Adolescents and adults
born preterm benefit from a healthy lifestyle, especially because the
cardiometabolic risk factor baseline seems to be higher than in those born at
term.
117
118
References
Alam DS, Hulshof PJM, Roordink D, Meltzer M, Yunus M, Salam MA & van Raaij JMA
(2005) Validity and reproducibility of resting metabolic rate measurements in rural
Bangladeshi women: comparison of measurements obtained by Medgem[trade] and
by Deltatrac[trade] device. Eur J Clin Nutr 59(5): 651—657.
Alberti KG, Eckel RH, Grundy SM, Zimmet PZ, Cleeman JI, Donato KA, Fruchart JC,
James WP, Loria CM, Smith SC, Jr., International Diabetes Federation Task Force on
E, Prevention, Hational Heart L, Blood I, American Heart A, World Heart F,
International Atherosclerosis S & International Association for the Study of O (2009)
Harmonizing the metabolic syndrome: a joint interim statement of the International
Diabetes Federation Task Force on Epidemiology and Prevention; National Heart,
Lung, and Blood Institute; American Heart Association; World Heart Federation;
International Atherosclerosis Society; and International Association for the Study of
Obesity. Circulation 120(16): 1640—5.
Andersen LG, Angquist L, Gamborg M, Byberg L, Bengtsson C, Canoy D, Eriksson JG,
Eriksson M, Järvelin MR, Lissner L, Nilsen TI, Osler M, Overvad K, Rasmussen F,
Salonen MK, Schack-Nielsen L, Tammelin TH, Tuomainen TP, Sørensen TI & Baker
JL (2009) Birth weight in relation to leisure time physical activity in adolescence and
adulthood: meta-analysis of results from 13 nordic cohorts. PLoS One 4(12): e8192.
Astrup A, Gotzsche PC, van de Werken K, Ranneries C, Toubro S, Raben A & Buemann
B (1999) Meta-analysis of resting metabolic rate in formerly obese subjects. Am J
Clin Nutr 69(6): 1117—22.
Barker DJ (1992) The fetal origins of adult hypertension. J Hypertens Suppl 10(7): S39—
44.
Barker DJ, Eriksson JG, Forsen T & Osmond C (2002) Fetal origins of adult disease:
strength of effects and biological basis. Int J Epidemiol 31(6): 1235—9.
Barker DJ & Osmond C (1988) Low birth weight and hypertension. British Medical
Journal 297(6641): 134–135.
Barker DJ, Osmond C, Forsen TJ, Kajantie E & Eriksson JG (2005) Trajectories of growth
among children who have coronary events as adults. N Engl J Med 353(17): 1802—9.
Barker DJ, Winter PD, Osmond C, Margetts B & Simmonds SJ (1989) Weight in infancy
and death from ischaemic heart disease. Lancet 2(8663): 577—80.
Barker DJP (2007) The origins of the developmental origins theory. Journal of Internal
Medicine 261(5): 412—417.
Barker DJP, Godfrey KM, Gluckman PD, Harding JE, Owens JA & Robinson JS (1993)
Fetal nutrition and cardiovascular disease in adult life. The Lancet 341(8850): 938—
941.
Barker DJP & Osmond C (1986) Infant mortality, childhood nutrition, and ischaemic heart
disease in England and Wales. The Lancet 327(8489): 1077—1081.
Barker DJP, Shiell AW & Law CM (2001) Growth in utero and blood pressure levels in
the next generation. Journal of Hypertension 19(1): 163—164.
119
Barros FC & Victora CG (1999) Increased blood pressure in adolescents who were small
for gestational age at birth: a cohort study in Brazil. International Journal of
Epidemiology 28(4): 676—681.
Bassareo PP, Fanos V, Puddu M, Demuru P, Cadeddu F, Balzarini M & Mercuro G (2010)
Reduced brachial flow-mediated vasodilation in young adult ex extremely low birth
weight preterm: a condition predictive of increased cardiovascular risk? Journal of
Maternal-Fetal and Neonatal Medicine 23(S3): 121—124.
Bastek JA, Sammel MD, Pare E, Srinivas SK, Posencheg MA & Elovitz MA (2008)
Adverse neonatal outcomes: examining the risks between preterm, late preterm, and
term infants. Am J Obstet Gynecol 199(4): 367 e1—8.
Bedogni G, Bellentani S, Miglioli L, Masutti F, Passalacqua M, Castiglione A & Tiribelli
C (2006) The Fatty Liver Index: a simple and accurate predictor of hepatic steatosis in
the general population. BMC Gastroenterol 6: 33.
Bedogni G, Malavolti M, Severi S, Poli M, Mussi C, Fantuzzi AL & Battistini N (2002)
Accuracy of an eight-point tactile-electrode impedance method in the assessment of
total body water. Eur J Clin Nutr 56(11): 1143—8.
Ben-Dov IZ, Mekler J & Bursztyn M (2008) Sex Differences in Ambulatory Blood
Pressure Monitoring. The American Journal of Medicine 121(6): 509—514.
Bergvall N, Iliadou A, Johansson S, de Faire U, Kramer MS, Pawitan Y, Pedersen NL,
Lichtenstein P & Cnattingius S (2007) Genetic and Shared Environmental Factors Do
Not Confound the Association Between Birth Weight and Hypertension: A Study
Among Swedish Twins. Circulation 115(23): 2931—2938.
Bezold KY, Karjalainen MK, Hallman M, Teramo K & Muglia LJ (2013) The genomics of
preterm birth: from animal models to human studies. Genome Med 5(4): 34.
Bird TM, Bronstein JM, Hall RW, Lowery CL, Nugent R & Mays GP (2010) Late Preterm
Infants: Birth Outcomes and Health Care Utilization in the First Year. Pediatrics
126(2): e311—e319.
Blencowe H, Cousens S, Oestergaard MZ, Chou D, Moller A-B, Narwal R, Adler A, Vera
Garcia C, Rohde S, Say L & Lawn JE (2012) National, regional, and worldwide
estimates of preterm birth rates in the year 2010 with time trends since 1990 for
selected countries: a systematic analysis and implications. The Lancet 379(9832):
2162—2172.
Bobrie G, Clerson P, Menard J, Postel-Vinay N, Chatellier G & Plouin PF (2008) Masked
hypertension: a systematic review. J Hypertens 26(9): 1715—25.
Bolanowski M & Nilsson BE (2001) Assessment of human body composition using dualenergy x-ray absorptiometry and bioelectrical impedance analysis. Med Sci Monit
7(5): 1029—33.
Bonamy A-KE, Bendito A, Martin H, Andolf E, Sedin G & Norman M (2005) Preterm
Birth Contributes to Increased Vascular Resistance and Higher Blood Pressure in
Adolescent Girls. Pediatr Res 58(5): 845—849.
Breukhoven PE, Kerkhof GF, Willemsen RH & Hokken-Koelega AC (2012) Fat mass and
lipid profile in young adults born preterm. J Clin Endocrinol Metab 97(4): 1294—302.
120
Castro J, El-Atat F, McFarlane S, Aneja A & Sowers J (2003) Cardiometabolic syndrome:
Pathophysiology and treatment. Current Hypertension Reports 5(5): 393—401.
Cho HM, Kim HC, Lee JM, Oh SM, Choi DP & Suh I (2012) The association between
serum albumin levels and metabolic syndrome in a rural population of Korea. J Prev
Med Public Health 45(2): 98—104.
Clement DL, De Buyzere ML, De Bacquer DA, de Leeuw PW, Duprez DA, Fagard RH,
Gheeraert PJ, Missault LH, Braun JJ, Six RO, Van Der Niepen P & O'Brien E (2003)
Prognostic Value of Ambulatory Blood-Pressure Recordings in Patients with Treated
Hypertension. New England Journal of Medicine 348(24): 2407—2415.
Committee on Obstetric P (2008) ACOG committee opinion No. 404 April 2008. Latepreterm infants. Obstet Gynecol 111(4): 1029—32.
Committee on Practice Bulletins—Obstetrics (2012) Practice Bulletin No. 127:
Management of Preterm Labor. Obstetrics & Gynecology 119(6): 1308—1317
10.1097/AOG.0b013e31825af2f0.
Compher C, Frankenfield D, Keim N & Roth-Yousey L (2006) Best practice methods to
apply to measurement of resting metabolic rate in adults: a systematic review. J Am
Diet Assoc 106(6): 881—903.
Cooper R, Atherton K & Power C (2009) Gestational age and risk factors for
cardiovascular disease: evidence from the 1958 British birth cohort followed to midlife. Int J Epidemiol 38(1): 235—44.
Cruickshank MN, Oshlack A, Theda C, Davis PG, Martino D, Sheehan P, Dai Y, Saffery
R, Doyle LW & Craig JM (2013) Analysis of epigenetic changes in survivors of
preterm birth reveals the effect of gestational age and evidence for a long term legacy.
Genome Med 5(10): 96.
Crump C SKSJWMA (2011) Gestational age at birth and mortality in young adulthood.
JAMA 306(11): 1233—1240.
Crump C, Winkleby MA, Sundquist K & Sundquist J (2011a) Risk of diabetes among
young adults born preterm in Sweden. Diabetes Care 34(5): 1109—13.
Crump C, Winkleby MA, Sundquist K & Sundquist J (2011b) Risk of Hypertension
Among Young Adults Who Were Born Preterm: A Swedish National Study of
636,000 Births. American Journal of Epidemiology 173(7): 797—803.
D'Onofrio BM, Class QA, Rickert ME, Larsson H, Langstrom N & Lichtenstein P (2013)
Preterm birth and mortality and morbidity: a population-based quasi-experimental
study. JAMA Psychiatry 70(11): 1231—40.
Dalziel SR, Parag V, Rodgers A & Harding JE (2007) Cardiovascular risk factors at age 30
following pre-term birth. International Journal of Epidemiology 36(4): 907—915.
Danesh J, Collins R, Appleby P & Peto R (1998) Association of fibrinogen, c-reactive
protein, albumin, or leukocyte count with coronary heart disease: Meta-analyses of
prospective studies. JAMA 279(18): 1477—1482.
de Jong F, Monuteaux MC, van Elburg RM, Gillman MW & Belfort MB (2012)
Systematic Review and Meta-Analysis of Preterm Birth and Later Systolic Blood
Pressure. Hypertension 59(2): 226—234.
121
Desai M, Beall M & Ross M (2013) Developmental Origins of Obesity: Programmed
Adipogenesis. Current Diabetes Reports 13(1): 27—33.
Doyle LW, Faber B, Callanan C & Morley R (2003) Blood pressure in late adolescence
and very low birth weight. Pediatrics 111(2): 252—7.
Dulloo AG & Jacquet J (1998) Adaptive reduction in basal metabolic rate in response to
food deprivation in humans: a role for feedback signals from fat stores. Am J Clin
Nutr 68(3): 599—606.
Engle WA, Tomashek KM, Wallman C, and the Committee on F & Newborn (2007)
"Late-Preterm" Infants: A Population at Risk. Pediatrics 120(6): 1390—1401.
Eriksson J, Forsen T, Tuomilehto J, Osmond C & Barker D (2002) Size at birth, fat-free
mass and resting metabolic rate in adult life. Horm Metab Res 34(2): 72—6.
Eriksson JG, Osmond C, Kajantie E, Forsen TJ & Barker DJ (2006) Patterns of growth
among children who later develop type 2 diabetes or its risk factors. Diabetologia
49(12): 2853—8.
EUROCAT E-PPwSa (2013) European Perinatal Health Report. The health and care of
pregnant women and babies in Europe in 2010.
Fan J-G, Li F, Cai X-B, Peng Y-D, Ao Q-H & Gao Y (2007) Effects of nonalcoholic fatty
liver disease on the development of metabolic disorders. Journal of Gastroenterology
and Hepatology 22(7): 1086—1091.
Fang J & Alderman MH (2000) Serum uric acid and cardiovascular mortality the
NHANES I epidemiologic follow-up study, 1971—1992. National Health and
Nutrition Examination Survey. JAMA 283(18): 2404—10.
Festa A, D’Agostino R, Howard G, Mykkänen L, Tracy RP & Haffner SM (2000) Chronic
Subclinical Inflammation as Part of the Insulin Resistance Syndrome: The Insulin
Resistance Atherosclerosis Study (IRAS). Circulation 102(1): 42—47.
Finken MJJ, Inderson A, Van Montfoort N, Keijzer—Veen MG, van Weert AWM, Carfil
N, Frolich M, Hille ETM, Romijn JA, Dekker FW & Wit JM (2006) Lipid Profile and
Carotid Intima-Media Thickness in a Prospective Cohort of Very Preterm Subjects at
Age 19 Years: Effects of Early Growth and Current Body Composition. Pediatr Res
59(4 Part 1): 604—609.
Flacking R, Lehtonen L, Thomson G, Axelin A, Ahlqvist S, Moran VH, Ewald U, Dykes F
& the Sg (2012) Closeness and separation in neonatal intensive care. Acta Paediatrica
101(10): 1032—1037.
Forsen T, Eriksson JG, Tuomilehto J, Teramo K, Osmond C & Barker DJ (1997) Mother's
weight in pregnancy and coronary heart disease in a cohort of Finnish men: follow up
study. BMJ 315(7112): 837—40.
Frattola AP, G; Cuspidi, C; Albini, F; Mancia, G (1993) Prognostic value of 24-hour blood
pressure variability. J Hypertens 11(10): 1133—7.
Gallagher D, Visser M, Sepulveda D, Pierson RN, Harris T & Heymsfield SB (1996) How
useful is body mass index for comparison of body fatness across age, sex, and ethnic
groups? Am J Epidemiol 143(3): 228—39.
122
Gibson AL, Holmes JC, Desautels RL, Edmonds LB & Nuudi L (2008) Ability of new
octapolar bioimpedance spectroscopy analyzers to predict 4-component-model
percentage body fat in Hispanic, black, and white adults. Am J Clin Nutr 87(2): 332—
8.
Gillman MW (2005) Developmental Origins of Health and Disease. New England Journal
of Medicine 353(17): 1848—1850.
Glickman SG, Marn CS, Supiano MA & Dengel DR (2004) Validity and reliability of
dual-energy X-ray absorptiometry for the assessment of abdominal adiposity. Journal
of Applied Physiology 97(2): 509—514.
Gluckman PD, Lillycrop KA, Vickers MH, Pleasants AB, Phillips ES, Beedle AS, Burdge
GC & Hanson MA (2007) Metabolic plasticity during mammalian development is
directionally dependent on early nutritional status. Proc Natl Acad Sci U S A 104(31):
12796—800.
Goldenberg RL, Culhane JF, Iams JD & Romero R (2008) Epidemiology and causes of
preterm birth. The Lancet 371(9606): 75—84.
Govindarajan G, Whaley-Connell A, Mugo M, Stump C & Sowers JR (2005) The
Cardiometabolic Syndrome as a Cardiovascular Risk Factor. The American Journal of
the Medical Sciences 330(6): 311—318.
Gubhaju L, Sutherland MR & Black MJ (2011) Preterm Birth and the Kidney:
Implications for Long-Term Renal Health. Reproductive Sciences 18(4): 322—333.
Gunay F, Alpay H, Gokce I & Bilgen H (2014) Is late-preterm birth a risk factor for
hypertension in childhood? European Journal of Pediatrics 173(6): 751—756.
Haarbo J, Gotfredsen A, Hassager C & Christiansen C (1991) Validation of body
composition by dual energy X-ray absorptiometry (DEXA). Clinical Physiology 11(4):
331—341.
Haataja R, Karjalainen MK, Luukkonen A, Teramo K, Puttonen H, Ojaniemi M, Varilo T,
Chaudhari BP, Plunkett J, Murray JC, McCarroll SA, Peltonen L, Muglia LJ, Palotie
A & Hallman M (2011) Mapping a new spontaneous preterm birth susceptibility gene,
IGF1R, using linkage, haplotype sharing, and association analysis. PLoS Genet 7(2):
e1001293.
Hack M, Cartar L, Schluchter M, Klein N & Forrest CB (2007) Self-perceived health,
functioning and well-being of very low birth weight infants at age 20 years. J Pediatr
151(6): 635—41, 641 e1—2.
Hack M, Flannery DJ, Schluchter M, Cartar L, Borawski E & Klein N (2002) Outcomes in
Young Adulthood for Very-Low-Birth-Weight Infants. New England Journal of
Medicine 346(3): 149—157.
Hack M, Schluchter M, Cartar L & Rahman M (2005) Blood pressure among very low
birth weight (<1.5 kg) young adults. Pediatr Res 58(4): 677—84.
Hack M, Schluchter M, Cartar L, Rahman M, Cuttler L & Borawski E (2003) Growth of
very low birth weight infants to age 20 years. Pediatrics 112(1 Pt 1): e30—8.
Hadlock FP, Harrist RB & Martinez-Poyer J (1991) In utero analysis of fetal growth: a
sonographic weight standard. Radiology 181(1): 129—33.
123
Hales CN, Barker DJ, Clark PM, Cox LJ, Fall C, Osmond C & Winter PD (1991) Fetal and
infant growth and impaired glucose tolerance at age 64. BMJ 303(6809): 1019—22.
Hales CN & Barker DJP (2001) The thrifty phenotype hypothesis: Type 2 diabetes. British
Medical Bulletin 60(1): 5—20.
Hanley AJG, Williams K, Stern MP & Haffner SM (2002) Homeostasis Model
Assessment of Insulin Resistance in Relation to the Incidence of Cardiovascular
Disease: The San Antonio Heart Study. Diabetes Care 25(7): 1177—1184.
Hanson M, Godfrey KM, Lillycrop KA, Burdge GC & Gluckman PD (2011)
Developmental plasticity and developmental origins of non-communicable disease:
theoretical considerations and epigenetic mechanisms. Prog Biophys Mol Biol 106(1):
272—80.
Harder T, Rodekamp E, Schellong K, Dudenhausen JW & Plagemann A (2007) Birth
Weight and Subsequent Risk of Type 2 Diabetes: A Meta-Analysis. American Journal
of Epidemiology 165(8): 849—857.
Hartiala O, Magnussen CG, Kajander S, Knuuti J, Ukkonen H, Saraste A, Rinta-Kiikka I,
Kainulainen S, Kähönen M, Hutri-Kähönen N, Laitinen T, Lehtimäki T, Viikari JSA,
Hartiala J, Juonala M & Raitakari OT (2012) Adolescence Risk Factors Are Predictive
of Coronary Artery Calcification at Middle Age: The Cardiovascular Risk in Young
Finns Study. Journal of the American College of Cardiology 60(15): 1364—1370.
Heymsfield SB, Gallagher D, Kotler DP, Wang Z, Allison DB & Heshka S (2002) Bodysize dependence of resting energy expenditure can be attributed to nonenergetic
homogeneity of fat-free mass. Am J Physiol Endocrinol Metab 282(1): E132—138.
Hinchliffe SA, Sargent PH, Howard CV, Chan YF & Vanvelzen D (1991) Human
intrauterine renal growth expressed in absolute number of glomeruli assessed by the
disector method and Cavalieri principle. Laboratory Investigation 64(6): 777—784.
Hofman P, Regan F, Jackson W, Jefferies C, Knight D, Robinson E & Cutfield W (2004)
Premature Birth and Later Insulin Resistance. N Engl J Med 351(21): 2179—2186.
Hostmark AT, Tomten SE & Berg JE (2005) Serum albumin and blood pressure: a
population-based, cross-sectional study. J Hypertens 23(4): 725—30.
Hovi P (2011) Preterm Birth and Risk Factors for Chronic Disease — The Helsinki Study
of Very Low Birth Weight Adults. MD thesis. University of Helsinki, Children's
hospital.
Hovi P, Andersson S, Eriksson JG, Järvenpää AL, Strang-Karlsson S, Mäkitie O &
Kajantie E (2007) Glucose regulation in young adults with very low birth weight. N
Engl J Med 356(20): 2053—63.
Hovi P, Andersson S, Järvenpää AL, Eriksson JG, Strang-Karlsson S, Kajantie E &
Mäkitie O (2009) Decreased bone mineral density in adults born with very low birth
weight: a cohort study. PLoS Med 6(8): e1000135.
Hovi P, Andersson S, Räikkönen K, Strang-Karlsson S, Järvenpää AL, Eriksson JG,
Pesonen AK, Heinonen K, Pyhälä R & Kajantie E (2010) Ambulatory blood pressure
in young adults with very low birth weight. J Pediatr 156(1): 54—59 e1.
124
Hovi P, Kajantie E, Soininen P, Kangas A, Järvenpää A-L, Andersson S, Eriksson J, AlaKorpela M & Wehkalampi K (2013) Lipoprotein subclass profiles in young adults
born preterm at very low birth weight. Lipids in Health and Disease 12(1): 57.
Hovi P, Turanlahti M, Strang-Karlsson S, Wehkalampi K, Jarvenpaa A-L, Eriksson JG,
Kajantie E & Andersson S (2011) Intima-Media Thickness and Flow-Mediated
Dilatation in the Helsinki Study of Very Low Birth Weight Adults. Pediatrics:
peds.2010—2199.
Hult M, Tornhammar P, Ueda P, Chima C, Bonamy AK, Ozumba B & Norman M (2010)
Hypertension, diabetes and overweight: looming legacies of the Biafran famine. PLoS
One 5(10): e13582.
Huxley R, Owen CG, Whincup PH, Cook DG, Rich-Edwards J, Smith GD & Collins R
(2007) Is birth weight a risk factor for ischemic heart disease in later life? Am J Clin
Nutr 85(5): 1244—50.
Huxley RR, Shiell AW & Law CM (2000) The role of size at birth and postnatal catch-up
growth in determining systolic blood pressure: a systematic review of the literature. J
Hypertens 18(7): 815—31.
Hänninen M-RA, Niiranen TJ, Puukka PJ, Mattila AK & Jula AM (2011) Determinants of
masked hypertension in the general population: the Finn-Home study. Journal of
Hypertension 29(10): 1880—1888 10.1097/HJH.0b013e32834a98ba.
Indredavik Evensen KA, Steinshamn S, Tjønna AE, Stølen T, Høydal MA, Wisløff U,
Brubakk A-M & Vik T (2009) Effects of preterm birth and fetal growth retardation on
cardiovascular risk factors in young adulthood. Early Hum Dev 85(4): 239—245.
Ioannou C, Talbot K, Ohuma E, Sarris I, Villar J, Conde-Agudelo A & Papageorghiou AT
(2012) Systematic review of methodology used in ultrasound studies aimed at creating
charts of fetal size. BJOG 119(12): 1425—39.
Irving RJ, Belton NR, Elton RA & Walker BR (2000) Adult cardiovascular risk factors in
premature babies. Lancet 355(9221): 2135—6.
Ishizaka N, Ishizaka Y, Nagai R, Toda E-I, Hashimoto H & Yamakado M (2007)
Association between serum albumin, carotid atherosclerosis, and metabolic syndrome
in Japanese individuals. Atherosclerosis 193(2): 373—379.
Johansson S, Iliadou A, Bergvall N, Tuvemo T, Norman M & Cnattingius S (2005) Risk of
high blood pressure among young men increases with the degree of immaturity at
birth. Circulation 112(22): 3430—6.
Johnstone AM, Murison SD, Duncan JS, Rance KA & Speakman JR (2005) Factors
influencing variation in basal metabolic rate include fat-free mass, fat mass, age, and
circulating thyroxine but not sex, circulating leptin, or triiodothyronine. The American
Journal of Clinical Nutrition 82(5): 941—948.
Juonala M, Magnussen CG, Berenson GS, Venn A, Burns TL, Sabin MA, Srinivasan SR,
Daniels SR, Davis PH, Chen W, Sun C, Cheung M, Viikari JSA, Dwyer T & Raitakari
OT (2011) Childhood Adiposity, Adult Adiposity, and Cardiovascular Risk Factors.
New England Journal of Medicine 365(20): 1876—1885.
125
Järvelin M-R, Sovio U, King V, Lauren L, Xu B, McCarthy MI, Hartikainen A-L, Laitinen
J, Zitting P, Rantakallio P & Elliott P (2004a) Early Life Factors and Blood Pressure
at Age 31 Years in the 1966 Northern Finland Birth Cohort. Hypertension 44(6):
838—846.
Järvelin MR, Hartikainen-Sorri A-L & Rantakallio P (1993a) Labour induction policy in
hospitals of different levels of specialisation. BJOG: An International Journal of
Obstetrics & Gynaecology 100(4): 310—315.
Järvelin MR, Hartikainen-Sorri AL & Rantakallio P (1993b) Labour induction policy in
hospitals of different levels of specialisation. Br J Obstet Gynaecol 100(4): 310—5.
Järvelin MR, Sovio U, King V, Lauren L, Xu B, McCarthy MI, Hartikainen AL, Laitinen J,
Zitting P, Rantakallio P & Elliott P (2004b) Early life factors and blood pressure at
age 31 years in the 1966 northern Finland birth cohort. Hypertension 44(6): 838-46.
Järvenpää AL & Granström ML (1987) Keskosen kehitys, seuranta ja ennuste [The
development, follow-up and prognosis of the preterm infant]. Duodecim 103: 1238—
1246.
Järvisalo MJ, Jartti L, Näntö-Salonen K, Irjala K, Rännemaa T, Hartiala JJ, Celermajer DS
& Raitakari OT (2001) Increased Aortic Intima-Media Thickness: A Marker of
Preclinical Atherosclerosis in High-Risk Children. Circulation 104(24): 2943—2947.
Jørgensen JOL, Vahl N, Dall R & Christiansen JS (1998) Resting metabolic rate in healthy
adults: Relation to growth hormone status and leptin levels. Metabolism 47(9): 11341139.
Kaijser M, Bonamy A-KE, Akre O, Cnattingius S, Granath F, Norman M & Ekbom A
(2008) Perinatal Risk Factors for Ischemic Heart Disease: Disentangling the Roles of
Birth Weight and Preterm Birth. Circulation 117(3): 405—410.
Kaijser M, Edstedt Bonamy A-K, Akre O, Cnattingius S, Granath F, Norman M & Ekbom
A (2009) Perinatal Risk Factors for Diabetes in Later Life. Diabetes 58(3): 523—526.
Kajantie E, Osmond C, Barker DJP & Eriksson JG (2010a) Preterm Birth A Risk Factor
for Type 2 Diabetes? Diabetes Care 33(12): 2623—2625.
Kajantie E & Raikkonen K (2010) Early life predictors of the physiological stress response
later in life. Neurosci Biobehav Rev 35(1): 23—32.
Kajantie E, Strang-Karlsson S, Hovi P, Räikkönen K, Pesonen AK, Heinonen K, Järvenpää
AL, Eriksson JG & Andersson S (2010b) Adults Born at Very Low Birth Weight
Exercise Less than Their Peers Born at Term. J Pediatr.
Kajantie E, Strang-Karlsson S, Hovi P, Wehkalampi K, Lahti J, Kaseva N, Järvenpää A-L,
Räikkönen K, Eriksson JG & Andersson S (2014) Insulin Sensitivity and Secretory
Response in Adults Born Preterm – the Helsinki Study of Very Low Birth Weight
Adults. The Journal of Clinical Endocrinology & Metabolism 0(0): jc.2014—3184.
Kamarck TW, Janicki DL, Shiffman S, Polk DE, Muldoon MF, Liebenauer LL &
Schwartz JE (2002) Psychosocial demands and ambulatory blood pressure: a field
assessment approach. Physiol Behav 77(4—5): 699—704.
126
Kaseva N, Pyhala R, Wehkalampi K, Feldt K, Pesonen AK, Heinonen K, Hovi P,
Jarvenpaa AL, Eriksson JG, Andersson S, Raikkonen K & Kajantie E (2014a)
Epinephrine, norepinephrine and heart rate responses to psychosocial stress in young
adults born preterm at very low birth weight. Clin Endocrinol (Oxf) Aug;81(2): 231—
7.
Kaseva N, Wehkalampi K, Hemio K, Hovi P, Jarvenpaa AL, Andersson S, Eriksson JG,
Lindstrom J & Kajantie E (2013) Diet and nutrient intake in young adults born
preterm at very low birth weight. J Pediatr 163(1): 43—8.
Kaseva N, Wehkalampi K, Pyhala R, Moltchanova E, Feldt K, Pesonen AK, Heinonen K,
Hovi P, Jarvenpaa AL, Andersson S, Eriksson JG, Raikkonen K & Kajantie E (2014b)
Blunted hypothalamic-pituitary-adrenal axis and insulin response to psychosocial
stress in young adults born preterm at very low birth weight. Clin Endocrinol (Oxf)
80(1): 101—6.
Kaseva N, Wehkalampi K, Strang-Karlsson S, Salonen M, Pesonen AK, Raikkonen K,
Tammelin T, Hovi P, Lahti J, Heinonen K, Jarvenpaa AL, Andersson S, Eriksson JG
& Kajantie E (2012) Lower conditioning leisure-time physical activity in young adults
born preterm at very low birth weight. PLoS One 7(2): e32430.
Keijzer-Veen MG, Devos AS, Meradji M, Dekker FW, Nauta J & van der Heijden BJ
(2010a) Reduced renal length and volume 20 years after very preterm birth. Pediatr
Nephrol 25(3): 499—507.
Keijzer-Veen MG, Dulger A, Dekker FW, Nauta J & van der Heijden BJ (2010b) Very
preterm birth is a risk factor for increased systolic blood pressure at a young adult age.
Pediatr Nephrol 25(3): 509—16.
Kensara OA, Wooton SA, Phillips DI, Patel M, Hoffman DJ, Jackson AA & Elia M (2006)
Substrate-energy metabolism and metabolic risk factors for cardiovascular disease in
relation to fetal growth and adult body composition. Am J Physiol Endocrinol Metab
291(2): E365—71.
Kerkhof GF, Breukhoven PE, Leunissen RW, Willemsen RH & Hokken-Koelega AC
(2012) Does preterm birth influence cardiovascular risk in early adulthood? J Pediatr
161(3): 390—396 e1.
Kistner A, Celsi G, Vanpee M & Jacobson SH (2000) Increased blood pressure but normal
renal function in adult women born preterm. Pediatric Nephrology 15(3): 215-220.
Kistner A, Jacobson L, Jacobson SH, Svensson E & Hellstrom A (2002) Low Gestational
Age Associated with Abnormal Retinal Vascularization and Increased Blood Pressure
in Adult Women. Pediatr Res 51(6): 675—680.
Kistner A, Jacobson SH, Celsi G, Vanpee M & Brismar K (2004) IGFBP-1 levels in adult
women born small for gestational age suggest insulin resistance in spite of normal
BMI. J Intern Med 255(1): 82—8.
Kistner A, Rakow A, Legnevall L, Marchini G, Brismar K, Hall K & Vanpee M (2012)
Differences in insulin resistance markers between children born small for gestational
age or born preterm appropriate for gestational age. Acta Paediatr 101(12): 1217—24.
Kopelman PG (2000) Obesity as a medical problem. Nature 404(6778): 635—643.
127
Korvenranta E, Lehtonen L, Rautava L, Hakkinen U, Andersson S, Gissler M, Hallman M,
Leipala J, Peltola M, Tammela O, Linna M & Group PPIS (2010) Impact of very
preterm birth on health care costs at five years of age. Pediatrics 125(5): e1109—14.
Koskinen J, Kähönen M, Viikari JSA, Taittonen L, Laitinen T, Rönnemaa T, Lehtimäki T,
Hutri-Kähönen N, Pietikäinen M, Jokinen E, Helenius H, Mattsson N, Raitakari OT &
Juonala M (2009) Conventional Cardiovascular Risk Factors and Metabolic Syndrome
in Predicting Carotid Intima-Media Thickness Progression in Young Adults: The
Cardiovascular Risk in Young Finns Study. Circulation 120(3): 229—236.
Koskinen J, Magnussen CG, Sabin MA, Kahonen M, Hutri-Kahonen N, Laitinen T,
Taittonen L, Jokinen E, Lehtimaki T, Viikari JS, Raitakari OT & Juonala M (2014)
Youth overweight and metabolic disturbances in predicting carotid intima-media
thickness, type 2 diabetes, and metabolic syndrome in adulthood: the Cardiovascular
Risk in Young Finns study. Diabetes Care 37(7): 1870—7.
Koskinen J, Magnussen CG, Wurtz P, Soininen P, Kangas AJ, Viikari JS, Kahonen M, Loo
BM, Jula A, Ahotupa M, Lehtimaki T, Ala-Korpela M, Juonala M & Raitakari OT
(2012) Apolipoprotein B, oxidized low-density lipoprotein, and LDL particle size in
predicting the incidence of metabolic syndrome: the Cardiovascular Risk in Young
Finns study. Eur J Prev Cardiol 19(6): 1296—303.
Koupil I, Leon DA & Lithell HO (2005) Length of gestation is associated with mortality
from cerebrovascular disease. Journal of Epidemiology and Community Health 59(6):
473—474.
Kugelman A & Colin AA (2013) Late Preterm Infants: Near Term But Still in a Critical
Developmental Time Period. Pediatrics 132(4): 741—751.
Kuzawa CW & Adair LS (2003) Lipid profiles in adolescent Filipinos: relation to birth
weight and maternal energy status during pregnancy. The American Journal of
Clinical Nutrition 77(4): 960—966.
Lakka HM, Laaksonen DE, Lakka TA, Niskanen LK, Kumpusalo E, Tuomilehto J &
Salonen JT (2002) The metabolic syndrome and total and cardiovascular disease
mortality in middle-aged men. JAMA 288(21): 2709—16.
Lammi N, Blomstedt PA, Moltchanova E, Eriksson JG, Tuomilehto J & Karvonen M
(2009) Perinatal risk factors in young adult-onset type 1 and type 2 diabetes – a
population-based case-control study. Acta Obstetricia et Gynecologica Scandinavica
88(4): 468—474.
Law CM, de Swiet M, Osmond C, Fayers PM, Barker DJ, Cruddas AM & Fall CH (1993)
Initiation of hypertension in utero and its amplification throughout life.
Law CM & Shiell AW (1996) Is blood pressure inversely related to birth weight? The
strength of evidence from a systematic review of the literature. Journal of
Hypertension 14(8): 935—942.
Law M, Wald N & Morris J (2003) Lowering blood pressure to prevent myocardial
infarction and stroke: a new preventive strategy. Health Technol Assess 7(31): 1—94.
Lawlor DA, Davey Smith G, Clark H & Leon DA (2006a) The associations of birthweight,
gestational age and childhood BMI with type 2 diabetes: findings from the Aberdeen
Children of the 1950s cohort. Diabetologia 49(11): 2614—2617.
128
Lawlor DA, Owen CG, Davies AA, Whincup PH, Ebrahim S, Cook DG & Davey Smith G
(2006b) Sex Differences in the Association Between Birth Weight and Total
Cholesterol. A Meta-Analysis. Annals of Epidemiology 16(1): 19—25.
Lawn JE, Mwansa-Kambafwile J, Horta BL, Barros FC & Cousens S (2010) ‘Kangaroo
mother care’ to prevent neonatal deaths due to preterm birth complications.
International Journal of Epidemiology 39(suppl 1): i144—i154.
Lazdam M, de la Horra A, Pitcher A, Mannie Z, Diesch J, Trevitt C, Kylintireas I,
Contractor H, Singhal A, Lucas A, Neubauer S, Kharbanda R, Alp N, Kelly B &
Leeson P (2010) Elevated Blood Pressure in Offspring Born Premature to
Hypertensive Pregnancy: Is Endothelial Dysfunction the Underlying Vascular
Mechanism? Hypertension 56(1): 159—165.
Lee PA, Chernausek SD, Hokken-Koelega ACS, Czernichow P & Board ftISA (2003)
International Small for Gestational Age Advisory Board Consensus Development
Conference Statement: Management of Short Children Born Small for Gestational
Age, April 24–October 1, 2001. Pediatrics 111(6): 1253—1261.
Leon DA, Johansson M & Rasmussen F (2000) Gestational age and growth rate of fetal
mass are inversely associated with systolic blood pressure in young adults: an
epidemiologic study of 165,136 Swedish men aged 18 years. Am J Epidemiol 152(7):
597—604.
Lewandowski AJ, Augustine D, Lamata P, Davis EF, Lazdam M, Francis J, McCormick K,
Wilkinson AR, Singhal A, Lucas A, Smith NP, Neubauer S & Leeson P (2013)
Preterm Heart in Adult Life: Cardiovascular Magnetic Resonance Reveals Distinct
Differences in Left Ventricular Mass, Geometry, and Function. Circulation 127(2):
197—206.
Lewandowski AJ, Davis EF, Yu G, Digby JE, Boardman H, Whitworth P, Singhal A,
Lucas A, McCormick K, Shore AC & Leeson P (2014) Elevated Blood Pressure in
Preterm-Born Offspring Associates With a Distinct Antiangiogenic State and
Microvascular Abnormalities in Adult Life. Hypertension. 2015 Mar;65(3):607—14.
Levine JA (2004) Nonexercise activity thermogenesis (NEAT): environment and biology.
Lim SS, Vos T, Flaxman AD, Danaei G, Shibuya K, Adair-Rohani H, Amann M,
Anderson HR, Andrews KG, Aryee M, Atkinson C, Bacchus LJ, Bahalim AN,
Balakrishnan K, Balmes J, Barker-Collo S, Baxter A, Bell ML, Blore JD, Blyth F,
Bonner C, Borges G, Bourne R, Boussinesq M, Brauer M, Brooks P, Bruce NG,
Brunekreef B, Bryan-Hancock C, Bucello C, Buchbinder R, Bull F, Burnett RT, Byers
TE, Calabria B, Carapetis J, Carnahan E, Chafe Z, Charlson F, Chen H, Chen JS,
Cheng AT, Child JC, Cohen A, Colson KE, Cowie BC, Darby S, Darling S, Davis A,
Degenhardt L, Dentener F, Des Jarlais DC, Devries K, Dherani M, Ding EL, Dorsey
ER, Driscoll T, Edmond K, Ali SE, Engell RE, Erwin PJ, Fahimi S, Falder G,
Farzadfar F, Ferrari A, Finucane MM, Flaxman S, Fowkes FG, Freedman G, Freeman
MK, Gakidou E, Ghosh S, Giovannucci E, Gmel G, Graham K, Grainger R, Grant B,
Gunnell D, Gutierrez HR, Hall W, Hoek HW, Hogan A, Hosgood HD, 3rd, Hoy D,
Hu H, Hubbell BJ, Hutchings SJ, Ibeanusi SE, Jacklyn GL, Jasrasaria R, Jonas JB,
Kan H, Kanis JA, Kassebaum N, Kawakami N, Khang YH, Khatibzadeh S, Khoo JP,
129
Kok C, Laden F, Lalloo R, Lan Q, Lathlean T, Leasher JL, Leigh J, Li Y, Lin JK,
Lipshultz SE, London S, Lozano R, Lu Y, Mak J, Malekzadeh R, Mallinger L,
Marcenes W, March L, Marks R, Martin R, McGale P, McGrath J, Mehta S, Mensah
GA, Merriman TR, Micha R, Michaud C, Mishra V, Hanafiah KM, Mokdad AA,
Morawska L, Mozaffarian D, Murphy T, Naghavi M, Neal B, Nelson PK, Nolla JM,
Norman R, Olives C, Omer SB, Orchard J, Osborne R, Ostro B, Page A, Pandey KD,
Parry CD, Passmore E, Patra J, Pearce N, Pelizzari PM, Petzold M, Phillips MR, Pope
D, Pope CA, 3rd, Powles J, Rao M, Razavi H, Rehfuess EA, Rehm JT, Ritz B, Rivara
FP, Roberts T, Robinson C, Rodriguez-Portales JA, Romieu I, Room R, Rosenfeld LC,
Roy A, Rushton L, Salomon JA, Sampson U, Sanchez-Riera L, Sanman E, Sapkota A,
Seedat S, Shi P, Shield K, Shivakoti R, Singh GM, Sleet DA, Smith E, Smith KR,
Stapelberg NJ, Steenland K, Stockl H, Stovner LJ, Straif K, Straney L, Thurston GD,
Tran JH, Van Dingenen R, van Donkelaar A, Veerman JL, Vijayakumar L, Weintraub
R, Weissman MM, White RA, Whiteford H, Wiersma ST, Wilkinson JD, Williams
HC, Williams W, Wilson N, Woolf AD, Yip P, Zielinski JM, Lopez AD, Murray CJ,
Ezzati M, AlMazroa MA & Memish ZA (2012) A comparative risk assessment of
burden of disease and injury attributable to 67 risk factors and risk factor clusters in
21 regions, 1990-2010: a systematic analysis for the Global Burden of Disease Study
2010. Lancet 380(9859): 2224—60.
Liu L, Johnson HL, Cousens S, Perin J, Scott S, Lawn JE, Rudan I, Campbell H, Cibulskis
R, Li M, Mathers C, Black RE, Child Health Epidemiology Reference Group of WHO
& Unicef (2012) Global, regional, and national causes of child mortality: an updated
systematic analysis for 2010 with time trends since 2000. Lancet 379(9832): 2151—
61.
Lohman M, Tallroth K, Kettunen JA & Marttinen MT (2009) Reproducibility of dualenergy x-ray absorptiometry total and regional body composition measurements using
different scanning positions and definitions of regions. Metabolism 58(11): 1663—
1668.
Lowell BB & Spiegelman BM (2000) Towards a molecular understanding of adaptive
thermogenesis. Nature 404(6778): 652—660.
Lunde A, Melve KK, Gjessing HK, Skjærven R & Irgens LM (2007) Genetic and
Environmental Influences on Birth Weight, Birth Length, Head Circumference, and
Gestational Age by Use of Population-based Parent-Offspring Data. American Journal
of Epidemiology 165(7): 734—741.
Lv Q, Meng X-F, He F-F, Chen S, Su H, Xiong J, Gao P, Tian X-J, Liu J-S, Zhu Z-H,
Huang K & Zhang C (2013) High Serum Uric Acid and Increased Risk of Type 2
Diabetes: A Systemic Review and Meta-Analysis of Prospective Cohort Studies.
PLoS One 8(2): e56864.
Malavolti M, Mussi C, Poli M, Fantuzzi AL, Salvioli G, Battistini N & Bedogni G (2003)
Cross-calibration of eight-polar bioelectrical impedance analysis versus dual-energy
X-ray absorptiometry for the assessment of total and appendicular body composition
in healthy subjects aged 21—82 years. Ann Hum Biol 30(4): 380-91.
130
Mancia G, Fagard R, Narkiewicz K, Redon J, Zanchetti A, Bohm M, Christiaens T,
Cifkova R, De Backer G, Dominiczak A, Galderisi M, Grobbee DE, Jaarsma T,
Kirchhof P, Kjeldsen SE, Laurent S, Manolis AJ, Nilsson PM, Ruilope LM,
Schmieder RE, Sirnes PA, Sleight P, Viigimaa M, Waeber B, Zannad F & Task Force
M (2013) 2013 ESH/ESC Guidelines for the management of arterial hypertension: the
Task Force for the management of arterial hypertension of the European Society of
Hypertension (ESH) and of the European Society of Cardiology (ESC). J Hypertens
31(7): 1281—357.
Mancia G, Parati G, Hennig M, Flatau B, Omboni S, Glavina F, Costa B, Scherz R, Bond
G, Zanchetti A & Investigators E (2001) Relation between blood pressure variability
and carotid artery damage in hypertension: baseline data from the European
Lacidipine Study on Atherosclerosis (ELSA). J Hypertens 19(11): 1981—9.
Martin JA, Osterman MJ, Centers for Disease C & Prevention (2013) Preterm births —
United States, 2006 and 2010. MMWR Surveill Summ 62 Suppl 3: 136—8.
Martinussen M, Flanders DW, Fischl B, Busa E, Løhaugen GC, Skranes J, Vangberg TR,
Brubakk A-M, Haraldseth O & Dale AM (2009) Segmental Brain Volumes and
Cognitive and Perceptual Correlates in 15-Year-Old Adolescents with Low Birth
Weight. The Journal of Pediatrics 155(6): 848—853.e1.
Mathai S, Cutfield WS, Derraik JGB, Dalziel SR, Harding JE, Robinson E, Biggs J,
Jefferies C & Hofman PL (2012) Insulin Sensitivity and β-Cell Function in Adults
Born Preterm and Their Children. Diabetes 61(10): 2479—2483.
Mathai S, Derraik JGB, Cutfield WS, Dalziel SR, Harding JE, Biggs J, Jefferies C &
Hofman PL (2013) Increased Adiposity in Adults Born Preterm and Their Children.
PLoS ONE 8(11): e81840.
Mathews TJ & MavDorman MF (2013) Infant Mortality Statistics from the 2010 Period
Linked Birth/Infant Death Data Set. National Vital Statistics Reports 62(Number 8).
Matinolli H-M, Hovi P, Männistö S, Sipola-Leppänen M, Eriksson JG, Mäkitie O,
Järvenpää A-L, Andersson S & Kajantie E (2014) The role of early nutrition in
programming of the adult body composition. N. I. f. H. a. Welfare. Submitted.
Mattsson N, Rönnemaa T, Juonala M, Viikari JSA & Raitakari OT (2007) The prevalence
of the metabolic syndrome in young adults. The Cardiovascular Risk in Young Finns
Study. Journal of Internal Medicine 261(2): 159—169.
Mazess RB, Barden HS, Bisek JP & Hanson J (1990) Dual-energy x-ray absorptiometry
for total-body and regional bone-mineral and soft-tissue composition. The American
Journal of Clinical Nutrition 51(6): 1106—12.
Mcmillen IC & Robinson JS (2005) Developmental Origins of the Metabolic Syndrome:
Prediction, Plasticity, and Programming.
Mendis S, Puska P & editors NB (2011) Global Atlas on cardiovascular disease prevention
and control. World Health Organization, Geneva.
Mericq V, Iñiguez G, Bazaes R, Bouwman C, Avila A, Salazar T & Carrasco F (2009)
Differences in body composition and energy expenditure in prepubertal children born
term or preterm appropriate or small for gestational age. Journal of Pediatric
Endocrinology & Metabolism 22(11): 1041—1050.
131
Miettola S, Hartikainen AL, Vaarasmaki M, Bloigu A, Ruokonen A, Jarvelin MR & Pouta
A (2013) Offspring's blood pressure and metabolic phenotype after exposure to
gestational hypertension in utero. Eur J Epidemiol 28(1): 87—98.
Mogren I, Högberg U, Stegmayr B, Lindahl B & Stenlund H (2001) Fetal exposure,
heredity and risk indicators for cardiovascular disease in a Swedish welfare cohort.
International Journal of Epidemiology 30(4): 853—862.
Mokdad AH, Ford ES, Bowman BA & et al. (2003) Prevalence of obesity, diabetes, and
obesity-related health risk factors, 2001. JAMA 289(1): 76—79.
Morley R, Harland P, Law CM & Lucas A (2000) Birthweight and social deprivation:
influences on serum lipids and fibrinogen. Acta Pædiatrica 89(6): 703—707.
Moster D, Lie RT & Markestad T (2008) Long-Term Medical and Social Consequences of
Preterm Birth. New England Journal of Medicine 359(3): 262—273.
Nichols M, Townsend N, Luengo-Fernandez R, Leal J, Gray A, Scarborough P & Rayner
M (2012) European Cardiovascular Disease Statistics 2012, European Heart Network,
Brussels, European Society of Cardiology, Sophia Antipolis.
Nuyt AM (2008) Mechanisms underlying developmental programming of elevated blood
pressure and vascular dysfunction: evidence from human studies and experimental
animal models. Clinical Science 114(1): 1—17.
O'Brien E, Coats A, Owens P, Petrie J, Padfield PL, Littler WA, de Swiet M & Mee F
(2000) Use and interpretation of ambulatory blood pressure monitoring:
recommendations of the British hypertension society. BMJ 320(7242): 1128—34.
Olsen P, Laara E, Rantakallio P, Jarvelin MR, Sarpola A & Hartikainen AL (1995)
Epidemiology of preterm delivery in two birth cohorts with an interval of 20 years.
Am J Epidemiol 142(11): 1184—93.
Onat A, Can G, Hergenc G, Yazici M, Karabulut A & Albayrak S (2007) Serum
apolipoprotein B predicts dyslipidemia, metabolic syndrome and, in women,
hypertension and diabetes, independent of markers of central obesity and
inflammation. Int J Obes 31(7): 1119—1125.
Onat A, Ceyhan K, Basar O, Erer B, Toprak S & Sansoy V (2002) Metabolic syndrome:
major impact on coronary risk in a population with low cholesterol levels ─ a
prospective and cross-sectional evaluation. Atherosclerosis 165(2): 285—92.
Ong KKL, Ahmed ML, Emmett PM, Preece MA & Dunger DB (2000) Association
between postnatal catch-up growth and obesity in childhood: prospective cohort study.
Osmond C, Barker DJ, Winter PD, Fall CH & Simmonds SJ (1993) Early growth and
death from cardiovascular disease in women. BMJ 307(6918): 1519—24.
Papageorghiou AT, Ohuma EO, Altman DG, Todros T, Cheikh Ismail L, Lambert A,
Jaffer YA, Bertino E, Gravett MG, Purwar M, Noble JA, Pang R, Victora CG, Barros
FC, Carvalho M, Salomon LJ, Bhutta ZA, Kennedy SH, Villar J, International F &
Newborn Growth Consortium for the 21st C (2014) International standards for fetal
growth based on serial ultrasound measurements: the Fetal Growth Longitudinal
Study of the INTERGROWTH-21st Project. Lancet 384(9946): 869—79.
Parati G & Valentini M (2006) Prognostic relevance of blood pressure variability.
Hypertension 47(2): 137—8.
132
Parati GP, G; Albini, F; Malaspina, D; Mancia, G (1987) Relationship of 24-hour blood
pressure mean and variability to severity of target-organ damage in hypertension. J
Hypertens 5(1): 93—8.
Parkinson JRC, Hyde MJ, Gale C, Santhakumaran S & Modi N (2013) Preterm Birth and
the Metabolic Syndrome in Adult Life: A Systematic Review and Meta-analysis.
Pediatrics 131(4): e1240—63.
Pearson TA, Mensah GA, Alexander RW, Anderson JL, Cannon RO, Criqui M, Fadl YY,
Fortmann SP, Hong Y, Myers GL, Rifai N, Smith SC, Taubert K, Tracy RP & Vinicor
F (2003) Markers of Inflammation and Cardiovascular Disease: Application to
Clinical and Public Health Practice: A Statement for Healthcare Professionals From
the Centers for Disease Control and Prevention and the American Heart Association.
Circulation 107(3): 499—511.
Peralta-Carcelen M, Jackson DS, Goran MI, Royal SA, Mayo MS & Nelson KG (2000)
Growth of adolescents who were born at extremely low birth weight without major
disability. The Journal of Pediatrics 136(5): 633—640.
Pesonen A-K, Räikkönen K, Heinonen K, Andersson S, Hov iP, Järvenpää A-L, Eriksson
JG & Kajantie E (2008) Personality in young adults with very low birth weight –
Helsinki Study of Very Low Birth Weight Adults. J Child Psychol Psychiatr 49:
609—617.
Pharoah POD, Stevenson CJ & West CR (1998) Association of blood pressure in
adolescence with birthweight. Archives of Disease in Childhood — Fetal and
Neonatal Edition 79(2): F114—F118.
Philip AG (2005) The evolution of neonatology. Pediatr Res 58(4): 799—815.
Phillips A, Gerald Shaper A & Whincup P (1989) Association between serum albumin and
mortality from cardiovascular disease, cancer, and other causes. Lancet 334(8677):
1434—1436.
Pickering TG, Hall JE, Appel LJ, Falkner BE, Graves JW, Hill MN, Jones DH, Kurtz T,
Sheps SG, Roccella EJ, Council on High Blood Pressure Research P & Public
Education Subcommittee AHA (2005) Recommendations for blood pressure
measurement in humans: an AHA scientific statement from the Council on High
Blood Pressure Research Professional and Public Education Subcommittee. J Clin
Hypertens (Greenwich) 7(2): 102—9.
Pihkala J, Hakala T, Voutilainen P & Raivio K (1989) Characteristic of recent fetal growth
curves in Finland [In Finnish]. Duodecim 105(18): 1540—6.
Pilgaard K, Faerch K, Carstensen B, Poulsen P, Pisinger C, Pedersen O, Witte DR, Hansen
T, Jorgensen T & Vaag A (2010) Low birthweight and premature birth are both
associated with type 2 diabetes in a random sample of middle-aged Danes.
Diabetologia 53(12): 2526—30.
Pirkola J, Tammelin T, Bloigu A, Pouta A, Laitinen J, Ruokonen A, Tapanainen P,
Järvelin MR & Vääsmäki M (2008) Prevalence of metabolic syndrome at age 16 using
the International Diabetes Federation paediatric definition. Archives of Disease in
Childhood 93(11): 945—951.
133
Plunkett J, Feitosa MF, Trusgnich M, Wangler MF, Palomar L, Kistka ZA, DeFranco EA,
Shen TT, Stormo AE, Puttonen H, Hallman M, Haataja R, Luukkonen A, Fellman V,
Peltonen L, Palotie A, Daw EW, An P, Teramo K, Borecki I & Muglia LJ (2009)
Mother's genome or maternally-inherited genes acting in the fetus influence
gestational age in familial preterm birth. Hum Hered 68(3): 209—19.
Plunkett J & Muglia LJ (2008) Genetic contributions to preterm birth: implications from
epidemiological and genetic association studies. Ann Med 40(3): 167—95.
Pouta A, Hartikainen A-L, Sovio U, Gissler M, Laitinen J, McCarthy MI, Ruokonen A,
Elliott P & Järvelin M-R (2004) Manifestations of Metabolic Syndrome After
Hypertensive Pregnancy. Hypertension 43(4): 825—831.
Raitakari OT, Juonala M, Kahonen M, Taittonen L, Laitinen T, Maki-Torkko N, Jarvisalo
MJ, Uhari M, Jokinen E, Ronnemaa T, Akerblom HK & Viikari JS (2003)
Cardiovascular risk factors in childhood and carotid artery intima-media thickness in
adulthood: the Cardiovascular Risk in Young Finns Study. JAMA 290(17): 2277—83.
Ravussin E, Lillioja S, Knowler WC, Christin L, Freymond D, Abbott WG, Boyce V,
Howard BV & Bogardus C (1988) Reduced rate of energy expenditure as a risk factor
for body-weight gain. N Engl J Med 318(8): 467—72.
Rich-Edwards JW, Stampfer MJ, Manson JE, Rosner B, Hankinson SE, Colditz GA,
Willett WC & Hennekens CH (1997) Birth weight and risk of cardiovascular disease
in a cohort of women followed up since 1976. BMJ 315(7105): 396—400.
Robbins CL, Hutchings Y, Dietz PM, Kuklina EV & Callaghan WM (2014) History of
preterm birth and subsequent cardiovascular disease: a systematic review. American
Journal of Obstetrics and Gynecology 210(4): 285—297.
Roberts G, Lee KJ, Cheong JLY & Doyle LW (2014) Higher ambulatory blood pressure at
18 years in adolescents born less than 28 weeks' gestation in the 1990s compared with
term controls. Journal of Hypertension 32(3): 620—626.
Robinson S & Fall C (2012) Infant Nutrition and Later Health: A Review of Current
Evidence. Nutrients 4(8): 859—874.
Robinson S, Walton RJ, Clark PM, Barker DJ, Hales CN & Osmond C (1992) The relation
of fetal growth to plasma glucose in young men. Diabetologia 35(5): 444—6.
Rodriguez MM, Gomez AH, Abitbol CL, Chandar JJ, Duara S & Zilleruelo GE (2004)
Histomorphometric analysis of postnatal glomerulogenesis in extremely preterm
infants. Pediatr Dev Pathol 7(1): 17—25.
Rogers M, Fay TB, Whitfield MF, Tomlinson J & Grunau RE (2005) Aerobic capacity,
strength, flexibility, and activity level in unimpaired extremely low birth weight
(<or=800 g) survivors at 17 years of age compared with term-born control subjects.
Pediatrics 116(1): e58—65.
Romero R, Dey SK & Fisher SJ (2014) Preterm labor: One syndrome, many causes.
Science 345(6198): 760—765.
Romero R, Espinoza J, Kusanovic JP, Gotsch F, Hassan S, Erez O, Chaiworapongsa T &
Mazor M (2006) The preterm parturition syndrome. BJOG 113 Suppl 3: 17—42.
134
Roseboom TJ, van der Meulen JH, van Montfrans GA, Ravelli AC, Osmond C, Barker DJ
& Bleker OP (2001) Maternal nutrition during gestation and blood pressure in later
life. J Hypertens 19(1): 29—34.
Rossi P, Tauzin L, Marchand E, Boussuges A, Gaudart J & Frances Y (2011) Respective
roles of preterm birth and fetal growth restriction in blood pressure and arterial
stiffness in adolescence. J Adolesc Health 48(5): 520—2.
Rotteveel J, van Weissenbruch M, Twisk J & Delemarre-Van de Waal H (2008a)
Abnormal lipid profile and hyperinsulinaemia after a mixed meal: additional
cardiovascular risk factors in young adults born preterm. Diabetologia 51(7): 1269—
1275.
Rotteveel J, van Weissenbruch MM, Twisk JWR & Delemarre-Van de Waal HA (2008b)
Infant and Childhood Growth Patterns, Insulin Sensitivity, and Blood Pressure in
Prematurely Born Young Adults. Pediatrics 122(2): 313—321.
Sadeh A, Sharkey KM & Carskadon MA (1994) Activity-based sleep-wake identification:
an empirical test of methodological issues. Sleep 17(3): 201—7.
Saigal S & Doyle LW (2008) An overview of mortality and sequelae of preterm birth from
infancy to adulthood. Lancet 371(9608): 261—9.
Saigal S, Stoskopf B, Boyle M, Paneth N, Pinelli J, Streiner D & Goddeeris J (2007)
Comparison of current health, functional limitations, and health care use of young
adults who were born with extremely low birth weight and normal birth weight.
Pediatrics 119(3): e562—73.
Saigal S, Stoskopf B, Streiner D, Paneth N, Pinelli J & Boyle M (2006) Growth trajectories
of extremely low birth weight infants from birth to young adulthood: a longitudinal,
population-based study. Pediatr Res 60(6): 751—8.
Saigal S, Stoskopf BL, Streiner DL & Burrows E (2001) Physical growth and current
health status of infants who were of extremely low birth weight and controls at
adolescence. Pediatrics 108(2): 407—15.
Salonen M, Tenhola S, Laitinen T, Lyyra-Laitinen T, Romppanen J, Jääskeläinen J &
Voutilainen R (2010) Tracking Serum Lipid Levels and the Association of Cholesterol
Concentrations, Blood Pressure and Cigarette Smoking With Carotid Artery IntimaMedia Thickness in Young Adults Born Small for Gestational Age. Circulation
Journal 74(11): 2419—2425.
Saltiel AR (2000) Series Introduction: The molecular and physiological basis of insulin
resistance: emerging implications for metabolic and cardiovascular diseases. The
Journal of Clinical Investigation 106(2): 163—164.
Sandboge S, Moltchanova E, Blomstedt PA, Salonen MK, Kajantie E, Osmond C, Barker
DJP & Eriksson JG (2012) Birth-weight and resting metabolic rate in adulthood —
sex-specific differences. Annals of Medicine 44(3): 296—303.
Sartorio A, Malavolti M, Agosti F, Marinone PG, Caiti O, Battistini N & Bedogni G (2005)
Body water distribution in severe obesity and its assessment from eight-polar
bioelectrical impedance analysis. Eur J Clin Nutr 59(2): 155—60.
135
Sepúlveda C, Urquidi C, Pittaluga E, Iniguez G, Ávila A, Carrasco F & Mericq V (2013)
Differences in body composition and resting energy expenditure in childhood in
preterm children born with very low birth weight. Hormone Research in Paediatrics
79(6): 347—55.
Shah T, Casas JP, Cooper JA, Tzoulaki I, Sofat R, McCormack V, Smeeth L, Deanfield JE,
Lowe GD, Rumley A, Fowkes FGR, Humphries SE & Hingorani AD (2009) Critical
appraisal of CRP measurement for the prediction of coronary heart disease events:
new data and systematic review of 31 prospective cohorts. International Journal of
Epidemiology 38(1): 217—231.
Shapiro-Mendoza CK, Tomashek KM, Kotelchuck M, Barfield W, Nannini A, Weiss J &
Declercq E (2008) Effect of late-preterm birth and maternal medical conditions on
newborn morbidity risk. Pediatrics 121(2): e223—32.
Shiroma EJ & Lee I-M (2010) Physical Activity and Cardiovascular Health: Lessons
Learned From Epidemiological Studies Across Age, Gender, and Race/Ethnicity.
Circulation 122(7): 743—752.
Siewert-Delle A & Ljungman S (1998) The Impact of Birth Weight and Gestational Age
on Blood Pressure in Adult Life: A Population-Based Study of 49-Year-Old Men.
American Journal of Hypertension 11(8): 946—953.
Singhal A, Cole TJ & Lucas A (2001a) Early nutrition in preterm infants and later blood
pressure: two cohorts after randomised trials. Lancet 357(9254): 413—9.
Singhal A, Kattenhorn M, Cole TJ, Deanfield J & Lucas A (2001b) Preterm birth, vascular
function, and risk factors for atherosclerosis. Lancet 358(9288): 1159—60.
Skilton MR, Viikari JSA, Juonala M, Laitinen T, Lehtimäki T, Taittonen L, Kähänen M,
Celermajer DS & Raitakari OT (2011) Fetal Growth and Preterm Birth Influence
Cardiovascular Risk Factors and Arterial Health in Young Adults: The Cardiovascular
Risk in Young Finns Study. Arteriosclerosis, Thrombosis, and Vascular Biology
31(12): 2975—2981.
Sniderman AD, Williams K, Contois JH, Monroe HM, McQueen MJ, de Graaf J &
Furberg CD (2011) A Meta-Analysis of Low-Density Lipoprotein Cholesterol, NonHigh-Density Lipoprotein Cholesterol, and Apolipoprotein B as Markers of
Cardiovascular Risk. Circulation: Cardiovascular Quality and Outcomes 4(3): 337—
345.
Statistics Finland (2012) Ischaemic heart disease causes more than every fifth death.
Official Statistics of Finland (OSF): Causes of death [e-publication]. Helsinki,
Statistics Finland. 2014.
Strang-Karlsson S, Raikkonen K, Pesonen AK, Kajantie E, Paavonen EJ, Lahti J, Hovi P,
Heinonen K, Jarvenpaa AL, Eriksson JG & Andersson S (2008) Very low birth weight
and behavioral symptoms of attention deficit hyperactivity disorder in young
adulthood: the Helsinki study of very-low-birth-weight adults. Am J Psychiatry
165(10): 1345—53.
136
Sun G, French CR, Martin GR, Younghusband B, Green RC, Xie Y-g, Mathews M, Barron
JR, Fitzpatrick DG, Gulliver W & Zhang H (2005) Comparison of multifrequency
bioelectrical impedance analysis with dual-energy X-ray absorptiometry for
assessment of percentage body fat in a large, healthy population. The American
Journal of Clinical Nutrition 81(1): 74—78.
Suomela E, Oikonen M, Virtanen J, Parkkola R, Jokinen E, Laitinen T, Hutri-Kähönen N,
Kähönen M, Lehtimäki T, Taittonen L, Tossavainen P, Jula A, Loo B-M, Mikkilä V,
Younossi Z, Viikari JSA, Juonala M & Raitakari OT (2014) Prevalence and
determinants of fatty liver in normal-weight and overweight young adults. The
Cardiovascular Risk in Young Finns Study. Annals of Medicine 0(0): 1—7.
Swamy GK, Ostbye T & Skjaerven R (2008) Association of preterm birth with long-term
survival, reproduction, and next-generation preterm birth. JAMA 299(12): 1429—36.
Svendsen OL, Haarbo J, Hassager C & Christiansen C (1993) Accuracy of measurements
of body composition by dual-energy x-ray absorptiometry in vivo. The American
Journal of Clinical Nutrition 57(5): 605—608.
Tanner JM (1962) Growth at Adolescence. 2nd edition.
Targher G, Day CP & Bonora E (2010) Risk of Cardiovascular Disease in Patients with
Nonalcoholic Fatty Liver Disease. New England Journal of Medicine 363(14): 13411350.
Tatasciore A, Renda G, Zimarino M, Soccio M, Bilo G, Parati G, Schillaci G & De
Caterina R (2007) Awake systolic blood pressure variability correlates with targetorgan damage in hypertensive subjects. Hypertension 50(2): 325—32.
Tauzin L, Rossi P, Grosse C, Boussuges A, Frances Y, Tsimaratos M & Simeoni U (2014)
Increased systemic blood pressure and arterial stiffness in young adults born
prematurely. Journal of Developmental Origins of Health and Disease
FirstView(Supplement -1): 1—5.
Taylor HG, Filipek PA, Juranek J, Bangert B, Minich N & Hack M (2011) Brain volumes
in adolescents with very low birth weight: effects on brain structure and associations
with neuropsychological outcomes. Dev Neuropsychol 36(1): 96—117.
Textor J, Hardt J & Knüppel S (2011) DAGitty: A Graphical Tool for Analyzing Causal
Diagrams. Epidemiology 22(5): 745 10.1097/EDE.0b013e318225c2be.
Thomas EL, Parkinson JR, Hyde MJ, Yap IKS, Holmes E, Dore CJ, Bell JD & Modi N
(2011) Aberrant Adiposity and Ectopic Lipid Deposition Characterize the Adult
Phenotype of the Preterm Infant. Pediatric Research 70(5): 507—512.
Tissot S, Delafosse B, Bertrand O, Bouffard Y, Viale JP & Annat G (1995) Clinical
validation of the Deltatrac monitoring system in mechanically ventilated patients.
Intensive Care Med 21(2): 149—53.
Ueda P, Cnattingius S, Stephansson O, Ingelsson E, Ludvigsson J & Bonamy A-K (2014)
Cerebrovascular and ischemic heart disease in young adults born preterm: a
population-based Swedish cohort study. European Journal of Epidemiology 29(4):
253—260.
137
Urbina E, Alpert B, Flynn J, Hayman L, Harshfield GA, Jacobson M, Mahoney L,
McCrindle B, Mietus-Snyder M, Steinberger J, Daniels S, American Heart
Association Atherosclerosis H & Obesity in Youth C (2008) Ambulatory blood
pressure monitoring in children and adolescents: recommendations for standard
assessment: a scientific statement from the American Heart Association
Atherosclerosis, Hypertension, and Obesity in Youth Committee of the council on
cardiovascular disease in the young and the council for high blood pressure research.
Hypertension 52(3): 433—51.
Wallace TM, Levy JC & Matthews DR (2004) Use and abuse of HOMA modeling.
Diabetes Care 27(6): 1487—95.
Wang ML, Dorer DJ, Fleming MP & Catlin EA (2004) Clinical outcomes of near-term
infants. Pediatrics 114(2): 372—6.
Wang Z, Heshka S, Gallagher D, Boozer CN, Kotler DP & Heymsfield SB (2000) Resting
energy expenditure—fat-free mass relationship: new insights provided by body
composition modeling. Am J Physiol Endocrinol Metab 279(3): E539—545.
Wehkalampi K, Muurinen M, Wirta SB, Hannula-Jouppi K, Hovi P, Jarvenpaa AL,
Eriksson JG, Andersson S, Kere J & Kajantie E (2013) Altered Methylation of Locus
20 Years after Preterm Birth at Very Low Birth Weight. PLoS One 8(6): e67379.
Weiler HA, Yuen CK & Seshia MM (2002) Growth and bone mineralization of young
adults weighing less than 1500 g at birth. Early Hum Dev 67(1—2): 101-12.
Weinsier RL, Schutz Y & Bracco D (1992) Reexamination of the relationship of resting
metabolic rate to fat-free mass and to the metabolically active components of fat-free
mass in humans. The American Journal of Clinical Nutrition 55(4): 790—4.
Weitz G, Bonnemeier H, Sufke S, Wellhoner P, Lehnert H & Dodt C (2013) Heart rate
variability and metabolic rate in healthy young adults with low birth weight. Am J
Cardiovasc Dis 3(4): 239—46.
Wells JC & Fuller NJ (1998) Precision and accuracy in a metabolic monitor for indirect
calorimetry. Eur J Clin Nutr 52(7): 536—40.
Verdecchia P (2000) Prognostic value of ambulatory blood pressure : current evidence and
clinical implications. Hypertension 35(3): 844—51.
Verdecchia P, Porcellati C, Schillaci G, Borgioni C, Ciucci A, Battistelli M, Guerrieri M,
Gatteschi C, Zampi I, Santucci A, Santucci C & Reboldi G (1994) Ambulatory blood
pressure. An independent predictor of prognosis in essential hypertension.
Hypertension 24(6): 793—801.
Whincup PH, Kaye SJ, Owen CG, Huxley R, Cook DG, Anazawa S, Barrett-Connor E,
Bhargava SK, Birgisdottir BE, Carlsson S, de Rooij SR, Dyck RF, Eriksson JG,
Falkner B, Fall C, Forsen T, Grill V, Gudnason V, Hulman S, Hyppönen E, Jeffreys
M, Lawlor DA, Leon DA, Minami J, Mishra G, Osmond C, Power C, Rich-Edwards
JW, Roseboom TJ, Sachdev HS, Syddall H, Thorsdottir I, Vanhala M, Wadsworth M
& Yarbrough DE (2008) Birth weight and risk of type 2 diabetes: a systematic review.
JAMA 300(24): 2886—97.
138
WHO WHO (1977) Recommended definitions, terminology and format for statistical
tables related to the perinatal period and use of a new certificate for cause of perinatal
deaths. Modifications recommended by FIGO as amended October 14, 1976. Acta
Obstet Gynecol Scand. 56(3):247—53.
Wilcox AJ, Skjaerven R & Lie RT (2008) Familial patterns of preterm delivery: maternal
and fetal contributions. Am J Epidemiol 167(4): 474—9.
Vohr BR, Allan W, Katz KH, Schneider KC & Ment LR (2010) Early predictors of
hypertension in prematurely born adolescents. Acta Pædiatrica 99(12): 1812—1818.
Woodrow G (2007) Body Compostion Analysis Techniques In Adult And Pediatric
Patients: How Realiable Are They? How Useful Are They Clinically? Peritoneal
Dialysis International 27(Supplement 2): S245—S249.
World Health Organization (2004) ICD-10: International statistical classification of
diseases and related health problems: Tenth Revision — 2nd ed. 3.
World Health Organization (2011) Global status report on noncommunicable diseases
2010. www.who.int.
Vuori E & Gissler M (2013) Newborns 2012. Official Statistics of Finland, Statistical
report 32/2013. Retriewed February 28, 2014, from Natioanl Institute for Health and
Welfare
website:
http://www.julkari.fi/bitstream/handle/10024/110498/Tr24_13.pdf?sequence=4.
Vuori E & Gissler M (2014) Perinatal statistics: parturients, deliveries and newborns 2013.
Vääräsmäki M, Pouta A, Elliot P, Tapanainen P, Sovio U, Ruokonen A, Hartikainen A-L,
McCarthy M & Järvelin M-R (2009) Adolescent Manifestations of Metabolic
Syndrome Among Children Born to Women With Gestational Diabetes in a
General—Population Birth Cohort. Am J Epidemiol 169(10): 1209—1215.
York TP, Eaves LJ, Lichtenstein P, Neale MC, Svensson A, Latendresse S, Långström N
& Strauss JF (2013) Fetal and Maternal Genes’ Influence on Gestational Age in a
Quantitative Genetic Analysis of 244,000 Swedish Births. American Journal of
Epidemiology 178(4): 543—550.
Yun JW, Cho YK, Park JH, Kim HJ, Park DI, Sohn CI, Jeon WK & Kim BI (2009)
Abnormal glucose tolerance in young male patients with nonalcoholic fatty liver
disease. Liver International 29(4): 525—529.
Yusuf S, Sleight P, Pogue J, Bosch J, Davies R & Dagenais G (2000) Effects of an
angiotensin-converting-enzyme inhibitor, ramipril, on cardiovascular events in highrisk patients. The Heart Outcomes Prevention Evaluation Study Investigators. N Engl
J Med 342(3): 145—53.
Zeitlin J, Szamotulska K, Drewniak N, Mohangoo AD, Chalmers J, Sakkeus L, Irgens L,
Gatt M, Gissler M, Blondel B & Euro—Peristat Preterm Study G (2013) Preterm birth
time trends in Europe: a study of 19 countries. BJOG 120(11): 1356—65.
139
140
Original articles
This thesis is based on the following publications, which are referred throughout the
text by their Roman numerals:
I
Sipola-Leppänen M, Hovi P, Andersson S, Wehkalampi K, Vääräsmäki M, StrangKarlsson S, Järvenpää AL, Mäkitie O, Eriksson JG & Kajantie E. Resting energy
expenditure in young adults born preterm ─ the Helsinki study of very low birth
weight adults. PLoS One.6(3):e17700.
II Sipola-Leppänen M, Vääräsmäki M, Tikanmäki M, Hovi P, Miettola S, Ruokonen A,
Pouta A, Järvelin M & Kajantie E (2014) Cardiovascular risk factors in adolescents
born preterm. Pediatrics 2014: 134(4): 1072-1081.
III Sipola-Leppänen M, Vääräsmäki M, Tikanmäki M, Matinolli H, Miettola S, Hovi P,
Wehkalampi K, Ruokonen A, Sundvall J, Pouta A, Eriksson JG, Järvelin M, Kajantie
E. Cardiometabolic risk factors in adults born preterm. Am J Epidemol. 2015: In press.
IV Sipola-Leppänen M, Karvonen R, Tikanmäki M, Matinolli H, Martikainen S, Pesonen
A, Räikkönen K, Järvelin M, Hovi P, Eriksson JG, Vääräsmäki M, Kajantie E.
Ambulatory blood pressure and its variability in adults born preterm. Hypertension
2015;65: 615-621.
The original articles are reprinted with permission from Public Library of Science
(PLOS) (I), American Academy of Pediatrics (II), Oxford University Press (III),
and Wolters Kluwer Health (IV).
Original publications are not included in the electronic version of the dissertation.
141
142
ACTA UNIVERSITATIS OULUENSIS
SERIES D MEDICA
1277. Laitala, Anu (2014) Hypoxia-inducible factor prolyl 4-hydroxylases regulating
erythropoiesis, and hypoxia-inducible lysyl oxidase regulating skeletal muscle
development during embryogenesis
1278. Persson, Maria (2014) 3D woven scaffolds for bone tissue engineering
1279. Kallankari, Hanna (2014) Perinatal factors as predictors of brain damage and
neurodevelopmental outcome : study of children born very preterm
1280. Pietilä, Ilkka (2015) The role of Dkk1 and Wnt5a in mammalian kidney
development and disease
1281. Komulainen, Tuomas (2015) Disturbances in mitochondrial DNA maintenance in
neuromuscular disorders and valproate-induced liver toxicity
1282. Nguyen, Van Dat (2015) Mechanisms and applications of disulfide bond formation
1283. Orajärvi, Marko (2015) Effect of estrogen and dietary loading on rat condylar
cartilage
1284. Bujtár, Péter (2015) Biomechanical investigation of the mandible, a related donor
site and reconstructions for optimal load-bearing
1285. Ylimäki, Eeva-Leena (2015) Ohjausintervention vaikuttavuus elintapoihin ja
elintapamuutokseen sitoutumiseen
1286. Rautiainen, Jari (2015) Novel magnetic resonance imaging techniques for articular
cartilage and subchondral bone : studies on MRI Relaxometry and short echo
time imaging
1287. Juola, Pauliina (2015) Outcomes and their predictors in schizophrenia in the
Northern Finland Birth Cohort 1966
1288. Karsikas, Sara (2015) Hypoxia-inducible factor prolyl 4-hydroxylase-2 in cardiac
and skeletal muscle ischemia and metabolism
1289. Takatalo, Jani (2015) Degenerative findings on MRI of the lumbar spine :
Prevalence, environmental determinants and association with low back symptoms
1290. Pesonen, Hanna-Mari (2015) Managing life with a memory disorder : the mutual
processes of those with memory disorders and their family caregivers following a
diagnosis
1291. Pruikkonen, Hannele (2015) Viral infection induced respiratory distress in
childhood
1292. Vähänikkilä, Hannu (2015) Statistical methods in dental research, with special
reference to time-to-event methods
Book orders:
Granum: Virtual book store
http://granum.uta.fi/granum/
D 1293
OULU 2015
UNIVERSITY OF OUL U P.O. Box 8000 FI-90014 UNIVERSITY OF OULU FINLA ND
U N I V E R S I TAT I S
O U L U E N S I S
ACTA
A C TA
D 1293
ACTA
U N I V E R S I T AT I S O U L U E N S I S
Marika Sipola-Leppänen
University Lecturer Santeri Palviainen
Postdoctoral research fellow Sanna Taskila
Professor Olli Vuolteenaho
Marika Sipola-Leppänen
Professor Esa Hohtola
PRETERM BIRTH AND
CARDIOMETABOLIC RISK
FACTORS IN ADOLESCENCE
AND EARLY ADULTHOOD
University Lecturer Veli-Matti Ulvinen
Director Sinikka Eskelinen
Professor Jari Juga
University Lecturer Anu Soikkeli
Professor Olli Vuolteenaho
Publications Editor Kirsti Nurkkala
ISBN 978-952-62-0794-0 (Paperback)
ISBN 978-952-62-0795-7 (PDF)
ISSN 0355-3221 (Print)
ISSN 1796-2234 (Online)
UNIVERSITY OF OULU GRADUATE SCHOOL;
UNIVERSITY OF OULU, FACULTY OF MEDICINE;
NATIONAL INSTITUTE FOR HEALTH AND WELFARE;
DOCTORAL PROGRAMS IN PUBLIC HEALTH
D
MEDICA


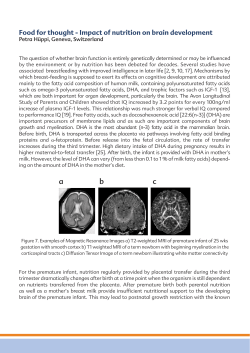
© Copyright 2026