
Semi-Annual Report
Highland Funds I
Highland Long/Short Equity Fund
Highland Long/Short Healthcare Fund
Highland Floating Rate Opportunities Fund
Highland Opportunistic Credit Fund
Semi-Annual Report
December 31, 2014
Highland Funds I
Highland Long/Short Equity Fund
Highland Long/Short Healthcare Fund
Highland Floating Rate Opportunities Fund
Highland Opportunistic Credit Fund
TABLE OF CONTENTS
Fund Profile . . . . . . . . . . . . . . . . . . . . . . . . . . . . . . . . . . . . . . . . . . . . . . . . . . . . . . . . . . . . . . . . . . . . . . . . . . . . . . . . . . . . . . . . . . . . . . . . . . .
Financial Statements. . . . . . . . . . . . . . . . . . . . . . . . . . . . . . . . . . . . . . . . . . . . . . . . . . . . . . . . . . . . . . . . . . . . . . . . . . . . . . . . . . . . . . . . .
Investment Portfolio . . . . . . . . . . . . . . . . . . . . . . . . . . . . . . . . . . . . . . . . . . . . . . . . . . . . . . . . . . . . . . . . . . . . . . . . . . . . . . . . . . . . . . .
Statements of Assets and Liabilities . . . . . . . . . . . . . . . . . . . . . . . . . . . . . . . . . . . . . . . . . . . . . . . . . . . . . . . . . . . . . . . . . . . . . .
Statements of Operations . . . . . . . . . . . . . . . . . . . . . . . . . . . . . . . . . . . . . . . . . . . . . . . . . . . . . . . . . . . . . . . . . . . . . . . . . . . . . . . . .
Statements of Changes in Net Assets . . . . . . . . . . . . . . . . . . . . . . . . . . . . . . . . . . . . . . . . . . . . . . . . . . . . . . . . . . . . . . . . . . . .
Statement of Cash Flows . . . . . . . . . . . . . . . . . . . . . . . . . . . . . . . . . . . . . . . . . . . . . . . . . . . . . . . . . . . . . . . . . . . . . . . . . . . . . . . . . .
Financial Highlights. . . . . . . . . . . . . . . . . . . . . . . . . . . . . . . . . . . . . . . . . . . . . . . . . . . . . . . . . . . . . . . . . . . . . . . . . . . . . . . . . . . . . . . .
Notes to Financial Statements . . . . . . . . . . . . . . . . . . . . . . . . . . . . . . . . . . . . . . . . . . . . . . . . . . . . . . . . . . . . . . . . . . . . . . . . . . . .
Additional Information . . . . . . . . . . . . . . . . . . . . . . . . . . . . . . . . . . . . . . . . . . . . . . . . . . . . . . . . . . . . . . . . . . . . . . . . . . . . . . . . . . . .
Disclosure of Fund Expenses . . . . . . . . . . . . . . . . . . . . . . . . . . . . . . . . . . . . . . . . . . . . . . . . . . . . . . . . . . . . . . . . . . . . . . . . . . . . . .
Approval of Highland Funds I Advisory and Sub-Advisory Agreements . . . . . . . . . . . . . . . . . . . . . . . . . . . . . . . .
Important Information About This Report . . . . . . . . . . . . . . . . . . . . . . . . . . . . . . . . . . . . . . . . . . . . . . . . . . . . . . . . . . . . . . . . . . .
1
5
6
20
22
23
31
35
47
72
72
73
78
Economic and market conditions change frequently.
There is no assurance that the trends described in this report will continue or commence.
A prospectus must precede or accompany this report. Please read the prospectus carefully before you invest.
FUND PROFILE (unaudited)
Highland Long/Short Equity Fund
Objective
Highland Long/Short Equity Fund seeks consistent, above average total returns primarily through
capital appreciation, while also attempting to preserve capital and mitigate risk through hedging
activities.
Net Assets as of December 31, 2014
$918.0 million
Portfolio Data as of December 31, 2014
The information below provides a snapshot of Highland Long/Short Equity Fund at the end of the
reporting period. Highland Long/Short Equity Fund is actively managed and the composition of its
portfolio will change over time.
Sectors as of 12/31/2014 (%)(1)(2)
Consumer Discretionary
Consumer Staples
Energy
Long Exposure
Short Exposure
Net Exposure
14.9
(5.4)
9.5
3.8
(0.4)
3.4
2.9
—
2.9
Financial
25.3
(6.8)
18.5
Healthcare
10.6
(0.8)
9.8
Industrials
7.6
(6.0)
1.6
20.7
(7.1)
13.6
1.0
—
1.0
Information Technology
Telecommunication Services
Top 5 Holdings as of 12/31/2014 (%)(1)(2)
Long Securities
Short Securities
McKesson Corp.
4.1
SanDisk Corp.
(1.2)
FNF Group
4.0
Norfolk Southern Corp.
(1.1)
Rackspace Hosting, Inc.
3.9
QUALCOMM, Inc.
(1.1)
Royal Caribbean Cruises, Ltd.
3.9
BorgWarner, Inc.
(1.1)
Southwest Airlines Co.
3.8
Market Vectors Semiconductor, ETF
(1.0)
The Fund’s investment activities involve a significant degree of risk such as short sales which theoretically
involve unlimited loss potential. The Fund is non-diversified and may invest a larger portion of its assets in
the securities of fewer issuers than if the Fund was diversified.
Please refer to Note 9, Disclosure of Significant Risks and Contingencies, for more information.
(1)
Long and short sectors and securities are calculated as a percentage of total net assets.
(2)
Excludes the Fund’s investment in an investment company purchased with cash collateral from securities lending.
Semi-Annual Report
1
FUND PROFILE (unaudited)
Highland Long/Short Healthcare Fund
Objective
Highland Long/Short Healthcare Fund seeks long-term capital appreciation.
Net Assets as of December 31, 2014
$384.1 million
Portfolio Data as of December 31, 2014
The information below provides a snapshot of Highland Long/Short Healthcare Fund at the end of
the reporting period. Highland Long/Short Healthcare Fund is actively managed and the composition
of its portfolio will change over time.
Sectors as of 12/31/2014 (%)(1)(2)
Long Exposure
Short Exposure
Net Exposure
Consumer Discretionary
2.1
—
2.1
Financial
0.9
—
0.9
Healthcare: Biotechnology
9.6
(13.4)
(3.8)
Healthcare Distributors
1.6
—
1.6
Healthcare Equipment
14.4
(7.3)
7.1
Healthcare Facilities
12.0
—
12.0
Healthcare Services
11.3
(0.9)
10.4
Healthcare Supplies
2.4
—
2.4
Healthcare Technology
0.8
(2.6)
(1.8)
Life Sciences Tools & Services
5.5
—
5.5
4.4
Managed Healthcare
Pharmaceuticals
Industrials
4.9
(0.5)
10.1
(7.2)
2.9
1.1
(1.4)
(0.3)
Top 5 Holdings as of 12/31/2014 (%)(1)(2)
Long Securities
NuVasive, Inc.
Short Securities
3.1
ResMed, Inc.
(3.4)
Humana, Inc.
2.8
Varian Medical Systems, Inc.
(3.2)
Medtronic, Inc.
2.8
Johnson & Johnson
(3.1)
VCA, Inc.
2.7
Alnylam Pharmaceuticals, Inc.
(2.3)
Laboratory Corp. of America Holdings
2.7
Gilead Sciences, Inc.
(1.9)
The Fund’s investment activities involve a significant degree of risk such as short sales which theoretically
involve unlimited loss potential. The Fund is non-diversified and may invest a larger portion of its assets in
the securities of fewer issuers than if the Fund was diversified.
The Fund’s performance largely depends on the healthcare industry and is susceptible to economic,
political and regulatory risks.
Please refer to Note 9, Disclosure of Significant Risks and Contingencies, for more information.
(1)
Long and short sectors and securities are calculated as a percentage of total net assets.
(2)
Excludes the Fund’s investment in an investment company purchased with cash collateral from securities lending.
2
Semi-Annual Report
FUND PROFILE (unaudited)
Highland Floating Rate Opportunities Fund
Objective
Highland Floating Rate Opportunities Fund seeks to provide a high level of current income, consistent with
preservation of capital.
Net Assets as of December 31, 2014
$881.3 million
Portfolio Data as of December 31, 2014
The information below provides a snapshot of Highland Floating Rate Opportunities Fund at the end of the
reporting period. Highland Floating Rate Opportunities Fund is actively managed and the composition of its
portfolio will change over time.
Floating rate loan investments present special financial risks. Defaults on the loans, nonpayment and prepayment
of principal could affect the valuation of the portfolio’s holdings.
Short sales theoretically involve unlimited loss potential since the market price of securities sold short may
continuously increase.
The Fund’s ability to invest in high-yield debt securities (or junk securities) generally subjects the Fund to greater
risk. The use of leverage involves certain risks, such as greater volatility of the NAV of the Fund’s shares and the
nonpayment of dividends.
Quality Breakdown as of 12/31/2014 (%)(1)(2)
BBB
BB
B
CCC
C
D
Not Rated
Top 5 Sectors as of 12/31/2014 (%)(1)(2)
2.3
22.3
43.6
7.7
0.1
0.4
23.6
Media & Telecommunications
20.5
Service
19.9
Financial
16.0(3)
Utility
9.6
Information Technology
9.5
Top 10 Holdings as of 12/31/2014 (%)(1)(2)
Media General, Inc. (Common Stocks & Exchange-Traded Funds)
Metro-Goldwyn-Mayer, Inc., Class A (Common Stocks & Exchange-Traded Funds)
Texas Competitive Electric Holdings Co. LLC 4.65%, 10/10/17(U.S. Senior Loans)
Weight Watchers International, Inc. 4.00%, 04/02/20(U.S. Senior Loans)
CCS Medical, Inc. —, 03/31/15(U.S. Senior Loans)
Avaya, Inc. 6.50%, 03/30/18(U.S. Senior Loans)
Dell International LLC 4.50%, 04/29/20(U.S. Senior Loans)
Ocwen Loan Servicing 5.00%, 02/15/18(U.S. Senior Loans)
SUPERVALU, Inc. 4.50%, 03/21/19(U.S. Senior Loans)
Azure Midstream Energy LLC 6.50%, 11/15/2018(U.S. Senior Loans)
5.3
5.1
3.4
2.9
2.6
2.4
2.0
1.8
1.8
1.8
The Fund is non-diversified and may invest a larger portion of its assets in the securities of fewer issuers than if the Fund
was diversified.
Please refer to Note 9, Disclosure of Significant Risks and Contingencies, for more information.
(1)
Quality is calculated as a percentage of total senior loans, collateralized loan obligations and corporate notes and bonds. Sectors and holdings
are calculated as a percentage of total assets. The quality ratings reflected were issued by Standard & Poors, a nationally recognized statistical rating organization. Credit quality ratings assigned by a rating agency are subjective opinions, not statements of fact, and are subject to
change, including daily. The ratings assigned by credit rating agencies are but one of the considerations that the Fund’s investment adviser
incorporates into its credit analysis process, along with such other issuer-specific factors as cash flows, capital structure and leverage ratios,
ability to de-leverage through free cash flow, quality of management, market positioning and access to capital, as well as such securityspecific factors as the terms of the security (e.g., interest rate, and time to maturity) and the amount of any collateral. Quality ratings reflect
the credit quality of the underlying loans and bonds in the Fund’s portfolio and not the Fund itself. Quality ratings are subject to change.
(2)
Excludes the Fund’s investment in an investment company purchased with cash collateral from securities lending.
(3)
Includes Collateralized Loan Obligations
Semi-Annual Report
3
FUND PROFILE (unaudited)
Highland Opportunistic Credit Fund
Objective
Highland Opportunistic Credit Fund (the “Fund”) seeks to achieve high total returns while minimizing
losses.
Net Assets as of December 31, 2014
$30.4 million
Portfolio Data as of December 31, 2014
The information below provides a snapshot of the Fund at the end of the reporting period. The Fund
is actively managed and the composition of its portfolio will change over time.
Quality Breakdown as of 12/31/2014 (%)(1)
Top 5 Sectors as of 12/31/2014 (%)(1)(2)
B
14.3
Utility
49.6
CCC
26.9
Sovereign Bonds
21.1
D
31.4
Service
8.5
27.4
Telecommunication Services
8.2
Healthcare
7.2
Not Rated
Top 10 Holdings as of 12/31/2014 (%)(1)(2)
Texas Competitive Electric Holdings Co. LLC 4.65%, 10/10/17 (U.S. Senior Loans)
28.2
Ocean Rig UDW, Inc. 7.25%, 04/01/19(Corporate Bonds & Notes)
11.7
Argentine Republic Government International Bond 8.28%, 12/31/33 (Sovereign
Bonds)
8.3
Argentine Republic Government International Bond 8.28%, 12/31/33 (Sovereign
Bonds)
8.1
Surgery Center Holdings, Inc. 8.50%, 11/03/21 (U.S. Senior Loans)
7.1
Travelport Finance S.a.r.l. 6.00%, 09/02/21 (U.S. Senior Loans)
6.0
iHeartCommunications, Inc. PIK 14.00%, 02/01/21 (Corporate Bonds & Notes)
5.4
Euramax International, Inc. (Common Stocks)
5.2
Argentine Republic Government International Bond 7.82%, 12/31/33 (Sovereign
Bonds)
4.7
Corning, Inc. (Common Stocks)
3.7
The Fund is non-diversified and may invest a larger portion of its assets in the securities of fewer issuers
than if the Fund was diversified.
Please refer to Note 9, Disclosure of Significant Risks and Contingencies, for more information.
(1)
Quality is calculated as a percentage of total senior loans and corporate bonds & notes. Sectors and holdings are calculated
as a percentage of total net assets. The quality ratings reflected were issued by Standard & Poors, a nationally recognized
statistical rating organization. Ratings are measured on a scale that generally ranges from AAA (highest) to D (lowest). Quality
ratings reflect the credit quality of the underlying bonds in the Fund’s portfolio and not that of the Fund itself. Credit quality
ratings assigned by a rating agency are subjective opinions, not statements of fact, and are subject to change, including
daily. The ratings assigned by credit rating agencies are but one of the considerations that the Fund’s investment adviser
incorporates into its credit analysis process, along with such other issuer-specific factors as cash flows, capital structure and
leverage ratios, ability to de-leverage through free cash flow, quality of management, market positioning and access to capital, as well as such security-specific factors as the terms of the security (e.g., interest rate, and time to maturity) and the
amount of any collateral. Quality Ratings are subject to change.
(2)
Excludes the Fund’s investment in an investment company purchased with cash collateral from securities lending.
4
Semi-Annual Report
FINANCIAL STATEMENTS
December 31, 2014
A guide to understanding each Fund’s financial statements
Investment Portfolio
The Investment Portfolio details each of the Fund’s holdings and their
market value as of the last day of the reporting period. Portfolio holdings
are organized by type of asset and industry to demonstrate areas of
concentration and diversification.
Statement of Assets and Liabilities
This statement details each Fund’s assets, liabilities, net assets and share
price for each share class as of the last day of the reporting period. Net
assets are calculated by subtracting all of a Fund’s liabilities (including any
unpaid expenses) from the total of the Fund’s investment and noninvestment assets. The net asset value per share for each class is
calculated by dividing net assets allocated to that share class by the
number of shares outstanding in that class as of the last day of the
reporting period.
Statement of Operations
This statement reports income earned by each Fund and the expenses
incurred by each Fund during the reporting period. The Statement of
Operations also shows any net gain or loss a Fund realized on the sales of
its holdings during the period as well as any unrealized gains or losses
recognized over the period. The total of these results represents a Fund’s
net increase or decrease in net assets from operations.
Statement of Changes in Net Assets
Statement of Cash Flows
This statement details how each Fund’s net assets were affected by its
operating results, distributions to shareholders and shareholder
transactions (e.g., subscriptions, redemptions and distribution
reinvestments) during the reporting period. The Statement of Changes in
Net Assets also details changes in the number of shares outstanding.
This statement reports net cash and foreign currency, excluding restricted
cash, provided or used by operating, investing and financing activities and
the net effect of those flows on cash and foreign currency during the
period.
Financial Highlights
The Financial Highlights demonstrate how each Fund’s net asset value per
share was affected by the Fund’s operating results. The Financial Highlights
also disclose the classes’ performance and certain key ratios (e.g., net
expenses and net investment income as a percentage of average net
assets).
Notes to Financial Statements
These notes disclose the organizational background of the Funds, certain of
their significant accounting policies (including those surrounding security
valuation, income recognition and distributions to shareholders), federal tax
information, fees and compensation paid to affiliates and significant risks
and contingencies.
Semi-Annual Report
5
INVESTMENT PORTFOLIO (unaudited)
As of December 31, 2014
Shares
Highland Long/Short Equity Fund
Value ($)
Common Stocks - 85.7%
CONSUMER DISCRETIONARY - 14.8%
253,900 Aramark ....................................
114,623 Best Buy Co., Inc. (a) ........................
17,750 Chipotle Mexican Grill, Inc. (b) ..............
162,300 Comcast Corp., Class A.....................
259,251 H&R Block, Inc. (a) ..........................
193,663 Harman International Industries, Inc. (a) ..
830,300 Hilton Worldwide Holdings, Inc. (a)(b)......
396,400 JD.com, Inc. ADR (b) ........................
Restoration Hardware Holdings,
57,100
Inc. (b)(c) ...................................
437,000 Royal Caribbean Cruises, Ltd...............
7,908,985
4,468,004
12,150,052
9,415,023
8,731,574
20,665,779
21,662,527
9,172,696
5,482,171
36,021,910
135,678,721
CONSUMER STAPLES - 3.8%
260,423 Fresh Market, Inc. (The) (b)(c) ...............
394,800 Pinnacle Foods, Inc. ........................
107,300 Spectrum Brands Holdings, Inc. ...........
10,729,428
13,936,440
10,266,464
34,932,332
ENERGY - 1.9%
64,390 Pioneer Natural Resources Co. ............
411,465 Viper Energy Partners LP ..................
9,584,452
7,459,860
Shares
INFORMATION TECHNOLOGY - 20.7%
35,000 Akamai Technologies, Inc. (b) .............
307,148 Apple, Inc. (a) ..............................
59,200 Baidu, Inc., ADR (b) ........................
345,403 CDK Global, Inc. ...........................
213,082 CDW Corp. .................................
374,600 Facebook, Inc., Class A (a)(b) ..............
241,419 FireEye, Inc. (b)(c) ..........................
472,700 Micron Technology, Inc. (b) ...............
245,650 NXP Semiconductor NV (a)(b) .............
774,100 Rackspace Hosting, Inc. (a)(b) ............
157,800 ServiceNow, Inc. (b) .......................
TELECOMMUNICATION SERVICES - 1.0%
SBA Communications Corp.,
84,032
Class A (a)(b) .............................
9,307,384
Total Common Stocks
(Cost $746,545,884) ..................
786,700,734
Contracts
Purchased Call Options (d) - 0.1%
4,500
1,250
35,103,393
17,151,341
37,054,868
16,098,636
9,323,140
27,309,055
23,656,134
18,796,973
18,727,183
5,727,586
13,809,696
9,688,338
232,446,343
HEALTHCARE - 10.6%
89,882 Acadia Healthcare Co., Inc. (a)(b)(c) ........
107,817 Actavis PLC (a)(b) ...........................
77,687 HCA Holdings, Inc. (b).......................
179,139 McKesson Corp. (a) .........................
Valeant Pharmaceuticals International,
146,400
Inc. (b) .....................................
INDUSTRIALS - 7.6%
49,400 FedEx Corp. (a) ..............................
333,199 Pendrell Corp. (b) ...........................
106,752 Precision Castparts Corp. ..................
830,828 Southwest Airlines Co. (a) ..................
Best Buy Co., Inc., Strike price $40.00,
expires 01/17/15 ........................
Micron Technology, Inc., Strike price
$36.00, expires 01/17/15 ...............
Total Purchased Call Options
(Cost $890,770) .......................
720,000
126,250
846,250
Shares
Registered Investment Companies (e) - 1.0%
830,975
Highland Energy MLP Fund ..............
9,248,748
Total Registered Investment
Companies
(Cost $10,209,012) ....................
9,248,748
Investment Companies (f) - 3.5%
32,616,209
State Street Navigator Prime Securities
Lending Portfolio ........................
32,616,209
Total Investment Companies
(Cost $32,616,209) ....................
32,616,209
5,501,677
27,753,174
5,701,449
37,185,674
Total Investments - 90.3% .............................
(Cost $790,261,875) (g)
20,951,304
Common Stocks & Exchange-Traded Funds - (26.5)%
97,093,278
CONSUMER DISCRETIONARY - (5.4)%
15,300 Amazon.com, Inc. (i) .......................
59,200 Big Lots, Inc. ...............................
180,000 BorgWarner, Inc. ..........................
129,654 Carnival Corp. .............................
128,500 Diamond Resorts International, Inc. (i) ...
36,232 Gentherm, Inc. (i) ..........................
15,000 Polaris Industries, Inc......................
178,035 Remy International, Inc. ..................
8,578,804
459,814
25,714,422
35,160,641
69,913,681
6
2,203,600
33,902,996
13,495,824
14,078,627
7,494,094
29,226,292
7,624,012
16,549,227
18,767,660
36,235,621
10,706,730
190,284,683
17,044,312
FINANCIAL - 25.3%
733,920 CIT Group, Inc. (a) ...........................
707,126 E*TRADE Financial Corp. (b) ................
1,075,613 FNF Group (a) ...............................
1,022,785 FNFV Group (b)..............................
578,000 Janus Capital Group, Inc. (c) ...............
511,693 Legg Mason, Inc. (a) ........................
265,859 McGraw Hill Financial, Inc. (a) ..............
NorthStar Asset Management
832,830
Group, Inc. ................................
1,065,255 NorthStar Realty Finance Corp., REIT (a) ..
467,940 RCS Capital Corp., Class A (a)(c) ............
310,400 Realogy Holdings Corp. (b) .................
183,700 Ryman Hospitality Properties, REIT .......
Value ($)
See accompanying Notes to Financial Statements.
829,411,941
Securities Sold Short (h) - (26.5)%
(4,748,355)
(2,369,184)
(9,891,000)
(5,877,216)
(3,585,150)
(1,326,816)
(2,268,600)
(3,724,492)
INVESTMENT PORTFOLIO (unaudited) (continued)
As of December 31, 2014
Shares
Highland Long/Short Equity Fund
Value ($)
Securities Sold Short (continued)
Common Stocks & Exchange-Traded Funds (continued)
CONSUMER DISCRETIONARY (continued)
Starwood Hotels & Resorts
89,600
Worldwide, Inc. .............................
5,200 Swatch Group AG (The).......................
43,000 TripAdvisor, Inc. (i) ............................
175,000 Vipshop Holdings, Ltd. ADR (i) ................
Shares
INFORMATION TECHNOLOGY (continued)
135,300 QUALCOMM, Inc. .............................
111,000 SanDisk Corp. .................................
Total Common Stocks & ExchangeTraded Funds (Proceeds
$236,948,718) ............................
(243,454,328)
Total Securities Sold Short
(Proceeds $236,948,718) ................
(243,454,328)
Other Assets & Liabilities, Net - 36.2% ................
332,006,294
Net Assets - 100.0% ....................................
917,963,907
(7,263,872)
(2,311,411)
(3,210,380)
(3,419,500)
CONSUMER STAPLES - (0.4)%
68,000 Whole Foods Market, Inc. ....................
(3,428,560)
FINANCIAL - (6.8)%
33,600 Allianz SE......................................
104,100 BofI Holding, Inc. (i) ...........................
54,500 Canadian Imperial Bank of Commerce .....
375,000 Financial Select Sector SPDR Fund, ETF .....
33,700 Goldman Sachs Group, Inc. (The) ............
110,200 iShares US Real Estate, ETF ..................
75,946 LPL Financial Holdings, Inc. ..................
134,000 Raymond James Financial, Inc. .............
67,500 Royal Bank of Canada .......................
52,900 T Rowe Price Group, Inc. .....................
(5,565,039)
(8,100,021)
(4,697,846)
(9,273,750)
(6,532,071)
(8,467,768)
(3,383,394)
(7,676,860)
(4,676,193)
(4,541,994)
(a)
(b)
(c)
(d)
(e)
(f)
(62,914,936)
(g)
(h)
(2,709,543)
(2,651,480)
(1,845,800)
(7,206,823)
INDUSTRIALS - (6.0)%
74,946 Avis Budget Group, Inc. (i) ....................
91,400 CSX Corp. .....................................
70,000 Dover Corp. ...................................
90,202 Generac Holdings, Inc. (i) .....................
85,000 JB Hunt Transport Services, Inc. .............
92,300 Norfolk Southern Corp........................
87,828 Sensata Technologies Holding NV (i) ........
85,000 Swift Transportation Co. (i) ...................
40,100 United Continental Holdings, Inc. (i) .........
140,160 United Stationers, Inc. ........................
15,922 Valmont Industries, Inc. ......................
23,400 WABCO Holdings, Inc. (i)......................
(10,056,849)
(10,875,780)
(65,006,948)
(49,995,976)
HEALTHCARE - (0.8)%
41,405 AbbVie, Inc. ...................................
52,000 ICON PLC (i) ...................................
10,000 Illumina, Inc. (i) ................................
Value ($)
(4,971,168)
(3,311,422)
(5,020,400)
(4,217,846)
(7,161,250)
(10,117,003)
(4,603,065)
(2,433,550)
(2,682,289)
(5,909,146)
(2,022,094)
(2,451,852)
(i)
All or part of this security is pledged as collateral for short sales. The market
value of the securities pledged as collateral was $255,580,004.
Non-income producing security.
Securities (or a portion of securities) on loan. As of December 31, 2014, the
market value of securities loaned was $37,547,859. The loaned securities were
secured with cash and securities collateral of $38,771,198. Collateral is
calculated based on prior day’s prices. See Note 4.
Options are shown at market value.
Affiliated issuer. Assets with a total aggregate market value of $9,248,748, or
1.0% of net assets, were affiliated with the Fund as of December 31, 2014.
Represents investments of cash collateral received in connection with
securities lending.
Cost for U.S. federal income tax purposes is $809,314,490.
As of December 31, 2014, $201,043,427 in cash was segregated or on deposit
with the brokers to cover investments sold short and is included in “Other
Assets & Liabilities, Net.”
No dividend payable on security sold short.
Glossary:
ADR
ETF
MLP
PLC
REIT
SPDR
American Depositary Receipt
Exchange-Traded Fund
Master Limited Partnership
Public Limited Company
Real Estate Investment Trust
Standard & Poor’s Depositary Receipt
The Fund had the following futures contracts, brokered by Merrill Lynch, for
which $1,334,000 was pledged as collateral, open at December 31, 2014:
Description
Expiration
Date
Number
of
Contracts
Notional
Value
Unrealized
Appreciation
(Depreciation)
Short Future:
S&P 500 E-Mini Index
March 2015
315
$32,325,300
$(361,376)
(54,901,085)
INFORMATION TECHNOLOGY - (7.1)%
70,000 Arista Networks, Inc. (i) .......................
35,000 Dealertrack Technologies, Inc. (i) ............
58,000 eBay, Inc. (i) ...................................
Fairchild Semiconductor International,
279,200
Inc. (i) ........................................
130,100 GrubHub, Inc. (i)...............................
170,100 Market Vectors Semiconductor, ETF ........
124,900 NCR Corp. (i)...................................
123,190 Paychex, Inc. .................................
67,400 Powershares QQQ Trust Series 1, ETF .......
(4,253,200)
(1,550,850)
(3,254,960)
(4,712,896)
(4,725,232)
(9,290,862)
(3,639,586)
(5,687,683)
(6,959,050)
The Fund had the following written call options contracts outstanding,
brokered by Morgan Stanley, for which $13,870,000 was pledged as
collateral, at December 31, 2014:
Description
CBS Corp.
CBS Corp.
Exercise
Price
Expiration
Date
$75.00
70.00
January 2015
January 2015
Number
of
Contracts Premium
4,000
1,500
Value
$396,511 $(20,000)
224,890
(7,500)
$621,401 $(27,500)
See accompanying Notes to Financial Statements.
7
INVESTMENT PORTFOLIO (unaudited)
As of December 31, 2014
Principal Amount ($)
Highland Long/Short Healthcare Fund
Value ($)
HEALTHCARE - 1.1%
Total U.S. Senior Loans
(Cost $4,396,591) .........................
4,301,250
4,301,250
Common Stocks - 74.7%
FINANCIAL - 0.9%
34,724 Aon PLC .....................................
8,076,184
Healthcare Services - 11.3%
124,400 Civitas Solutions, Inc. (c)(d) .................
3,982,699 CNS Response, Inc. (c)(e) ...................
174,200 ExamWorks Group, Inc. (b)(c)...............
79,976 Express Scripts Holding Co. (c) .............
Laboratory Corp. of America
94,737
Holdings (b)(c) .............................
194,868 LHC Group, Inc. (b)(c) .......................
87,100 Quest Diagnostics, Inc. (d) ..................
74,600 Team Health Holdings, Inc. (b)(c) ...........
2,118,532
775,033
7,244,978
6,771,568
10,222,123
6,075,984
5,840,926
4,291,738
43,340,882
3,292,877
HEALTHCARE - 70.6%
Biotechnology - 9.4%
49,800 Acceleron Pharma, Inc. (c) .................
79,415 Alkermes PLC (b)(c) .........................
157,000 Aquinox Pharmaceuticals, Inc. (c) .........
18,700 Celgene Corp. (c)............................
186,600 Exact Sciences Corp. (c)(d) .................
32,535 Fate Therapeutics, Inc. (c) ..................
21,601 Intercept Pharmaceuticals, Inc. (c)(d) ......
237,822 Keryx Biopharmaceuticals, Inc. (c)(d) ......
127,500 Minerva Neurosciences, Inc. (c)(d) .........
566,609 Oncothyreon, Inc. (c)(d) .....................
35,491 Otonomy, Inc. (c)(d) .........................
48,772 Portola Pharmaceuticals, Inc. (c)...........
209,824 ProQR Therapeutics NV (c) .................
211,500 Raptor Pharmaceutical Corp. (c)(d) ........
222,247 Sarepta Therapeutics, Inc. (c)(d)............
7,610,184
10,341,727
41,872,765
Shares
CONSUMER DISCRETIONARY - 2.1%
355,779 Service Corp. International (b) .............
Value ($)
Healthcare Facilities (continued)
Universal Health Services, Inc.,
68,400
Class B (b) .................................
212,051 VCA, Inc. (b)(c) ...............................
U.S. Senior Loans (a) - 1.1%
Healthcare Facilities – 1.1%
Surgery Center Holdings, Inc.
Second Lien Term Loan
4,440,000
8.50%, 11/03/2021 .......................
Shares
1,940,208
4,650,543
1,177,500
2,091,782
5,120,304
163,651
3,369,756
3,365,181
770,100
1,076,557
1,182,915
1,381,223
4,546,886
2,224,980
3,215,914
36,277,500
Healthcare Supplies - 2.4%
287,143 LDR Holding Corp. (b)(c) ....................
9,412,548
Healthcare Technology - 0.8%
38,084 Medidata Solutions, Inc. (c)(d) ..............
252,782 Streamline Health Solutions, Inc. (c) .......
1,818,511
1,094,546
2,913,057
Life Sciences Tools & Services - 5.5%
231,820 Albany Molecular Research, Inc. (c)(d) .....
12,233 Fluidigm Corp. (c)(d) ........................
102,000 ICON PLC (b)(c) ..............................
45,398 Illumina, Inc. (b)(c)...........................
132,011 NanoString Technologies, Inc. (b)(c)(d) .....
12,786 Thermo Fisher Scientific, Inc. ..............
3,774,030
412,619
5,200,980
8,379,563
1,838,913
1,601,958
21,208,063
Managed Healthcare - 4.9%
91,122 Aetna, Inc. (b) ...............................
75,228 Humana, Inc. (b) ............................
8,094,367
10,804,998
18,899,365
Healthcare Distributors - 1.6%
77,650 Cardinal Health, Inc. (b) ....................
Healthcare Equipment - 14.3%
211,860 Abbott Laboratories (b).....................
91,099 ABIOMED, Inc. (c)............................
421,187 Amedica Corp. (c) ...........................
48,500 Edwards Lifesciences Corp. (c) .............
1,068,076 Genesys Ventures IA, LP (e) ................
201,621 Globus Medical, Inc., Class A (b)(c) .........
169,341 Hill - Rom Holdings, Inc. (b) .................
149,300 Medtronic, Inc. (b)(d) ........................
249,878 NuVasive, Inc. (b)(c)(d) ......................
6,268,684
9,537,937
3,467,228
336,950
6,177,930
152,628
4,792,531
7,725,336
10,779,460
11,784,247
54,754,247
Pharmaceuticals - 9.5%
15,200 Actavis PLC (c) ..............................
90,695 Akorn, Inc. (c)(d) .............................
178,817 Aratana Therapeutics, Inc. (b)(c) ...........
186,645 Cempra, Inc. (c)(d)...........................
133,139 Endocyte, Inc. (c)(d) .........................
99,500 Flamel Technologies SA ADR (c) ...........
29,573 Pacira Pharmaceuticals, Inc. (c)(d) .........
92,042 Repros Therapeutics, Inc. (c) ...............
Valeant Pharmaceuticals
56,964
International, Inc. (c) ......................
136,900 Zoetis, Inc. ..................................
36,334 ZS Pharma, Inc. (c)(d) .......................
3,912,632
3,283,159
3,186,519
4,388,024
837,444
1,704,435
2,621,942
917,659
8,152,118
5,890,807
1,510,404
36,405,143
Healthcare Facilities - 10.9%
67,194 Adcare Health Systems, Inc. (b)(c)(d) .......
182,097 Brookdale Senior Living, Inc. (b)(c) .........
99,500 HCA Holdings, Inc. (b)(c) ....................
68,447 HealthSouth Corp. ..........................
387,191 Kindred Healthcare, Inc. ...................
8
269,448
6,677,497
7,302,305
2,632,472
7,039,132
See accompanying Notes to Financial Statements.
281,721,315
INDUSTRIALS - 1.1%
37,300 Towers Watson & Co., Class A .............
4,221,241
Total Common Stocks
(Cost $276,337,672).......................
286,942,556
INVESTMENT PORTFOLIO (unaudited) (continued)
As of December 31, 2014
Units
Highland Long/Short Healthcare Fund
Value ($)
Shares
Value ($)
Rights (c) - 0.1%
Securities Sold Short (i) - (33.3)%
HEALTHCARE - 0.1%
Common Stocks & Exchange - Traded Funds - (33.3)%
Healthcare Equipment - 0.1%
69,326 Wright Medical Group, Inc. ...............
331,378
Total Rights
(Cost $188,242) ..........................
331,378
Warrants (c) - 0.8%
HEALTHCARE - 0.8%
Biotechnology - 0.2%
Discovery Laboratories, Inc.,
94,204
expires 02/16/2016 .....................
MediciNova, Inc.,
121,816
expires 03/24/2016 .....................
Threshold Pharmaceuticals, Inc.,
271,081
expires 03/11/2016 .....................
25,763
90,808
431,721
HEALTHCARE - (31.9)%
Biotechnology - (13.4)%
30,565 Alexion Pharmaceuticals, Inc. (j) .............
90,242 Alnylam Pharmaceuticals, Inc. (j) ............
77,225 Gilead Sciences, Inc. (j) .......................
151,708 ImmunoGen, Inc. (j) ...........................
83,200 Incyte Corp., Ltd. (j) ...........................
217,926 Intrexon Corp. (j) ..............................
iShares Nasdaq Biotechnology Index
17,000
Fund, ETF ....................................
68,200 Isis Pharmaceuticals, Inc. (j) ..................
753,078 MannKind Corp. (j) ............................
24,090 Receptos, Inc. (j) ..............................
199,600 Threshold Pharmaceuticals, Inc. (j) ..........
8,348
29,071
Healthcare Equipment - (7.3)%
30,340 Cardiovascular Systems, Inc. (j) ..............
13,583 IDEXX Laboratories, Inc. (j) ...................
232,800 ResMed, Inc. ..................................
139,744 Varian Medical Systems, Inc. (j) ..............
3,359
2,349,005
11,777
Healthcare Services - (0.9)%
30,852 Chemed Corp. ................................
(3,260,131)
Healthcare Technology - (2.6)%
45,177 athenahealth, Inc. (j) ..........................
17,038 Computer Programs & Systems, Inc. ........
113,579 HMS Holdings Corp. (j) ........................
(6,582,289)
(1,035,058)
(2,401,060)
(10,018,407)
2,364,141
Total Warrants
(Cost $—) .................................
2,949,852
Managed Healthcare - (0.5)%
14,752 Anthem, Inc. ..................................
(1,853,884)
2,949,852
Pharmaceuticals - (7.2)%
91,594 AbbVie, Inc. ...................................
230,000 Horizon Pharma PLC (j) .......................
113,065 Johnson & Johnson ..........................
248,840 Medicines Co. (The) (j) .........................
(5,993,911)
(2,964,700)
(11,823,207)
(6,885,403)
Contracts
Purchased Call Options (f) - 0.0%
HEALTHCARE - 0.0%
Pharmaceuticals - 0.0%
Achillion Pharmaceuticals, Inc.,
750
Strike price $15.00, expires 01/15/15 ..
Total Purchased Call Options
(Cost $241,974) ..........................
(27,667,221)
(122,442,975)
21,750
INDUSTRIALS - (1.4)%
108,780 Advisory Board Co. (The) (j) ...................
(5,328,045)
Total Common Stocks & Exchange Traded Funds
(Proceeds $124,642,385) ...................
(127,771,020)
Total Securities Sold Short
(Proceeds $124,642,385) ...................
(127,771,020)
Other Assets & Liabilities, Net - 50.0% ................
191,938,547
Net Assets - 100.0% ....................................
384,161,337
21,750
Shares
Investment Companies (g) - 6.6%
25,447,024
State Street Navigator Prime Securities
Lending Portfolio ........................
25,447,024
Total Investment Companies
(Cost $25,447,024).......................
25,447,024
Total Investments - 83.3% .............................
(Cost $306,611,503) (h)
(912,627)
(2,013,951)
(13,050,768)
(12,089,254)
(28,066,600)
37,419
Pharmaceuticals - 0.6%
ADVENTRX Pharmaceuticals, Inc.,
37,955
expires 01/07/2016 .....................
Horizon Pharmaceuticals,
252,549
expires 09/20/2017 .....................
Neostem, Inc.,
521,727
expires 07/19/2016 .....................
(5,156,950)
(4,210,668)
(3,927,302)
(2,951,266)
(634,728)
(51,576,732)
548,292
Life Sciences Tools & Services - 0.0%
Pluristem Therapeutics, Inc.
40,000
expires 01/27/2016 .....................
pSivida Corp.,
30,000
expires 01/19/2016 .....................
(5,655,442)
(8,753,474)
(7,279,228)
(925,419)
(6,082,752)
(5,999,503)
319,993,810
(a)
Senior loans (also called bank loans, leveraged loans, or floating rate loans) in
which the Fund invests generally pay interest at rates which are periodically
See accompanying Notes to Financial Statements.
9
INVESTMENT PORTFOLIO (unaudited) (continued)
As of December 31, 2014
(b)
(c)
(d)
(e)
(f)
(g)
(h)
(i)
(j)
determined by reference to a base lending rate plus a spread (unless
otherwise identified, all senior loans carry a variable rate of interest). These
base lending rates are generally (i) the Prime Rate offered by one or more
major United States banks, (ii) the lending rate offered by one or more
European banks such as the London Interbank Offered Rate (“LIBOR”) or (iii) the
Certificate of Deposit rate. Rate shown represents the weighted average rate
at December 31, 2014. Senior loans, while exempt from registration under the
Securities Act of 1933 (the “1933 Act”), contain certain restrictions on resale
and cannot be sold publicly. Senior secured floating rate loans often require
prepayments from excess cash flow or permit the borrower to repay at its
election. The degree to which borrowers repay, whether as a contractual
requirement or at their election, cannot be predicted with accuracy. As a
result, the actual remaining maturity may be substantially less than the stated
maturity shown.
All or part of this security is pledged as collateral for short sales. The market
value of the securities pledged as collateral was $96,516,278.
Non-income producing security.
Securities (or a portion of securities) on loan. As of December 31, 2014, the
market value of securities loaned was $30,204,867. The loaned securities were
secured with cash and securities collateral of $31,205,287. Collateral is
calculated based on prior day’s prices. See Note 4.
Represents fair value as determined by the Fund’s Board of Trustees (the
“Board”), or its designee in good faith, pursuant to the policies and procedures
approved by the Board. Securities with a total aggregate value of $927,661, or
0.2% of net assets, were fair valued under the Fund’s valuation procedures as
of December 31, 2014.
Options are shown at market value.
Represents investments of cash collateral received in connection with
securities lending.
Cost for U.S. federal income tax purposes is $320,959,953.
As of December 31, 2014, $65,193,319 in cash was segregated or on deposit
with the brokers to cover investments sold short and is included in “Other
Assets & Liabilities, Net.”
No dividend payable on security sold short.
Glossary:
ADR
American Depositary Receipt
ETF
Exchange-Traded Fund
PLC
Public Limited Company
10
See accompanying Notes to Financial Statements.
Highland Long/Short Healthcare Fund
INVESTMENT PORTFOLIO (unaudited)
As of December 31, 2014
Principal Amount ($)
Highland Floating Rate Opportunities Fund
Value ($)
FOOD & DRUG - 1.5%
SUPERVALU, Inc.
New Term Loan
13,599,814
4.50%, 03/21/2019 ......................
U.S. Senior Loans (a) - 68.4%
AEROSPACE - 1.0%
B/E Aerospace, Inc
Term Loan
1,904,762
4.00%, 12/16/2021 ......................
Sequa Corp.
Initial Term Loan
6,934,305
5.25%, 06/19/2017 ......................
1,900,952
6,764,415
8,665,367
BROADCASTING - 0.5%
Comcorp Broadcasting, Inc.
Term Loan B
4,418,190
5.76%, 04/01/2015 ......................
CHEMICALS - 3.8%
Arysta LifeScience Corp.
Second Lien Initial Term Loan
5,750,000
8.25%, 11/30/2020 ......................
Axalta Coating Systems Dutch Holding
B BV and Axalta Coating Systems US
Holdings, Inc.
Refinanced Term Loan B
9,448,253
3.75%, 02/01/2020 ......................
MacDermid, Inc.
Tranche B First Lien Term Loan
7,067,418
4.00%, 06/07/2020 ......................
Univar, Inc. Term Loan B
12,259,872
06/30/2017 (b) ...........................
Principal Amount ($)
FOREST PRODUCTS & CONTAINERS - 1.7%
BWAY Holding Company, Inc.
Initial Term Loan
9,590,361
5.55%, 08/14/2020 ......................
Signode Industrial Group US, Inc.
Initial Term Loan B
5,555,556
3.75%, 05/01/2021 ......................
CONSUMER PRODUCTS - 1.1%
SRAM LLC
First Lien Term Loan
9,651,315
4.01%, 04/10/2020 ......................
ENERGY - 3.4%
Arch Coal, Inc.
8,749,345
Term Loan 05/16/2018 (b) ..............
Azure Midstream Energy LLC
14,303,316
Term Loan 11/15/2018 (b) ..............
Chief Exploration & Development LLC
Second Lien Term Loan
8,333,333
7.50%, 05/12/2021 ......................
Fieldwood Energy LLC
Closing Date Second Lien Term Loan
3,430,240
09/30/2020 (b) ...........................
4,418,190
5,746,406
9,228,298
6,941,547
11,895,447
3,124,676
9,385,904
7,272,893
12,872,985
7,541,667
2,531,946
30,219,491
FINANCIAL - 2.8%
National Financial Partners Corp.
Refinancing Term Loan
10,938,191
4.50%, 07/01/2020 ......................
Ocwen Loan Servicing Initial
14,224,753
Term Loan 02/15/2018 (b) ..............
13,402,481
9,578,373
5,329,889
14,908,262
GAMING & LEISURE - 2.4%
Ginn-LA CS Borrower LLC
First Lien Tranche A
22,925,890
Credit-Linked Deposit (c) ................
49,138,954
First Lien Tranche B Term Loan (c)......
7,000,000
Second Lien Term Loan (c)(d) ...........
LLV Holdco LLC
Exit Revolving Loan
10,706,498
5.00%, 02/28/2017 (d)...................
RHP Hotel Properties, LP
Tranche B Term Loan
970,732
3.75%, 01/15/2021 ......................
Scientific Games International, Inc.
Initial Term Loan
12,711,246
6.00%, 10/18/2020 ......................
33,811,698
CONSUMER DISCRETIONARY - 0.4%
FGI Operating Co. LLC
Term Loan B
3,196,599
5.50%, 04/19/2019 ......................
Value ($)
458,518
982,779
—
5,938,894
970,732
12,561,889
20,912,812
HEALTHCARE - 6.0%
Biomet, Inc.
Dollar Term Loan B-2
5,468,130
3.67%, 07/25/2017 ......................
CCS Medical, Inc.
31,146,760
First Lien Term Loan (c)(d) ...............
DaVita HealthCare Partners, Inc.
Tranche B Term Loan
4,159,294
3.50%, 06/24/2021 ......................
Kinetic Concepts, Inc.
Dollar Term Loan E-1
5,272,495
4.00%, 05/04/2018 ......................
Onex Carestream Finance LP
First Lien Term Loan
4,055,514
06/07/2019 (b) ...........................
Second Lien Term Loan
6,808,501
9.50%, 12/07/2019 ......................
Surgery Center Holdings, Inc.
First Lien Initial Term Loan
4,486,486
5.25%, 11/03/2020 ......................
Second Lien Term Loan
3,700,000
8.50%, 11/03/2021 ......................
5,451,042
19,404,431
4,126,207
5,208,777
4,047,059
6,784,399
4,379,932
3,584,375
52,986,222
10,856,155
13,412,093
24,268,248
HOUSING - 0.9%
EH/Transeastern LLC/TE TOUSA
8,000,000
Term Loan (c)(d)..........................
LBREP/L-SunCal Master I LLC
7,427,359
First Lien Term Loan (c)(d) ...............
4,000,000
221,335
See accompanying Notes to Financial Statements.
11
INVESTMENT PORTFOLIO (unaudited) (continued)
As of December 31, 2014
Principal Amount ($)
Highland Floating Rate Opportunities Fund
Value ($)
Principal Amount ($)
U.S. Senior Loans (continued)
HOUSING (continued)
Nevada Land Group LLC
First Lien Initial Term Loan
2,944,203
40.17%, 11/10/2015 ....................
Second Lien Initial Term Loan
2,377,775
10.00%, 11/12/2015 (d) .................
2,863,237
600,389
7,684,961
INFORMATION TECHNOLOGY - 7.5%
Avaya, Inc.
Replacement Term Loan B-6
17,514,460
6.50%, 03/30/2018 ......................
Dell International LLC
Term Loan B
14,675,152
4.50%, 04/29/2020 ......................
Freescale Semiconductor, Inc.
Tranche B-5 Term Loan
10,637,370
5.00%, 01/15/2021 ......................
Kronos, Inc.
First Lien Incremental Term Loan
8,633,371
4.50%, 10/30/2019 ......................
Second Lien Term Loan
4,913,372
9.75%, 04/30/2020 ......................
RP Crown Parent LLC
First Lien New Term Loan
10,597,665
6.00%, 12/21/2018 ......................
17,288,173
14,665,980
10,642,689
8,585,197
5,011,639
9,902,246
66,095,924
MANUFACTURING - 3.5%
Dealer Tire, LLC
Initial Term Loan
5,050,505
12/17/2021 (b) ...........................
Doncasters U.S. Finance LLC
Term Loan B
8,561,659
4.50%, 04/09/2020 ......................
Second Lien Term Loan
4,413,793
9.50%, 10/09/2020 ......................
Doosan Infracore International, Inc.
Tranche B Term Loan
1,836,154
4.50%, 05/28/2021 ......................
Filtration Group Corp.
Second Lien Initial Term Loan
480,000
8.25%, 11/21/2021 ......................
Silver II US Holdings, LLC
Refinancing Term Loan
4,714,084
12/13/2019 (b) ...........................
Veyance Technologies, Inc.
Term Loan
6,099,652
5.25%, 09/08/2017 ......................
5,031,566
8,524,245
4,375,172
1,826,973
480,602
4,398,830
6,092,027
30,729,415
MEDIA & TELECOMMUNICATIONS - 9.3%
Charter Communications Operating, LLC
Term Loan G
3,555,556
4.25%, 09/12/2021 ......................
Cumulus Media Holdings, Inc.
Term Loan
7,282,598
4.25%, 12/23/2020 ......................
Endurance Business Media, Inc.
2,257,636
Term Loan (c)(d)..........................
12
3,582,791
7,085,349
—
See accompanying Notes to Financial Statements.
MEDIA & TELECOMMUNICATIONS (continued)
iHeartCommunications, Inc.
Tranche D Term Loan
6.92%, 01/30/2019 ......................
13,571,427
IMC OP, LP
First Lien Term Loan
5.25%, 08/15/2020 ......................
7,000,000
Integra Telecom Holdings, Inc.
Term Loan B
5.25%, 02/22/2019 ......................
10,187,133
Level 3 Financing, Inc.
Tranche B Term Loan
4.00%, 01/15/2020 ......................
5,000,000
Tranche B Term Loan
4.50%, 01/31/2022 ......................
705,882
Tranche B-III Term Loan
4.00%, 08/01/2019 ......................
2,000,000
Media General, Inc.
Term Loan B
4.25%, 07/31/2020 ......................
5,159,050
Mediacom Illinois LLC
Tranche G Term Loan
3.75%, 06/30/2021 ......................
7,041,176
Metro-Goldwyn-Mayer, Inc.
Second Lien Term Loan
5.13%, 06/26/2020 ......................
3,000,000
Tribune Co.
Initial Term Loan
4.00%, 12/27/2020 ......................
4,581,680
Tribune Publishing Co.
Initial Term Loan
5.75%, 07/07/2021 ......................
2,772,596
TWCC Holding Corp.
Second Lien Term Loan
7.00%, 06/26/2020 ......................
7,223,000
Univision Communications, Inc.
Incremental Term Loan
4.00%, 03/01/2020 ......................
5,170,927
Value ($)
12,827,373
7,013,125
9,938,873
4,968,750
707,647
1,988,760
5,112,283
6,900,353
2,970,000
4,525,853
2,744,870
6,946,142
5,067,509
82,379,678
METALS & MINERALS - 0.4%
Walter Energy, Inc.
Term Loan B
7.25%, 04/02/2018 ......................
4,869,214
RETAIL - 4.2%
Academy, Ltd.
Initial Term Loan
08/03/2018 (b) ...........................
4,974,522
Albertson’s LLC
Term Loan B-4
08/25/2021 (b) ...........................
10,000,000
JC Penney Corp., Inc.
Term Loan
5.00%, 06/20/2019 ......................
608,232
Term Loan
6.00%, 05/22/2018 ......................
12,474,129
Men’s Wearhouse, Inc.
(The) Tranche B Term Loan
06/18/2021 (b) ...........................
9,474,766
3,800,689
4,910,003
10,016,700
586,335
12,271,424
9,451,080
37,235,542
INVESTMENT PORTFOLIO (unaudited) (continued)
As of December 31, 2014
Principal Amount ($)
Highland Floating Rate Opportunities Fund
Value ($)
U.S. Senior Loans (continued)
SERVICE - 12.3%
Acosta Holdco, Inc.
Initial Term Loan
10,230,769
5.00%, 09/26/2021 ......................
ADS Waste Holdings, Inc.
Tranche B-2 Initial Term Loan
4,520,278
3.75%, 10/09/2019 ......................
Advantage Sales & Marketing, Inc.
Delayed Draw Term Loan
426,351
4.25%, 07/23/2021 ......................
First Lien Term Loan 4.
12,790,524
25%, 07/23/2021 ........................
Second Lien Term Loan
3,840,000
7.50%, 07/25/2022 ......................
AlixPartners, LLP
First Lien Replacement Term Loan B-2
5,343,750
4.00%, 07/10/2020 ......................
Ceridian HCM Holding, Inc.
Initial Term Loan
5,065,539
4.50%, 09/15/2020 ......................
EnergySolutions LLC
Term Advance
8,983,444
6.75%, 05/29/2020 ......................
First Data Corp.
Dollar Term Loan
5,500,000
3.67%, 03/23/2018 ......................
Term Loan
1,000,000
3.67%, 09/24/2018 ......................
Maxim Crane Works, LP
Second Lien Term Loan
10.25%, 11/26/2018 ....................
7,735,294
Moneygram International, Inc.
Term Loan
4.25%, 03/27/2020 ......................
7,851,754
ServiceMaster Co. (The)
Initial Term Loan
4.25%, 07/01/2021 ......................
4,987,500
Spin Holdco, Inc.
First Lien Initial Term Loan
9,833,532
4.25%, 11/14/2019 ......................
Weight Watchers International, Inc.
Tranche B-2 Initial Term Loan
4.00%, 04/02/2020 ......................
27,905,280
10,247,190
4,401,621
422,887
12,686,601
UTILITY - 5.7%
Entegra TC LLC
Term Loan
3,239,440
9.25%, 10/02/2020 ......................
Granite Acquisition Inc.
First Lien Term Loan
4,040,948
5.00%, 10/15/2021 ......................
First Lien
Term Loan
177,802
5.00%, 10/15/2021 ......................
UTILITY (continued)
Second Lien Term Loan
2,500,000
8.25%, 10/14/2022 ......................
Southeast PowerGen, LLC
Term B Advance
1,282,051
4.50%, 11/05/2021 ......................
Texas Competitive Electric Holdings Co.
LLC
Non-Extended Term Loan
13,000,000
4.65%, 10/10/2015 ......................
Extended Term Loan
38,877,210
4.65%, 10/10/2017 ......................
TPF II LC LLC
Term Loan
5,607,477
5.50%, 10/02/2021 ......................
5,283,633
Value ($)
2,525,512
1,269,231
8,371,480
25,270,187
5,625,000
50,434,217
3,809,280
Total U.S. Senior Loans
(Cost $736,767,912) ..................
602,973,184
Principal Amount
4,999,079
Foreign Denominated or Domiciled
Senior Loans (a) - 9.1%
8,980,614
AUSTRALIA - 0.6%
USD
Aufinco Pty, Ltd.
Term Loan B
5,245,890
4.00%, 05/29/2020 ......................
5,402,045
980,500
7,812,647
7,266,798
4,906,453
9,698,371
CANADA - 2.7%
USD
Husky Injection Molding Systems, Ltd.
and Yukon Acquisition, Inc.
New Term Loan
10,100,239
06/30/2021 (b) ...........................
Second Lien Term Loan
4,631,579
7.25%, 06/30/2022 ......................
Tervita Corp.
Term Loan
4,839,967
6.25%, 05/15/2018 ......................
Valeant Pharmaceuticals
International, Inc.
Tranche B Term Loan E-1
5,233,854
3.50%, 08/05/2020 ......................
26,954
3,120,666
4,072,932
179,209
5,121,300
9,927,677
4,457,895
4,501,169
5,194,600
24,081,341
21,584,734
108,482,453
TRANSPORTATION - 0.0%
JHT Holdings, Inc.
Second Lien Term Loan
26,954
12.50%, 05/30/2015 (d) .................
Principal Amount ($)
GERMANY - 0.0%
EUR
Schieder Mobel Holding GmbH Delayed
334,902
Draw Term Loan (c)(d) ...................
LUXEMBOURG - 2.3%
USD
Auris Luxembourg III S.A.
Term Loan B-2
2,867,164
12/31/2021 (b) ...........................
Evergreen Skills Lux S.a.r.l.
First Lien Initial Term Loan
4,663,636
5.75%, 04/28/2021 ......................
Travelport Finance S.a.r.l.
Initial Term Loan
12,727,273
6.00%, 09/02/2021 ......................
201,489
2,864,182
4,580,577
12,727,273
20,172,032
See accompanying Notes to Financial Statements.
13
INVESTMENT PORTFOLIO (unaudited) (continued)
As of December 31, 2014
Principal Amount
Highland Floating Rate Opportunities Fund
Value ($)
Principal Amount ($)
U.S. Senior Loans (continued)
MARSHALL ISLANDS - 3.2%
USD
Drillships Financing Holding, Inc.
Tranche B-1 Term Loan
11,145,776
6.00%, 03/31/2021 ......................
Drillships Ocean Ventures, Inc.
Term Loan B
15,585,938
07/25/2021 (b) ...........................
OSG International, Inc.
Initial Term Loan
6,862,985
5.75%, 08/05/2019 ......................
1,000,000
2,000,000
8,798,252
3,000,000
12,624,610
2,000,000
6,691,410
28,114,272
NORWAY - 0.3%
USD
Petroleum Geo-Services ASA
Extended Term Loan
2,526,364
2.76%, 03/19/2021 ......................
UNITED KINGDOM - 0.0%
GBP
Henson No. 4, Ltd.
1,038,783
Term Loan Facility B (c)(d) ...............
1,046,697
Term Loan Facility C (c)(d) ...............
1,000,000
2,134,777
1,500,000
3,000,000
50,013
49,638
99,651
Total Foreign Denominated or
Domiciled Senior Loans
(Cost $88,556,775) ....................
1,000,000
2,000,000
3,500,000
1,250,000
79,924,862
Principal Amount ($)
1,500,000
Collateralized Loan Obligations (e)(f) - 10.6%
1,174,797
3,000,000
1,000,000
2,500,000
3,000,000
1,000,000
1,500,000
3,000,000
1,700,000
3,200,000
14
ACA CLO, Ltd.
Series 2007-1A, Class E
4.98%, 06/15/2022 ......................
Acis CLO, Ltd.
Series 2013-1A, Class E
5.83%, 04/18/2024 ......................
Allegro CLO, Ltd.
Series 2014-1A, Class C
4.39%, 01/21/2027 (g)...................
Series 2014-1A, Class E
6.99%, 01/21/2027 (g)...................
Anchorage Capital CLO, Ltd.
Series 2014-5A, Class E
5.23%, 10/15/2026 ......................
Apidos CLO
Series 2013-12A, Class F
5.13%, 04/15/2025 ......................
Series 2014-19A, Class F
6.21%, 10/17/2026 ......................
Carlyle High Yield Partners, Ltd.
Series 2007-10A, Class E
3.45%, 04/19/2022 ......................
Catamaran CLO, Ltd.
Series 2013-1A, Class E
5.23%, 01/27/2025 ......................
Series 2012-1A, Class E
5.50%, 12/20/2023 ......................
1,500,000
1,119,523
3,000,000
2,791,881
1,004,938
928,000
2,200,000
2,595,000
850,900
1,000,000
1,000,000
2,000,000
1,303,650
918,075
2,803,200
3,000,000
1,525,750
1,500,000
3,034,864
See accompanying Notes to Financial Statements.
Cent CDO, Ltd.
Series 2007-14A, Class D
1.53%, 04/15/2021 .......................
CFIP CLO, Ltd.
Series 2014-1A, Class E
4.98%, 04/13/2025 .......................
Series 2013-1A, Class E
5.38%, 04/20/2024 .......................
CIFC Funding, Ltd.
Series 2014-4A, Class F
5.89%, 10/17/2026 .......................
Dryden XXV Senior Loan Fund
Series 2012-25A, Class E
5.73%, 01/15/2025 .......................
Eastland CLO, Ltd.
Series 2007-1A, Class C
1.73%, 05/01/2022 .......................
Figueroa CLO, Ltd.
Series 2014-1A, Class F
6.73%, 01/15/2027 .......................
Flagship CLO, Ltd.
Series 2014-8A, Class D
3.90%, 01/16/2026 .......................
Series 2013-7A, Class E
4.98%, 01/20/2026 .......................
Series 2014-8A, Class E
5.40%, 01/16/2026 .......................
Greywolf CLO, Ltd.
Series 2013-1A, Class E
5.28%, 04/15/2025 .......................
Halcyon Loan Advisors Funding, Ltd.
Series 2014-3A, Class E1
5.39%, 10/22/2025 .......................
Halcyon Loan Investors CLO, Inc.
Series 2006-1A, Class D
3.73%, 11/20/2020 .......................
Harbourview CLO, Ltd.
Series 7A, Class E
5.36%, 11/18/2026 .......................
Hewett’s Island CDO, Ltd.
Series 2007-1RA, Class E
6.98%, 11/12/2019 .......................
Hildene CLO, Ltd.
Series 2014-3A, Class D
4.33%, 10/20/2026 .......................
Inwood Park CDO, Ltd.
Series 2006-1A, Class E
3.73%, 01/20/2021 .......................
Marlborough Street CLO, Ltd.
Series 2007-1A, Class E
3.88%, 04/18/2019 .......................
Mountain Capital CLO, Ltd.
Series 2007-6A, Class E
3.53%, 04/25/2019 .......................
Newmark Capital Funding CLO, Ltd.
Series 2013-1A, Class E
4.88%, 06/02/2025 .......................
Palmer Square CLO, Ltd.
Series 2013-2A, Class D
5.58%, 10/17/2025 .......................
Value ($)
893,750
1,732,520
2,733,900
1,674,200
940,000
878,500
1,316,250
2,790,000
1,740,000
3,080,000
1,046,375
1,335,000
1,451,250
2,647,500
986,347
943,400
945,010
1,925,000
836,596
2,610,000
1,357,950
INVESTMENT PORTFOLIO (unaudited) (continued)
As of December 31, 2014
Principal Amount ($)
Highland Floating Rate Opportunities Fund
Value ($)
Collateralized Loan Obligations (continued)
944,878
5,378,438
1,000,000
1,800,000
2,500,000
1,000,000
1,397,789
5,000,000
2,500,000
5,500,000
4,000,000
6,000,000
3,000,000
3,500,000
Primus CLO II, Ltd.
Series 2007-2A, Class E
4.98%, 07/15/2021 .......................
San Gabriel CLO, Ltd.
Series 2007-1A, Class B2L
4.49%, 09/10/2021 .......................
Saranac CLO, Ltd.
Series 2014-3A, Class E
5.46%, 06/22/2025 .......................
Silver Spring CLO, Ltd.
Series 2014-1A, Class F
5.47%, 10/15/2026 .......................
Sound Harbor Loan Fund, Ltd.
Series 2014-1A, Class C
4.99%, 10/30/2026 .......................
Series 2014-1A, Class D
7.23%, 10/30/2026 .......................
Stratford CLO, Ltd. Series 2007-1A,
Class E
4.23%, 11/01/2021 .......................
THL Credit Wind River CLO, Ltd.
Series 2014-2A, Class D
4.09%, 07/15/2026 .......................
Series 2014-3A,
Class D 4.29%, 01/22/2027 (g) ...........
Series 2014-2A, Class E
5.44%, 07/15/2026 .......................
Series 2014-3A, Class E
5.84%, 01/22/2027 (g) ....................
Vibrant CLO, Ltd.
Series 2012-1A, Class D
5.73%, 07/17/2024 .......................
West CLO, Ltd.
Series 2014-2A, Class D
5.29%, 01/16/2027 (g) ....................
Zais CLO, Ltd.
Series 2014-2A, Class D
5.68%, 07/25/2026 .......................
Total Collateralized Loan Obligations
(Cost $93,625,040) ........................
5,190,193
880,000
1,467,756
GAMING & LEISURE - 0.5%
Caesars Entertainment Operating Co., Inc.
5,000,000
10.00%, 12/15/2018 ......................
5,000,000
11.25%, 06/01/2017 ......................
HEALTHCARE - 0.1%
Crimson Merger Sub, Inc.
1,250,000
6.63%, 05/15/2022 (e)...................
1,125,000
INFORMATION TECHNOLOGY - 0.4%
Avaya, Inc.
4,571,000
10.50%, 03/01/2021 (e)(h)...............
3,931,060
SERVICE - 1.5%
Bon-Ton Department Stores, Inc. (The)
2,500,000
8.00%, 06/15/2021 (h)...................
Cenveo Corp.
12,000,000
6.00%, 08/01/2019 (e)...................
2,100,000
10,920,000
13,020,000
2,452,750
974,900
1,239,664
4,730,000
2,344,500
4,911,500
TELECOMMUNICATIONS - 0.6%
iHeartCommunications, Inc. PIK
6,500,000
14.00%, 02/01/2021 (h) .................
UTILITY - 2.0%
Entegra TC LLC
3,817,897
9.23%, 10/03/2017 (e)(f) .................
Ocean Rig UDW, Inc.
8,100,000
7.25%, 04/01/2019 (e)(h) ................
Texas Competitive Electric Holdings Co.
20,000,000
LLC (c) ....................................
Texas Competitive Electric Holdings Co.
16,304,111
LLC (c)(e)..................................
5,321,875
3,836,986
5,751,000
2,000,000
5,700,000
17,287,986
3,603,200
5,544,000
Total Corporate Bonds & Notes
(Cost $62,098,473).......................
49,591,261
Shares
Claims (i)(j) - 0.0%
2,667,000
3,131,800
93,014,363
TELECOMMUNICATIONS - 0.0%
Wind Telecomunicazione SpA Trade
3,414,269
Claim Facility 3692 ......................
435,319
Total Claims
(Cost $1,908,065) ........................
435,319
Common Stocks & Exchange-Traded Funds - 11.2%
1,765,340
1,665,000
3,430,340
FOOD & DRUG - 0.1%
SUPERVALU, Inc.
1,000,000
7.75%, 11/15/2022 (h) ....................
Value ($)
860,784
Corporate Bonds & Notes - 5.6%
ENERGY - 0.4%
Arch Coal, Inc.
5,788,000
7.00%, 06/15/2019 (h) ....................
Venoco, Inc.
3,000,000
8.88%, 02/15/2019 (h) ....................
Principal Amount ($)
985,000
800,000
3,690,000
4,490,000
BROADCASTING - 0.1%
Communications Corp. of
351,162
America (d)(i) .............................
428,418
CONSUMER DISCRETIONARY - 0.6%
103,183 American Airlines Group, Inc..............
5,533,704
ENERGY - 0.2%
1,118,286 Value Creation, Inc. (i) .....................
1,677,429
GAMING & LEISURE - 0.0%
LLV Holdco LLC - Litigation
44
Trust Units (d)(i)(k) ........................
LLV Holdco LLC - Series A,
34,512
Membership Interest (d)(i)(k) .............
LLV Holdco LLC - Series B,
436
Membership Interest (d)(i)(k) .............
—
—
—
—
See accompanying Notes to Financial Statements.
15
INVESTMENT PORTFOLIO (unaudited) (continued)
As of December 31, 2014
Shares
Highland Floating Rate Opportunities Fund
Value ($)
Shares
Value ($)
Common Stocks & Exchange-Traded Funds (continued)
Investment Companies (m) - 5.2%
HEALTHCARE - 0.0%
207,031 CCS Medical, Inc. (d)(i)(k) ....................
46,258,200
HOUSING - 0.6%
1,648,350 CCD Equity Partners LLC (d)(i) ..............
70,480 Las Vegas Land Holdings LLC (d)(i).........
8 Nevada Land Group LLC (d)(i)(k) ............
MEDIA & TELECOMMUNICATIONS - 8.7%
Endurance Business Media, Inc.,
4,921
Class A (d)(i)(k) .............................
2,346,784 Media General, Inc. (h)(i)(l) ..................
501,736 Metro-Goldwyn-Mayer, Inc., Class A (i)(l) ..
OTHER - 0.7%
296,331 Highland/iBoxx Senior Loan, ETF (h)(k).....
REAL ESTATE - 0.0%
535,090 Allenby (d)(i) .................................
1,963,144 Claymore (d)(i) ..............................
51,758
Securities Sold Short (o) - (1.7)%
970,756,800
Common Stocks & Exchange-Traded Funds - (1.7)%
ENERGY - (0.2)%
185,000 Gray Television, Inc. (p) ...................
(2,072,000)
76,641,028
MEDIA & TELECOMMUNICATIONS - (1.5)%
280,000 Gannett Co., Inc. ..........................
155,000 Sinclair Broadcast Group, Inc., Class A ...
(8,940,400)
(4,240,800)
5,689,555
Total Media/Telecommunications
(Cost $(12,498,867)) .....................
(13,181,200)
1
2
Total Common Stocks & ExchangeTraded Funds
(Proceeds $14,723,165) .................
(15,253,200)
Total Securities Sold Short
(Proceeds $14,723,165) .................
(15,253,200)
—
39,261,696
37,379,332
UTILITY - 0.3%
10,378 Entegra TC LLC, Class A (i) ..................
286,159 Entegra TC LLC, Class B (i) ..................
2,957,730
11,446
Other Assets & Liabilities, Net - (8.4)% ................
(74,228,465)
Net Assets - 100.0% ....................................
881,275,135
(a)
2,969,176
98,559,611
Units
Warrants (d)(i) - 0.0%
—
—
(b)
—
(c)
—
(d)
—
—
—
(e)
(f)
16
46,258,200
5,561,561
6,979
Total Warrants
(Cost $—)
Total Investment Companies
(Cost $46,258,200).......................
Total Investments - 110.1% ............................
(Cost $1,367,974,824) (n)
TRANSPORTATION - 0.0%
2,023 JHT Holdings, Inc. (d)(i)......................
GAMING & LEISURE - 0.0%
LLV Holdco LLC - Series C, Membership
1,834
Interest, expires 07/15/15 ................
LLV Holdco LLC - Series D, Membership
2,522
Interest, expires 07/15/15 ................
LLV Holdco LLC - Series E, Membership
2,819
Interest, expires 07/15/15 ................
LLV Holdco LLC - Series F, Membership
3,172
Interest, expires 07/15/15 ................
LLV Holdco LLC - Series G, Membership
3,594
Interest, expires 07/15/15 ................
46,258,200
5,548,346
13,215
—
3
Total Common Stocks & ExchangeTraded Funds
(Cost $338,760,359).......................
State Street Navigator Prime Securities
Lending Portfolio ........................
See accompanying Notes to Financial Statements.
Senior loans (also called bank loans, leveraged loans, or floating rate loans) in
which the Fund invests generally pay interest at rates which are periodically
determined by reference to a base lending rate plus a spread (unless
otherwise identified, all senior loans carry a variable rate of interest). These
base lending rates are generally (i) the Prime Rate offered by one or more
major United States banks, (ii) the lending rate offered by one or more
European banks such as the London Interbank Offered Rate (“LIBOR”) or (iii) the
Certificate of Deposit rate. Rate shown represents the weighted average rate
at December 31, 2014. Senior loans, while exempt from registration under the
Securities Act of 1933 (the “1933 Act”), contain certain restrictions on resale
and cannot be sold publicly. Senior secured floating rate loans often require
prepayments from excess cash flow or permit the borrower to repay at its
election. The degree to which borrowers repay, whether as a contractual
requirement or at their election, cannot be predicted with accuracy. As a
result, the actual remaining maturity may be substantially less than the stated
maturity shown.
All or a portion of this position has not settled. Full contract rates do not take
effect until settlement date.
The issuer is, or is in danger of being, in default of its payment obligation.
Income is not being accrued.
Represents fair value as determined by the Fund’s Board of Trustees (the
“Board”), or its designee in good faith, pursuant to the policies and procedures
approved by the Board. Securities with a total aggregate value of $36,541,862,
or 4.1% of net assets, were fair valued under the Fund’s valuation procedures
as of December 31, 2014.
Securities exempt from registration under Rule 144A of the 1933 Act. These
securities may only be resold in transaction exempt from registration to
qualified institutional buyers. At December 31, 2014, these securities
amounted to $124,278,409 or 14.1% of net assets.
Variable or floating rate security. The interest rate shown reflects the rate in
effect December 31, 2014.
INVESTMENT PORTFOLIO (unaudited) (continued)
As of December 31, 2014
(g)
(h)
(i)
(j)
(k)
(l)
(m)
(n)
(o)
(p)
Highland Floating Rate Opportunities Fund
Security purchased on a when-issued basis. As of December 31, 2014, assets
with a total aggregate market value of $11,742,700, or 1.3% of net assets,
were purchased on a when-issued basis.
Securities (or a portion of securities) on loan. As of December 31, 2014, the
market value of securities loaned was $44,668,043. The loaned securities were
secured with cash and securities collateral of $46,258,200. Collateral is
calculated based on prior day’s prices. See Note 4.
Non-income producing security.
These positions represent claims that have been filed with the United States
Bankruptcy Court Southern District of New York against Lehman Commercial
Paper, Inc. UK Branch.
Affiliated issuer. Assets with a total aggregate market value of $5,741,313, or
0.7% of net assets, were affiliated with the Fund as of December 31, 2014.
Restricted Securities. These securities are not registered and may not be sold
to the public. There are legal and/or contractual restrictions on resale. The
Fund does not have the right to demand that such securities be registered. The
values of these securities are determined by valuations provided by pricing
services, brokers, dealers, market makers, or in good faith under the
procedures established by the Fund’s Board of Trustees.
Represents investments of cash collateral received in connection with
securities lending.
Cost for U.S. federal income tax purposes is $1,387,859,620.
As of December 31, 2014, $43,712,172 in cash was segregated or on deposit
with the brokers to cover investments sold short and is included in “Other
Assets & Liabilities, Net.”
No dividend payable on security sold short.
Currency Abbreviations:
EUR Euro Currency
GBP British Pound
Glossary:
CDO Collateralized Debt Obligation
CLO Collateralized Loan Obligation
ETF Exchange-Traded Fund
PIK Payment-in-Kind
See accompanying Notes to Financial Statements.
17
INVESTMENT PORTFOLIO (unaudited)
As of December 31, 2014
Principal Amount ($)
Highland Opportunistic Credit Fund
Value ($)
SOVEREIGN BONDS (continued)
1,376,100 7.82%, 12/31/2033 .........................
U.S. Senior Loans (a) - 48.0%
ENERGY - 1.0%
Drillships Financing Holding, Inc.
Tranche B-1 Term Loan
379,040
6.00%, 03/31/2021 ......................
HEALTHCARE - 7.1%
Surgery Center Holdings, Inc.
Second Lien Term Loan
2,220,000
8.50%, 11/03/2021 ......................
SERVICE - 8.5%
Travelport Finance S.a.r.l.
Initial Term Loan
1,818,182
6.00%, 09/02/2021 ......................
Weight Watchers International, Inc.
Tranche B-2 Initial Term Loan
4.00%, 04/02/2020 ......................
994,937
UTILITIES - 15.1%
Ocean Rig UDW, Inc.
4,999,000
7.25%, 04/01/2019 (d)...................
Texas Competitive Electric Holdings Co.
5,000,000
LLC (e) ....................................
Texas Competitive Electric Holdings Co.
3,000,000
LLC (e) ....................................
2,150,625
6,418,912
Common Stocks - 24.2%
COMMERCIAL & PROFESSIONAL SERVICES - 1.5%
15,000 MPM Holdings, Inc. (g) ......................
24,889 Pendrell Corp. (d)(g) .........................
421,875
34,347
456,222
1,818,182
HEALTHCARE EQUIPMENT & SERVICES - 0.1%
141,000 Genesys Ventures IA, LP (f)(g) ..............
20,149
MATERIALS - 5.2%
6,632 Euramax International, Inc. (f)(g) ...........
1,594,303
MEDIA - 1.6%
Metro-Goldwyn-Mayer, Inc.,
6,363
Class A (g)(h) ...............................
474,043
SOFTWARE & SERVICES - 6.2%
22,175 Microsoft Corp. (d) ..........................
73,250 TiVo, Inc. (d)(g)...............................
1,030,029
867,280
769,583
999,022
8,573,702
1,897,309
14,610,321
TECHNOLOGY HARDWARE & EQUIPMENT - 3.7%
48,447 Corning, Inc. (d) .............................
1,110,889
TELECOMMUNICATION SERVICES - 2.8%
3 TerreStar Corp. (f)(g) ........................
859,935
UTILITIES - 3.1%
3,322 Entegra TC LLC, Class A (g) .................
946,770
Total Common Stocks
(Cost $7,228,117) .......................
7,359,620
1,637,500
3,549,290
500,000
Preferred Stocks (c)(g) - 2.8%
547,500
FINANCIAL - 2.8%
1,500 Grayson CLO, Ltd. ..........................
855,000
Total Preferred Stocks
(Cost $845,700) .........................
855,000
Investment Companies (i) - 19.0%
State Street Navigator Prime Securities
5,776,041
Lending Portfolio..........................
5,776,041
5,776,041
4,596,790
Total Corporate Bonds & Notes
(Cost $8,237,161) .....................
1,448,680
Shares
Corporate Bonds & Notes (c) - 20.5%
TELECOMMUNICATION SERVICES - 5.4%
iHeartCommunications, Inc. PIK
2,000,000
14.00%, 02/01/2021 ....................
Total Sovereign Bonds
(Cost $6,401,626) .......................
299,207
9,572,724
Total U.S. Senior Loans
(Cost $15,955,633) ....................
Value ($)
6,418,912
2,587,765
UTILITY - 31.4%
Entegra TC LLC
1,037,045
Third Lien Term Loan 10/02/2020 (b)...
Texas Competitive Electric Holdings Co.
LLC 2017 Extended Term Loan
13,190,310
4.65%, 10/10/2017 ......................
Principal Amount ($)
6,234,290
Foreign Corporate Bonds & Notes (c)(e)(f) - 0.0%
NETHERLANDS - 0.0%
USD
317,987 Celtic Pharma Phinco BV, PIK.............
2,201
Total Investment Companies
(Cost $5,776,041) .......................
Total Foreign Corporate Bonds & Notes
(Cost $212,561) .......................
2,201
Total Investments - 135.6%............................
(Cost $44,656,839) (j)
Other Assets & Liabilities, Net - (35.6)% ..............
(10,821,722)
Net Assets - 100.0% ....................................
30,434,663
Sovereign Bonds (e) - 21.1%
SOVEREIGN BONDS - 21.1%
Argentine Republic Government
International Bond
2,804,080
8.28%, 12/31/2033 (d)...................
2,804,080
8.28%, 12/31/2033 ......................
18
(a)
2,516,662
2,453,570
See accompanying Notes to Financial Statements.
41,256,385
Senior loans (also called bank loans, leveraged loans, or floating rate loans) in
which the Fund invests generally pay interest at rates which are periodically
determined by reference to a base lending rate plus a spread (unless
INVESTMENT PORTFOLIO (unaudited) (continued)
As of December 31, 2014
(b)
(c)
(d)
(e)
(f)
(g)
(h)
(i)
(j)
Highland Opportunistic Credit Fund
otherwise identified, all senior loans carry a variable rate of interest). These
base lending rates are generally (i) the Prime Rate offered by one or more
major United States banks, (ii) the lending rate offered by one or more
European banks such as the London Interbank Offered Rate (“LIBOR”) or (iii) the
Certificate of Deposit rate. Rate shown represents the weighted average rate
at December 31, 2014. Senior loans, while exempt from registration under the
Securities Act of 1933 (the “1933 Act”), contain certain restrictions on resale
and cannot be sold publicly. Senior secured floating rate loans often require
prepayments from excess cash flow or permit the borrower to repay at its
election. The degree to which borrowers repay, whether as a contractual
requirement or at their election, cannot be predicted with accuracy. As a
result, the actual remaining maturity may be substantially less than the stated
maturity shown.
All or a portion of this position has not settled. Full contract rates do not take
effect until settlement date.
Securities exempt from registration under Rule 144A of the 1933 Act. These
securities may only be resold in transaction exempt from registration to
qualified institutional buyers. At December 31, 2014, these securities
amounted to $7,091,491 or 23.3% of net assets.
Securities (or a portion of securities) on loan. As of December 31, 2014, the
market value of securities loaned was $7,391,979. The loaned securities were
secured with cash and securities collateral of $8,336,825. Collateral is
calculated based on prior day’s prices. See Note 4.
The issuer is, or is in danger of being, in default of its payment obligation.
Income is not being accrued.
Represents fair value as determined by the Fund’s Board of Trustees (the
“Board”), or its designee in good faith, pursuant to the policies and procedures
approved by the Board. Securities with a total aggregate value of $2,476,588,
or 8.1% of net assets, were fair valued under the Fund’s valuation procedures
as of December 31, 2014.
Non-income producing security.
Restricted Securities. These securities are not registered and may not be sold
to the public. There are legal and/or contractual restrictions on resale. The
Fund does not have the right to demand that such securities be registered. The
values of these securities are determined by valuations provided by pricing
services, brokers, dealers, market makers, or in good faith under the
procedures established by the Fund’s Board of Trustees.
Represents investments of cash collateral received in connection with
securities lending.
Cost for U.S. federal income tax purposes is $44,903,962.
Currency Abbreviations:
USD United States Dollar
Glossary:
CLO Collateralized Loan Obligation
PIK Payment-in-Kind
See accompanying Notes to Financial Statements.
19
STATEMENTS OF ASSETS AND LIABILITIES
As of December 31, 2014 (unaudited)
Highland Funds I
Highland
Long/Short
Equity
Fund
($)
Highland
Long/Short
Healthcare
Fund
($)
Highland
Floating Rate
Opportunities
Fund
($)
820,163,193
9,248,748
319,993,810
—
965,015,487
5,741,313
41,256,385
—
Total Investments, at value ....................................
Cash ............................................................
Restricted Cash—Futures (Note 3) .............................
Restricted Cash—Securities Sold Short (Note 2) ...............
Restricted Cash—Written Options (Note 3) ....................
Receivable for:
Investments sold ............................................
Dividend and interest ........................................
Fund shares sold.............................................
Prepaid expenses and other assets ...........................
Variation margin ...............................................
829,411,941
125,062,532
1,334,000
201,043,427
13,870,000
319,993,810
163,960,604
—
65,193,319
—
970,756,800
—
—
43,712,172
—
41,256,385
—
—
—
—
95,504,848
519,578
2,255,560
163,603
360,815
52,493,238
172,806
4,673,012
275,266
—
17,780,251
6,820,232
8,412,174
688,754
—
2,891,745
376,226
159,202
436,910
—
Total assets .............................................
1,269,526,304
606,762,055
1,048,170,383
45,120,468
Liabilities
Due to custodian ...............................................
Notes payable (Note 6).........................................
Securities sold short, at value (Notes 2 and 9) ................
Written options contracts, at value (Note 3) ..................
—
—
243,454,328
27,500
—
—
127,771,020
—
8,414,657
13,000,000
15,253,200
—
2,927,032
—
—
—
Payable for:
Upon receipt of securities loaned (Note 4)..................
Distributions to shareholders ...............................
Investments purchased .....................................
Fund shares redeemed ......................................
Investment advisory and administration fees (Note 7) ....
Trustees’ fees ................................................
Distribution and shareholder service fees (Note 7) .........
Transfer agent fees ..........................................
Commitment fee payable (Note 6) ..........................
Accrued expenses and other liabilities .....................
32,616,209
122,378
66,870,706
6,241,047
928,799
38,305
8,303
289,757
3,543
961,522
25,447,024
—
67,612,361
1,057,961
371,032
1,109
9,082
—
187
330,942
46,258,200
455,918
71,464,959
8,291,702
3,167,688
46,699
31,421
183,750
184,615
142,439
5,776,041
—
5,535,088
413,865
14,452
36
105
93
10,563
8,530
Total liabilities ..........................................
351,562,397
222,600,718
166,895,248
14,685,805
Net Assets ........................................................
917,963,907
384,161,337
881,275,135
30,434,663
Unaffiliated investments, at cost ..............................
Affiliated investments, at cost (Note 11) .......................
Proceeds from securities sold short ...........................
Written option premiums received ............................
(a) Includes market value of securities on loan:................
780,052,863
10,209,012
236,948,718
621,401
37,547,859
306,611,503
—
124,642,385
—
30,204,867
1,098,914,541
269,060,283
14,723,165
—
44,668,043
44,656,839
—
—
—
7,391,979
Assets
Unaffiliated investments, at value(a) ...........................
Affiliated investments, at value (Note 11) .....................
20
See accompanying Notes to Financial Statements.
Highland
Opportunistic
Credit
Fund
($)
STATEMENTS OF ASSETS AND LIABILITIES (continued)
As of December 31, 2014 (unaudited)
Net Assets Consist of:
Par value (Note 1) ................................................
Paid-in capital ....................................................
Accumulated net investment loss ...............................
Accumulated net realized gain (loss) from investments,
securities sold short, written options contracts, futures
contracts and foreign currency related transactions .......
Net unrealized appreciation (depreciation) on investments,
securities sold short, written options contracts, futures
contracts, and foreign currency related translations........
Net Assets ..........................................................
Class A:
Net assets ........................................................
Shares outstanding ($0.001 par value; unlimited shares
authorized).....................................................
Highland
Long/Short
Healthcare
Fund
($)
Highland
Floating Rate
Opportunities
Fund
($)
Highland
Opportunistic
Credit
Fund
($)
76,786
868,632,733
(6,609,957)
25,836
385,757,743
(3,121,215)
112,096
2,218,446,018
(22,141,685)
5,570
43,072,899
(272,012)
22,987,636
(8,754,339)
(917,393,235)
(8,970,154)
32,876,709
10,253,312
(397,748,059)
(3,401,640)
917,963,907
384,161,337
881,275,135
30,434,663
134,000,769
159,883,664
274,824,919
3,413,079
11,436,028
10,799,499
34,946,037
623,906
Net asset value per share .......................................
14.80(a)
7.86(a)
5.47(a)
Max offering price per share ....................................
12.40(b)
15.66(b)
8.15(b)
5.67(b)
Net asset value and offering price per share ...................
Class Z
Net assets ........................................................
Shares outstanding ($0.001 par value; unlimited
authorization) ..................................................
Net asset value, offering and redemption price per share .....
(b)
Highland
Long/Short
Equity
Fund
($)
11.72(a)
Class C:
Net assets ........................................................
Shares outstanding ($0.001 par value; unlimited shares
authorized).....................................................
(a)
Highland Funds I
53,089,015
54,774,539
332,835,607
99,231
4,776,816
3,865,454
42,332,585
18,151
11.11(a)
14.17(a)
7.86(a)
5.47(a)
730,874,123
169,503,134
273,614,609
26,922,353
60,573,068
11,170,981
34,817,368
4,928,231
12.07
15.17
7.86
5.46
Redemption price per share is equal to net asset value per share less any applicable contingent deferred sales charge (“CDSC”).
On sales of $1,000,000 or more, there is no sales charge and therefore the offering will be lower.
See accompanying Notes to Financial Statements.
21
STATEMENTS OF OPERATIONS
For the Six Months Ended December 31, 2014 (unaudited)
Highland Funds I
Highland
Long/Short
Equity
Fund
($)
Highland
Long/Short
Healthcare
Fund
($)
Investment Income
Income:
Dividends from unaffiliated issuers ............................
Dividends from affiliated issuers (Note 11) .....................
Less: Foreign taxes withheld ...................................
Securities lending income (Note 4) .............................
Interest from unaffiliated issuers ...............................
Other income....................................................
3,296,244
209,012
(4,022)
153,928
—
—
474,524
—
—
176,171
111,738
—
30,636
339,297
—
113,487
24,747,191
65,268
16,564
—
—
24,653
426,758
—
Total Income ......................................................
3,655,162
762,433
25,295,879
467,975
10,953,238
973,621
1,787,649
357,530
3,228,469
994,920
128,589
—
293,735
272,708
573,303
71,075
147,922
65,512
255,296
28,252
98,479
119,149
234,736
4,942
2,246,670
11,614
291,137
257,139
99,290
19,311
52,687
24,352
21,313
22,158
10,204
8,582
—
1,774
850,758
11,755
551,526
1,536,600
435,801
77,311
149,163
68,815
(2,600,452)
31,606
105,011
122,235
68,608
278,129
257,654
15,194
4,913
271
266
561
6,748
5,146
283
14,080
690
1,918
727
10,604
—
1,885
16,350,252
3,815,639
5,320,590
176,681
Expenses:
Investment advisory (Note 7) ...................................
Administration fees (Note 7) ....................................
Distribution and shareholder service fees: (Note 7)
Class A .....................................................
Class C .....................................................
Transfer agent fees .............................................
Trustees’ fees (Note 7) ..........................................
Accounting services fees .......................................
Audit fees ........................................................
Legal fees (Note 7) ..............................................
Registration fees ................................................
Insurance ........................................................
Reports to shareholders ........................................
Interest expense (Note 6) .......................................
Commitment fees-credit agreement (Note 6)..................
Dividends and fees on securities sold short (Note 2) ..........
Other ............................................................
Total operating expenses before waiver and
reimbursement .................................................
Expenses (waived or borne)/recouped by the Adviser
(Note 7)........................................................
Highland
Floating Rate
Opportunities
Fund
($)
Highland
Opportunistic
Credit Fund
($)
(6,085,133)
—
1,804,736
(56,079)
Net operating expenses ........................................
10,265,119
3,815,639
7,125,326
120,602
Net investment income (loss) ....................................
(6,609,957)
(3,053,206)
18,170,553
347,373
Net Realized and Unrealized Gain (Loss) on Investments
Realized gain (loss) on:
Investments from unaffiliated issuers..........................
Investments from affiliated issuers (Note 11) ..................
Securities sold short (Note 2) ...................................
Written options contracts (Note 3) .............................
Futures contracts (Note 3) ......................................
Foreign currency related transactions .........................
Change in unrealized appreciation (depreciation) on:
Investments .....................................................
Securities sold short (Note 2) ...................................
Written options (Note 3) ........................................
Futures contracts (Note 3) ......................................
Foreign currency related translations .........................
35,911,119
—
2,065,297
2,257,140
(240,431)
243,583
21,409,207
—
(16,089,432)
812,148
—
(17,391)
3,192,480
(415,251)
1,644,651
—
—
(101,079)
(46,203)
—
—
—
—
25,860
(26,941,589)
(5,201,835)
660,000
(361,376)
(419,578)
4,903,272
428,598
—
—
1,038
(52,662,122)
4,972,260
—
—
163,603
(3,506,501)
—
—
—
(1,186)
Net realized and unrealized gain (loss) on investments .......
7,972,330
11,447,440
(43,205,458)
(3,528,030)
Total increase (decrease) in net assets resulting from
operations ......................................................
1,362,373
8,394,234
(25,034,905)
(3,180,657)
22
See accompanying Notes to Financial Statements.
STATEMENTS OF CHANGES IN NET ASSETS
Highland Funds I
Highland Long/Short
Equity Fund
Six Months Ended
December 31, 2014
(unaudited)
($)
Increase (Decrease) in Net Assets
Operations:
Net investment income (loss)................................................................
Net realized gain (loss) on investments, securities sold short, written options contracts,
futures contracts and foreign currency related transactions ...........................
Net increase (decrease) in unrealized appreciation (depreciation) on investments,
securities sold short, written options contracts, futures contracts and foreign
currency related translations.............................................................
Net increase (decrease) from operations ...................................................
Distributions to shareholders from:
Net investment income
Class A .....................................................................................
Class C .....................................................................................
Class Z .....................................................................................
Net realized gains
Class A .....................................................................................
Class C .....................................................................................
Class Z .....................................................................................
Return of Capital
Class A .....................................................................................
Class C .....................................................................................
Class Y .....................................................................................
Total distributions .............................................................................
Share transactions:
Proceeds from sale of shares
Class A .....................................................................................
Class C .....................................................................................
Class Z .....................................................................................
Common Shares (Note 13) ................................................................
Value of distributions reinvested
Class A .....................................................................................
Class C .....................................................................................
Class Z .....................................................................................
Cost of shares redeemed
Class A .....................................................................................
Class C .....................................................................................
Class Z .....................................................................................
Reorganization (Note 13)
Class A .....................................................................................
Class C .....................................................................................
Class Z .....................................................................................
Redemption fees (Note 8)....................................................................
Net increase (decrease) from shares transactions .........................................
Total increase (decrease) in net assets ......................................................
Net Assets
Beginning of period ..........................................................................
End of period .................................................................................
Accumulated net investment income (loss) ....................................................
Year Ended
June 30, 2014
($)
(6,609,957)
(15,200,622)
40,236,708
115,432,967
(32,264,378)
1,362,373
37,732,159
137,964,504
—
—
—
—
—
—
(5,853,187)
(2,248,689)
(29,585,095)
(12,186,421)
(3,835,029)
(57,915,273)
—
—
—
(37,686,971)
—
—
—
(73,936,723)
13,248,055
5,788,093
114,915,481
—
112,583,840
18,316,378
338,297,967
—
5,528,013
1,652,664
25,625,493
10,380,104
2,516,828
35,127,021
(73,663,893)
(7,811,711)
(149,047,090)
(79,133,710)
(13,676,281)
(350,389,141)
—
—
—
—
(63,764,895)
(100,089,493)
—
—
—
21,571
74,044,577
138,072,358
1,018,053,400
917,963,907
(6,609,957)
879,981,042
1,018,053,400
—
See accompanying Notes to Financial Statements.
23
STATEMENTS OF CHANGES IN NET ASSETS (continued)
Highland Funds I
Highland Long/Short
Equity Fund
Six Months Ended
December 31, 2014
(unaudited)
($)
Year Ended
June 30, 2014
($)
CAPITAL STOCK ACTIVITY - SHARES
Class A:
Shares sold ........................................................................................
Issued for distribution reinvested ................................................................
Shares redeemed .................................................................................
1,102,500
476,142
(6,201,766)
9,232,371
863,568
(6,469,617)
Net increase (decrease) in fund shares ..........................................................
(4,623,124)
3,626,322
Class C:
Shares sold ........................................................................................
Issued for distribution reinvested ................................................................
Shares redeemed .................................................................................
513,130
149,970
(689,764)
1,561,085
218,855
(1,171,234)
Net increase (decrease) in fund shares ..........................................................
(26,664)
608,706
Class Z
Shares sold ........................................................................................
Issued for distribution reinvested ................................................................
Shares redeemed .................................................................................
Subscriptions from Reorganization (Note 13) ....................................................
9,347,843
2,144,393
(12,219,846)
—
27,127,011
2,851,219
(28,330,516)
—
Net increase (decrease) in fund shares ..........................................................
(727,610)
1,647,714
Common Shares (Note 13)
Shares sold ........................................................................................
—
—
Net increase (decrease) in fund shares ..........................................................
—
—
24
See accompanying Notes to Financial Statements.
STATEMENTS OF CHANGES IN NET ASSETS (continued)
Highland Funds I
Highland Long/Short
Healthcare Fund
Six Months Ended
December 31, 2014
(unaudited)
($)
Increase (Decrease) in Net Assets
Operations:
Net investment income (loss)................................................................
Net realized gain (loss) on investments, securities sold short, written options contracts,
futures contracts and foreign currency related transactions ...........................
Net increase (decrease) in unrealized appreciation (depreciation) on investments,
securities sold short, written options contracts, futures contracts and foreign
currency related translations.............................................................
Net increase (decrease) from operations ...................................................
Distributions to shareholders from:
Net investment income
Class A .....................................................................................
Class C .....................................................................................
Class Z .....................................................................................
Net realized gains
Class A .....................................................................................
Class C .....................................................................................
Class Z .....................................................................................
Return of Capital
Class A .....................................................................................
Class C .....................................................................................
Class Y .....................................................................................
Total distributions .............................................................................
Share transactions:
Proceeds from sale of shares
Class A .....................................................................................
Class C .....................................................................................
Class Z .....................................................................................
Common Shares (Note 13) ................................................................
Value of distributions reinvested
Class A .....................................................................................
Class C .....................................................................................
Class Z .....................................................................................
Cost of shares redeemed
Class A .....................................................................................
Class C .....................................................................................
Class Z .....................................................................................
Reorganization (Note 13)
Class A .....................................................................................
Class C .....................................................................................
Class Z .....................................................................................
Redemption fees (Note 8)....................................................................
Net increase (decrease) from shares transactions .........................................
Total increase (decrease) in net assets ......................................................
Net Assets
Beginning of period ..........................................................................
End of period .................................................................................
Accumulated net investment income (loss) ....................................................
Year Ended
June 30, 2014
($)
(3,053,206)
(2,270,555)
6,114,532
13,593,431
5,332,908
8,394,234
1,228,084
12,550,960
—
—
—
—
—
—
(6,673,843)
(2,470,677)
(6,599,458)
—
—
—
—
—
—
(15,743,978)
—
—
—
—
70,734,992
11,077,178
99,813,644
—
152,823,930
43,579,767
124,408,137
—
6,350,239
2,424,087
5,013,629
—
—
—
(67,253,659)
(5,517,710)
(45,331,930)
(16,159,617)
(3,407,549)
(30,508,480)
—
—
—
—
77,310,470
69,960,726
—
—
—
61
270,736,249
283,287,209
314,200,611
384,161,337
(3,121,215)
30,913,402
314,200,611
(68,009)
See accompanying Notes to Financial Statements.
25
STATEMENTS OF CHANGES IN NET ASSETS (continued)
Highland Funds I
Highland Long/Short
Healthcare Fund
Six Months Ended
December 31, 2014
(unaudited)
($)
Year Ended
June 30, 2014
($)
Class A:
Shares sold ........................................................................................
Issued for distribution reinvested ................................................................
Shares redeemed .................................................................................
4,700,661
441,909
(4,516,989)
10,233,441
—
(1,116,162)
Net increase (decrease) in fund shares ..........................................................
625,581
9,117,279
Class C:
Shares sold ........................................................................................
Issued for distribution reinvested ................................................................
Shares redeemed .................................................................................
767,246
176,169
(385,123)
3,043,907
—
(248,148)
Net increase (decrease) in fund shares ..........................................................
558,292
2,795,759
Class Z
Shares sold ........................................................................................
Issued for distribution reinvested ................................................................
Shares redeemed .................................................................................
Subscriptions from Reorganization (Note 13) ....................................................
6,463,875
340,369
(2,960,960)
—
8,129,433
—
(2,030,993)
—
Net increase (decrease) in fund shares ..........................................................
3,843,284
6,098,440
Common Shares (Note 13)
Shares sold ........................................................................................
—
—
Net increase (decrease) in fund shares ..........................................................
—
—
CAPITAL STOCK ACTIVITY - SHARES
26
See accompanying Notes to Financial Statements.
STATEMENTS OF CHANGES IN NET ASSETS (continued)
Highland Funds I
Highland Floating
Rate Opportunities Fund
Six Months Ended
December 31, 2014
(unaudited)
($)
Increase (Decrease) in Net Assets
Operations:
Net investment income (loss)................................................................
Net realized gain (loss) on investments, securities sold short, written options contracts,
futures contracts and foreign currency related transactions ...........................
Net increase (decrease) in unrealized appreciation (depreciation) on investments,
securities sold short, written options contracts, futures contracts and foreign
currency related translations.............................................................
Net increase (decrease) from operations ...................................................
Distributions to shareholders from:
Net investment income
Class A .....................................................................................
Class B .....................................................................................
Class C .....................................................................................
Class Z .....................................................................................
Net realized gains
Class A .....................................................................................
Class C .....................................................................................
Class Z .....................................................................................
Return of Capital
Class A .....................................................................................
Class B .....................................................................................
Class C .....................................................................................
Class Y .....................................................................................
Total distributions .............................................................................
Share transactions:
Proceeds from sale of shares
Class A .....................................................................................
Class B .....................................................................................
Class C .....................................................................................
Class Z .....................................................................................
Common Shares (Note 13) ................................................................
Value of distributions reinvested
Class A .....................................................................................
Class B .....................................................................................
Class C .....................................................................................
Class Z .....................................................................................
Cost of shares redeemed
Class A .....................................................................................
Class B .....................................................................................
Class C .....................................................................................
Class Z .....................................................................................
Reorganization (Note 13)
Class A .....................................................................................
Class C .....................................................................................
Class Z .....................................................................................
Redemption fees (Note 8)....................................................................
Net increase (decrease) from shares transactions .........................................
Total increase (decrease) in net assets ......................................................
Net Assets
Beginning of period ..........................................................................
End of period .................................................................................
Accumulated net investment income (loss) ....................................................
Year Ended
June 30, 2014
($)
18,170,553
47,903,300
4,320,801
(36,701,259)
(47,526,259)
(25,034,905)
97,298,500
108,500,541
(5,885,335)
—
(5,868,379)
(6,576,208)
(18,065,529)
(2,415)
(13,328,132)
(15,535,846)
—
—
—
—
—
—
—
—
—
—
(18,329,922)
(365,756)
(49)
(269,842)
(314,539)
(47,882,108)
36,919,821
—
17,161,105
121,077,689
—
509,464,575
12
94,373,111
615,416,559
—
5,100,207
—
4,789,765
5,986,406
13,076,836
2,003
9,627,828
13,763,338
(96,493,804)
—
(54,838,381)
(178,901,837)
(451,123,176)
(163,193)
(70,464,497)
(477,102,819)
—
—
—
—
(139,199,029)
(182,563,856)
—
—
—
99,885
256,970,462
317,588,895
1,063,838,991
881,275,135
(22,141,685)
746,250,096
1,063,838,991
(21,982,316)
See accompanying Notes to Financial Statements.
27
STATEMENTS OF CHANGES IN NET ASSETS (continued)
Highland Funds I
Highland Floating
Rate Opportunities Fund
Six Months Ended
December 31, 2014
(unaudited)
($)
Year Ended
June 30, 2014
($)
Class A:
Shares sold ........................................................................................
Issued for distribution reinvested ................................................................
Shares redeemed .................................................................................
4,601,839
639,484
(12,096,862)
63,869,482
1,625,770
(55,915,261)
Net increase (decrease) in fund shares ..........................................................
(6,855,539)
9,579,991
Class B:
Shares sold ........................................................................................
Issued for distribution reinvested ................................................................
Shares redeemed .................................................................................
—
—
—
2
253
(20,194)
Net increase (decrease) in fund shares ..........................................................
—
(19,939)
Class C:
Shares sold ........................................................................................
Issued for distribution reinvested ................................................................
Shares redeemed .................................................................................
2,147,169
600,896
(6,885,960)
11,867,488
1,197,879
(8,773,343)
Net increase (decrease) in fund shares ..........................................................
(4,137,895)
4,292,024
Class Z
Shares sold ........................................................................................
Issued for distribution reinvested ................................................................
Shares redeemed .................................................................................
Subscriptions from Reorganization (Note 13) ....................................................
15,068,848
751,015
(22,504,820)
—
76,720,805
1,711,761
(58,929,130)
—
Net increase (decrease) in fund shares ..........................................................
(6,684,957)
19,503,436
Common Shares (Note 13)
Shares sold ........................................................................................
—
—
Net increase (decrease) in fund shares ..........................................................
—
—
CAPITAL STOCK ACTIVITY - SHARES
28
See accompanying Notes to Financial Statements.
STATEMENTS OF CHANGES IN NET ASSETS (continued)
Highland Funds I
Highland Opportunistic Credit Fund
Six Months Ended
December 31, 2014
(unaudited)
($)
Increase (Decrease) in Net Assets
Operations:
Net investment income (loss) ..............................
Net realized gain (loss) on investments, securities sold
short, written options contracts, futures contracts
and foreign currency related transactions .............
Net increase (decrease) in unrealized appreciation
(depreciation) on investments, securities sold short,
written options contracts, futures contracts and
foreign currency related translations...................
Net increase (decrease) from operations .................
Distributions to shareholders from:
Net investment income
Class A ...................................................
Class C ...................................................
Class Z....................................................
Net realized gains
Class A ...................................................
Class C ...................................................
Class Z....................................................
Return of Capital
Class A ...................................................
Class C ...................................................
Class Y....................................................
Total distributions ...........................................
Share transactions:
Proceeds from sale of shares
Class A ...................................................
Class C ...................................................
Class Z....................................................
Common Shares (Note 13) ..............................
Value of distributions reinvested
Class A ...................................................
Class C ...................................................
Class Z....................................................
Cost of shares redeemed
Class A ...................................................
Class C ...................................................
Class Z....................................................
Reorganization (Note 13)
Class A ...................................................
Class C ...................................................
Class Z....................................................
Redemption fees (Note 8) ..................................
Net increase (decrease) from shares transactions .......
Total increase (decrease) in net assets.....................
Net Assets
Beginning of period ........................................
End of period ...............................................
Accumulated net investment income (loss) ..................
(a)
Six Months Ended
June 30, 2014(a)
($)
Year Ended
December 31, 2013
($)
347,373
(18,274)
6,637
(20,343)
47,956
33,960
(3,507,687)
(3,180,657)
44,717
74,399
169,623
210,220
(56,976)
(1,383)
(543,998)
—
—
—
—
—
—
—
—
—
—
—
—
—
—
—
—
—
—
(602,357)
—
—
—
—
—
—
—
—
4,120,455
109,042
20,855,555
—
—
—
—
1,831,274
—
—
—
—
63,694
1,446
602,275
—
—
—
—
—
—
(376,334)
(1,425)
(5,460,551)
—
—
—
—
—
—
—
—
11,582,156
—
31,496,313
27,713,299
—
—
—
—
1,831,274
1,905,673
—
—
—
—
—
210,220
2,721,364
30,434,663
(272,012)
815,691
2,721,364
(17,028)
605,471
815,691
5,850
Effective July 1, 2014, the Highland Opportunistic Credit Fund changed its fiscal year end from December 31 to June 30.
See accompanying Notes to Financial Statements.
29
STATEMENTS OF CHANGES IN NET ASSETS (continued)
Highland Funds I
Highland Opportunistic Credit Fund
Six Months Ended
December 31, 2014
(unaudited)
($)
Six Months Ended
June 30, 2014(a)
($)
Year Ended
December 31, 2013
($)
CAPITAL STOCK ACTIVITY - SHARES
Class A:
Shares sold.......................................................
Issued for distribution reinvested ...............................
Shares redeemed ................................................
679,707
11,408
(67,209)
—
—
—
—
—
—
Net increase (decrease) in fund shares .........................
623,906
—
—
Class C:
Shares sold.......................................................
Issued for distribution reinvested ...............................
Shares redeemed ................................................
18,147
259
(255)
—
—
—
—
—
—
Net increase (decrease) in fund shares .........................
18,151
—
—
Class Z
Shares sold.......................................................
Issued for distribution reinvested ...............................
Shares redeemed ................................................
Subscriptions from Reorganization (Note 13) ..................
5,371,058
108,216
(989,221)
438,178
—
—
—
—
—
—
—
—
Net increase (decrease) in fund shares .........................
4,928,231
—
—
Common Shares (Note 13)
Shares sold.......................................................
—
303,191
—
Net increase (decrease) in fund shares .........................
—
303,191
—
(a)
Effective July 1, 2014, the Highland Opportunistic Credit Fund changed its fiscal year end from December 31 to June 30.
30
See accompanying Notes to Financial Statements.
STATEMENT OF CASH FLOWS
For the Six Months Ended December 31, 2014 (unaudited)
Highland Long/Short Equity Fund
($)
Cash Flows Used in Operating Activities
Net increase in net assets from operations ..........................................................................
Adjustments to Reconcile Net Investment Loss to Net Cash Used in Operating Activities
Purchases of investment securities from unaffiliated issuers .......................................................
Purchases of investment securities from affiliated issuers ..........................................................
Proceeds from disposition investment securities from unaffiliated issuers .........................................
Purchases of securities sold short ....................................................................................
Proceeds from securities sold short ..................................................................................
Purchases of purchased options......................................................................................
Proceeds from the disposition of purchased options ................................................................
Net premium received on open written options .....................................................................
Net realized gain on investments from unaffiliated issuers .........................................................
Net realized gain on securities sold short ............................................................................
Net realized gain on written options contracts ......................................................................
Net realized gain on foreign currency related transactions .........................................................
Net change in unrealized depreciation on investments, securities sold short, written options contracts, futures
contracts and foreign currency related translations ..............................................................
Net change in short-term investments ...............................................................................
Increase in restricted cash ............................................................................................
Decrease in receivable for investments sold .........................................................................
Decrease in dividends and interest receivable .......................................................................
Decrease in receivable for swap payments ..........................................................................
Decrease in receivable for fund shares sold .........................................................................
Increase in prepaid expenses and other assets......................................................................
Increase in receivable for variation margin ..........................................................................
Increase in payable for investments purchased .....................................................................
Increase in payable for fund shares redeemed ......................................................................
Increase in payable for distributions .................................................................................
Decrease in payables to related parties..............................................................................
Decrease in payable upon receipt of securities on loan .............................................................
Decrease in payable for distribution and shareholder service fees .................................................
Increase in payable for commitment fees ...........................................................................
Increase in payable for transfer agent fees ..........................................................................
Decrease in payable for swap payments ............................................................................
Increase in accrued expenses and other liabilities...................................................................
1,362,373
(2,182,747,400)
(10,209,012)
2,219,208,516
(1,463,031,041)
1,448,785,322
(10,243,481)
5,986,341
4,435,852
(35,911,119)
(2,065,297)
(2,257,140)
(243,583)
31,903,002
36,327,256
(97,934,495)
658,696
150,936
616
540,730
(104,874)
(360,815)
38,673,664
5,337,600
54,129
(58,120)
(36,327,256)
(18,832)
24
184,580
(3,588,390)
396,655
Net cash flow used in operating activities ....................................................................
(51,094,563)
Cash Flows Used in Financing Activities
Proceeds from shares sold ............................................................................................
Payment of shares redeemed ........................................................................................
Distributions paid in cash .............................................................................................
133,951,629
(230,522,694)
(4,880,801)
Net cash flow used in financing activities ....................................................................
(101,451,866)
Effect of exchange rate changes on cash ....................................................................
(175,995)
Net decrease in cash ..........................................................................................
(152,722,424)
Cash
Beginning of the year .................................................................................................
277,784,956
End of the year ........................................................................................................
125,062,532
Supplemental disclosure of cash flow information:
Reinvestment of distributions .........................................................................................
32,806,170
Cash paid during the year for interest ................................................................................
234,736
Cash paid during the year for commitment fees ....................................................................
4,918
See accompanying Notes to Financial Statements.
31
STATEMENT OF CASH FLOWS
For the Six Months Ended December 31, 2014 (unaudited)
Highland Long/Short Healthcare Fund
($)
Cash Flows Provided by Operating Activities
Net increase in net assets from operations ...........................................................................
Adjustments to Reconcile Net Investment Loss to Net Cash Provided by Operating Activities
Purchases of investment securities from unaffiliated issuers ........................................................
Proceeds from disposition investment securities from unaffiliated issuers .........................................
Purchases of securities sold short .....................................................................................
Proceeds from securities sold short ...................................................................................
Purchases of purchased options ......................................................................................
Proceeds from the disposition of purchased options.................................................................
Net premium received on open written options ......................................................................
Net accretion of discount ..............................................................................................
Net realized gain on investments from unaffiliated issuers ..........................................................
Net realized loss on securities sold short .............................................................................
Net realized gain on written options contracts .......................................................................
Net realized loss on foreign currency related transactions ..........................................................
Net change in unrealized appreciation on investments, securities sold short, written options contracts, futures
contracts and foreign currency related translations ..............................................................
Net change in short-term investments ...............................................................................
Increase in restricted cash.............................................................................................
Increase in receivable for investments sold ..........................................................................
Increase in dividends and interest receivable ........................................................................
Decrease in receivable for fund shares sold ..........................................................................
Increase in prepaid expenses and other assets ......................................................................
Increase in payable for investments purchased .....................................................................
Decrease in payable for fund shares redeemed .....................................................................
Decrease in payable for distributions .................................................................................
Increase in payables to related parties ...............................................................................
Decrease in payable upon receipt of securities on loan .............................................................
Decrease in payable for distribution and shareholder service fees .................................................
Increase in payable for commitment fees ............................................................................
Increase in accrued expenses and other liabilities ...................................................................
8,394,234
(772,751,202)
717,805,983
(489,312,624)
540,623,749
(32,386,126)
29,785,966
812,148
(991)
(21,409,207)
16,089,432
(812,148)
17,391
(5,332,908)
18,283,122
(12,404,266)
(40,168,339)
(62,322)
3,574,817
(126,771)
61,484,088
(2,707,059)
(8,949)
66,980
(18,283,122)
(13,068)
187
247,234
Net cash flow provided by operating activities ...............................................................
1,406,229
Cash Flows Provided by Financing Activities
Proceeds from shares sold ............................................................................................
Payment of shares redeemed .........................................................................................
Distributions paid in cash ..............................................................................................
181,625,814
(118,103,299)
(1,956,023)
Net cash flow provided by financing activities ...............................................................
61,566,492
Effect of exchange rate changes on cash ....................................................................
(16,353)
Net increase in cash ...........................................................................................
62,956,368
Cash & Foreign Currency
Beginning of the year ..................................................................................................
101,004,236
End of the year .........................................................................................................
163,960,604
Supplemental disclosure of cash flow information:
Reinvestment of distributions .........................................................................................
13,787,955
Cash paid during the year for commitment fees .....................................................................
1,587
32
See accompanying Notes to Financial Statements.
STATEMENT OF CASH FLOWS
For the Six Months Ended December 31, 2014 (unaudited)
Highland Floating Rate Opportunities Fund
($)
Cash Flows Provided by Operating Activities
Net decrease in net assets from operations ..........................................................................
Adjustments to Reconcile Net Investment Income to Net Cash Provided by Operating Activities
Purchases of investment securities from unaffiliated issuers ........................................................
Proceeds from disposition investment securities from unaffiliated issuers .........................................
Proceeds from disposition investment securities from affiliated issuers ............................................
Purchases of securities sold short .....................................................................................
Proceeds from securities sold short ...................................................................................
Net accretion of discount ..............................................................................................
Net realized gain on investments from unaffiliated issuers ..........................................................
Net realized loss on investments from affiliated issuers .............................................................
Net realized gain on securities sold short .............................................................................
Net realized loss on foreign currency related transactions ..........................................................
Net change in unrealized depreciation on investments, securities sold short and foreign currency related
translations ..........................................................................................................
Net change in short-term investments ...............................................................................
Decrease in restricted cash............................................................................................
Decrease in receivable for investments sold .........................................................................
Decrease in dividends and interest receivable .......................................................................
Increase in receivable for fund shares sold ...........................................................................
Increase in prepaid expenses and other assets ......................................................................
Decrease in payable for investments purchased.....................................................................
Increase in payable for fund shares redeemed ......................................................................
Decrease in payable for distributions .................................................................................
Increase in payables to related parties ...............................................................................
Increase in payable upon receipt of securities on loan ..............................................................
Decrease in payable for distribution and shareholder service fees .................................................
Increase in payable for commitment fees ............................................................................
Increase in payable for transfer agent fees ..........................................................................
Decrease in accrued expenses and other liabilities ..................................................................
(25,034,905)
(397,303,735)
450,474,764
16,678,069
(41,168,291)
4,551,667
(1,658,103)
(3,192,480)
415,251
(1,644,651)
101,079
47,526,259
(30,227,345)
36,342,192
96,424,229
226,293
(3,604,979)
(283,003)
(2,423,541)
1,954,171
(278,274)
2,708,264
30,227,345
(65,999)
75,336
109,306
(484,217)
Net cash flow provided by operating activities ...............................................................
180,444,702
Cash Flows Used in Financing Activities
Decrease in notes payable ............................................................................................
Proceeds from shares sold ............................................................................................
Payment of shares redeemed .........................................................................................
Distributions paid in cash ..............................................................................................
(47,000,000)
175,158,615
(330,234,022)
(2,453,544)
Net cash flow used in financing activities .....................................................................
(204,528,951)
Effect of exchange rate changes on cash ....................................................................
(102,434)
Net decrease in cash...........................................................................................
(24,186,683)
Cash/Due to Custodian
Beginning of the year ..................................................................................................
15,772,026
End of the year .........................................................................................................
(8,414,657)
Supplemental disclosure of cash flow information:
Reinvestment of distributions .........................................................................................
15,876,378
Cash paid during the year for interest ................................................................................
68,608
Cash paid during the year for commitment fees .....................................................................
202,793
See accompanying Notes to Financial Statements.
33
STATEMENT OF CASH FLOWS
For the Six Months Ended December 31, 2014 (unaudited)
Highland Opportunistic Credit Fund
($)
Cash Flows Used in Operating Activities
Net decrease in net assets from operations ...........................................................................
Adjustments to Reconcile Net Investment Income to Net Cash Used in Operating Activities
Purchases of investment securities from unaffiliated issuers .........................................................
Proceeds from disposition investment securities from unaffiliated issuers ...........................................
Net accretion of discount ...............................................................................................
Net realized loss on investments from unaffiliated issuers ............................................................
Net realized gain on foreign currency related transactions ...........................................................
Net change in unrealized depreciation on investments, securities sold short and foreign currency related
translations ...........................................................................................................
Net change in short-term investments .................................................................................
Increase in receivable for investments sold ............................................................................
Increase in dividends and interest receivable ..........................................................................
Increase in receivable for fund shares sold ............................................................................
Increase in prepaid expenses and other assets........................................................................
Decrease in receivable for expense reimbursement due from Investment Advisor ..................................
Increase in payable for investments purchased .......................................................................
Increase in payable for fund shares redeemed ........................................................................
Decrease in payable for audit and tax .................................................................................
Increase in payables to related parties ................................................................................
Increase in payable upon receipt of securities on loan................................................................
Increase in payable for distribution and shareholder service fees ....................................................
Increase in payable for commitment fees .............................................................................
Increase in payable for transfer agent fees ............................................................................
Increase in accrued expenses and other liabilities ....................................................................
(3,180,657)
(45,027,273)
6,768,140
(26,264)
46,203
(25,860)
3,507,687
(5,732,485)
(2,891,745)
(375,258)
(159,202)
(436,876)
40,909
5,535,088
413,865
(19,088)
14,332
5,732,485
105
10,563
93
6,662
Net cash flow used in operating activities......................................................................
(35,798,576)
Cash Flows Provided by Financing Activities
Proceeds from shares sold ..............................................................................................
Payment of shares redeemed ..........................................................................................
Proceeds from reorganization (Note 13)................................................................................
Distributions received in cash...........................................................................................
25,085,052
(5,838,310)
11,582,156
65,058
Net cash flow provided by financing activities .................................................................
30,893,956
Effect of exchange rate changes on cash ......................................................................
24,674
Net decrease in cash ............................................................................................
(4,879,946)
Cash/Due to Custodian
Beginning of the year ...................................................................................................
1,952,914
End of the year ..........................................................................................................
(2,927,032)
Supplemental disclosure of cash flow information:
Reinvestment of distributions ...........................................................................................
667,415
Cash paid during the year for interest..................................................................................
727
Cash paid during the year for commitment fees ......................................................................
41
34
See accompanying Notes to Financial Statements.
FINANCIAL HIGHLIGHTS
Highland Long/Short Equity Fund, Class A
Selected data for a share outstanding throughout each period is as follows:
For the
Six Months
Ended
12/31/14
(unaudited)
Net Asset Value, Beginning of Period
$
12.18
For the Years Ended June 30,
2014
$
2013
11.37
$
11.30
2012
$
11.10
2011
$
10.68
For the
Ten Months
Ended
06/30/10
$
10.37
Income from Investment Operations:
Net investment loss(a)
Redemption fees added to paid-in capital(a)
Net realized and unrealized gain/(loss)(a)
(0.10)
—
0.12
(0.21)
—(b)
1.97
(0.16)
—(b)
0.53
(0.22)
—(b)
0.48
(0.21)
—(b)
0.93
(0.19)
0.01
0.59
Total from investment operations
0.02
1.76
0.37
0.26
0.72
0.41
Less Distributions Declared to Shareholders:
From net realized gains
(0.48)
(0.95)
(0.30)
(0.06)
(0.30)
(0.10)
Total distributions declared to shareholders
(0.48)
(0.95)
(0.30)
(0.06)
(0.30)
(0.10)
Net Asset Value, End of Period(i)
Total return(c)(i)
$
11.72
0.22%(d)
Ratios to Average Net Assets(e)/Supplemental Data:
Net assets, end of period (in 000’s)
$134,001
Gross operating expenses(f)(g)
3.54%
Waiver/reimbursement
(1.24)%
Net operating expenses(f)(h)
2.30%
Dividends and fees on securities sold short
0.44%
Net operating expenses (excluding
dividends and fees on securities sold
short)
1.86%
Net investment loss
(1.59)%
Portfolio turnover rate
274%(d)
(a)
(b)
(c)
(d)
(e)
(f)
(g)
(h)
(i)
$
12.18
15.60%
$
11.37
3.38%
$
11.30
2.42%
$
11.10
6.62%
$195,612
3.75%
(1.25)%
2.50%
0.56%
$141,351
3.79%
(1.25)%
2.54%
0.66%
$265,712
3.66%
(1.25)%
2.41%
0.53%
$286,581
3.64%
(1.25)%
2.39%
0.41%
1.94%
(1.69)%
349%
1.88%
(1.40)%
706%
1.88%
(1.99)%
650%
1.98%
(1.89)%
684%
$
10.68
3.90%(d)
$207,323
4.19%
(1.25)%
2.94%
0.70%
2.24%
(2.10)%
496%(d)
Per share data was calculated using average shares outstanding during the period.
Represents less than $0.005 per share.
Total return is at net asset value assuming all distributions are reinvested and no initial sales charge or CDSC. For periods with waivers/reimbursements, had the Fund’s
investment adviser not waived or reimbursed a portion of expenses, total return would have been reduced.
Not annualized.
All ratios for the period have been annualized, unless otherwise indicated.
Includes dividends and fees on securities sold short.
Gross operating expenses (excluding interest expense and commitment fees) were 3.49% for the period ended December 31, 2014. Gross operating expenses (excluding
interest expense and commitment fees) were 3.75%, 3.79%, 3.66%, 3.64% and 4.19% for the years or periods ended June 30, 2014, 2013, 2012, 2011 and 2010, respectively.
Net expense ratio has been calculated after applying any waiver/reimbursement, if applicable.
The Net Asset Value per share and total return have been calculated based on net assets which include adjustments made in accordance with U.S. generally accepted
accounting principles required at period end for financial reporting purposes. These figures do not necessarily reflect the Net Asset Value per share or total return experienced
by the shareholder at period end.
See accompanying Notes to Financial Statements.
35
FINANCIAL HIGHLIGHTS
Highland Long/Short Equity Fund, Class C
Selected data for a share outstanding throughout each period is as follows:
Net Asset Value, Beginning of Period
For the
Six Months
Ended
12/31/14
(unaudited)
2014
2013
2012
2011
For the
Ten Months
Ended
06/30/10
$ 11.62
$ 10.95
$ 10.96
$ 10.83
$ 10.48
$ 10.22
For the Years Ended June 30,
Income from Investment Operations:
Net investment loss(a)
Redemption fees added to paid-in capital(a)
Net realized and unrealized gain/(loss)(a)
(0.13)
—
0.10
(0.27)
—(b)
1.89
(0.22)
—(b)
0.51
(0.28)
—(b)
0.47
(0.27)
—(b)
0.92
(0.24)
0.01
0.59
Total from investment operations
(0.03)
1.62
0.29
0.19
0.65
0.36
Less Distributions Declared to Shareholders:
From net realized gains
(0.48)
(0.95)
(0.30)
(0.06)
(0.30)
(0.10)
Total distributions declared to shareholders
(0.48)
(0.95)
(0.30)
(0.06)
(0.30)
(0.10)
Net Asset Value, End of Period(i)
Total return(c)(i)
$ 11.11
(0.20)%(d)
Ratios to Average Net Assets(e)/Supplemental Data:
Net assets, end of period (in 000’s)
$53,089
Gross operating expenses(f)(g)
4.22%
Waiver/reimbursement
(1.24)%
Net operating expenses(f)(h)
2.98%
Dividends and fees on securities sold short
0.46%
Net operating expenses (excluding dividends and
fees on securities sold short)
2.52%
Net investment loss
(2.23)%
Portfolio turnover rate
274%(d)
(a)
(b)
(c)
(d)
(e)
(f)
(g)
(h)
(i)
36
$ 11.62
14.89%
$ 10.95
2.75%
$ 10.96
1.83%
$ 10.83
6.18%
$ 10.48
3.46%(d)
$55,795
4.39%
(1.25)%
3.14%
0.56%
$45,925
4.48%
(1.26)%
3.22%
0.67%
$57,677
4.31%
(1.25)%
3.06%
0.53%
$79,243
4.29%
(1.25)%
3.04%
0.41%
$59,290
4.84%
(1.25)%
3.59%
0.70%
2.58%
(2.35)%
349%
2.55%
(2.02)%
706%
2.53%
(2.64)%
650%
2.63%
(2.54)%
684%
2.89%
(2.75)%
496%(d)
Per share data was calculated using average shares outstanding during the period.
Represents less than $0.005 per share.
Total return is at net asset value assuming all distributions are reinvested and no initial sales charge or CDSC. For periods with waivers/reimbursements, had the Fund’s
investment adviser not waived or reimbursed a portion of expenses, total return would have been reduced.
Not annualized.
All ratios for the period have been annualized, unless otherwise indicated.
Includes dividends and fees on securities sold short.
Gross operating expenses (excluding interest expense and commitment fees) were 4.17% for the period ended December 31, 2014. Gross operating expenses (excluding
interest expense and commitment fees) were 4.39%, 4.48%, 4.31%, 4.29% and 4.84% for the years or periods ended June 30, 2014, 2013, 2012, 2011 and 2010, respectively.
Net expense ratio has been calculated after applying any waiver/reimbursement, if applicable.
The Net Asset Value per share and total return have been calculated based on net assets which include adjustments made in accordance with U.S. generally accepted
accounting principles required at period end for financial reporting purposes. These figures do not necessarily reflect the Net Asset Value per share or total return experienced
by the shareholder at period end.
See accompanying Notes to Financial Statements.
FINANCIAL HIGHLIGHTS
Highland Long/Short Equity Fund, Class Z
Selected data for a share outstanding throughout each period is as follows:
For the
Six Months
Ended
12/31/14
(unaudited)
Net Asset Value, Beginning of Period
$
12.51
For the Years Ended June 30,
2014
$
2013
11.61
$
11.50
2012
$
11.27
2011
$
10.81
For the
Ten Months
Ended
06/30/10
$
10.46
Income from Investment Operations:
Net investment loss(a)
Redemption fees added to paid-in capital(a)
Net realized and unrealized gain/(loss)(a)
(0.08)
—
0.12
(0.17)
—(b)
2.02
(0.11)
—(b)
0.52
(0.18)
—(b)
0.47
(0.17)
—(b)
0.93
(0.16)
0.01
0.60
Total from investment operations
0.04
1.85
0.41
0.29
0.76
0.45
Less Distributions Declared to Shareholders:
From net realized gains
(0.48)
(0.95)
(0.30)
(0.06)
(0.30)
(0.10)
Total distributions declared to shareholders
(0.48)
(0.95)
(0.30)
(0.06)
(0.30)
(0.10)
Net Asset Value, End of Period(i)
Total return(c)(i)
$
12.07
0.38%(d)
Ratios to Average Net Assets(e)/Supplemental Data:
Net assets, end of period (in 000’s)
$730,874
Gross operating expenses(f)(g)
3.21%
Waiver/reimbursement
(1.24)%
Net operating expenses(f)(h)
1.97%
Dividends and fees on securities sold short
0.46%
Net operating expenses (excluding
dividends and fees on securities sold
short)
1.51%
Net investment loss
(1.23)%
Portfolio turnover rate
274%(d)
(a)
(b)
(c)
(d)
(e)
(f)
(g)
(h)
(i)
$
12.51
16.07%
$
11.61
3.68%
$
11.50
2.56%
$
11.27
7.02%
$
10.81
4.25%(d)
$
3,827
3.84%
(1.25)%
2.59%
0.70%
$766,646
3.39%
(1.25)%
2.14%
0.56%
$692,705
3.54%
(1.26)%
2.28%
0.71%
$399,689
3.31%
(1.25)%
2.06%
0.53%
$163,490
3.29%
(1.25)%
2.04%
0.41%
1.58%
(1.34)%
349%
1.57%
(0.96)%
706%
1.53%
(1.64)%
650%
1.63%
(1.54)%
684%
1.89%
(1.75)%
496%(d)
Per share data was calculated using average shares outstanding during the period.
Represents less than $0.005 per share.
Total return is at net asset value assuming all distributions are reinvested and no initial sales charge or CDSC. For periods with waivers/reimbursements, had the Fund’s
investment adviser not waived or reimbursed a portion of expenses, total return would have been reduced.
Not annualized.
All ratios for the period have been annualized, unless otherwise indicated.
Includes dividends and fees on securities sold short.
Gross operating expenses (excluding interest expense and commitment fees) were 3.16% for the period ended December 31, 2014. Gross operating expenses (excluding
interest expense and commitment fees) were 3.39%, 3.54%, 3.31%, 3.29% and 3.84% for the years or periods ended June 30, 2014, 2013, 2012, 2011 and 2010, respectively.
Net expense ratio has been calculated after applying any waiver/reimbursement, if applicable.
The Net Asset Value per share and total return have been calculated based on net assets which include adjustments made in accordance with U.S. generally accepted
accounting principles required at period end for financial reporting purposes. These figures do not necessarily reflect the Net Asset Value per share or total return experienced
by the shareholder at period end.
See accompanying Notes to Financial Statements.
37
FINANCIAL HIGHLIGHTS
Highland Long/Short Healthcare Fund, Class A
Selected data for a share outstanding throughout each period is as follows:
For the
Six Months
Ended
12/31/14
(unaudited)
Net Asset Value, Beginning of Period
$
15.07
For the Years Ended June 30,
2014
$
2013
11.03
$
2012
10.87
$
13.75
2011
$
11.19
For the
Ten Months
Ended
06/30/10
$
9.42
Income from Investment Operations:
Net investment loss(a)
Redemption fees added to paid-in capital
Capital contributions (Note 1)
Net realized and unrealized gain/(loss)(a)
(0.13)
—
—
0.54
(0.27)
—(a)(b)
—
4.31
(0.26)
—(a)(b)
(0.03)(a)
0.45
(0.28)
0.01(a)
—
(1.36)
(0.15)
—(a)(b)
—
3.06
(0.51)
—
—
2.28
Total from investment operations
0.41
4.04
0.16
(1.63)
2.91
1.77
Less Distributions Declared to Shareholders:
From net realized gains
(0.68)
—
—
(1.25)
(0.35)
—
Total distributions declared to shareholders
(0.68)
—
—
(1.25)
(0.35)
—
Net Asset Value, End of Period(i)
Total return(c)(i)
$
14.80
2.85%(d)
Ratios to Average Net Assets(e)/Supplemental Data:
Net assets, end of period (in 000’s)
$159,884
(f)(g)
Gross operating expenses
2.17%
Waiver/reimbursement
—
2.17%
Net operating expenses(f)(h)
Dividends and fees on securities sold short
0.47%
Net operating expenses (excluding
dividends and fees on securities sold
short)
1.70%
Net investment loss
(1.75)%
Portfolio turnover rate
282%(d)
(a)
(b)
(c)
(d)
(e)
(f)
(g)
(h)
(i)
38
$
15.07
36.63%
$
11.03
1.47%
$
10.87
(12.37)%
$
13.75
26.63%
$
11.19
18.79%(d)
$
2,042
6.86%
(0.91)%
5.95%
0.03%
$153,358
2.55%
—
2.55%
0.77%
$ 11,652
3.52%
—
3.52%
1.03%
$ 29,861
3.30%
(0.36)%
2.94%
1.09%
$ 23,767
3.14%
(1.19)%
1.95%
0.53%
1.78%
(1.82)%
538%
2.49%
(2.48)%
1,035%
1.85%
(2.31)%
1,336%
1.42%
(1.26)%
1,553%
5.92%
(5.69)%
262%(d)
Per share data was calculated using average shares outstanding during the period.
Represents less than $0.005 per share.
Total return is at net asset value assuming all distributions are reinvested and no initial sales charge or CDSC. For periods with waivers/reimbursements, had the Fund’s
investment adviser not waived or reimbursed a portion of expenses, total return would have been reduced.
Not annualized.
All ratios for the period have been annualized, unless otherwise indicated.
Includes dividends and fees on securities sold short.
Gross operating expenses (excluding interest expense and commitment fees) were 2.17% for the period ended December 31, 2014. Gross operating expenses (excluding
interest expense and commitment fees) were 2.55%, 3.52%, 3.30%, 3.14% and 6.86% for the years or periods ended June 30, 2014, 2013, 2012, 2011 and 2010, respectively.
Net expense ratio has been calculated after applying any waiver/reimbursement, if applicable.
The Net Asset Value per share and total return have been calculated based on net assets which include adjustments made in accordance with U.S. generally accepted
accounting principles required at period end for financial reporting purposes. These figures do not necessarily reflect the Net Asset Value per share or total return experienced
by the shareholder at period end.
See accompanying Notes to Financial Statements.
FINANCIAL HIGHLIGHTS
Highland Long/Short Healthcare Fund, Class C
Selected data for a share outstanding throughout each period is as follows:
Net Asset Value, Beginning of Period
For the
Six Months
Ended
12/31/14
(unaudited)
2014
2013
2012
2011
$ 14.50
$ 10.68
$ 10.59
$ 13.54
$ 11.04
For the Years Ended June 30,
For the
Ten Months
Ended
06/30/10
$
9.33
Income from Investment Operations:
Net investment loss(a)
Redemption fees added to paid-in capital
Capital contributions (Note 1)
Net realized and unrealized gain/(loss)(a)
(0.18)
—
—
0.53
(0.35)
—(a)(b)
—
4.17
(0.31)
—(a)(b)
(0.03)(a)
0.43
(0.34)
0.01(a)
—
(1.37)
(0.23)
—(a)(b)
—
3.08
(0.55)
—
—
2.26
Total from investment operations
0.35
3.82
0.09
(1.70)
2.85
1.71
Less Distributions Declared to Shareholders:
From net realized gains
(0.68)
—
—
(1.25)
(0.35)
—
Total distributions declared to shareholders
(0.68)
—
—
(1.25)
(0.35)
—
Net Asset Value, End of Period(i)
Total return(c)(i)
$ 14.17
2.54%(d)
Ratios to Average Net Assets(e)/Supplemental Data:
Net assets, end of period (in 000’s)
$54,775
(f)(g)
Gross operating expenses
4.43%
Waiver/reimbursement
—
4.43%
Net operating expenses(f)(h)
Dividends and fees on securities sold short
0.48%
Net operating expenses (excluding dividends and
fees on securities sold short)
3.95%
Net investment loss
(2.41)%
Portfolio turnover rate
282%(d)
(a)
(b)
(c)
(d)
(e)
(f)
(g)
(h)
(i)
$ 14.50
35.77%
$ 10.68
0.85%
$ 10.59
(13.04)%
$ 13.54
26.35%
$ 11.04
18.33%(d)
$47,964
3.25%
—
3.25%
0.79%
$ 5,460
4.20%
—
4.20%
1.07%
$ 9,181
3.95%
(0.36)%
3.59%
1.09%
$ 6,075
3.79%
(1.19)%
2.60%
0.53%
$
2.46%
(2.51)%
538%
3.13%
(3.05)%
1,035%
2.50%
(2.96)%
1,336%
2.07%
(1.91)%
1,553%
338
7.51%
(0.91)%
6.60%
0.03%
6.57%
(6.34)%
262%(d)
Per share data was calculated using average shares outstanding during the period.
Represents less than $0.005 per share.
Total return is at net asset value assuming all distributions are reinvested and no initial sales charge or CDSC. For periods with waivers/reimbursements, had the Fund’s
investment adviser not waived or reimbursed a portion of expenses, total return would have been reduced.
Not annualized.
All ratios for the period have been annualized, unless otherwise indicated.
Includes dividends and fees on securities sold short.
Gross operating expenses (excluding interest expense and commitment fees) were 4.43% for the period ended December 31, 2014. Gross operating expenses (excluding
interest expense and commitment fees) were 3.25%, 4.20%, 3.95%, 3.79% and 7.51% for the years or periods ended June 30, 2014, 2013, 2012, 2011 and 2010, respectively.
Net expense ratio has been calculated after applying any waiver/reimbursement, if applicable.
The Net Asset Value per share and total return have been calculated based on net assets which include adjustments made in accordance with U.S. generally accepted
accounting principles required at period end for financial reporting purposes. These figures do not necessarily reflect the Net Asset Value per share or total return experienced
by the shareholder at period end.
See accompanying Notes to Financial Statements.
39
FINANCIAL HIGHLIGHTS
Highland Long/Short Healthcare Fund, Class Z
Selected data for a share outstanding throughout each period is as follows:
For the
Six Months
Ended
12/31/14
(unaudited)
Net Asset Value, Beginning of Period
$
15.40
For the Years Ended June 30,
2014
$
2013
11.23
$
2012
11.03
$
13.88
2011
$
11.26
For the
Ten Months
Ended
06/30/10
$
9.47
Income from Investment Operations:
Net investment loss(a)
Redemption fees added to paid-in capital
Capital contributions (Note 1)
Net realized and unrealized gain/(loss) (a)
(0.11)
—
—
0.56
(0.22)
—(a)(b)
—
4.39
(0.21)
—(a)(b)
(0.03)(a)
0.44
(0.24)
0.01(a)
—
(1.37)
(0.11)
—(a)(b)
—
3.08
(0.49)
—
—
2.28
Total from investment operations
0.45
4.17
0.20
(1.60)
2.97
1.79
Less Distributions Declared to Shareholders:
From net realized gains
(0.68)
—
—
(1.25)
(0.35)
—
Total distributions declared to shareholders
(0.68)
—
—
(1.25)
(0.35)
—
Net Asset Value, End of Period(i)
Total return(c)(i)
$
15.17
3.04%(d)
Ratios to Average Net Assets(e)/Supplemental Data:
Net assets, end of period (in 000’s)
$169,503
(f)(g)
Gross operating expenses
1.25%
Waiver/reimbursement
—
Net operating expenses(f)(h)
1.25%
Dividends and fees on securities sold short
0.48%
Net operating expenses (excluding
dividends and fees on securities sold
short)
0.77%
Net investment loss
(1.40)%
Portfolio turnover rate
282%(d)
(a)
(b)
(c)
(d)
(e)
(f)
(g)
(h)
(i)
(j)
40
$
15.40
37.13%
$
11.23
1.81%
$
11.03
(11.95)%
$
13.88
26.79%
$
11.26
18.90%(d)
$
7,606
6.51%
(0.91)%
5.60%
0.03%
$112,879
2.26%
—
2.26%
0.80%
$ 13,801
3.24%
—(j)
3.24%
1.13%
$ 14,210
2.95%
(0.36)%
2.59%
1.09%
$ 13,705
2.79%
(1.19)%
1.60%
0.53%
1.46%
(1.51)%
538%
2.11%
(1.95)%
1,035%
1.50%
(1.96)%
1,336%
1.07%
(0.91)%
1,553%
5.57%
(5.34)%
262%(d)
Per share data was calculated using average shares outstanding during the period.
Represents less than $0.005 per share.
Total return is at net asset value assuming all distributions are reinvested and no initial sales charge or CDSC. For periods with waivers/reimbursements, had the Fund’s
investment adviser not waived or reimbursed a portion of expenses, total return would have been reduced.
Not annualized.
All ratios for the period have been annualized, unless otherwise indicated.
Includes dividends and fees on securities sold short.
Gross operating expenses (excluding interest expense and commitment fees) were 1.25% for the period ended December 31, 2014. Gross operating expenses (excluding
interest expense and commitment fees) were 2.26%, 3.24%, 2.95%, 2.79% and 6.51% for the years or periods ended June 30, 2014, 2013, 2012, 2011 and 2010, respectively.
Net expense ratio has been calculated after applying any waiver/reimbursement, if applicable.
The Net Asset Value per share and total return have been calculated based on net assets which include adjustments made in accordance with U.S. generally accepted
accounting principles required at period end for financial reporting purposes. These figures do not necessarily reflect the Net Asset Value per share or total return experienced
by the shareholder at period end.
Represents less than 0.005%.
See accompanying Notes to Financial Statements.
FINANCIAL HIGHLIGHTS
Highland Floating Rate Opportunities Fund, Class A
Selected data for a share outstanding throughout each period is as follows:
For the
Six Months
Ended
12/31/14
(unaudited)
Net Asset Value, Beginning of Period
$
8.20
2014
$
2013
7.74
$
6.85
2012
$
6.96
2011
$
6.55
For the
Ten Months
Ended
06/30/10*
$
5.98
Income from Investment Operations:
Net investment income(a)
Redemption fees added to paid-in capital(a)
Net realized and unrealized gain/(loss)(a)
0.15
—
(0.34)
0.33
—(b)
0.46
0.30
—(b)
0.98
0.26
—(b)
(0.07)
0.27
—
0.46
0.18
—
0.57
Total from investment operations
(0.19)
0.79
1.28
0.19
0.73
0.75
Less Distributions Declared to Shareholders:
From net investment income
From return of capital
(0.15)
—
(0.32)
(0.01)
(0.30)(i)
(0.09)(i)
(0.30)
—
(0.32)
—
(0.06)
(0.12)
Total distributions declared to shareholders
(0.15)
(0.33)
(0.39)
(0.30)
(0.32)
(0.18)
Net Asset Value, End of Period(h)
Total return(c)(h)
$
7.86
(2.32)%(d)
Ratios to Average Net Assets(e)/Supplemental Data:
Net assets, end of period (in 000’s)
$274,825
(j)
Gross operating expenses
1.00%(f)
Waiver/reimbursement
0.36%
1.36%(f)
Net operating expenses(g)
Dividends and fees on securities sold short
0.07%
Net operating expenses (excluding
dividends and fees on securities sold
short)
1.29%
Net investment income
3.70%
Portfolio turnover rate
27%(d)
*
(a)
(b)
(c)
(d)
(e)
(f)
(g)
(h)
(i)
(j)
For the Years Ended June 30,
$
8.20
10.43%
$
7.74
19.16%
$342,776
$249,450
(f)
1.60%
1.79%
(0.26)%
(0.21)%
1.34%(f)
1.58%
0.04%
—
1.30%
4.15%
69%
—
4.06%
71%
$
6.85
2.52%
$
6.96
11.73%
$203,684
2.53%
—
2.53%
—
$264,385
2.65%
—
2.65%
—
—
3.91%
50%
—
3.97%
104%
$
6.55
12.68%(d)
$191,925
2.88%
—
2.88%
—
—
3.29%
57%(d)
Historical data shown is that of the Highland Floating Rate Advantage Fund, which reorganized into the Highland Floating Rate Opportunities Fund on June 13, 2011.
Per share data was calculated using average shares outstanding during the period.
Represents less than $0.005 per share.
Total return is at net asset value assuming all distributions are reinvested and no initial sales charge or CDSC. For periods with waivers/reimbursements, had the Fund’s
investment adviser not waived or reimbursed a portion of expenses, total return would have been reduced.
Not annualized.
All ratios for the period have been annualized, unless otherwise indicated.
Includes dividends and fees on securities sold short.
Net expense ratio has been calculated after applying any waiver/reimbursement, if applicable.
The Net Asset Value per share and total return have been calculated based on net assets which include adjustments made in accordance with U.S. generally accepted
accounting principles required at period end for financial reporting purposes. These figures do not necessarily reflect the Net Asset Value per share or total return experienced
by the shareholder at period end.
Changed from previously reported amounts of $(0.32) and $(0.07), respectively. See Note 5.
Gross operating expenses (excluding interest expense and commitment fees) were 1.45% for the period ended December 31, 2014. Gross operating expenses (excluding
interest expense and commitment fees) were 1.52%, 1.65%, 2.11%, 2.18% and 2.27% for the years or periods ended June 30, 2014, 2013, 2012, 2011 and 2010, respectively.
See accompanying Notes to Financial Statements.
41
FINANCIAL HIGHLIGHTS
Highland Floating Rate Opportunities Fund, Class C
Selected data for a share outstanding throughout each period is as follows:
For the
Six Months
Ended
12/31/14
(unaudited)
Net Asset Value, Beginning of Period
$
8.20
For the Years Ended June 30,
2014
$
7.74
2013
$
6.85
2012
$
6.96
2011
$
6.55
For the
Ten Months
Ended
06/30/10*
$
5.98
Income from Investment Operations:
Net investment income(a)
Redemption fees added to paid-in capital(a)
Net realized and unrealized gain/(loss)(a)
0.13
—
(0.34)
0.30
—(b)
0.45
0.26
—(b)
0.98
0.23
—(b)
(0.07)
0.24
—
0.45
0.15
—
0.58
Total from investment operations
(0.21)
0.75
1.24
0.16
0.69
0.73
Less Distributions Declared to Shareholders:
From net investment income
From return of capital
(0.13)
—
(0.28)
(0.01)
(0.26)(i)
(0.09)(i)
(0.27)
—
(0.28)
—
(0.06)
(0.10)
Total distributions declared to shareholders
(0.13)
(0.29)
(0.35)
(0.27)
(0.28)
(0.16)
Net Asset Value, End of Period(h)
Total return(c)(h)
$
7.86
(2.56)%(d)
Ratios to Average Net Assets(e)/Supplemental Data:
Net assets, end of period (in 000’s)
$332,836
(j)
Gross operating expenses
1.50%(f)
Waiver/reimbursement
0.36%
1.86%(f)
Net operating expenses(g)
Dividends and fees on securities sold short
0.07%
Net operating expenses (excluding
dividends and fees on securities sold
short)
1.79%
Net investment income
3.21%
Portfolio turnover rate
27%(d)
*
(a)
(b)
(c)
(d)
(e)
(f)
(g)
(h)
(i)
(j)
42
$
8.20
9.90%
$
7.74
18.58%
$380,974
$326,476
(f)
2.10%
2.30%
(0.26)%
(0.22)%
1.84%(f)
2.08%
0.04%
—
1.80%
3.72%
69%
—
3.56%
71%
$
6.85
2.01%
$
6.96
11.16%
$320,178
3.03%
—
3.03%
—
$437,220
3.15%
—
3.15%
—
—
3.41%
50%
—
3.47%
104%
$
6.55
12.22%(d)
$332,355
3.38%
—
3.38%
—
—
2.79%
57%(d)
Historical data shown is that of the Highland Floating Rate Advantage Fund, which reorganized into the Highland Floating Rate Opportunities Fund on June 13, 2011.
Per share data was calculated using average shares outstanding during the period.
Represents less than $0.005 per share.
Total return is at net asset value assuming all distributions are reinvested and no initial sales charge or CDSC. For periods with waivers/reimbursements, had the Fund’s
investment adviser not waived or reimbursed a portion of expenses, total return would have been reduced.
Not annualized.
All ratios for the period have been annualized, unless otherwise indicated.
Includes dividends and fees on securities sold short.
Net expense ratio has been calculated after applying any waiver/reimbursement, if applicable.
The Net Asset Value per share and total return have been calculated based on net assets which include adjustments made in accordance with U.S. generally accepted
accounting principles required at period end for financial reporting purposes. These figures do not necessarily reflect the Net Asset Value per share or total return experienced
by the shareholder at period end.
Changed from previously reported amounts of $(0.28) and $(0.07), respectively. See Note 5.
Gross operating expenses (excluding interest expense and commitment fees) were 1.95% for the period ended December 31, 2014. Gross operating expenses (excluding
interest expense and commitment fees) were 2.02%, 2.16%, 2.61%, 2.68% and 2.77% for the years or periods ended June 30, 2014, 2013, 2012, 2011 and 2010, respectively.
See accompanying Notes to Financial Statements.
FINANCIAL HIGHLIGHTS
Highland Floating Rate Opportunities Fund, Class Z
Selected data for a share outstanding throughout each period is as follows:
For the
Six Months
Ended
12/31/14
(unaudited)
Net Asset Value, Beginning of Period
$
8.19
2014
$
2013
7.74
$
6.84
2012
$
6.96
2011
$
6.55
For the
Ten Months
Ended
06/30/10*
$
5.97
Income from Investment Operations:
Net investment income(a)
Redemption fees added to paid-in capital(a)
Net realized and unrealized gain/(loss)(a)
0.16
—
(0.33)
0.36
—(b)
0.45
0.29
—(b)
1.03
0.29
—(b)
(0.08)
0.29
—
0.46
0.20
—
0.58
Total from investment operations
(0.17)
0.81
1.32
0.21
0.75
0.78
Less Distributions Declared to Shareholders:
From net investment income
From return of capital
(0.16)
—
(0.35)
(0.01)
(0.33)(i)
(0.09)(i)
(0.33)
—
(0.34)
—
(0.07)
(0.13)
Total distributions declared to shareholders
(0.16)
(0.36)
(0.42)
(0.33)
(0.34)
(0.20)
Net Asset Value, End of Period(h)
Total return(c)(h)
$
7.86
(2.03)%(d)
Ratios to Average Net Assets(e)/Supplemental Data:
Net assets, end of period (in 000’s)
$273,615
(j)
Gross operating expenses
0.64%(f)
Waiver/reimbursement
0.36%
1.00%(f)
Net operating expenses(g)
Dividends and fees on securities sold short
0.07%
Net operating expenses (excluding
dividends and fees on securities sold
short)
0.93%
Net investment income
4.04%
Portfolio turnover rate
27%(d)
*
(a)
(b)
(c)
(d)
(e)
(f)
(g)
(h)
(i)
(j)
For the Years Ended June 30,
$
8.19
10.68%
$
7.74
19.77%
$340,089
$170,170
(f)
1.25%
1.31%
(0.26)%
(0.27)%
0.99%(f)
1.04%
0.04%
—
0.95%
4.49%
69%
—
3.88%
71%
$
6.84
2.73%
$
6.96
12.11%
$ 22,568
2.18%
—
2.18%
—
$ 35,668
2.30%
—
2.30%
—
—
4.26%
50%
—
4.32%
104%
$
6.55
13.20%(d)
$ 41,785
2.53%
—
2.53%
—
—
3.64%
57%(d)
Historical data shown is that of the Highland Floating Rate Advantage Fund, which reorganized into the Highland Floating Rate Opportunities Fund on June 13, 2011.
Per share data was calculated using average shares outstanding during the period.
Represents less than $0.005 per share.
Total return is at net asset value assuming all distributions are reinvested and no initial sales charge or CDSC. For periods with waivers/reimbursements, had the Fund’s
investment adviser not waived or reimbursed a portion of expenses, total return would have been reduced.
Not annualized.
All ratios for the period have been annualized, unless otherwise indicated.
Includes dividends and fees on securities sold short.
Net expense ratio has been calculated after applying any waiver/reimbursement, if applicable.
The Net Asset Value per share and total return have been calculated based on net assets which include adjustments made in accordance with U.S. generally accepted
accounting principles required at period end for financial reporting purposes. These figures do not necessarily reflect the Net Asset Value per share or total return experienced
by the shareholder at period end.
Changed from previously reported amounts of $(0.34) and $(0.08), respectively. See Note 5.
Gross operating expenses (excluding interest expense and commitment fees) were 1.09% for the period ended December 31, 2014. Gross operating expenses (excluding
interest expense and commitment fees) were 1.17%, 1.21%, 1.76%, 1.83% and 1.92% for the years or periods ended June 30, 2014, 2013, 2012, 2011 and 2010, respectively.
See accompanying Notes to Financial Statements.
43
FINANCIAL HIGHLIGHTS
Highland Opportunistic Credit Fund, Class A
Selected data for a share outstanding throughout each period is as follows:
For the
Six Months
Ended
12/31/14*
(unaudited)
Net Asset Value, Beginning of Period
$ 6.22
Income from Investment Operations:
Net investment income(a)
Net realized and unrealized gain
0.07
(0.69)
Total from investment operations
(0.62)
Less Distributions Declared to Shareholders:
From net investment income
(0.13)
Total distributions declared to shareholders
(0.13)
Net Asset Value, End of Period
Total return(b)
$ 5.47
(10.03)%(c)
Ratios to Average Net Assets/Supplemental Data:
Net assets, end of period (in 000’s)
Gross expenses
Net expenses(d)
Net investment income
Portfolio turnover rate
$ 3,413
1.71%(e)
1.27%(e)
2.33%(e)
16%(c)
*
(a)
(b)
(c)
(d)
(e)
44
Effective July 1, 2014, the Highland Opportunistic Credit Fund changed its fiscal year end from December 31 to June 30. Class A shares commenced operations on July 1,
2014.
Per share net investment income has been calculated using the average shares outstanding during the period.
Total return at net asset value assuming all distributions reinvested. For periods with waivers/reimbursements, had the Fund’s investment adviser not waived or reimbursed a
portion of expenses, total return would have been reduced.
Not annualized.
Net expense ratio has been calculated after applying any waiver/reimbursement, if applicable.
Annualized.
See accompanying Notes to Financial Statements.
FINANCIAL HIGHLIGHTS
Highland Opportunistic Credit Fund, Class C
Selected data for a share outstanding throughout each period is as follows:
For the
Six Months
Ended
12/31/14*
(unaudited)
Net Asset Value, Beginning of Period
$ 6.22
Income from Investment Operations:
Net investment income(a)
Net realized and unrealized gain
0.07
(0.71)
Total from investment operations
(0.64)
Less Distributions Declared to Shareholders:
From net investment income
(0.11)
Total distributions declared to shareholders
(0.11)
Net Asset Value, End of Period
Total return(b)
Ratios to Average Net Assets/Supplemental Data:
Net assets, end of period (in 000’s)
Gross expenses
Net expenses(d)
Net investment income
Portfolio turnover rate
*
(a)
(b)
(c)
(d)
(e)
$ 5.47
(10.39)%(c)
$
99
2.16%(e)
1.72%(e)
2.49%(e)
16%(c)
Effective July 1, 2014, the Highland Opportunistic Credit Fund changed its fiscal year end from December 31 to June 30. Class C commenced operations on July 1, 2014.
Per share net investment income has been calculated using the average shares outstanding during the period.
Total return at net asset value assuming all distributions reinvested. For periods with waivers/reimbursements, had the Fund’s investment adviser not waived or reimbursed a
portion of expenses, total return would have been reduced.
Not annualized.
Net expense ratio has been calculated after applying any waiver/reimbursement, if applicable.
Annualized.
See accompanying Notes to Financial Statements.
45
FINANCIAL HIGHLIGHTS
Highland Opportunistic Credit Fund, Class Z
For the
Six Months
Ended
12/31/14*
(unaudited)
Net Asset Value, Beginning of Period
$
Income from Investment Operations:
Net investment income/(loss)
Net realized and unrealized gain/(loss)
Distributions from net investment income to
preferred shareholders, including declared
distributions
6.21
For the
Six Months
Ended
06/30/14**
$
6.04
2013**
2012**
2011**
2010**
$
$
$
$
4.49
3.36
0.05
1.50
—
—
—
—
—
(0.03)
Total from investment operations
(0.60)
0.17
1.55
1.13
(0.24)
0.49
Less Distributions Declared to Shareholders:
From net investment income
From return of capital
(0.15)
—
—
—
—
—
—
—
—
—
(0.05)
(3.82)
Total distributions declared to shareholders
(0.15)
—
—
—
—
(3.87)
Net Asset Value, End of Period
Total return(b)
$
5.46
(9.71)%(c)
Ratios based on average net assets of common shares:
Ratios and Supplemental Data:
Net assets, end of period (in 000’s)
$26,922
Gross expenses
1.29%(e)
(d)
Net expenses
0.87%(e)
Net investment income/(loss)
2.67%(e)
Common and Preferred Share Information at End of Period:
Ratios based on net assets of common and preferred shares:
Gross expenses
1.29%(e)
Net expenses(d)
0.87%(e)
Net investment income/(loss)
2.67%(e)
Portfolio turnover rate
16%(c)
Preferred Share Information at End of Period
Aggregate amount outstanding, end of period
(000’s)
$
—
Asset coverage per share(h)
$
—
*
**
(a)
(b)
(c)
(d)
(e)
(f)
(g)
(h)
46
$
6.21
2.81%(c)
$ 2,721
4.23%
2.00%
(1.53)%
6.04
34.52%
$
4.49
33.23%
$
816
8.52%
2.00%
0.93%
$
605
6.86%
5.95%
(1.55)%
$ 2,757
5.77%
5.77%
(0.27)%
$ 2,951
3.94%
3.94%
1.46%(f)
6.86%
5.95%
(1.55)%
—%
5.77%
5.77%
(0.27)%
8%
3.88%
3.88%
1.33%
3%(g)
—
—
8.52%
2.00%
0.93%
—%
$
$
—
—
$
$
—
—
$
$
$
3.36
(6.39)%
0.06(a)
0.46
$
4.23%
2.00%
(1.53)%
—%
$
$
(0.01)
(0.23)
6.98
(0.05)
0.22
0.08(a)
(0.68)
(0.04)(a)
1.17
3.60
—
—
$
$
$
3.60
12.88%
—
—
Effective July 1, 2014, the Highland Opportunistic Credit Fund changed its fiscal year end from December 31 to June 30.
Historical data shown is that of the Highland Special Situations Fund, which reorganized into the Highland Opportunistic Credit Fund on July 1, 2014 (See Note 13).
Per share net investment income has been calculated using the average share method.
Total return at net asset value assuming all distributions reinvested. For periods with waivers/reimbursements, had the Fund’s investment adviser not waived or reimbursed a
portion of expenses, total return would have been reduced.
Not annualized.
Net expense ratio has been calculated after applying any waiver/reimbursement, if applicable.
Annualized.
Net investment income ratio does not reflect payment to preferred shareholders. The ratio reflecting such payment was 1.34% and 7.13% for the years ended December 31,
2010 and December 31, 2009, respectively.
Portfolio turnover rate excludes securities delivered from processing the redemption-in-kind.
Asset coverage per share equals net assets of common shares plus the redemption value of the preferred shares divided by the total number of preferred shares outstanding
at the end of the period. During the year ended December 31, 2010 all the preferred shares were redeemed.
See accompanying Notes to Financial Statements.
NOTES TO FINANCIAL STATEMENTS (unaudited)
December 31, 2014
Note 1. Organization
Highland Funds I (the “Trust”) was organized as a Delaware
statutory trust on February 28, 2006. The Trust is registered under the Investment Company Act of 1940, as
amended (the “1940 Act”), as an open-end management
investment company with four separate portfolios, each of
which is non-diversified: Highland Long/Short Equity Fund
(the “Long/Short Equity Fund”), Highland Long/Short
Healthcare Fund (the “Long/Short Healthcare Fund”), Highland Floating Rate Opportunities Fund (the “Floating Rate
Opportunities Fund”) and Highland Opportunistic Credit
Fund (formerly, Highland Special Situations Fund) (the
“Opportunistic Credit Fund”) (each a “Fund” and, collectively, the “Funds”), and Highland/iBoxx Senior Loan ETF
which is reported separately.
Highland Opportunistic Credit Fund commenced operations on July 1, 2014 as separate series of the Trust (and
was formerly known as the Highland Special Situations
Fund (the “Predecessor Fund”) and is advised by the Highland Capital Management Fund Advisors, L.P. (the
“Investment Adviser”), which also served as the investment
adviser to the Predecessor Fund.
Fund Shares
Each Fund is authorized to issue an unlimited number of
transferable shares of beneficial interest with a par value
of $0.001 per share (each a “Share” and, collectively, the
“Shares”). The Funds currently offer Class A, Class C and
Class Z Shares. Class A Shares are sold with a front-end
sales charge. Class A and Class C Shares may be subject to
a contingent deferred sales charge. Class Z Shares are sold
only to certain eligible investors. Certain share classes
have their own sales charge and bear class specific
expenses, which include distribution fees and service fees.
At December 31, 2014, Highland Capital Management, L.P.,
an affiliate of Highland Capital Management Fund Advisors, L.P. (the “Investment Advisor”) owned 2.75% of the
total shares outstanding of the Long/Short Healthcare
Fund.
Capital Contribution
On October 1, 2012, the Investment Advisor contributed
$1,388 to Long/Short Healthcare Fund to mitigate the
negative impact to shareholders from an incorrect amount
recorded on a security.
On November 1, 2012, an option position was incorrectly
accounted for in the Highland Long/Short Healthcare Fund
by one of the Fund’s prime brokers. The error resulted in a
$107,222 loss on the position. Highland determined it was
a trade error and is in discussions with the prime broker to
make the Fund whole. As such, the loss was booked as a
contribution to capital and a receivable from broker.
Highland Funds I
Highland Capital Management, L.P., which is controlled
directly and indirectly by Mr. James Dondero and
Mr. Mark Okada, by virtue of their respective share ownership, and its general partner, Strand Advisors, Inc., of which
Mr. Dondero is the sole stockholder, invested $3 million into
the Highland Opportunistic Credit Fund on November 11,
2014.
Note 2. Significant Accounting Policies
The following summarizes the significant accounting policies consistently followed by the Funds in the preparation
of their financial statements.
Use of Estimates
The Funds are investment companies that follow the
accounting and reporting guidance of Accounting Standards Codification Topic 946 applicable to investment
companies. The Funds’ financial statements have been
prepared in conformity with accounting principles generally
accepted in the United States of America (“GAAP”), which
require management to make estimates and assumptions
that affect the reported amounts of assets and liabilities, the
disclosure of contingent assets and liabilities at the date of
the financial statements and the reported amounts of revenue and expenses during the reporting period. Changes in
the economic environment, financial markets and any other
parameters used in determining these estimates could
cause actual results to differ materially.
Determination of Class Net Asset Values
All income, expenses (other than distribution fees and service fees, which are class-specific expenses, as shown on
the Statement of Operations) and realized and unrealized
gains/(losses) are allocated to each class of shares of each
Fund on a daily basis for purposes of determining the net
asset value (“NAV”) of each class. Income and expenses are
allocated to each class based on the settled shares
method, while realized and unrealized gains/(losses) are
allocated based on the relative net assets of each class.
Valuation of Investments
In computing the Funds’ net assets attributable to Shares,
securities with readily available market quotations on the
New York Stock Exchange, NASDAQ or other nationally
recognized exchange use the closing quotations on the
respective exchange for valuation of those securities.
When portfolio securities are traded on the relevant day of
valuation, the valuation will be the last reported sale price
on that day. If there are no such sales on that day, the
security will be valued at the mean between the most
recently quoted bid and asked prices provided by the principal market makers. If there is more than one such principal market maker, the value shall be the average of such
Semi-Annual Report
47
NOTES TO FINANCIAL STATEMENTS (unaudited) (continued)
December 31, 2014
means. Securities without a sale price or quotations from
principal market makers on the valuation day may be
priced by an independent pricing service. Investments in
mutual funds are valued at their respective net asset values as determined by those mutual funds each business
day. Generally, the Funds’ loan and bond positions are not
traded on exchanges and consequently are valued based
on a mean of the bid and ask price from the third-party
pricing services or broker-dealer sources that the
Investment Adviser has determined generally have the
capability to provide appropriate pricing services and have
been approved by the Trustees.
Securities for which market quotations are not readily
available for which the Funds have determined the price
received from a pricing service or broker-dealer is “stale” or
otherwise does not represent fair value (such as when
events materially affecting the value of securities occur
between the time when market price is determined and
calculation of the Funds’ NAV), will be valued by the Funds
at fair value, as determined by the Funds’ Board of Trustees (the “Board”) or its designee in good faith in accordance with procedures approved by the Board, taking into
account factors reasonably determined to be relevant,
including: (i) the fundamental analytical data relating to the
investment; (ii) the nature and duration of restrictions on
disposition of the securities; and (iii) an evaluation of the
forces that influence the market in which these securities
are purchased and sold. In these cases, the Funds’ NAV will
reflect the affected portfolio securities’ fair value as
determined in the judgment of the Board or its designee
instead of being determined by the market. Using a fair
value pricing methodology to value securities may result in
a value that is different from a security’s most recent sale
price and from the prices used by other investment
companies to calculate their NAVs. Determination of fair
value is uncertain because it involves subjective judgments
and estimates.
There can be no assurance that the Funds’ valuation of a
security will not differ from the amount that it realizes
upon the sale of such security. Those differences could
have a material impact to the Funds. Foreign price quotations are converted to U.S. dollar equivalents using the 4:00
PM London Time Spot Rate.
Fair Value Measurements:
The Funds have performed an analysis of all existing
investments and derivative instruments to determine the
significance and character of all inputs to their fair value
determination. The levels of fair value inputs used to
measure the Funds’ investments are characterized into a
fair value hierarchy. Where inputs for an asset or liability
48
Semi-Annual Report
Highland Funds I
fall into more than one level in the fair value hierarchy, the
investment is classified in its entirety based on the lowest
level input that is significant to that investment’s valuation.
The three levels of the fair value hierarchy are described
below:
Level 1 — Quoted unadjusted prices for identical instruments in active markets to which the Fund has
access at the date of measurement;
Level 2 — Quoted prices for similar instruments in active
markets; quoted prices for identical or similar
instruments in markets that are not active, but
are valued based on executed trades; broker
quotations that constitute an executable price;
and alternative pricing sources supported by
observable inputs are classified within Level 2.
Level 2 inputs are either directly or indirectly
observable for the asset in connection with
market data at the measurement date; and
Level 3 — Model derived valuations in which one or more
significant inputs or significant value drivers are
unobservable. In certain cases, investments
classified within Level 3 may include securities
for which the Fund has obtained indicative
quotes from broker-dealers that do not
necessarily represent prices the broker may be
willing to trade on, as such quotes can be subject to material management judgment.
Unobservable inputs are those inputs that
reflect the Fund’s own assumptions that market
participants would use to price the asset or
liability based on the best available information.
The Investment Adviser has established policies and procedures, as described above and approved by the Board, to
ensure that valuation methodologies for investments and
financial instruments that are categorized within all levels
of the fair value hierarchy are fair and consistent. A Pricing
Committee has been established to provide oversight of
the valuation policies, processes and procedures, and is
comprised of personnel from the Investment Adviser. The
Pricing Committee meets monthly to review the proposed
valuations for investments and financial Instruments and is
responsible for evaluating the overall fairness and consistent application of established policies.
As of December 31, 2014, the Funds’ investments consisted
of senior loans, collateralized loan obligations, corporate
bonds and notes, common stocks, preferred stocks,
exchange-traded funds, rights, warrants, securities sold
short and options. The fair value of the Funds’ loans, bonds
and collateralized loan obligations are generally based on
quotes received from brokers or independent pricing
NOTES TO FINANCIAL STATEMENTS (unaudited) (continued)
December 31, 2014
Highland Funds I
services. Loans, bonds and collateralized loan obligations
with quotes that are based on actual trades with a sufficient level of activity on or near the measurement date are
classified as Level 2 assets. Loans, bonds and collateralized
loan obligations that are priced using quotes derived from
implied values, indicative bids, or a limited number of
actual trades are classified as Level 3 assets because the
inputs used by the brokers and pricing services to derive
the values are not readily observable.
At the end of each calendar quarter, management evaluates the Level 2 and 3 assets and liabilities for changes in
liquidity, including but not limited to: whether a broker is
willing to execute at the quoted price, the depth and consistency of prices from third party services, and the
existence of contemporaneous, observable trades in the
market. Additionally, management evaluates the Level 1
and 2 assets and liabilities on a quarterly basis for changes
in listings or delistings on national exchanges.
The fair value of the Funds’ common stocks, preferred
stocks, exchange-traded funds, rights, warrants and
options that are not actively traded on national exchanges
are generally priced using quotes derived from implied
values, indicative bids, or a limited amount of actual trades
and are classified as Level 3 assets because the inputs
used by the brokers and pricing services to derive the
values are not readily observable. Exchange traded
options are valued based on the last trade price on the
primary exchange on which they trade. If an option does
not trade, the mid-price is utilized to value the option.
Due to the inherent uncertainty of determining the fair
value of investments that do not have a readily available
market value, the fair value of the Funds’ investments may
fluctuate from period to period. Additionally, the fair value
of investments may differ significantly from the values that
would have been used had a ready market existed for
such investments and may differ materially from the values the Funds may ultimately realize. Further, such
investments may be subject to legal and other restrictions
on resale or otherwise less liquid than publicly traded
securities.
Semi-Annual Report
49
NOTES TO FINANCIAL STATEMENTS (unaudited) (continued)
December 31, 2014
Highland Funds I
The inputs or methodology used for valuing securities are not necessarily an indication of the risk associated with investing in
those securities. Transfers in and out of the levels are recognized at the value at the end of the period. A summary of the inputs
used to value each Fund’s assets as of December 31, 2014 is as follows:
Level 2
Significant
Observable
Inputs
Level 3
Significant
Unobservable
Inputs
Total value at
December 31, 2014
Level 1
Quoted
Price
$ 786,700,734
846,250
9,248,748
32,616,209
$ 786,700,734
846,250
9,248,748
32,616,209
829,411,941
829,411,941
—
—
(49,995,976)
(3,428,560)
(62,914,936)
(7,206,823)
(54,901,085)
(65,006,948)
(47,684,565)
(3,428,560)
(57,349,897)
(7,206,823)
(54,901,085)
(65,006,948)
(2,311,411)
—
(5,565,039)
—
—
—
—
—
—
—
—
—
(361,376)
(361,376)
—
—
Long/Short Equity Fund
Assets
Common Stocks(1)
Purchased Call Options
Registered Investment Companies
Investment Companies
Total Assets
Liabilities
Securities Sold Short
Consumer Discretionary
Consumer Staples
Financial
Healthcare
Industrials
Information Technology
Other Financial Instruments
Futures Contracts
Equity Contracts(2)
Written Options Contracts
Equity Contracts
Total Liabilities
Total
(1)
(2)
50
$
—
—
—
—
—
—
—
—
(27,500)
(27,500)
—
—
(243,843,204)
(235,966,754)
(7,876,450)
—
$ 585,568,737
$ 593,445,187
$(7,876,450)
See Investment Portfolio detail for industry breakout.
Includes cumulative unrealized appreciation/(depreciation) of future contracts as reported in the Investment Portfolio.
Semi-Annual Report
$
$
—
NOTES TO FINANCIAL STATEMENTS (unaudited) (continued)
December 31, 2014
Highland Funds I
Level 2
Significant
Observable
Inputs
Level 1
Quoted
Price
Total value at
December 31, 2014
Level 3
Significant
Unobservable
Inputs
Long/Short Healthcare Fund
Assets
U.S. Senior Loans(1)
Common Stocks
Consumer Discretionary
Financial
Healthcare
Biotechnology
Healthcare Distributors
Healthcare Equipment
Healthcare Facilities
Healthcare Services
Healthcare Supplies
Healthcare Technology
Life Sciences Tools & Services
Managed Healthcare
Pharmaceuticals
Industrials
Rights(1)
Equity Contracts
Warrants(1)
Equity Contracts
Purchased Call Options(1)
Investment Companies
$
4,301,250
$
—
$
—
$4,301,250
8,076,184
3,292,877
8,076,184
3,292,877
—
—
—
—
36,277,500
6,268,684
54,754,247
41,872,765
43,340,882
9,412,548
2,913,057
21,208,063
18,899,365
36,405,143
4,221,241
36,277,500
6,268,684
54,601,619
41,872,765
42,565,849
9,412,548
2,913,057
21,208,063
18,899,365
36,405,143
4,221,241
—
—
—
—
—
—
—
—
—
—
—
—
—
152,628
—
775,033
—
—
—
—
—
—
331,378
331,378
—
—
2,949,852
21,750
25,447,024
—
21,750
25,447,024
2,949,852
—
—
—
—
—
Total Assets
319,993,810
311,815,047
2,949,852
5,228,911
Liabilities
Securities Sold Short(1)
(127,771,020)
(127,771,020)
—
—
(127,771,020)
(127,771,020)
—
—
$ 192,222,790
$ 184,044,027
$2,949,852
$5,228,911
Total Liabilities
Total
(1)
See Investment Portfolio detail for industry breakout.
Semi-Annual Report
51
NOTES TO FINANCIAL STATEMENTS (unaudited) (continued)
December 31, 2014
Highland Funds I
Level 2
Significant
Observable
Inputs
Level 1
Quoted
Price
Total value at
December 31, 2014
Level 3
Significant
Unobservable
Inputs
Floating Rate Opportunities Fund
Assets
U.S. Senior Loans
Aerospace
Broadcasting
Chemicals
Consumer Discretionary
Consumer Products
Energy
Financial
Food & Drug
Forest Products & Containers
Gaming & Leisure
Healthcare
Housing
Information Technology
Manufacturing
Media & Telecommunications
Metals & Minerals
Retail
Service
Transportation
Utility
Foreign Denominated or Domiciled Senior Loans(1)
Collateralized Loan Obligations
Corporate Bonds & Notes(1)
Claims(1)
Common Stocks & Exchange-Traded Funds
Broadcasting
Consumer Discretionary
Energy
Gaming & Leisure
Healthcare
Housing
Media & Telecommunications
Other
Real Estate
Transportation
Utility
Warrants(1)
Equity Contracts
Investment Companies
$
8,665,367
4,418,190
33,811,698
3,124,676
9,385,904
30,219,491
24,268,248
13,402,481
14,908,262
20,912,812
52,986,222
7,684,961
66,095,924
30,729,415
82,379,678
3,800,689
37,235,542
108,482,453
26,954
50,434,217
79,924,862
93,014,363
49,591,261
435,319
$
—
—
—
—
—
—
—
—
—
—
—
—
—
—
—
—
—
—
—
—
—
—
—
—
$
1,900,952
—
33,811,698
—
—
9,804,839
10,856,155
13,402,481
14,908,262
14,973,918
18,833,085
—
61,084,285
6,225,803
52,812,457
3,800,689
37,235,542
84,422,394
—
45,865,111
56,717,171
93,014,363
49,591,261
435,319
$
6,764,415
4,418,190
—
3,124,676
9,385,904
20,414,652
13,412,093
—
—
5,938,894(2)
34,153,137
7,684,961
5,011,639
24,503,612
29,567,221
—
—
24,060,059
26,954
4,569,106
23,207,691
—
—
—
428,418
5,533,704
1,677,429
—
51,758
5,561,561
76,641,028
5,689,555
3
6,979
2,969,176
—
5,533,704
—
—
—
—
39,261,696
5,689,555
—
—
—
—
—
—
—
—
—
37,379,332
—
—
—
2,969,176
428,418
—
1,677,429
—(2)
51,758
5,561,561(2)
—(2)
—
3
6,979
—
—
46,258,200
—
46,258,200
—
—
—(2)
—
Total Assets
970,756,800
96,743,155
650,044,293
223,969,352
Liabilities
Securities Sold Short(1)
(15,253,200)
(15,253,200)
—
—
Total Liabilities
Total
(1)
(2)
52
(15,253,200)
(15,253,200)
—
—
$955,503,600
$ 81,489,955
$650,044,293
$223,969,352
See Investment Portfolio detail for industry/country breakout.
This category includes securities with a value of zero.
Semi-Annual Report
NOTES TO FINANCIAL STATEMENTS (unaudited) (continued)
December 31, 2014
Highland Funds I
Level 2
Significant
Observable
Inputs
Level 1
Quoted
Price
Total value at
December 31, 2014
Level 3
Significant
Unobservable
Inputs
Opportunistic Credit Fund
Assets
U.S. Senior Loans
Energy
Healthcare
Service
Utility
Corporate Bonds & Notes(1)
Foreign Corporate Bonds & Notes
Sovereign Bonds
Common Stocks
Commercial & Professional Services
Healthcare Equipment & Services
Materials
Media
Software & Services
Technology
Telecommunication Services
Utilities
Preferred Stocks(1)
Investment Companies
$
Total
(1)
299,207
2,150,625
2,587,765
9,572,724
6,234,290
2,201
6,418,912
$
—
—
—
—
—
—
—
$
299,207
—
2,587,765
8,573,702
6,234,290
—
6,418,912
$
—
2,150,625
—
999,022
—
2,201
—
456,222
20,149
1,594,303
474,043
1,897,309
1,110,889
859,935
946,770
855,000
5,776,041
34,347
—
—
—
1,897,309
1,110,889
—
—
—
5,776,041
—
—
—
474,043
—
—
—
946,770
855,000
—
421,875
20,149
1,594,303
—
—
—
859,935
—
—
—
$41,256,385
$8,818,586
$26,389,689
$6,048,110
See Investment Portfolio detail for industry/country breakout.
The tables below set forth a summary of changes in the Long/Short Healthcare Fund’s, the Floating Rate Opportunities Fund’s
and Opportunistic Credit Fund’s assets measured at fair value using significant unobservable inputs (Level 3) for the period
ended December 31, 2014. The Long/Short Equity Fund had no Level 3 assets as of June 30, 2014 or December 31, 2014.
Balance
as of
June 30,
2014
Transfers into
Level 3
Transfers
Out
of Level 3
Change in
Unrealized
Net
Gain/(Loss)
Amortization
Net
Net
Balance
on Level 3
(Accretion) of Realized Unrealized
as of
securities
Premium/
Gains/
Gains/
Net
Net December 31, still held at
(Discount) (Losses)
(Losses)
Purchases (Sales)
2014
period end
Highland Long/Short Healthcare Fund
US. Senior Loans
Common Stocks
Healthcare Equipment
Healthcare Services
Warrants
Equity Contracts
Total
(1)
$
—(1)
$
350,008
898,895
—
—
3,911,166
$5,160,069
—
$
$
—
$991
—
—
—
—
—
(2,941,504)
0
—
$(2,941,504)
$991
$
—
—
—
0
$
—
$
(95,341) $4,395,600 $
—
$4,301,250
$ (95,341)
152,628
775,033
(197,380)
(123,862)
(197,380)
(123,862)
—
—
—
—
(969,662)
—
—
—
—
—
$5,228,911
$(416,583)
$(1,386,245) $4,395,600 $
This category includes securities with a value of zero.
Semi-Annual Report
53
NOTES TO FINANCIAL STATEMENTS (unaudited) (continued)
December 31, 2014
Highland Funds I
Balance
as of
June 30,
2014
Net
Amortization
Transfers (Accretion)
Out
of Premium/
of Level 3 (Discount)
Transfers
into
Level 3
Net
Realized
Gains/
(Losses)
Net
Unrealized
Gains/
(Losses)
Net
Purchases
Change in
Unrealized
Gain/(Loss)
Balance
on Level 3
as of
securities
December 31, still held at
2014
period end
Net
(Sales)
Highland Floating Rate Opportunities Fund
U.S. Senior Loans
Aerospace
$
— $ 6,764,415
Broadcasting
5,448,553
—
Consumer
Discretionary
—
3,124,676
Consumer Products
—
9,385,904
Energy
8,541,667
12,872,984
Financial
—
13,412,093
Gaming & Leisure
6,260,739
—
Healthcare
19,715,899
6,784,399
Housing
8,179,490
—
Information
Technology
—
5,011,639
Manufacturing
—
19,472,047
Media &
Telecommunications
765,765
9,938,873
Service
—
24,060,059
Transportation
24,258
—
Utility
4,180,347
—
Foreign Denominated
or Domiciled Senior
Loans
3,078,998
11,757,246
Common Stocks &
Exchange-Traded
Funds
Broadcasting
2,529,226
—
Energy
1,677,429
—
Gaming & Leisure
3,944,631
—
Healthcare
12,836
—
Housing
5,287,935
—
Media &
Telecommunications
—
—
Real Estate
—
—
Transportation
1,821
—
Warrants
Equity Contracts
Total
54
—
—
—
—
—
—
$69,649,594 $122,584,335
Semi-Annual Report
$
$
$
—
—
—
—
—
—
—
—
5,589
—
—
32,782
(10)
—
—
$
— $
—
—
—
— $
—
— $
— $
—
(1,030,363)
—
—
—
—
—
—
—
(662)
—
—
(1,005,588)
—
(590,299)
(521,997)
(966,421)
—
268,454
8,142,054
636,438
—
—
—
—
—
31,565
—
—
—
—
5,680
—
—
20,474
(433,379)
—
—
157,768
312,495
—
2,696
58,471
—
(17,578)
(3,958)
—
—
—
—
—
—
—
—
—
—
1,585,567
—
—
—
—
(357,951)
—
13,572,444
38,922
273,626
—
—
—
—
—
—
—
—
—
—
—
—
—
$ 46,937
6,764,415 $
4,418,190
—
—
—
—
—
(163,874)
3,124,676
9,385,904
20,414,652
13,412,093
5,938,894
34,153,137
7,684,961
—
—
(1,005,588)
—
(590,299)
(521,997)
(966,421)
—
5,000,000
—
—
5,011,639
24,503,612
—
—
24,683,145
—
—
5,551,065
(5,705,358)
—
—
(5,399,019)
29,567,221
24,060,059
26,954
4,569,106
312,495
—
2,696
58,471
(370,001) 13,568,152
(4,805,168)
23,207,691
(86,731)
—
—
—
—
—
(3,328,424)
—
(17,517,075)
—
—
428,418
1,677,429
—
51,758
5,561,561
(357,951)
—
—
38,922
273,626
—
(751,478)
5,158
—
751,481
—
—
—
—
—
3
6,979
—
(751,478)
5,158
—
—
—
—
—
$1,305,336 $ 9,731,642 $58,600,789 $(37,949,281) $223,969,352 $(3,589,097)
NOTES TO FINANCIAL STATEMENTS (unaudited) (continued)
December 31, 2014
Highland Funds I
Balance
as of
June 30,
2014
Transfers
into
Level 3
Transfers
Out
of Level 3
Net
Amortization
(Accretion)
of Premium/
(Discount)
Net
Realized
Gains/
(Losses)
Net
Unrealized
Gains/
(Losses)
Net
Purchases
Net
(Sales)
—
—
$ (47,175)
44,941
$2,197,800
954,081
$
Balance
as of
December 31,
2014
Change in
Unrealized
Gain/(Loss)
on Level 3
securities
still held at
period end
Highland Opportunistic Credit Fund
US. Senior Loans
Healthcare
Utility
Foreign Corporate
Bonds & Notes
Common Stocks
Commercial &
Professional
Services
Healthcare
Equipment &
Services
Materials
Telecommunications
Total
$
—
—
$
—
—
$
—
—
$
—
—
$
—
—
$2,150,625
999,022
$
(47,175)
44,941.00
2,201
—
—
—
—
—
—
—
2,201
—
—
—
—
—
—
(20,625)
442,500
—
421,875
(20,625)
46,206
—
—
—
—
—
—
—
—
—
—
—
—
—
—
(26,057)
(312,282)
0
—
1,906,585
859,935
—
—
20,149
1,594,303
859,935
(26,057)
(312,282)
—
—
$(361,198)
$6,360,901
—
$6,048,110
$ (361,198)
$48,407
$
—
$
—
$
—
Investments designated as Level 3 may include assets
valued using quotes or indications furnished by brokers
which are based on models or estimates and may not be
executable prices. In light of the developing market conditions, the Investment Adviser continues to search for
observable data points and evaluate broker quotes and
indications received for portfolio investments. As a result,
for the period ended December 31, 2014, a net amount of
$122,584,335 of the Floating Rate Opportunities Fund’s
portfolio investments were transferred from Level 2 to
Level 3. Determination of fair values is uncertain because it
involves subjective judgments and estimates that are
$
$
unobservable. Transfers from Level 2 to Level 3 were due
to a decline in market activity (e.g. frequency of trades),
which resulted in a reduction of available market inputs to
determine price.
For the period ended December 31, 2014, a net amount of
$2,941,504 of the Long/Short Healthcare Fund were transferred from Level 3 to Level 2. Transfers from Level 3 to
Level 2 were due to an increase in market activity (e.g.
frequency of trades), which resulted in a reduction of available market inputs to determine price.
For the period ended December 31, 2014, there were no
transfers between Level 1 and Level 2.
Semi-Annual Report
55
NOTES TO FINANCIAL STATEMENTS (unaudited) (continued)
December 31, 2014
Highland Funds I
The following is a summary of significant unobservable inputs used in the fair valuations of assets and liabilities categorized
within Level 3 of the fair value hierarchy:
Ending
Balance at
12/31/14
Fund and
Category
Valuation Technique
Unobservable Inputs
Input Value(s)
Highland Long/Short Healthcare Fund
Debt
Common Stocks
$
4,301,250
927,661
Third-Party Pricing Vendor
Discounted Cash Flows
Weighted Scenarios
Multiple Analysis
N/A
Discount Rate
Scenario Probabilities
Multiples
N/A
21%
15% - 50%
3.8x
Third-Party Pricing Vendor
Multiples Analysis
Escrow Analysis
N/A
Multiple of Revenue
Multiple of EBITDA
Discount Rate
Terminal Multiple
Settlement Discount
Discount Rate
Multiple of Revenue
Multiple of EBITDA
Liquidity Discount
Minority Discount
Regional Market
Appreciation
N/A
Discount Rate
Terminal Multiple
Discount Rate
35% - 39%
N/A
18% - 50%
3.0x - 4.0x
20%
Third-Party Pricing Vendor
Third-Party Pricing Vendor
Multiples Analysis
Discounted Cash Flows
Sales Analysis
N/A
N/A
Multiple of EBITDA
Discount Rate
N/A
N/A
N/A
7.5x - 10.5x
21%
N/A
Total
$ 5,228,911
Highland Floating Rate Opportunities Fund
Debt
$216,243,204
Discounted Cash Flows
Common Stocks
7,726,148
Liquidation Analysis
Escrow Analysis
Multiples Analysis
Adjusted Appraisal
Third-Party Pricing Vendor
Discounted Cash Flows
N/A
.45x - .55x
4.75x - 5.25x
18% - 25%
3.0x - 4.0x
15% - 30%
20%
.45x - .55x
4.75x - 5.25x
15% - 25%
20%
Total
$223,969,352
Highland Opportunistic Credit Fund
Debt
Common Stocks
Total
$
3,151,848
2,896,262
$
6,048,110
The significant unobservable inputs used in the fair value
measurement of the Funds’ debt investments are discount
rates and liquidity discounts. Significant increases or
decreases in any of those inputs in isolation would result in
a significantly lower or higher fair value measurement.
Security Transactions
The significant unobservable inputs used in the fair value
measurement of the reporting entity’s common stock
investments are discount rates, scenario probabilities and
liquidity discounts. Significant changes in either of those
inputs in isolation would result in a significantly lower or
higher fair value measurement.
Income Recognition
56
Semi-Annual Report
Security transactions are accounted for on the trade date.
Realized gains/(losses) on investments sold are recorded
on the basis of specific identification method for both
financial statement and U.S. federal income tax purposes.
Dividend income is recorded on the ex-dividend date. Interest income is recorded on the accrual basis and includes
accretion of discounts and amortization of premiums of
debt instruments.
NOTES TO FINANCIAL STATEMENTS (unaudited) (continued)
December 31, 2014
U.S. Federal Income Tax Status
Each Fund is treated as a separate taxpayer for U.S.
federal income tax purposes. The Funds intend to qualify
each year as a “regulated investment company” under
Subchapter M of the Internal Revenue Code of 1986, as
amended, and will distribute substantially all of its taxable
income and gains, if any, for the tax year, and as such will
not be subject to U.S. federal income taxes. In addition, the
Funds intend to distribute, in each calendar year, all of
their net investment income, capital gains and certain
other amounts, if any, such that the Funds should not be
subject to U.S. federal excise tax. Therefore, no U.S. federal
income or excise tax provisions are recorded.
Management has analyzed the Funds’ tax positions taken
on U.S. federal income tax returns for all open tax years
(current and prior three tax years), and has concluded that
no provision for U.S. federal income tax is required in the
Funds’ financial statements. The Funds’ U.S. federal and
state income and U.S. federal excise tax returns for tax
years for which the applicable statutes of limitations have
not expired are subject to examination by the Internal
Revenue Service and state departments of revenue. Furthermore, management of the Funds, is also not aware of
any tax positions for which it is reasonably possible that
the total amounts of unrecognized tax benefits will significantly change in the next 12 months.
Distributions to Shareholders
The Funds intend to pay distributions from net investment
income, if any, on a monthly basis. The Funds intend to
pay net realized capital gains, if any, on an annual basis.
Statement of Cash Flows
Information on financial transactions which have been
settled through the receipt or disbursement of cash is
presented in the Statement of Cash Flows. The cash
amount shown in the Statement of Cash Flows is the
amount included within each Fund’s Statement of Assets
and Liabilities and includes cash on hand at its custodian
bank and sub-custodian bank, respectively, and does not
include cash posted as collateral in the segregated
account or with the broker-dealers.
Cash & Cash Equivalents
The Funds consider liquid assets deposited with a bank and
certain short-term debt instruments with original maturities of 3 months or less to be cash equivalents. These
investments represent amounts held with financial
institutions that are readily accessible to pay Fund
expenses or purchase investments. Cash and cash equivalents are valued at cost plus accrued interest, which
approximates market value. The value of cash equivalents
Highland Funds I
denominated in foreign currencies is determined by converting to U.S. dollars on the date of the Statement of
Assets and Liabilities.
Foreign Currency
Accounting records of the Funds are maintained in U.S.
dollars. Foreign currencies, investments and other assets
and liabilities denominated in foreign currencies are translated into U.S. dollars at the exchange rates using the current 4:00 PM London Time Spot Rate. Fluctuations in the
value of the foreign currencies and other assets and
liabilities resulting from changes in exchange rates,
between trade and settlement dates on securities transactions and between the accrual and payment dates on
dividends, interest income and foreign withholding taxes,
are recorded as unrealized foreign currency gains/(losses).
Realized gains/(losses) and unrealized appreciation/
(depreciation) on investment securities and income and
expenses are translated on the respective dates of such
transactions. The effects of changes in foreign currency
exchange rates on investments in securities are not segregated in the Statement of Operations from the effects of
changes in market prices of those securities, but are
included with the net realized and unrealized gain or loss
on investment securities.
Securities Sold Short
The Funds may sell securities short. A security sold short is
a transaction in which a Fund sells a security it does not
own in anticipation that the market price of that security
will decline. When a Fund sells a security short, it must
borrow the security sold short from a broker-dealer and
deliver it to the buyer upon conclusion of the transaction. A
Fund may have to pay a fee to borrow particular securities
and is often obligated to pay any dividends or other
payments received on such borrowed securities. Cash held
as collateral for securities sold short is classified as
restricted cash on the Long/Short Equity Fund, Long/Short
Healthcare Fund and the Floating Rate Opportunities
Funds’ Statements of Assets and Liabilities. Restricted cash
in the amounts of $201,043,427, $65,193,319 and
$43,712,172 were held with the broker for the Long/Short
Equity Fund, Long/Short Healthcare Fund and Floating
Rate Opportunities Fund, respectively. Additionally, securities valued at $255,580,004 and $96,516,278 were posted
in the Long/Short Equity Fund and Long/Short Healthcare
Fund’s segregated accounts as collateral.
Note 3. Derivative Transactions
The Funds are subject to equity price risk, interest rate risk
and foreign currency exchange rate risk in the normal
course of pursuing their investment objectives. The Funds
enter into derivative transactions for the purpose of
Semi-Annual Report
57
NOTES TO FINANCIAL STATEMENTS (unaudited) (continued)
December 31, 2014
hedging against the effects of changes in the value of portfolio securities due to anticipated changes in market conditions, to gain market exposure for residual and
accumulating cash positions, and for managing the duration of fixed income investments.
Forward Foreign Currency Exchange Contracts
The Funds enter into forward foreign currency exchange
contracts to facilitate transactions in foreign denominated
securities and to manage the Funds’ currency exposure.
Forward foreign currency exchange contracts are valued
at the mean between the bid and the offered forward rates
as last quoted by a recognized dealer. The aggregate principal amounts of the contracts are not recorded in the
Funds’ financial statements. Such amounts appear under
the caption Forward Foreign Currency Exchange Contracts
in the Investment Portfolio. Fluctuations in the value of the
contracts are recorded in the Statement of Assets and
Liabilities as an asset (or liability) and in the Statement of
Operations as unrealized appreciation (depreciation) until
the contracts are closed, when they are recorded as realized gains or losses on foreign currency related transactions. The Funds’ risks in using these contracts include
changes in the value of foreign currency or the possibility
that the counterparties do not perform under the contracts’ terms. When the Funds enter into a forward foreign
currency exchange contract, they are required to segregate cash or liquid securities with its custodian in an
amount equal to the value of the Funds’ total assets
committed to the consummation of the forward contract. If
the value of the segregated securities declines, additional
cash or securities is segregated so that the value of the
account will equal the amount of the Funds’ commitment
with respect to the contract. The Floating Rate Opportunities Fund invested in forward foreign currency
exchange contracts, however, none were held as of
December 31, 2014.
For the period ended December 31, 2014, the Long/Short
Equity Fund, the Long/Short Healthcare Fund and the
Opportunistic Credit Fund did not invest in forward foreign
currency exchange contracts.
Futures Contracts
A futures contract represents a commitment for the future
purchase or sale of an asset at a specified price on a specified date. The Funds may invest in interest rate, financial
and stock or bond index futures contracts subject to certain
limitations. The Funds invest in futures contracts to manage their exposure to the stock and bond markets and fluctuations in currency values. Buying futures tends to
increase a Fund’s exposure to the underlying instrument
while selling futures tends to decrease a Fund’s exposure to
58
Semi-Annual Report
Highland Funds I
the underlying instrument, or economically hedge other
Fund investments. With futures contracts, there is minimal
counterparty credit risk to the Funds since futures contracts are exchange-traded and the exchange’s clearinghouse, as counterparty to all traded futures, guarantees
the futures against default. A Fund’s risks in using these
contracts include changes in the value of the underlying
instruments, non-performance of the counterparties under
the contracts’ terms and changes in the liquidity of the
secondary market for the contracts. Futures contracts are
valued at the settlement price established each day by the
board of trade or exchange on which they principally trade.
Upon entering into a financial futures contract, the Funds
are required to pledge to the broker an amount of cash
and/or other assets equal to a certain percentage of the
contract amount, known as initial margin deposit. Subsequent payments, known as variation margins, are made
or received by the Funds each day, depending on the daily
fluctuation in the fair value of the underlying security. The
Funds record an unrealized gain/(loss) equal to the daily
variation margin. Should market conditions move
unexpectedly, the Funds may not achieve the anticipated
benefits of the futures contracts and may incur a loss. The
Funds recognize a realized gain/(loss) on the expiration or
closing of a futures contract. For the period ended
December 31, 2014, the Long/Short Equity Fund held
futures contracts as detailed in the Fund’s Investment Portfolio. The Long/Short Equity Fund entered into futures
transactions for the purpose of hedging against the effects
of changes in the value of portfolio securities due to anticipated changes in market conditions and to gain market
exposure for residual and accumulating cash positions.
For the period ended December 31, 2014, the Long/Short
Healthcare Fund, the Floating Rate Opportunities Fund and
the Opportunistic Credit Fund did not invest in futures
contracts.
Options
The Funds may utilize options on securities or indexes to
varying degrees as part of their principal investment strategy. An option on a security is a contract that gives the
holder of the option, in return for a premium, the right to
buy from (in the case of a call) or sell to (in the case of a
put) the writer of the option the security underlying the
option at a specified exercise or “strike” price. The writer of
an option on a security has the obligation upon exercise of
the option to deliver the underlying security upon payment
of the exercise price or to pay the exercise price upon
delivery of the underlying security. The Funds may hold
options, write option contracts, or both.
If an option written by a Fund expires unexercised, the
Fund realizes on the expiration date a capital gain equal to
NOTES TO FINANCIAL STATEMENTS (unaudited) (continued)
December 31, 2014
Highland Funds I
the premium received by the Fund at the time the option
was written. If an option purchased by a Fund expires
unexercised, the Fund realizes a capital loss equal to the
premium paid. Prior to the earlier of exercise or expiration,
an exchange-traded option may be closed out by an offsetting purchase or sale of an option of the same series
(type, underlying security, exercise price and expiration).
There can be no assurance, however, that a closing purchase or sale transaction can be affected when the Fund
desires. A Fund will realize a capital gain from a closing
purchase transaction if the cost of the closing option is less
than the premium received from writing the option, or, if it
is more, the Fund will realize a capital loss.
derivative instruments and related hedged items are
accounted for and c) how derivative instruments and
related hedged items affect an entity’s financial position,
financial performance and cash flows and d) how the netting of derivatives subject to master netting arrangements
affects the net exposure of a Fund related to the
derivatives.
The fair value of derivative instruments on the Statement
of Assets and Liabilities have the following risk exposure at
December 31, 2014.
Fair Value
Fund
During the period ended December 31, 2014, the Long/
Short Equity Fund invested in written options to provide
leveraged short exposure. The Long/Short Equity Fund and
the Long/Short Healthcare Fund invested in purchased
options to provide leveraged long exposure, to the underlying equity, which is consistent with the investment strategies of these Funds.
Transactions in written options for the period ended
December 31, 2014 were as follows:
Long/Short Equity Fund
Outstanding, June 30, 2014
Call Options Written
Put Options Written
Call Options Exercised
Call Options Expired
Put Options Expired
Call Options Closed
Put Options Closed
Outstanding, December 31, 2014
Number of
Contracts
Premium
5,500
42,609
28,250
(19,040)
(9,080)
(13,400)
(14,489)
(14,850)
$ 621,401
5,030,965
2,106,339
(1,849,158)
(990,848)
(939,159)
(2,190,959)
(1,167,180)
5,500
621,401
Long/Short Healthcare Fund
Number of
Contracts
Outstanding, June 30, 2014
Put Options Written
Put Options Expired
Put Options Closed
—
13,997
(12,182)
(1,815)
Outstanding, December 31, 2014
—
Premium
$
—
1,162,571
(837,820)
(324,751)
—
For the period ended December 31, 2014, the Opportunistic
Credit Fund and the Floating Rate Opportunities Fund did
not invest in options.
Additional Derivative Information
The Funds adopted amendments to authoritative guidance
on disclosures about derivative instruments and hedging
activities which require that the Funds disclose: a) how and
why an entity uses derivative instruments, b) how
Long/Short Equity Fund
Equity Price Risk
Long/Short Healthcare Fund
Equity Price Risk
(1)
(2)
(3)
Asset
Derivative
Liability
Derivative
$846,250(1) $388,876(2)(3)
21,750(1)
—
Statement of Assets and Liabilities location: Unaffiliated investments,
at value.
Statement of Assets and Liabilities location: Written option contracts,
at value.
Statement of Assets and Liabilities location: Variation margin receivable/payable.
To reduce counterparty credit risk with respect to OTC
transactions, the Funds have entered into master netting
arrangements, established within the Funds’ International
Swap and Derivatives Association, Inc. (“ISDA”) master
agreements, which allows the Funds to make (or to have
an entitlement to receive) a single net payment in the
event of default (close-out netting) for outstanding payables and receivables with respect to certain OTC
derivative positions in forward currency exchange contracts for each individual counterparty. In addition, the
Funds may require that certain counterparties post cash
and/or securities in collateral accounts to cover their net
payment obligations for those derivative contracts subject
to ISDA master agreements. If the counterparty fails to
perform under these contracts and agreements, the cash
and/or securities will be made available to the Funds.
Certain ISDA master agreements include credit related
contingent features which allow counterparties to OTC
derivatives to terminate derivative contracts prior to
maturity in the event the Funds’ net assets decline by a
stated percentage or the Funds fail to meet the terms of its
ISDA master agreements, which would cause the Funds to
accelerate payment of any net liability owed to the
counterparty.
For financial reporting purposes, the Funds do not offset
derivative assets and derivative liabilities that are subject
to netting arrangements in the Statement of Assets and
Liabilities. Bankruptcy or insolvency laws of a particular
Semi-Annual Report
59
NOTES TO FINANCIAL STATEMENTS (unaudited) (continued)
December 31, 2014
Highland Funds I
jurisdiction may impose restrictions on or prohibitions
against the right of offset in bankruptcy, insolvency or
other events.
Collateral terms are contract specific for OTC derivatives.
For derivatives traded under an ISDA master agreement,
the collateral requirements are typically calculated by netting the mark to market amount for each transaction
under such agreement and comparing that to the value of
any collateral currently pledged by the Fund or the
Counterparty.
For financial reporting purposes, cash collateral that has
been pledged to cover obligations of the Funds, if any, is
reported in restricted cash on the Statement of Assets and
Liabilities. Generally, the amount of collateral due from or
to a party must exceed a minimum transfer amount
threshold before a transfer has to be made. To the extent
amounts due to the Funds from its counterparties are not
fully collateralized, contractually or otherwise, the Funds
bear the risk of loss from counterparty non-performance.
The Floating Rate Opportunities Fund held certain investments during the period with such Master Arrangements;
however, none were outstanding at December 31, 2014.
The effect of derivative instruments on the Statement of
Operations for the period ended December 31, 2014, is as
follows:
Fund
Net
Realized
Gain/(Loss)
on
Derivatives
Long/Short Equity Fund
Equity Price Risk
$(1,578,221)(1)
Foreign Currency Risk
Long/Short Healthcare Fund
Equity Price Risk
Floating Rate Opportunities Fund
Foreign Currency Risk
(1)
(2)
(3)
(4)
(5)
60
Net Change in
Unrealized
Appreciation/
(Depreciation)
on Derivatives
378,352(3)
$ (355,585)(2)
—
(4,206,937)(1)
2,084,473(2)
(76,615)(4)
(164,958)(5)
Statement of Operations location: Net realized gain/(loss) on written
options contracts, future contracts and/or investments.
Statement of Operations location: Net change in unrealized appreciation/(depreciation) on written options contracts, futures contracts
and/or investments.
Statement of Operations location: Net realized gain/(loss) on futures
contracts.
Statement of Operations location: Net realized gain/(loss) on foreign
currency related transactions.
Statement of Operations location: Net change in unrealized appreciation/(depreciation) on foreign currency related translations.
Semi-Annual Report
The average volume of derivative activity for the period
ended December 31, 2014, is as follows:
Fund
Long/Short Equity Fund
Purchased Options Contracts
Futures Contracts
Written Options Contracts
Long/Short Healthcare Fund
Purchased Options Contracts
Floating Rate Opportunities Fund
Forward Foreign Currency Exchange
Contracts
Units/
Contracts
5,067
—
5,500
Appreciation/
(Depreciation)
$
—
(9,016)
—
5,904
—
—
(54,986)
Note 4. Securities Lending
Each Fund may make secured loans of its portfolio securities amounting to not more than one-third of the value of
its total assets, thereby realizing additional income. The risks
in lending portfolio securities, as with other extensions of
credit, consist of possible delays in recovery of the securities
or possible loss of rights in the collateral should the borrower fail financially and possible investment losses in the
investment of collateral. Pursuant to the Funds’ securities
lending policies, securities loans are made to borrowers
pursuant to agreements requiring that loans be continuously secured by collateral in cash or securities of the
U.S. government or its agencies or instrumentalities, irrevocable letters of credit issued by a bank, or forms of
collateral acceptable under a Fund’s securities lending
agreement, at least equal at all times to the current market
value of the securities subject to the loan. The borrower
pays to a Fund an amount equal to any interest or dividends received on securities subject to the loan. The Fund
retains all or a portion of the interest received on investment
of the cash collateral or receives a fee from the borrower.
Securities lending transactions are entered into Securities
Lending Authorization Agreements (“SLAA”), which provide
the right, in the event of default (including bankruptcy or
insolvency) for the non-defaulting party to liquidate the
collateral and calculate a net exposure to the defaulting
party or request additional collateral. In the event that a
borrower defaults, the Fund, as lender, would offset the
market value of the collateral received against the market
value of the securities loaned. The value of the collateral is
typically greater than that of the market value of the securities loaned, leaving the lender with a net amount payable
to the defaulting party. However, bankruptcy or insolvency
laws of a particular jurisdiction may impose restrictions on
or prohibitions against such a right of offset in the event of
a SLAA counterparty’s bankruptcy or insolvency. Under the
SLAA, the Fund can reinvest cash collateral, or, upon an
NOTES TO FINANCIAL STATEMENTS (unaudited) (continued)
December 31, 2014
Highland Funds I
event of default, resell or repledge the collateral, and the
borrower can resell or repledge the loaned securities. The
risks of securities lending also include the risk that the
borrower may not provide additional collateral when
required or may not return the securities when due. To
mitigate this risk, the Fund benefits from a borrower
default indemnity provided by State Street Bank and Trust
Company (“State Street”). State Street’s indemnity allows
for full replacement of securities lent.
The following table presents financial instruments that are
subject to enforceable netting arrangements as of
December 31, 2014:
Gross Amounts Not Offset in the Statement of Assets and Liabilities
Gross
Amounts of
Liabilities
Presented
in
Statement
of Assets &
Liabilities(1)
Financial
Instrument(2)
Collateral
Received
Long/Short Equity Fund $32,616,209
$(37,547,859)
$—
Fund
Net
Amount
(not less
than 0)
$
—
Long/Short Healthcare
Fund
25,447,024
(30,204,867)
—
—
Floating Rate
Opportunities Fund
46,258,200
(44,668,043)
—
1,590,157
5,776,041
(7,391,979)
—
—
Opportunistic Credit
Fund
(1)
(2)
In some instances, the actual collateral received and/or pledged may
be more than the amount shown here due to overcollateralization.
Represents market value of securities on loan at period end.
For the period ended December 31, 2014, the market value
of securities loaned and the amounts secured with cash
and securities collateral, which are included on each
Fund’s Investment Portfolio were as follows:
Fund
Security
Lending
Market
Value
Long/Short Equity Fund
$37,547,859
Long/Short Healthcare
Fund
30,204,867
Floating Rate Opportunities
Fund
44,668,043
Opportunistic Credit Fund
7,391,979
Security
Lending
Collateral
Cash
Collateral(1)
Security
Lending
Collateral
Non-Cash
Collateral(2)
$32,616,209
$6,154,989
25,447,024
5,758,263
46,258,200
5,776,041
—
2,560,784
(1)
(2)
The loaned securities were secured with cash collateral which was
invested in the State Street Navigator Prime Securities Lending Portfolio.
Security lending non-cash collateral consists of U.S. Government
Treasury & Agency debt.
Note 5. U.S. Federal Income Tax Information
The character of income and gains to be distributed is
determined in accordance with income tax regulations
which may differ from U.S. GAAP. These differences include
(but are not limited to) investments organized as partnerships for tax purposes, foreign taxes, investments in
futures, losses deferred to off-setting positions, tax treatment of organizational start-up costs, losses deferred due
to wash sale transactions, tax treatment of net investment
loss and distributions in excess of net investment income,
dividends deemed paid upon shareholder redemption of
fund shares and tax attributes from fund reorganizations.
Reclassifications are made to the Funds’ capital accounts
to reflect income and gains available for distribution (or
available capital loss carryovers) under income tax regulations. These reclassifications have no impact on net
investment income, realized gains or losses, or net asset
value of the Funds. The calculation of net investment
income per share in the Financial Highlights table excludes
these adjustments.
For the year ended June 30, 2014, permanent differences
chiefly resulting from net investment losses, dividends on
short sales, foreign currency gains and losses, equalization,
short sale holding period reclass and REITs were identified
and reclassified among the components of the Funds’ net
assets as follows:
Fund
Long/Short Equity Fund
Long/Short Healthcare
Fund
Floating Rate
Opportunities Fund
Opportunistic Credit
Fund
Undistributed
Net
Investment
Income
Accumulated
Net Realized
Gain/(Loss)
Paid-inCapital
$15,200,622
$(24,117,366)
$ 8,916,744
2,507,262
(2,507,262)
—
1,999,912
5,807,652
(7,807,564)
(4,604)
4,604
—
At June 30, 2014, the Funds’ most recent tax year end, components of distributable earnings on a tax basis is as follows:
Fund
Undistributed
Income
Undistributed
Long-Term
Capital Gains
Undistributed
Tax-Exempt
Income
Other
Temporary
Differences(1)
Long/Short Equity Fund
Long/Short Healthcare Fund
Floating Rate Opportunities Fund
Opportunistic Credit Fund
$35,513,945
5,135,693
—
6,646
$2,142,884
825,971
—
—
$—
—
—
—
$(128,307)
(68,008)
(734,192)
(1,566)
Accumulated
Capital and
Other Losses
Net Tax
Appreciation/
(Depreciation)(2)
$
$ 48,050,464
(166,154)
(368,061,778)
100,422
—
—
(925,122,182)
(8,966,293)
Semi-Annual Report
61
NOTES TO FINANCIAL STATEMENTS (unaudited) (continued)
December 31, 2014
(1)
(2)
Highland Funds I
Other temporary differences is comprised of dividends payable, organizational expenses, partnership adjustments and default loan market discounts.
Any differences between book-basis and tax-basis net unrealized appreciation/(depreciation) are primarily due to deferral of losses from wash sales, partnership adjustments, disallowed losses for unsettled short sales, defaulted bonds, and other adjustments.
As of June 30, 2014, the Floating Rate Opportunities Fund and the Opportunistic Credit Fund had capital loss carryovers as
indicated below. The capital loss carryovers are available to offset future realized capital gains to the extent provided in the
Code and regulations promulgated thereunder. To the extent that these carryover losses are used to offset future capital gains,
it is probable that the gains so offset will not be distributed to shareholders because they would be taxable as ordinary income.
Fund
2015(1)
Floating Rate Opportunities Fund
Opportunistic Credit Fund
(1)
(2)
(3)
2016(1)
2017(1)
No
Expiration
LongTerm(2)
2018(1)
Total
$8,394,093(3) $232,159,979(3) $450,912,670(3) $143,999,490(3) $36,958,128
—
—
3,212,361
3,076,455
2,659,072
$872,424,360
8,947,888
The Fund’s ability to utilize the capital loss carryforwards is limited under Internal Revenue Service regulations.
On December 22, 2010, the Regulated Investment Company Modernization Act of 2010 (the “Modernization Act”) was signed into law. The Modernization
Act modifies several of the Federal income and excise tax provisions related to RICs. Under the Modernization Act, new capital losses may now be carried
forward indefinitely, and retain the character of the original loss as compared with pre-enactment law where capital losses could be carried forward for
eight years, and carried forward as short-term capital losses, irrespective of the character of the original loss.
These capital loss carryforward amounts were acquired in a reorganization and are available to offset future capital gains of Floating Rate Opportunities
Fund.
For the year ended June 30, 2014, there were no capital loss carryforwards for the Long/Short Equity Fund and Long/Short
Healthcare Fund.
The tax character of distributions paid during the years ended June 30, 2014 and June 30, 2013 (unless otherwise indicated) is
as follows:
Distributions Paid From:
Fund
Long/Short Equity Fund
2014
2013
Floating Rate Opportunities Fund
2014
2013
(1)
Ordinary
Income(1)
LongTerm
Capital
Gains
$70,812,740
24,088,101
$3,123,983
—
46,931,922
21,786,709
—
—
Return of
Capital
$
—
—
950,186
6,857,328
For tax purposes, short-term capital gains distributions, if any, are considered ordinary income distributions.
Unrealized appreciation and depreciation at December 31, 2014, based on cost of investments for U.S. federal income tax
purposes is:
Fund
Gross
Appreciation
Gross
Depreciation
Net
Appreciation/
(Depreciation)(1)
Cost
Long/Short Equity Fund
Long/Short Healthcare Fund
Floating Rate Opportunities Fund
Opportunistic Credit Fund
$30,801,587
5,606,925
77,378,866
769,382
$ 10,704,136
6,573,068
494,481,686
4,416,959
$ 20,097,451
(966,143)
(417,102,820)
(3,647,577)
$ 809,314,490
320,959,953
1,387,859,620
44,903,962
(1)
62
Any differences between book-basis and tax-basis net unrealized appreciation/(depreciation) are primarily due to deferral of losses from wash sales, partnership adjustments, disallowed losses for unsettled short sales, defaulted bonds, and other adjustments.
Semi-Annual Report
NOTES TO FINANCIAL STATEMENTS (unaudited) (continued)
December 31, 2014
Highland Funds I
Qualified Late Year Ordinary and Post October
Losses
Under current laws, certain capital losses realized after
October 31 may be deferred (and certain ordinary losses
after January 1st may be deferred) and treated as occurring on the first day of the following fiscal year. For the
fiscal year ended June 30, 2014, the Funds elected to defer
the following losses incurred from November 1, 2013
through June 30, 2014:
Fund
Floating Rate Opportunities Fund
Opportunistic Credit Fund
Realized
Capital
Losses
$52,697,823
18,406
In the first quarter of the 2014 fiscal year, the Trust identified a book-tax difference related to foreign-currency
losses that were recorded as a capital loss in Floating Rate
Opportunities Fund for fiscal year 2013, which should have
been reported as a reduction of income in the financial
statements for the fiscal year ended June 30, 2013. This
resulted in a reclassification from “Distributions to shareholders from: Net Investment Income” to “Distributions to
shareholders from: Return of Capital” on the Statement of
Changes in Net Assets in the amount of $6,857,328. The
reclassification also affects the components of Net Assets
on the Statement of Assets and Liabilities, the character of
distributions represented on the Financial Highlights, and
the tax character of earnings and distributions represented
in Note 4, U.S. Federal Income Tax Information in prior year
financial statements. Management evaluated the impact
of the adjustment and determined the impact was not
material to the prior period financial statements; however
management has revised the June 30, 2013 financial
statements as presented herein. The correction has no
effect on Net Asset Value, total Net Assets, Fund returns, or
total increase in net assets resulting from operations. The
error also impacted previously reported financial highlights. See the Financial Highlights statement for the
impact to financial highlights as reported at June 30, 2013.
The following tables illustrate the effect of the adjustment in the Statement of Assets and Liabilities, Statement of Changes in
Net Assets, and related footnote disclosures for the period and year ended June 30, 2013, to allow a reader to roll the components of the Fund Net Assets from the prior year to the current year for Floating Rate Opportunities Fund.
Previous
Published
Amount
Corrected
Amount
Statement of Assets and Liabilities:
Net Assets Consist of:
Par Value
Paid-in-Capital
Accumulated net investment loss
Accumulated net realized gain/(loss)
Net unrealized appreciation/(depreciation)
Net Assets
$
96,419
2,101,640,498
(24,729,109)
(883,237,412)
(447,520,300)
$ 746,250,096
$
Adjustment
96,419
2,108,497,826
(24,003,420)
(890,820,429)
(447,520,300)
$
—
(6,857,328)
(725,689)
7,583,017
—
$ 746,250,096
$
—
Semi-Annual Report
63
NOTES TO FINANCIAL STATEMENTS (unaudited) (continued)
December 31, 2014
Highland Funds I
Previous
Published
Amount
Adjustment
(8,158,527)
(71,663)
(11,460,980)
(2,095,539)
$ (10,545,249)
(91,537)
(15,271,797)
(2,735,454)
$ 2,386,722
19,874
3,810,817
639,915
(2,386,722)
(19,874)
(3,810,817)
(639,915)
—
—
—
—
(2,386,722)
(19,874)
(3,810,817)
(639,915)
(28,644,037)
(28,644,037)
—
$ 24,729,109
$ (24,003,420)
$ (725,689)
Corrected
Amount
Previous
Published
Amount
Adjustment
Corrected
Amount
Statement of Changes in Net Assets:
Distributions to shareholders from:
Net investment income
Class A
Class B
Class C
Class Z
$
Return of capital
Class A
Class B
Class C
Class Z
Total distributions
Accumulated net investment loss
U.S. Federal Income Tax Information
Tax Reclassifications:
Undistributed Net Investment Income
Accumulated Net Realized Gain/(Loss)
Paid-in-Capital
Components of Distributable Earnings
Undistributed Ordinary Income
Undistributed Long-Term Capital Gains
Undistributed Tax-Exempt Income
Accumulated Capital and Other Losses
Net Tax Appreciation/(Depreciation)
Tax Character of Distributions
Distributions paid from:
Ordinary Income
Long-Term Capital Gains
Return of Capital
Note 6. Credit Agreement
Effective June 13, 2012, the Floating Rate Opportunities
Fund entered into a $300,000,000 credit agreement (the
“Credit Agreement”) with State Street Bank and Trust
Company with an expiration of June 10, 2013. On
October 29, 2012, the Credit Agreement was amended,
reducing the facility from $300,000,000 to $250,000,000.
For the period June 13, 2012 to June 9, 2013, interest was
charged at a rate equal to the adjusted London Interbank
Offered Rate (“LIBOR”) plus 1.10% per annum based on the
outstanding borrowings. On June 10, 2013, the Credit
Agreement was amended to reduce the interest rate to the
adjusted LIBOR plus 0.95% per annum based on the out
64
Semi-Annual Report
$
(34,312)
6,891,640
(6,857,328)
$
691,377
(691,377)
—
$ (725,689)
7,583,017
(6,857,328)
—
—
—
(884,992,058)
(469,802,752)
725,689
—
—
(892,575,075)
(469,802,752)
(725,689)
—
—
7,583,017
—
21,786,709
—
6,857,328
28,644,037
—
—
(6,857,328)
—
6,857,328
standing borrowings. In addition, a commitment fee of
0.15% per annum is charged on the unutilized commitment amount. On May 16, 2014, the Credit Agreement was
amended to increase the facility to $350,000,000 and to
extend the expiration date to May 15, 2015. Included in the
Statement of Operations is $60,608 of interest expense
related to the Credit Agreement and $278,129 of commitment fees. As of December 31, 2014, the fair value of the
outstanding debt under the Credit Agreement was estimated to be $13,144,888, and would be categorized as
Level 3 within the fair value hierarchy. The fair value was
estimated based on discounting the cash flows owed using
a discount rate of 0.64% over the 11 month risk free rate.
NOTES TO FINANCIAL STATEMENTS (unaudited) (continued)
December 31, 2014
Highland Funds I
The Floating Rate Opportunities Fund is required to maintain 300% asset coverage with respect to amounts outstanding under the Credit Agreement, as amended, and
the Fund is required to maintain 300% asset coverage
under Section 18(a) of the 1940 Act. Asset coverage is
calculated by subtracting the Fund’s total liabilities, not
including any amount representing bank loans and senior
securities, from the Fund’s total assets and dividing the
result by the principal amount of the borrowings outstanding. As of the dates indicated below, the Floating Rate
Opportunities Fund’s debt outstanding and asset coverage
was as follows:
Date
Total Amount
Outstanding
12/31/2014
06/30/2014
06/30/2013
06/30/2012
06/30/2011
06/30/2010
06/30/2009
06/30/2008
06/30/2007
$ 13,000,000
60,000,000
N/A
89,000,000
135,000,000
115,000,000
181,000,000
511,000,000
960,000,000
% of Asset
Coverage of
Indebtedness
1,873.1%
1,577.6
N/A
718.4
659.9
606.0
465.8
409.3
400.5
Effective May 24, 2013, the Long/Short Equity Fund and
the Long/Short Healthcare Fund entered into a
$25,000,000 unsecured credit agreement with State Street
Bank and Trust Company (the “Unsecured Credit
Agreement”) to be used for temporary purposes to facilitate portfolio liquidity. The Funds have access to the
facility, but aggregate borrowings cannot exceed
$25,000,000. Interest is charged to the Funds based on
their borrowing at a rate equal to the greater of the
Federal Funds Effective Rate plus 1.25% or the LIBOR plus
1.25%. In addition, the Funds agree to pay commitment
fee expenses of 0.10% on the undrawn amounts, which
are included in “Commitment fees-credit agreement” on
the Statement of Operations. On May 23, 2014, the Credit
Agreement was amended to extend the expiration date to
May 22, 2015. Effective July 31, 2014, the Credit Agreement was amended to include the Opportunistic Credit
Fund. On October 27, 2014, the Credit Agreement was
increased to $150,000,000. Additionally, the Funds agreed
to pay increased commitment fee expenses of 0.15% on
undrawn amounts. For the period ended December 31,
2014, Floating Rate Opportunities Fund and the Opportunistic Credit Fund’s average daily note balance was
$12,032,609 and $910, respectively, at a weighted average
interest rate of 0.95%.
During the period ended December 31, 2014, the Long/
Short Equity Fund and the Long/Short Healthcare Fund did
not have any outstanding borrowings.
Note 7. Advisory, Administration, Service and
Distribution, Trustee, and Other Fees
Investment Advisory Fees and Sub-Advisory
Fees
The Investment Adviser receives from the Long/ Short
Equity Fund, the Opportunistic Credit Fund and the Long/
Short Healthcare Fund monthly investment advisory fees,
computed and accrued daily based on the Average Daily
Managed Assets of each Fund, at the annual rate of 2.25%,
1.00% and 1.00%, respectively.
The Long/Short Healthcare Fund and the Investment
Adviser have entered into a sub-advisory agreement with
“Highland Capital Healthcare Advisors LP (formerly,
“Cummings Bay Capital Management, L.P.”) (“HCHA” or the
“Sub-Adviser”). The Fund pays sub-advisory fees to HCHA
at an annual rate of 0.50% of the Average Daily Managed
Assets of the Fund.
The Investment Adviser receives from the Floating Rate
Opportunities Fund monthly investment advisory fees,
computed and accrued daily, based on an annual rate of
0.65% of the Fund’s Average Daily Managed Assets for the
first $1 billion, 0.60% of the Fund’s Average Daily Managed
Assets for the next $1 billion and 0.55% of the Fund’s
Average Daily Managed Assets over $2 billion.
“Average Daily Managed Assets” of a Fund means the
average daily value of the total assets of the Fund less all
accrued liabilities of the Fund (other than the aggregate
amount of any outstanding borrowings constituting financial leverage).
Administration Fees
The Investment Adviser provides administrative services to
each Fund other than the Opportunistic Credit Fund. For its
services, the Investment Adviser receives a monthly
administration fee, computed and accrued daily, at the
annual rate of 0.20% of each Fund’s Average Daily managed net assets.
Service and Distribution Fees
Highland Capital Funds Distributor, Inc. (formerly, Foreside
Funds Distributors LLC) (the “Underwriter”), serves as the
principal underwriter and distributor of each Fund’s
shares. The Underwriter receives the front-end sales
charge imposed on the sale of Class A Shares and the
contingent deferred sales charge (“CDSC”) imposed on
certain redemptions of Class A and Class C Shares. For the
period ended December 31, 2014, the Underwriter
received $30,200, $457,010, $142,122 and $681 of frontend sales charges for Class A Shares of the Long/Short
Equity Fund, the Long/Short Healthcare Fund, the Floating
Semi-Annual Report
65
NOTES TO FINANCIAL STATEMENTS (unaudited) (continued)
December 31, 2014
Highland Funds I
Rate Opportunities Fund and Opportunistic Credit Fund,
respectively. The Underwriter also received $1,076, $4,408
and $12,420 of CDSC for Class C Shares of the Long/Short
Equity Fund, the Long/Short Healthcare Fund and the
Floating Rate Opportunities Fund, respectively.
The Funds have adopted a plan pursuant to Rule 12b-1
under the 1940 Act (the “Plan”) for Class A Shares and Class
C Shares of the Funds, which requires the payment of a
monthly fee to the Underwriter at an annual rate of the
average daily net assets of each class as follows:
Fund
Long/Short Equity Fund
Long/Short Healthcare Fund
Floating Rate Opportunities Fund
Opportunistic Credit Fund
Class A
Shares
Class C
Shares
0.35%
0.35%
0.35%
0.35%
1.00%
1.00%
0.85%
0.85%
For the period ended December 31, 2014, the Distribution
and Service fees, which are included on the Statement of
Operations for each class, were as follows:
Fund
Long/Short Equity Fund
Long/Short Healthcare Fund
Floating Rate Opportunities Fund
Opportunistic Credit Fund
Class A
Fees
Class C
Fees
$293,735
291,137
551,526
4,913
$ 272,708
257,139
1,536,600
271
Expense Limits and Fee Reimbursements
For the Long/Short Equity Fund, the Investment Adviser
contractually agreed to waive a portion of its advisory fee
in an amount equal to 1.25% of the Fund’s Average Daily
Managed Assets. This waiver will continue through at least
October 31, 2015 and may not be terminated prior to this
date without the action or consent of the Board of Trustees.
For the Floating Rate Opportunities Fund, the Investment
Adviser contractually agreed to limit the total annual
operating expenses of the Floating Rate Opportunities
Fund (exclusive of fees paid by the Fund pursuant to its
distribution plan under Rule 12b-1 under the Investment
company Act of 1940, taxes, dividend expenses on short
sales, brokerage commissions and other transaction costs,
acquired fund fees and expenses, and extraordinary
expenses) of the Fund to 0.95% of average daily net assets
of the Fund (the “FRO Expense Cap”). The FRO Expense Cap
will continue through at least October 31, 2015, and may
not be terminated prior to this date without the action or
consent of the Board of Trustees.
The Trust, on behalf of the Floating Rate Opportunities
Fund, has contractually agreed to pay the Investment
Adviser all amounts previously paid, waived or reimbursed
by the Investment Adviser with respect to the Fund pursuant to the Expense Cap, provided that the amount of
66
Semi-Annual Report
such additional payment in any year, together with all
other expenses of the Fund, (exclusive of fees paid by the
Fund pursuant to its distribution plan under Rule 12b-1
under the 1940 Act, taxes, dividend expenses on short
sales, brokerage commissions and other transaction costs,
acquired fund fees and expenses, and extraordinary
expenses) in the aggregate, would not cause the Fund’s
total annual operating expenses in any such year to
exceed the amount of the Expense Cap, and provided further that no additional payments by the Trust will be made
with respect to amounts paid, waived or reimbursed by the
Investment Adviser more than 36 months from the date
such amounts were paid, reimbursed or waived. The
Investment Adviser may not recoup any amounts previously paid, waived or reimbursed under the Expense Cap
before payment of the Floating Rate Opportunities Fund’s
operating expenses for the year in which the Investment
Adviser intends to recoup such amounts.
During the period, the Floating Rate Opportunities Fund
received proceeds from litigation. $2,942,785 of the litigation proceeds were used to offset legal fees incurred by
the Floating Rate Opportunities Fund during prior periods.
This resulted in a negative legal fees balance on the
Statement of Operations.
For the period ended December 31, 2014, the Investment
Adviser recouped $2,942,785 of amounts previously paid,
waived or reimbursed.
The remaining recoupment amount for the Floating Rate
Opportunities Fund was $1,138,049 and $1,358,354 at
December 31, 2014 and June 30, 2014, respectively, and
which will expire on December 31, 2017 and June 30, 2017,
respectively.
For Opportunistic Credit Fund, the Investment Adviser contractually agreed to limit the total annual operating
expenses (exclusive of fees paid by the Fund pursuant to
its distribution plan under Rule 12b-1 under the Investment
Company Act of 1940, taxes, dividend expenses on short
sales, interest payments, brokerage commissions and
other transaction costs, acquired fund fees and expenses,
and extraordinary expenses (collectively, the “Excluded
Expenses”)) to 0.90% of average daily net assets of the
Fund (the “HOCF Expense Cap”). The HOCF Expense Cap will
continue through at least October 31, 2015, and may not
be terminated prior to this date without the action or consent of the Board of Trustees. The Trust, on behalf of the
Opportunistic Credit Fund, has contractually agreed to pay
the Investment Adviser all amounts previously paid,
waived or reimbursed by the Investment Adviser with
respect to the Fund pursuant to the Expense Cap, provided
that the amount of such additional payment in any year,
together with all other expenses (excluding Excluded
NOTES TO FINANCIAL STATEMENTS (unaudited) (continued)
December 31, 2014
Expenses) of the Fund, in the aggregate, would not cause
the Fund’s total annual operating expenses in any such
year to exceed the amount of the Expense Cap, and provided further that no additional payments by the Trust will
be made with respect to amounts paid, waived or
reimbursed by the Investment Adviser more 36 months
from the date such amounts were paid, reimbursed or
waived. The Investment Adviser may not recoup any
amounts previously paid, waived or reimbursed under the
Expense Cap before payment of the Opportunistic Credit
Fund’s operating expenses for the year in which the
Investment Adviser intends to recoup such amounts. The
recoupment amount for the Opportunistic Credit Fund was
$56,079 for the period ended December 31, 2014, and
which will expire on December 31, 2017.
For the period ended December 31, 2014, the Investment
Adviser waived $6,085,133, $1,138,049 and $56,079 for the
Long/Short Equity Fund, Floating Rate Opportunities Fund
and Opportunistic Credit Fund, respectively.
Fees Paid to Officers and Trustees
Each Trustee who is not an “interested person” of the
Funds as defined in the 1940 Act (the “Independent
Trustees”) receives an annual retainer of $150,000 payable
in quarterly installments and allocated among each portfolio in the Highland Fund Complex based on relative net
assets. The “Highland Fund Complex” consists of all of the
registered investment companies and NexPoint Capital,
Inc., a closed-end management investment company that
has elected to be treated as a business development
company under the 1940 Act, which are each advised by
the Investment Adviser or its affiliated advisors as of the
date of this report.
The Funds pay no compensation to their two interested
Trustees or any of their officers, all of whom are employees
of the Investment Adviser.
Note 8. Redemption Fees
The Funds impose a 2.00% redemption fee on some
Class A, Class C and Class Z Shares that are redeemed or
exchanged within two months or less after the date of
purchase, unless otherwise waived by a Fund. The fee is
calculated based on the shares’ aggregate net asset value
on the date of redemption, is allocated back to each class
based on relative net assets and is deducted from the
redemption proceeds on the Statement of Changes in Net
Assets. The redemption fees were removed as of
October 17, 2013.
Note 9. Disclosure of Significant Risks and
Contingencies
The primary risks of investing in the Funds are described
below in alphabetical order:
Highland Funds I
Concentration Risk
The Funds may focus their investments in instruments of
only a few companies. The concentration of the Funds’ portfolio in any one obligor would subject the Funds to a greater
degree of risk with respect to defaults by such obligor, and
the concentration of the portfolio in any one industry would
subject the Funds to a greater degree of risk with respect to
economic downturns relating to such industry.
Counterparty Credit Risk
Counterparty credit risk is the potential loss the Funds may
incur as a result of the failure of a counterparty or an
issuer to make payments according to the terms of a contract. Counterparty credit risk is measured as the loss the
Funds would record if its counterparties failed to perform
pursuant to the terms of their obligations to the Funds.
Because the Funds may enter into over-the-counter forwards, options, swaps and other derivative financial
instruments, the Funds may be exposed to the credit risk of
their counterparties. To limit the counterparty credit risk
associated with such transactions, the Funds conduct
business only with financial institutions judged by the
Investment Adviser to present acceptable credit risk.
Credit Risk
Investments rated below investment grade are commonly
referred to as high-yield, high risk or “junk debt.” They are
regarded as predominantly speculative with respect to the
issuing company’s continuing ability to meet principal and/
or interest payments. Investments in high yield debt and
high yield Senior Loans may result in greater net asset
value fluctuation than if a Fund did not make such
investments.
Corporate debt obligations, including Senior Loans, are
subject to the risk of non-payment of scheduled interest
and/or principal. Non-payment would result in a reduction
of income to a Fund, a reduction in the value of the corporate debt obligation experiencing non-payment and a
potential decrease in the NAV of a Fund.
Currency Risk
A portion of the Funds’ assets may be quoted or denominated in non-U.S. currencies. These securities may be
adversely affected by fluctuations in relative currency
exchange rates and by exchange control regulations. The
Funds’ investment performance may be negatively
affected by a devaluation of a currency in which the
Funds’ investments are quoted or denominated. Further,
the Funds’ investment performance may be significantly
affected, either positively or negatively, by currency
exchange rates because the U.S. dollar value of securities
quoted or denominated in another currency will increase
Semi-Annual Report
67
NOTES TO FINANCIAL STATEMENTS (unaudited) (continued)
December 31, 2014
or decrease in response to changes in the value of such
currency in relation to the U.S. dollar.
Forward Foreign Currency Exchange Contracts
Risk
The Funds are subject to foreign currency exchange rate
risk in the normal course of pursuing its investment
objectives. The Funds may use forward contracts to gain
exposure to, or hedge against changes in the value of foreign currencies. A forward contract represents a commitment for the future purchase or sale of an asset at a
specified price on a specified date. Upon entering into such
contracts, daily fluctuations in the value of the contract are
recorded for financial statement purposes as unrealized
gains or losses by the Funds. At the expiration of the contracts, the Funds realize the gain or loss. Upon entering into
such contracts, the Funds bear the risk of exchange rates
moving unexpectedly, in which case, the Funds may not
achieve the anticipated benefits of the forward contracts
and may realize a loss. With forwards, there is counterparty credit risk to the Funds because the forwards are not
exchange-traded, and there is no clearinghouse to
guarantee the forwards against default.
Futures Contracts Risk
The risks of entering into futures contracts include the
possibilities that their markets may become illiquid and/or
changes in the values of the contracts may not correlate to
changes in the values of the underlying instruments.
Hedging Transactions Risk
Each Fund may engage in “hedging,” the practice of
attempting to offset a potential loss in one position by
establishing an opposite position in another investment.
Hedging strategies in general are usually intended to limit
or reduce investment risk, but can also be expected to limit
or reduce the potential for profit. For example, if the Fund
has taken a defensive posture by hedging its portfolio, and
stock prices advance, the return to investors will be lower
than if the portfolio had not been hedged. No assurance
can be given that any particular hedging strategy will be
successful, or that the Investment Adviser will elect to use
a hedging strategy at a time when it is advisable.
Illiquid Securities Risk
The investments made by the Funds may be illiquid, and
consequently the Funds may not be able to sell such
investments at prices that reflect the Investment Adviser’s
assessment of their value or the amount originally paid for
such investments by the Funds. Illiquidity may result from
the absence of an established market for the investments
as well as legal, contractual or other restrictions on their
resale and other factors. Furthermore, the nature of the
68
Semi-Annual Report
Highland Funds I
Funds’ investments, especially those in financially distressed companies, may require a long holding period prior
to profitability.
Indemnification Risk
The Funds have a variety of indemnification obligations
under contracts with their service providers. The Funds’
maximum exposure under these arrangements is
unknown. However, the Funds have not had prior claims or
losses pursuant to these contracts and expect the risk of
loss to be remote.
Investments in Foreign Markets Risk
Investments in foreign markets involve special risks and
considerations not typically associated with investing in
the United States. These risks include revaluation of
currencies, high rates of inflation, restrictions on repatriation of income and capital, and adverse political and
economic developments. Moreover, securities issued in
these markets may be less liquid, subject to government
ownership controls, tariffs and taxes, subject to delays in
settlements, and their prices may be more volatile.
The Funds may be subject to capital gains and repatriation
taxes imposed by certain countries in which they invest. Such
taxes are generally based on income and/or capital gains
earned or repatriated. Taxes are accrued based upon net
investment income, net realized gains and net unrealized
appreciation as income and/or capital gains are earned.
Leverage Risk
The Funds may use leverage in their investment programs,
including the use of borrowed funds and investments in
certain types of options, such as puts, calls and warrants,
which may be purchased for a fraction of the price of the
underlying securities. While such strategies and techniques
increase the opportunity to achieve higher returns on the
amounts invested, they also increase the risk of loss. To the
extent the Funds purchase securities with borrowed funds,
their net assets will tend to increase or decrease at a
greater rate than if borrowed funds are not used. If the
interest expense on borrowings were to exceed the net
return on the portfolio securities purchased with borrowed
funds, the Funds’ use of leverage would result in a lower
rate of return than if the Funds were not leveraged.
Options Risk
There are several risks associated with transactions in
options on securities. For example, there are significant
differences between the securities and options markets
that could result in an imperfect correlation between these
markets, causing a given transaction not to achieve its
objectives. A transaction in options or securities may be
unsuccessful to some degree because of market behavior
or unexpected events.
NOTES TO FINANCIAL STATEMENTS (unaudited) (continued)
December 31, 2014
When a Fund writes a covered call option, the Fund forgoes, during the option’s life, the opportunity to profit from
increases in the market value of the security covering the
call option above the sum of the premium and the strike
price of the call, but retains the risk of loss should the price
of the underlying security decline. The writer of an option
has no control over the time when it may be required to
fulfill its obligation and once an option writer has received
an exercise notice, it must deliver the underlying security
in exchange for the strike price.
When a Fund writes a covered put option, the Fund bears
the risk of loss if the value of the underlying stock declines
below the exercise price minus the put premium. If the
option is exercised, the Fund could incur a loss if it is
required to purchase the stock underlying the put option at
a price greater than the market price of the stock at the
time of exercise plus the put premium the Fund received
when it wrote the option. While the Fund’s potential gain in
writing a covered put option is limited to distributions
earned on the liquid assets securing the put option plus the
premium received from the purchaser of the put option,
the Fund risks a loss equal to the entire exercise price of
the option minus the put premium.
Restricted Securities Risk
Restricted securities (i.e., securities acquired in private placement transactions) and illiquid securities may offer higher
yields than comparable publicly traded securities. The
Funds, however, may not be able to sell these securities
when the Investment Adviser considers it desirable to do so
or, to the extent they are sold privately, may have to sell
them at less than the price of otherwise comparable securities. Restricted securities are subject to limitations on resale
which can have an adverse effect on the price obtainable
for such securities. Also, if in order to permit resale the securities are registered under the Securities Act at the Funds’
expense, the Funds’ expenses would be increased.
Senior Loans Risk
The risk that the issuer or a senior may fail to pay interest
or principal when due, and changes in market interest
rates may reduce the value of the senior loan or reduce
the Funds’ returns. The risks associated with senior loans
are similar to the risks of high yield debt securities. Senior
loans and other debt securities are also subject to the risk
of price declines and to increases in prevailing interest
rates. The Long/Short Healthcare Fund’s, Floating Rate
Opportunities Fund’s and Opportunistic Credit Fund’s
investments in senior loans are typically below investment
grade and are considered speculative because of the
credit risk of their issuers.
Short-Selling Risk
Short sales by the Funds that are not made where there is
an offsetting long position in the asset that it is being sold
Highland Funds I
short theoretically involve unlimited loss potential since the
market price of securities sold short may continuously
increase. Short selling allows the Funds to profit from
declines in market prices to the extent such decline exceeds
the transaction costs and costs of borrowing the securities.
However, since the borrowed securities must be replaced by
purchases at market prices in order to close out the short
position, any appreciation in the price of the borrowed
securities would result in a loss. Purchasing securities to
close out the short position can itself cause the price of
securities to rise further, thereby exacerbating the loss. The
Funds may mitigate such losses by replacing the securities
sold short before the market price has increased significantly. Under adverse market conditions, a Fund might
have difficulty purchasing securities to meet margin calls on
its short sale delivery obligations, and might have to sell
portfolio securities to raise the capital necessary to meet its
short sale obligations at a time when fundamental investment considerations would not favor such sales.
Troubled, Distressed or Bankrupt Companies
Risk
The Funds invest in companies that are troubled, in distress
or bankrupt. As such, they are subject to a multitude of
legal, industry, market, environmental and governmental
forces that make analysis of these companies inherently
difficult. Further, the Investment Adviser relies on company
management, outside experts, market participants and
personal experience to analyze potential investments for
the Fund. There can be no assurance that any of these
sources will prove credible, or that the resulting analysis
will produce accurate conclusions.
Note 10. Investment Transactions
Purchases and Sales of Securities
The cost of purchases and the proceeds from sales of
investments, other than short-term securities and shortterm options, for the period ended December 31, 2014,
were as follows:
U.S Government
Securities(1)
Fund
Long/Short
Equity Fund
Long/Short
Healthcare
Fund
Floating Rate
Opportunities
Fund
Opportunistic
Credit Fund
(1)
Other Securities
Purchases
Sales
Purchases
Sales
$—
$—
$2,179,763,802
$2,203,131,967
—
—
770,507,602
720,070,968
—
—
355,267,627
277,502,082
—
—
43,440,761
3,873,257
The Funds did not have any purchases or sales of U.S. Government
Securities for the period ended December 31, 2014.
Semi-Annual Report
69
NOTES TO FINANCIAL STATEMENTS (unaudited) (continued)
December 31, 2014
Highland Funds I
Note 11. Affiliated Issuers
Under Section 2 (a)(3) of the Investment Company Act of 1940, as amended, a portfolio company is defined as “affiliated” if a
fund owns five percent or more of its outstanding voting securities.
The Long/Short Equity Fund held at least five percent of the outstanding voting securities of the following companies during
the period ended December 31, 2014:
Issuer
Shares at
June 30,
2014
Shares at
December 31,
2014
—
830,975
$—
—
830,975
$—
Highland Energy MLP Fund (Registered Investment Companies)
Market Value
June 30, December 31,
2014
2014
Affiliated
Income
Purchases
Sales
$9,248,748
$209,012
$10,209,012
$—
$9,248,748
$209,012
$10,209,012
$—
The Floating Rate Opportunities Fund held at least five percent of the outstanding voting securities of the following companies
during the period ended December 31, 2014:
Shares at
June 30,
2014
Issuer
CCS Medical, Inc. (Common Stocks &
Exchange-Traded Funds)
Endurance Business Media, Inc. (Common Stocks &
Exchange-Traded Funds)
Highland/iBoxx Senior Loan, ETF (Common Stocks &
Exchange-Traded Funds)
LLV Holdco, LLC (Common Stocks &
Exchange-Traded Funds
Nevada Land Group LLC (Common Stocks &
Exchange-Traded Funds)
Shares at
December 31,
2014
207,031
207,031
4,921
4,921
—
1,150,000
296,331
34,992
—
—
—
22,919,500
5,689,555
339,297
—
16,678,069
34,992
3,944,631
—
—
—
—
8
8
—
—
—
—
—
1,396,952
543,283
$26,876,967
$5,741,313
$339,297
$—
$16,678,069
CCS Medical, Inc.
Dollar Tree, Inc.
70
Unfunded Loan
Commitment
Value
Unrealized
Appreciation
(Depreciation)
$ 2,290,545
50,000,000
$ 2,290,545
50,000,000
—
—
Semi-Annual Report
$
51,758
$
Sales
—
As of December 31, 2014, the Floating Rate Opportunities
Fund had unfunded loan commitments of $52,290,545,
which could be extended at the option of the borrower, as
detailed below:
12,836
Purchases
$—
Note 12. Unfunded Loan Commitments
$
Affiliated
Income
—
For the period ended December 31, 2014, the Long/Short
Healthcare Fund and the Opportunistic Credit Fund did not
hold any affiliated securities.
Borrower
Market Value
June 30,
December 31,
2014
2014
$
—
Unfunded loan commitments are marked to market on the
relevant day of valuation in accordance with the Fund’s
valuation policies. As of December 31, 2014, the Floating
Rate Opportunities Fund recognized net discount and
unrealized appreciation/(depreciation) on unfunded transactions of $0. The net change in unrealized appreciation/
(depreciation) on unfunded transactions was $0.
During the period ended December 31, 2014, the Long/
Short Equity Fund, the Long/Short Healthcare Fund and the
Opportunistic Credit Fund did not hold unfunded loan
commitments.
NOTES TO FINANCIAL STATEMENTS (unaudited) (continued)
December 31, 2014
Note 13. Reorganization
Effective July 1, 2014, all assets and liabilities of the
Predecessor Fund were acquired by Highland
Opportunistic Credit Fund pursuant to an Agreement and
Plan of Reorganization dated July 1, 2014 (the “Fund
Merger”). In the Fund Merger, shareholders of the
Predecessor Fund received Class Z Shares of the Highland
Opportunistic Credit Fund in exchange for Common Shares
of the Predecessor Fund.
Because the Highland Opportunistic Credit Fund had no
investment operations prior to the closing of the Fund
Merger, and based on the similarity of the Highland Opportunistic Credit Fund to the Predecessor Fund, the Predecessor Fund is treated as the survivor of the Fund Merger
for accounting and performance reporting purposes.
Accordingly, all performance and other information shown
for the Highland Opportunistic Credit Fund for periods prior
to July 1, 2014 is that of the Predecessor Fund.
Mr. James Dondero, the current portfolio manager of the
Opportunistic Credit Fund, also served as the portfolio
manager of the Predecessor Fund since its inception on
May 18, 2005.
Note 14. Legal Matters
Highland Funds I
the Defendants to return the proceeds received from the
payoff of the term loan at par on July 31, 2007. The proceeds received by FRO totaled $4,000,000. Additionally, the
court ordered the Defendants to pay simple interest on the
amount returned at an annual rate of 9%. In November
2009, FRO and other Defendants filed appealed the decision
from the Bankruptcy Court to the District Court. On
December 22, 2009, FRO posted $5,310,479 (“Security”) with
the Court. This amount was recorded in the Statement of
Assets and Liabilities and the Statement of Operations. On
February 11, 2011, the District Court entered an order
quashing all liability of the Lenders and declaring the remedies against the Lenders null and void. On May 15, 2012,
the Eleventh Circuit Court of Appeal (“Eleventh Circuit”)
issued its decision reversing the judgment of the District
Court, affirming the liability findings of the Bankruptcy
Court, and remanding to the District Court for further proceedings consistent with their opinion. Briefing has been
completed at the District Court, but the case has been
stayed pending the outcome of a related US Supreme Court
case which could have a significant effect on the Tousa
action. The US Supreme Court case was heard on January 14, 2014, and the Parties are waiting the decision.
FRO’s posted Security will be released upon a final appellate
ruling.
Matters Relating to FRO’s Investment in TOUSA, Inc.
Note 15. New Accounting Pronouncements
Floating Rate Opportunities Fund (“FRO”) is one of numerous
defendants (“Lenders”) that have been named in an adversary proceeding pending in the Bankruptcy Court of the
Southern District of Florida (the “Court”). The action, entitled
In re Tousa Inc., et al., was filed on July 15, 2008, by the
Official Committee of Unsecured Creditors of TOUSA, Inc.
and its affiliates (the “Plaintiff”), which are home building
companies to which the Lenders loaned money through
different lending facilities. Plaintiff alleges that monies used
to repay the Lenders should be voided as fraudulent and
preferential transfers under the bankruptcy laws. More
specifically, Plaintiff alleges that subsidiaries of the home
building companies were forced to become co-borrowers
and guarantors of the monies used to repay the Lenders,
and that the subsidiaries did not receive fair consideration
or reasonably equivalent value when they transferred the
proceeds to repay the Lenders. Plaintiff seeks to void the
transfers and other equitable relief. FRO and other Funds
and accounts managed by the Investment Adviser and the
other Lenders are named as defendants in two separate
lending capacities; first, as lenders in a credit agreement
(the “Credit Lenders”); and second, as lenders in a term loan
(the “Term Loan Lenders”). The case went to trial, which
concluded in August 2009. On October 13, 2009, the Bankruptcy Court ruled for the Plaintiff in the action and ordered
ASU 2014-11
In June 2014, the Financial Accounting Standards Board
issued Accounting Standards Update 2014-11 Transfers
and Servicing (Topic 860) — Repurchase-to-Maturity
Transactions, Repurchase Financings, and Disclosures
(“ASU 2014-11”). Effective for interim and annual reporting
periods in fiscal years that begin after December 15, 2014,
ASU 2014-11 requires repurchase-to-maturity transactions
to be accounted as secured borrowings, as if the transferor
retains effective control of the transferred assets (even
though they are not returned to the transferor at
settlement). ASU 2014-11 applies to all entities that enter
into repurchase-to-maturity transactions or repurchase
financings. Although still evaluating the potential impact of
ASU 2014-11, Trust management expects that this will not
have a material impact on the Funds’ financial statements.
Note 16. Subsequent Events
Management has evaluated the impact of all subsequent
events on the Funds through the date the financial statements were issued, and has determined that there were no
subsequent events.
Semi-Annual Report
71
ADDITIONAL INFORMATION (unaudited)
December 31, 2014
Additional Portfolio Information
The Investment Adviser and its affiliates manage other
accounts, including registered and private funds and
individual accounts. Although investment decisions for the
Funds are made independently from those of such other
accounts, the Investment Adviser may, consistent with
applicable law, make investment recommendations to
other clients or accounts that may be the same or different
from those made to the Funds, including investments in
different levels of the capital structure of a company, such
as equity versus senior loans, or that involve taking
contradictory positions in multiple levels of the capital
structure. The Investment Adviser has adopted policies and
procedures that address the allocation of investment
opportunities, execution of portfolio transactions, personal
trading by employees and other potential conflicts of
interest that are designed to ensure that all client accounts
are treated equitably over time. Nevertheless, this may
create situations where a client could be disadvantaged
because of the investment activities conducted by the
Investment Adviser for other client accounts. When the
Funds and one or more of such other accounts are prepared to invest in, or desire to dispose of, the same security, available investments or opportunities for each will be
allocated in a manner believed by the Investment Adviser
to be equitable to the Funds and such other accounts. The
Investment Adviser also may aggregate orders to purchase and sell securities for the Funds and such other
accounts. Although the Investment Adviser believes that,
over time, the potential benefits of participating in volume
transactions and negotiating lower transaction costs
should benefit all accounts including the Funds, in some
cases these activities may adversely affect the price paid
or received by the Funds or the size of the position
obtained or disposed of by the Funds.
Disclosure of Fund Expenses
As a shareholder of a Fund, you incur two types of costs:
(1) transaction costs, including sales charges (loads) on
purchases and redemption fees; and (2) ongoing costs,
including management fees; distribution (12b-1) and service fees; and other Fund expenses. This example is intended
to help you understand the ongoing costs (in dollars) of
investing in your Fund and to compare these costs with the
ongoing costs of investing in other mutual funds.
The example is based on an investment of $1,000 invested
at the beginning of the period and held for the six-month
period July 1, 2014 through December 31, 2014, unless
otherwise indicated.
This table illustrates your Fund’s costs in two ways:
Actual Expenses: The first part of the table provides
information about actual account values and actual
72
Semi-Annual Report
Highland Funds I
expenses. You may use the information in this line,
together with the amount you invested, to estimate the
expenses that you paid over the period. Simply divide your
account value by $1,000 (for example, an $8,600 account
value divided by $1,000 = 8.6), then multiply the result by
the number in the first line under the heading entitled
“Expenses Paid During Period” to estimate the expenses
you paid on your account during this period.
Hypothetical Example for Comparison Purposes: The
second part of the table provides information about hypothetical account values and hypothetical expenses based
on your Fund’s actual expense ratio and an assumed rate
of return of 5% per year before expenses, which is not your
Fund’s actual return. The actual expense ratio includes
voluntary fee waivers or expense reimbursements by the
Fund’s investment adviser. The expense ratio would be
higher had the fee waivers or expense reimbursements not
been in effect. The hypothetical account values and
expenses may not be used to estimate the actual ending
account balance or expenses you paid for the period. You
may use this information to compare the ongoing costs of
investing in your Fund and other funds. To do so, compare
this 5% hypothetical example with the 5% hypothetical
examples that appear in the shareholder reports of the
other funds.
Please note that the expenses shown in the table are
meant to highlight your ongoing costs only and do not
reflect any transactional costs, such as sales charges
(loads) or redemption fees. Therefore, the second part of
the table is useful in comparing ongoing costs only, and
will not help you determine the relative total costs of owning different funds. In addition, if these transactional costs
were included, your costs would have been higher.
ADDITIONAL INFORMATION (unaudited) (continued)
December 31, 2014
Long/Short Equity Fund
Actual Fund Return
Class A
Class C
Class Z
Hypothetical
Class A
Class C
Class Z
Long/Short Healthcare Fund
Actual Fund Return
Class A
Class C
Class Z
Hypothetical
Class A
Class C
Class Z
Floating Rate Opportunities Fund
Actual Fund Return
Class A
Class C
Class Z
Hypothetical
Class A
Class C
Class Z
Opportunistic Credit Fund
Actual Fund Return
Class A
Class C
Class Z
Hypothetical
Class A
Class C
Class Z
Highland Funds I
Beginning
Account
Value
7/1/2014
Ending
Account
Value
12/31/2014
$1,000.00
1,000.00
1,000.00
$1,002.20
998.00
1,003.80
2.30%
2.98%
1.97%
$11.61
15.01
9.95
0.22%
-0.20%
0.38%
$1,000.00
1,000.00
1,000.00
$1,013.61
1,010.18
1,015.27
2.30%
2.98%
1.97%
$11.67
15.10
10.06
5.00%
5.00%
5.00%
$1,000.00
1,000.00
1,000.00
$1,028.50
1,025.40
1,030.40
2.17%
4.43%
1.25%
$11.10
22.62
6.40
2.85%
2.54%
3.04%
$1,000.00
1,000.00
1,000.00
$1,014.27
1,002.87
1,018.90
2.17%
4.43%
1.25%
$11.02
22.36
6.36
5.00%
5.00%
5.00%
$1,000.00
1,000.00
1,000.00
$ 976.80
974.40
979.70
1.36%
1.86%
1.00%
$ 6.78
9.26
4.99
(2.32)%
(2.56)%
(2.03)%
$1,000.00
1,000.00
1,000.00
$1,018.35
1,015.83
1,020.16
1.36%
1.86%
1.00%
$ 6.92
9.45
5.14
5.00%
5.00%
5.00%
$1,000.00
1,000.00
1,000.00
$ 899.70
896.10
902.90
1.27%
1.72%
0.87%
$ 6.08
$ 8.22
$ 4.17
-10.03%
-10.39%
(9.71)%
$1,000.00
1,000.00
1,000.00
$1,018.80
$1,016.53
$1,020.82
1.27%
1.72%
0.87%
$ 6.46
$ 8.74
$ 4.43
5.00%
5.00%
5.00%
Annualized
Expense
Ratio(1)
Expenses
Paid
During the
Period(2)
Actual
Returns
for
Period
(1) Annualized, based on the Fund’s most recent fiscal half-year expenses, including dividends on short positions and interest expenses, if any.
(2) Expenses are equal to the Fund’s annualized expense ratio including interest expense and dividends on short positions, if any, multiplied by the average
account value over the period, multiplied by the number of days in the fiscal half-year, then divided by 365.
Approval of Highland Funds I Advisory and
Sub-Advisory Agreements
The Trust has retained the Investment Advisor to manage
the assets of each Fund pursuant to investment advisory
agreements between the Investment Advisor and each
such Fund (the “Advisory Agreements”). The Trust has also
retained Highland Capital Healthcare Advisors, L.P. (the
“Sub-Advisor” and, together with the Investment Advisor,
the “Advisors”) to serve as sub-advisor to Highland Funds I,
on behalf of the Long/Short Healthcare Fund, pursuant to a
sub-advisory agreement (the “Sub-Advisory Agreement”
and, together with the Advisory Agreements, the
“Agreements”) by and among the Investment Advisor, the
Sub-Advisor and Highland Funds I. The Agreements have
been approved by the Funds’ Board of Trustees, including
a majority of the Independent Trustees.
Semi-Annual Report
73
ADDITIONAL INFORMATION (unaudited) (continued)
December 31, 2014
Following an initial two-year term, each of the Agreements
continues in effect from year-to-year, provided that such
continuance is specifically approved at least annually by
the vote of holders of at least a majority of the outstanding
shares of the Fund or by the Board of Trustees and, in
either event, by a majority of the Independent Trustees of
the Fund casting votes in person at a meeting called for
such purpose.
At a meeting held on June 5-6, 2014, the Board of Trustees,
including the Independent Trustees, considered and
approved, for an initial two-year period commencing
July 1, 2014, the advisory agreement between Highland
Funds I, on behalf of the Opportunistic Credit Fund, and the
Investment Advisor. As part of the Board of Trustees’ deliberations, the Board considered that the Opportunistic
Credit Fund was expected to consolidate with Highland
Special Situations Fund (the “Predecessor Fund”) on July 1,
2014. The Board of Trustees further considered that the
Opportunistic Credit Fund was expected to be the accounting survivor of the proposed consolidation and, as such,
the financial information and performance information for
the Opportunistic Credit Fund was expected to be that of
the Predecessor Fund.
At a meeting held on August 28, 2014, the Board of Trustees gave preliminary consideration to information bearing
on the continuation of the Agreements, for a one-year
period commencing December 31, 2014, with respect to
the Long/Short Equity Fund, Long/Short Healthcare Fund
and Floating Rate Opportunities Fund. The primary purpose of the meeting was to ensure that the Trustees had
ample opportunity to evaluate matters they deemed relevant in considering the continuation of the Agreements,
and to request any additional information they considered
reasonably necessary to their deliberations, without undue
time constraints.
At a meeting held on September 11-12, 2014, the Board of
Trustees, including the Independent Trustees, approved,
for a one-year period commencing on December 31,
2014, the continuance of the Agreements with respect to
the Long/Short Equity Fund, Long/Short Healthcare Fund
and Floating Rate Opportunities Fund.
As part of its review process, the Board of Trustees
requested, through its independent legal counsel, and
received from the Advisors, various information and written materials in connection with meetings of the Board of
Trustees held on June 5-6, 2014, August 28, 2014 and
September 11-12, 2014, including, where applicable:
(1) information regarding the financial soundness of the
Advisors and the profitability of the Agreements to the
Advisors; (2) information on the advisory and compliance
personnel of the Advisors, including compensation
74
Semi-Annual Report
Highland Funds I
arrangements; (3) information on the internal compliance
procedures of the Advisors; (4) comparative information
showing how the Funds’ proposed and/or actual fees and
anticipated and/or actual operating expenses compare to
those of other registered investment companies and
comparable funds that follow investment strategies similar to those of the Funds; (5) information on the investment performance of the Funds or Predecessor Fund, as
applicable, including comparisons of such Funds’
performance against that of other registered investment
companies and comparable funds that follow investment
strategies similar to those of the Funds or Predecessor
Fund; (6) information regarding brokerage and portfolio
transactions; and (7) information on any legal proceedings
or regulatory audits or investigations affecting the Advisors. The Trustees also relied on information provided at
periodic meetings of the Board of Trustees over the course
of the year. In addition, the Trustees received an
independent report from Keil Fiduciary Strategies (“KFS”),
an independent source of investment company data,
relating to the Long/Short Equity Fund’s, Long/Short
Healthcare Fund’s and Floating Rate Opportunities Fund’s
performance, volatility and expenses compared to the
performance, volatility and expenses of a peer group
determined by KFS to be comparable. The Trustees
reviewed various factors discussed in independent counsel’s legal memoranda, the detailed information provided
by the Advisors and other relevant information and factors. The Trustees’ conclusions as to the approval of the
Agreements were based on a comprehensive consideration of all information provided to the Trustees without
any single factor being dispositive in and of itself. Some of
the factors that figured particularly in the Trustees’
deliberations are described below, although individual
Trustees may have evaluated the information presented
differently from one another, giving different weights to
various factors.
The nature, extent, and quality of the services to be
provided by the Advisors. The Board of Trustees considered the portfolio management services to be provided by
the Advisors under the Agreements and the activities
related to portfolio management, including use of technology, research capabilities, and investment management
staff. The Board of Trustees discussed the relevant experience and qualifications of the personnel providing, or who
would provide, advisory services, including the background
and experience of the members of each Fund’s portfolio
management team. The Trustees reviewed the management structure, assets under management and investment
philosophies and processes of the Advisors. The Trustees
also reviewed and discussed information regarding the
Advisors’ compliance policies, procedures and personnel,
including compensation arrangements. With regard to the
ADDITIONAL INFORMATION (unaudited) (continued)
December 31, 2014
Highland Funds I
Long/Short Healthcare Fund, for which the Investment
Advisor has retained the Sub-Advisor, the Trustees considered the services provided by the Investment Advisor with
respect to the supervision of the Sub-Advisor, including the
performance of periodic detailed analysis and review of
the performance by the Sub-Advisor of its obligations to
the Fund, including, without limitation, a review of the SubAdvisor’s investment performance in respect of the Fund;
preparation and presentation of periodic reports to the
Trustees regarding the investment performance of the
Sub-Advisor and other information regarding the SubAdvisor; review and consideration of any changes in the
personnel of the Sub-Advisor responsible for performing
the Sub-Advisor’s obligations and making appropriate
reports to the Trustees; review and consideration of any
changes in the ownership or senior management of the
Sub-Advisor and making appropriate reports to the Trustees; performing periodic in-person or telephonic diligence
meetings with representatives of the Sub-Advisor; and
preparing recommendations with respect to the continued
retention of the Sub-Advisor or the replacement of the
Sub-Advisor. The Trustees concluded that the Advisors had
the quality and depth of personnel and investment methods essential to performing their duties under the Agreements, and that the nature and the quality of such
advisory services supported approval of the Agreements.
Average and the KFS Peer Group for the one- and threeyear periods ended June 30, 2014. The Board of Trustees
further considered that the Long/Short Equity Fund had
underperformed the Morningstar Category Average and the
KFS Peer Group for five-year period ended June 30, 2014.
The Board of Trustees also took into account management’s
discussion of the Long/Short Equity Fund’s performance.
The Advisors’ historical performance in
managing the funds.
With respect to each of the foregoing Funds, the Trustees
concluded that each Fund’s performance or other relevant
factors supported the renewal of the Agreement(s) relating
to that Fund.
With respect to the Agreements being considered for
renewal, the Board of Trustees reviewed the historical
performance of the Advisors and the Funds’ portfolio
management teams in managing the Funds or, in the case
of the Opportunistic Credit Fund, the Predecessor Fund,
over various time periods and reflected on previous discussions regarding matters bearing on the Advisors’ performance at their meetings throughout the year. With
respect to the Long/Short Equity Fund, Long/Short Healthcare Fund and Floating Rate Opportunities Fund, the
Trustees discussed relative performance and contrasted
the performance of those Funds and their respective
portfolio management teams versus that of the Funds’
peers, as represented by certain other registered investment companies that follow investment strategies similar
to the Funds as well as comparable indices and the relevant Morningstar category. With respect to the Opportunistic Credit Fund, the Trustees discussed relative
performance and compared the performance of the
Predecessor Fund to that of an index and the relevant
Morningstar categories.
The Board of Trustees considered that, with respect to the
Long/Short Equity Fund’s performance, the Long/Short
Equity Fund had outperformed the Morningstar Category
With respect to the Long/Short Healthcare Fund’s performance, the Board of Trustees considered that the Long/Short
Healthcare Fund had outperformed the Morningstar Category Average and the KFS Peer Group for the one-, threeand five-year periods ended June 30, 2014. The Board of
Trustees also took into account management’s discussion
of the Long/Short Healthcare Fund’s performance.
With respect to the Floating Rate Opportunities Fund’s performance, the Board of Trustees considered that the Floating Rate Opportunities Fund had outperformed the
Morningstar Category Average, the KFS Peer Group and its
benchmark, the Credit Suisse Leveraged Loan Index, for the
one-, three- and five-year periods ended June 30, 2014. The
Board of Trustees further considered that the Floating Rate
Opportunities Fund had underperformed the Morningstar
Category Average, the KFS Peer Group and its benchmark
for the ten-year period ended June 30, 2014. The Board of
Trustees also took into account management’s discussion of
the Floating Rate Opportunities Fund’s performance.
With respect to the Opportunistic Credit Fund, the Board of
Trustees considered the historical performance of the
Investment Advisor and the Predecessor Fund’s portfolio
management teams in managing the Predecessor Fund over
various time periods and reflected on previous discussions
regarding matters bearing on the Advisors’ performance at
their meetings throughout the year. The Board of Trustees
noted that the Investment Advisor has been active in
monitoring and responding to any performance issues with
respect to the Predecessor Fund. The Board of Trustees also
took into account its discussions with management regarding
factors that contributed to the performance of the Predecessor Fund. The Board of Trustees considered the performance of the Predecessor Fund in relation to the Standard &
Poor’s 500 Index and a combination of three Morningstar
categories (i.e., high yield bond, nontraditional bond and bank
loan) due to the distinctive nature of the Predecessor Fund as
compared to potential peers. The Board of Trustees further
considered the similarities and differences between the way
in which the Predecessor Fund had been managed and the
way in which the Opportunistic Credit Fund would be managed. Additionally, the Board of Trustees considered that the
Semi-Annual Report
75
ADDITIONAL INFORMATION (unaudited) (continued)
December 31, 2014
Predecessor Fund had outperformed all four benchmarks
for the year-to-date, one-, three- and five-year and since
inception periods ended April 30, 2014. The Board also took
into account management’s discussion of the Predecessor
Fund’s performance. The Trustees concluded that the
Opportunistic Credit Fund’s performance or other relevant
factors supported the renewal of the Agreement.
The costs of the services to be provided by the
Investment Advisor and the profits to be
realized by the Investment Advisor and its
affiliates from the relationship with the Funds.
The Board of Trustees also gave substantial consideration
to the fees payable or to be paid under the Agreements,
the expenses that the Advisors incur in providing advisory
services and the profitability to the Advisors of managing
the Funds, including where applicable: (1) information
regarding the financial condition of the Advisors;
(2) information regarding the total fees and payments
received or proposed to be received by the Advisors for
their services and whether such fees are appropriate given
economies of scale and other considerations;
(3) comparative information showing (a) the fees payable
or to be paid under the Agreements and the proposed
and/or actual fees paid by the Funds to the Investment
Advisor versus the investment advisory fees of certain
registered investment companies and comparable funds
that follow investment strategies similar to those of the
Funds and (b) the expense ratios of the Funds versus the
expense ratios of certain registered investment companies
and comparable funds that follow investment strategies
similar to those of the Funds; (4) information regarding the
total fees and payments received and the related amounts
waived and/or reimbursed by the Investment Advisor for
providing administrative services to the Funds under separate agreements and whether such fees are appropriate;
and, (5) with respect to the advisory agreement for the
Long Short Healthcare Fund, the fact that the fees payable
to the Investment Advisor would be reduced by amounts
payable to the Sub-Advisor for a given period. The Trustees
also considered the so-called “fall-out benefits” to the
Advisors with respect to the Funds, such as the reputational value of serving as Investment Advisor or SubAdvisor to the relevant Funds, potential fees paid to the
Advisors’ affiliates by a Fund or portfolio companies for
services provided, including administrative services provided to the Funds by the Investment Advisor pursuant to
separate agreements, the benefits of research made
available to the Advisors by reason of brokerage commissions (if any) generated by the Funds’ securities transactions and the fact that certain of the funds advised by
the Investment Advisor would invest in the Opportunistic
Credit Fund.
76
Semi-Annual Report
Highland Funds I
The Board of Trustees considered that the Long/Short
Equity Fund’s actual management fees were lower than
the KFS Peer Group average and median but above the
Morningstar Universe average, while the Long/Short Equity
Fund’s total expenses (exclusive of 12b-1 fees) were below
the KFS Peer Group average and median and the Morningstar Universe average. The Board of Trustees noted that
the Investment Advisor had agreed to waive 1.25% of its
total management fee for the Long/Short Equity Fund
through at least October 31, 2015 and may not be terminated prior to this date without the action or consent of the
Board of Trustees.
The Board of Trustees considered that the Long/Short
Healthcare Fund’s actual management fees were above
the KFS peer group average and median as well as the
Morningstar Universe average, and the Fund’s total
expenses (exclusive of 12b-1 fees) were above the KFS Peer
Group average and median and the Morningstar Universe
average. The Board of Trustees noted that the Investment
Advisor had agreed to waive fees and/or reimburse
expenses to cap the total annual fund operating expense
to 1.50% of the average daily net assets of the Long/Short
Healthcare Fund through October 31, 2014.
The Board of Trustees considered that the Floating Rate
Opportunities Fund’s actual management fees and total
expenses (exclusive of 12b-1 fees) were above the KFS Peer
Group average and median as well as the Morningstar
Universe average. It was noted that, among other
expenses, expenses relating to the Floating Rate Opportunities Fund’s use of leverage contributed to the Fund’s
higher total expense ratio. The Board of Trustees further
noted that the Investment Advisor had agreed to waive
fees and/or reimburse expenses to cap the total annual
fund operating expense to 0.95% of the average daily net
assets of the Floating Rate Opportunities Fund through at
least October 31, 2015 and may not be terminated prior to
this date without the action or consent of the Board of
Trustees.
The Board of Trustees noted that the Opportunistic Credit
Fund’s proposed management fee was above the
Morningstar Nontraditional Bond Category and High Yield
Bond Category and that the Opportunistic Credit Fund’s
total expenses (exclusive of 12b-1 fees) were above the
Nontraditional Bond Category but below the High Yield
Bond Category. The Board of Trustees further noted that
the Investment Advisor had agreed to waive fees and/or
reimburse expenses to cap the total annual fund operating
expense to 0.90% of the average daily net assets of the
Opportunistic Credit Fund through at least October 31,
2015, and may not be terminated prior to this date without
the action or consent of the Board of Trustees.
ADDITIONAL INFORMATION (unaudited) (continued)
December 31, 2014
Highland Funds I
After such review, the Trustees determined that the anticipated profitability to the Investment Advisor and SubAdvisor of the Agreements was fair and reasonable. The
Trustees also took into consideration the amounts waived
and/or reimbursed, if any, where expense caps or advisory
fee waivers had been implemented.
The extent to which economies of scale would
be realized as each Fund grows and whether
fee levels reflect these economies of scale for
the benefit of shareholders.
The Board of Trustees considered the respective asset levels of the Funds, the information provided by the Advisors
relating to their costs and information comparing the fee
rates charged by the Advisors with fee rates charged by
other unaffiliated investment advisors to their clients. The
Board of Trustees noted that the fee schedules for the
Floating Rate Opportunities Fund contained breakpoints
that reduce the fee rate above specified asset levels. The
Board of Trustees also noted those Funds that did not
contain breakpoints in the advisory fee schedules and took
into account management’s discussion of the same. The
Trustees concluded that the fee structures are reasonable,
and appropriately should result in a sharing of economies
of scale in view of the information provided by the Advisors. The Board determined to continue to review ways,
and the extent to which, economies of scale might be
shared between the Investment Advisor and/or SubAdvisor, as applicable, on the one hand and shareholders
of the Funds on the other.
Conclusion
Following a further discussion of the factors above and the
merits of the Agreements and their various provisions, it
was noted that in considering the approval of the Agreements, no single factor was determinative to the decision
of the Board of Trustees. Rather, after weighing all of the
factors and reasons discussed above, the Trustees, including the Independent Trustees, unanimously agreed that
the Agreements, including the advisory and sub-advisory
fees to be paid to the Advisors, are fair and reasonable to
the Funds in light of the services that the Advisors provide,
the expenses that they incur and the reasonably foreseeable asset levels of the Funds.
Semi-Annual Report
77
IMPORTANT INFORMATION ABOUT THIS REPORT
Investment Adviser
Highland Capital Management Fund Advisors, L.P.
200 Crescent Court, Suite 700
Dallas, TX 75201
Subadviser
(for Highland Long/Short Healthcare Fund)
Highland Capital Healthcare Advisors, L.P.
200 Crescent Court, Suite 700
Dallas, TX 75201
Transfer Agent
Boston Financial Data Services, Inc.
30 Dan Road
Canton, MA 02021-2809
Underwriter
Highland Capital Funds Distributor, Inc.
200 Crescent Court, Suite 700
Dallas, TX 75201
Custodian
State Street Bank and Trust Company
One Lincoln Street
Boston, Massachusetts 02111
Independent Registered Public
Accounting Firm
PricewaterhouseCoopers LLP
2001 Ross Avenue, Suite 1800
Dallas, TX 75201
Fund Counsel
Ropes & Gray LLP
Prudential Tower
800 Boylston Street
Boston, MA 02199-3600
78
Semi-Annual Report
This report has been prepared for shareholders of Highland Long/Short
Equity Fund, Highland Long/Short Healthcare Fund and Highland Floating
Rate Opportunities Fund (collectively, the “Funds”). The Funds mail one
shareholder report to each shareholder address. If you would like more
than one report, please call shareholder services at 1-877-665-1287 to
request that additional reports be sent to you.
A description of the policies and procedures that the Funds use to
determine how to vote proxies relating to their portfolio securities, and the
Funds’ proxy voting records for the most recent 12-month period ended
June 30, are available (i) without charge, upon request, by calling
1-877-665-1287 and (ii) on the Securities and Exchange Commission’s
website at http://www.sec.gov.
The Funds file their complete schedules of portfolio holdings with the Securities and Exchange Commission for the first and third quarters of each
fiscal year on Form N-Q. The Funds’ Forms N-Q are available on the Commission’s website at http://www.sec.gov and also may be reviewed and
copied at the Commission’s Public Reference Room in Washington, DC.
Information on the Public Reference Room may be obtained by calling
1-800-SEC-0330. Shareholders may also obtain the Form N-Q by visiting
the Funds’ website at www.highlandfunds.com.
The Statements of Additional Information include additional information
about the Funds’ Trustees and are available upon request without charge
by calling 1-877-665-1287.
THIS PAGE LEFT BLANK INTENTIONALLY
THIS PAGE LEFT BLANK INTENTIONALLY
Highland Funds
c/o BFDS
30 Dan Road
Canton, MA 02021-2809
Highland Funds I
www.highlandfunds.com
Semi-Annual Report, December 31, 2014
HLC-HFI-SA-12/14

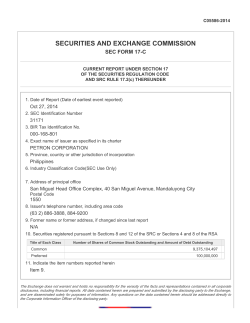
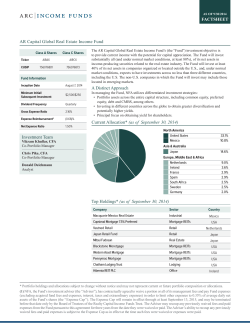


© Copyright 2026