
Defining and identifying Sleeping Beauties in science
Defining and Identifying Sleeping Beauties in Science
Qing Ke, Emilio Ferrara, Filippo Radicchi, and Alessandro Flammini
Center for Complex Networks and Systems Research,
arXiv:1505.06454v1 [physics.soc-ph] 24 May 2015
School of Informatics and Computing,
Indiana University, Bloomington, Indiana 47408, USA
Abstract
A Sleeping Beauty (SB) in science refers to a paper whose importance is not recognized for
several years after publication. Its citation history exhibits a long hibernation period followed by
a sudden spike of popularity. Previous studies suggest a relative scarcity of SBs. The reliability of
this conclusion is, however, heavily dependent on identification methods based on arbitrary threshold parameters for sleeping time and number of citations, applied to small or monodisciplinary
bibliographic datasets. Here we present a systematic, large-scale, and multidisciplinary analysis of
the SB phenomenon in science. We introduce a parameter-free measure that quantifies the extent
to which a specific paper can be considered an SB. We apply our method to 22 million scientific
papers published in all disciplines of natural and social sciences over a time span longer than a
century. Our results reveal that the SB phenomenon is not exceptional. There is a continuous
spectrum of delayed recognition where both the hibernation period and the awakening intensity
are taken into account. Although many cases of SBs can be identified by looking at monodisciplinary bibliographic data, the SB phenomenon becomes much more apparent with the analysis of
multidisciplinary datasets, where we can observe many examples of papers achieving delayed yet
exceptional importance in disciplines different from those where they were originally published.
Our analysis emphasizes a complex feature of citation dynamics that so far has received little attention, and also provides empirical evidence against the use of short-term citation metrics in the
quantification of scientific impact.
Keywords: delayed recognition; Sleeping Beauty; bibliometrics
1
Significance—Scientific papers have typically a finite lifetime: their rate to attract citations achieves its maximum a few years after publication, and then steadily declines.
Previous studies pointed out the existence of a few blatant exceptions: papers whose relevance has not been recognized for decades, but then suddenly become highly influential
and cited. The Einstein, Podolsky, and Rosen “paradox” paper is an exemplar Sleeping
Beauty. We study how common Sleeping Beauties are in science. We introduce a quantity
that captures both the recognition intensity and the duration of the “sleeping” period, and
show that Sleeping Beauties are far from exceptional. The distribution of such quantity is
continuous and has power-law behavior, suggesting a common mechanism behind delayed
but intense recognition at all scales.
There is an increasing interest in understanding the dynamics underlying scientific production and the evolution of science [1]. Seminal studies focused on scientific collaboration
networks [2], evolution of disciplines [3], team science [4–7], and citation-based scientific
impact [8–10]. An important issue at the core of many research efforts in science of science
is characterizing how papers attract citations during their lifetime. Citations can be regarded as the credit units that the scientific community attributes to its research products.
As such, they are at the basis of several quantitative measures aimed at evaluating career
trajectories of scholars [11] and research performance of institutions [12, 13]. They are also
increasingly used as evaluation criteria in very important contexts, such as hiring, promotion, and tenure, funding decisions, or department and university rankings [14, 15]. Several
factors can potentially affect the amount of citations accumulated by a paper over time,
including its quality, timeliness, and potential to trigger further inquiries [9], the reputation
of its authors [16, 17], as well as its topic and age [8].
Studies about fundamental mechanisms that drive citation dynamics started already in
the 1960s, when de Solla Price introduced the cumulative advantage (CA) model to explain
the emergence of power-law citation distributions [18]. CA essentially provisions that the
probability of a publication to attract a new citation is proportional to the number of
citations it already has. The criterion, now widely referred to as preferential attachment, was
2
recently popularized by Barab´asi and Albert [19], who proposed it as a general mechanism
that yields heterogeneous connectivity patterns in networks describing systems in various
domains [20, 21]. Other processes that effectively incorporate the CA mechanism have been
proposed to explain power-law citation distributions. Krapivsky and Redner, for example,
considered a redirection mechanism, where new papers copy with a certain probability the
citations of other papers [22].
An important effect not included in the CA mechanism is the fact that the probability of
receiving citations is time dependent. In the CA model, papers continue to acquire citations
independently of their age so that, on average, older papers accumulate higher number of
citations [19, 22, 23]. However, it has been empirically observed that the rate at which a
paper accumulates citations decreases after an initial growth period [24–27]. Recent studies
about growing network models include the aging of nodes as a key feature [24, 27–30]. More
recently, Wang et al. developed a model that includes, in addition to the CA and aging, an
intuitive yet fundamental ingredient: a fitness or quality parameter that accounts for the
perceived novelty and importance of individual papers [9].
In this work, we focus on the citation history of papers receiving an intense but late
recognition. Note that delayed recognition cannot be predicted by current models for citation
dynamics. All models, regardless of the number of ingredients used, naturally lead to the socalled first-mover advantage, according to which either papers start to accumulate citations
in the early stages of their lifetime or they will never be able to accumulate a significant
number of citations [23]. Back in the 1980s, Garfield provided examples of articles with
delayed recognition and suggested to use citation data to identify them [31–34]. Through
a broad literature search, Gl¨anzel et al. gave an estimate for the occurrence of delayed
recognition, and highlighted a few shared features among lately recognized papers [35]. The
coinage of the term “Sleeping Beauty” (SB) in reference to papers with delayed recognition
is due to van Raan [36]. He proposed three dimensions along which delayed recognition
can be measured: (i ) length of sleep, i.e., the duration of the “sleeping period;” (ii ) depth
of sleep, i.e., the average number of citations during the sleeping period; and (iii ) awake
intensity, i.e., the number of citations accumulated during 4 years after the sleeping period.
By combining these measures, he identified a few SB examples occurred between 1980 and
2000. These seminal studies suffer from two main limitations: (i ) the analyzed datasets
are very small, especially if compared to the size of the bibliographic databases currently
3
available; and (ii ) the definition and the consequent identification of SBs are to the same
extent arbitrary, and strongly depend on the rules adopted. More recently, Redner analyzed
a very large dataset covering 110 years of publications in physics [37]. Redner proposed a
definition of revived classic (or SB) for articles satisfying the three following criteria: (i )
publication date antecedent 1961; (ii ) number of citations larger than 250; and (iii ) ratio
of the average citation age to publication age greater than 0.7. Whereas Redner was able
to overcome the first limitation mentioned above, his study is still affected by an arbitrary
selection choice of top SBs, justified by the principle that SBs represent exceptional events
in science. In addition, Redner’s analysis has the limitation to be field specific, covering
only publications and citations within the realm of physics.
Here we perform an analysis on the SB phenomenon in science. We propose a parameterfree approach to quantify how much a given paper can be considered as an SB. We call
this index “beauty coefficient,” denoted as B. By measuring B for tens of millions of publications in multiple scientific disciplines over an observation window longer than a century,
we show that B is characterized by a heterogeneous but continuous distribution, with no
natural separation between papers with low, high, or even extreme values of B. Also, we
demonstrate that the empirical distributions of B cannot be easily reconciled with obvious
baseline models for citation accumulation that are based solely on CA or the reshuffling of
citations. We introduce a simple method to identify the awakening time of SBs, i.e., the
year when their citations burst. The results indicate that many SBs become highly influential more than 50 years after their publication, far longer than typical time windows for
measuring citation impact, corroborating recent studies on understanding the use of short
time windows to approximate long-term citations [38–40]. We further show that the majority of papers exhibit a sudden decay of popularity after reaching the maximum number
of yearly citations, independently of their B values. Our study points out that the SB
phenomenon has two important multidisciplinary components. First, particular disciplines,
such as physics, chemistry, and mathematics, are able to produce top SBs at higher rates
than other scientific fields. Second, top SBs achieve delayed exceptional importance in disciplines different from those where they were originally published. Based on these results,
we believe that our study may pave the way to the identification of the complex dynamics
that trigger the awakening mechanisms, shedding light on highly cited papers that follow
nontraditional popularity trajectories.
4
I.
MATERIALS
A.
Beauty coefficient
The beauty coefficient value B for a given paper is based on the comparison between
its citation history and a reference line that is determined only by its publication year, the
maximum number of citations received in a year (within a multi-year observation period),
and the year when such maximum is achieved. Given a paper, let us define ct as the number
of citations received in the t-th year after its publication; t indicates the age of the paper.
Let us also assume that our index B is measured at time t = T , and that the paper receives
its maximum number ctm of yearly citations at time tm ∈ [0, T ].
Consider the straight line `t that connects the points (0, c0 ) and (tm , ctm ) in the timecitation plane (Fig. 1). This line is described by the equation
`t =
ctm − c0
· t + c0 ,
tm
(1)
where (ctm − c0 ) /tm is the slope of the line, and c0 the number of citations received by the
paper in the year of its publication. For each t ≤ tm , we then compute the ratio between
`t − ct and max{1, ct }. Summing up the ratios from t = 0 to t = tm , the beauty coefficient
B is defined as
B=
tm
X
t=0
ctm −c0
tm
· t + c0 − ct
max{1, ct }
.
(2)
By definition, B = 0 for papers with tm = 0. Papers with citations growing linearly with
time (ct = `t ) have B = 0. B is non-positive for papers whose citation trajectory ct is a
concave function of time. Our index B has a number of desirable properties: (i ) B can be
computed for any paper and does not rely on arbitrary thresholds on the sleeping period or
the awakening intensity, paving the way to treat the SB phenomenon not as just an exception;
(ii ) B increases with both the length of the sleeping period and the awakening intensity;
(iii ) B takes into account the entire citation history in the time window 0 ≤ t ≤ tm ; and
(iv ) The denominator of Eq. 2 penalizes early citations so that, at parity of total citations
received, the later those citations are accumulated the higher is the value of B.
5
yearly citations
30
25
20
15
10
5
0
0
(tm ,ctm )
10
20
30
age
40
50 55
FIG. 1. Illustration of the definition of the beauty coefficient B (Eq. 2) and the awakening time ta
(Eq. 3) of a paper. The blue curve represents the number of citations ct received by the paper at
age t (i.e., t represents the number of years since its publication). The black dotted line connecting
the points (0, c0 ) and (tm , ctm ) is the reference line `t (Eq. 1) against which the citation history
of the paper is compared. The awakening time ta ≤ tm is defined as the age that maximizes the
distance from (t, ct ) to the line `t (Eq. 3), indicated by the red dashed line. The red vertical line
marks the awakening time ta calculated according to Eq. 3. The figure refers to the paper Phys
Rev 95(5):1154 (1954) [49].
B.
Awakening time
We now give a plausible definition of awakening time—the year when the abrupt change
in the accumulation of citations of SBs occurs. Being able to pinpoint the awakening time
may help identifying possible general trigger mechanisms behind said change. For example,
in SI Appendix we show that around the awakening time, the SBs co-citation dynamics
exhibit clear topical patterns (SI Appendix, Fig. S11) [37]. We define the awakening time
ta as the time t at which the distance dt between the point (t, ct ) and the reference line `t
6
reaches its maximum:
ta = arg max dt .
t≤tm
(3)
where dt is given by
dt =
|(ctm − c0 )t − tm ct + tm c0 |
p
.
(ctm − c0 )2 + t2m
As we shall show, the above definition works well for limit cases where there are no
citations until the spike, and seems to well capture the qualitative notion of awakening time
when a strong SB-like behavior is present.
C.
Datasets
We use two datasets in the following empirical analysis, the American Physical Society
(APS) and the Web of Science (WoS) dataset (SI Appendix, section S1). The APS journals
are the major publication outlets in physics. WoS includes papers in both sciences and social
sciences. We focus on the 384, 649 papers in the APS and 22, 379, 244 papers in the WoS that
received at least one citation. Those papers span more than a century, and thus allow us to
investigate the SB phenomenon for a long observation period. Whereas the APS dataset can
be viewed as a perfect proxy to characterize citation dynamics within the monodisciplinary
research field of physics and is used to compare our analysis with a previous study [37], the
WoS dataset allows us to underpin multidisciplinary features of the SB phenomenon.
II.
RESULTS
A.
Sleeping Beauties in physics
First, we qualitatively demonstrate the resolution power of B for four papers with radically different citation trajectories. Fig. 2A shows a paper with a very high B value.
Published in 1951, this paper collected a small number of yearly citations until 1994, when
it suddenly started to receive many citations until reaching its maximum in 2000. Fig. 2B
exhibits a qualitatively similar citation trajectory for a recently published paper with a very
low ctm and consequently a much smaller B. The paper in Fig. 2C achieved its maximum
yearly citations at t = 1. The citation history ct therefore coincides with the reference line
`t in 0 ≤ t ≤ tm , yielding B = 0. Note that our measure B only examines how the citation
7
yearly citations
1.0
100
0.8
50
0.60
1951
20
0.4
10
0.2
0
0.01950
0.0 0.2
A
12
B
6
0
2009 1998
C 36
2009
D
18
0
2009 1989
0.4
0.6
year
0.8
2009
1.0
FIG. 2. Dependence of the beauty coefficient on citation history. Blue curves show yearly citations
of four papers with different B values in the American Physical Society (APS) dataset: (A) Phys
Rev 82:403 (1951), B = 1, 722 [50]; (B ) Phys Rev B 58:12547 (1998), B = 22 [51]; (C ) Phys Rev
78:294 (1950), B = 0 [52]; (D) Phys Rev Lett 62(3):324 (1989), B = −5 [53]. Red lines indicate
their awakening time. The awakening year in C is 1950, i.e., ta = 0.
curve reaches its peak, but does not consider how it decreases after that. The paper in
Fig. 2D is characterized by a negative B value, as ct is above the reference line.
Second, we test the effectiveness of B to identify top SBs in the APS by using the 12
revived classics, previously identified by Redner, as a benchmark set [37]. Our results are in
excellent agreement with Redner’s analysis [37]: 6 out 12 of the revived classics detected by
Redner are in our top 10 list; the other 6 have also very high B values, although they occupy
less important positions in the ranking according to B (SI Appendix, Table S1). Differences
are due to the principles underlying the two approaches, with ours not relying on threshold
parameters for the sleeping time and the number of citations. To better clarify the diversity
8
of the two approaches, SI Appendix, Figs. S2 and S3 report the citation history of the 24
papers with highest B values in the APS dataset. We see that our measure identifies papers
with a long hibernation period followed by a sudden burst in yearly citations, without the
need to reach extremely high values of citations. As already pointed out by Redner [37],
the list of top SBs in the APS reveals a natural grouping into a relatively small number
of coarse topics, with papers belonging to the same topic exhibiting remarkably similar
citation histories (SI Appendix, Fig. S11). This suggests that a “premature” topic may
fail to attract the community attention even when it is introduced by authors who have
already established a strong scientific reputation. A corroborating evidence is provided by
the famous EPR paradox paper by Einstein, Podolsky, and Rosen that is among the top
SBs we found in this dataset (SI Appendix, Fig. S2B ).
B.
How rare are Sleeping Beauties?
In contrast with previous SB definitions [35–37], ours does not rely on the arbitrary choice
of age or citation thresholds. This fact puts us in the unique position of investigating the SB
phenomenon at the systemic level and asking fundamental questions from the macroscopic
point of view: Are papers with extreme values of B exceptional occurrences? Do the majority
of papers behave in a qualitatively different way from the extreme cases discussed above,
when their sleeping period and bursty awakening are considered?
To this end, we provide a statistical description of the distribution of beauty coefficients
across all papers in each of the two datasets. Fig. 3 shows the survival distribution functions
of B for all papers in the APS and WoS datasets. We observe a heterogeneous but continuous
distribution of B, spanning several orders of magnitude. Except for the cutoff—which is
much larger for the WoS dataset—APS and WoS exhibit remarkably similar distributions.
Although the vast majority of papers exhibit low values of B, there is a consistent number
of papers with high B. The distributions also show no typical value or mode; there are
no clear demarcation values that allow us to separate SBs from “normal” papers: delayed
recognition occurs on a wide and continuous range, in sharp contrast with previous results
claiming that SBs are extraordinary cases [35, 37, 41].
It may appear as not entirely fair to compare beauty coefficients for papers of different
ages [42]: Later papers have by definition less chance to develop a long sleeping period and
9
Survival Distribution Function
100
10-1
10-2
10-3
10-4
10-5
10-6
10-7
10-8 -1
10
APS Empirical
WoS Empirical
APS NR
APS PA
α =2.35
100
101
102
103
104
B +13
FIG. 3. Survival distribution functions of beauty coefficients. On the horizontal axis, we shift the
values by 13 (i.e., the minimal value of B is −12.02) to make all points visible in the logarithmic
scale. The blue and cyan curves represent the empirical results obtained on the APS and WoS
datasets, respectively. Results obtained with the NR and PA model are plotted as green and
magenta lines, respectively. The red dashed line stands for the best estimate of a power-law fit
of the APS curve: exponent α = 2.35 and the minimum value of the range of the fit Bm = 22.27
are estimated using the statistical methods developed by Clauset et al. [54]. In the APS and WoS,
4.68% and 6.56% of papers, respectively, have negative B values.
to exhibit a sudden awakening. This may, to some extent, dictate the shapes of observed
distributions. On the other hand, the vast majority of papers tend to have a single and
well-defined peak in their yearly citations early during their lifetime, implying that their B
values do not change with moving the observation time T far into the future. In particular,
our estimations indicate that nearly 90% of the papers have already experienced a drastic
decrement after their maximum number of yearly citations, irrespective of their B value
(SI Appendix, section S3). The shapes of the empirical distributions remain essentially
unchanged if we consider only the papers that have experienced the typical sharp decline of
10
the post-maximum yearly citation rate.
C.
Is the Sleeping Beauty phenomenon statistically significant?
The result of the previous section implicitly suggests that the SB phenomenon could be
in principle described via a simple mechanism that works essentially at all scales. This leads
naturally to the question whether the observed distributions of B can be accounted for by
idealized network evolution models. To address this question, we first consider a citation
network randomization (NR) process where citations are randomly reshuffled, preserving
time order (SI Appendix, section S4). SI Appendix, Fig. S2 compares the citation history of
the top nine SBs in the APS dataset and the corresponding ones obtained through the NR
process. They typically show opposite trends, with NR histories exhibiting a rapid decline.
This is not surprising: As later papers are considered, the probability for an existing paper
to receive a citation from one of such late papers decreases simply because there is a larger
number of papers that could potentially receive the citation. This leads to typically smaller
beauty coefficients, as evident in the sharp decrease of the NR distribution in Fig. 3, and
the associated small maximum value B = 30.
Next, we consider the preferential attachment (PA) mechanism as another baseline model,
as it is one of the most fundamental ingredients used in most modeling efforts aimed at
describing citation histories of papers. In the PA baseline, references of progressively added
citing papers are reassigned according to the PA mechanism (SI Appendix, section S4). SI
Appendix, Fig. S2 also shows slowly increasing yearly citations by the PA model, explained
by the positive feedback effect generated via the PA mechanism. The overall number of
citations according to PA baseline for the nine papers in SI Appendix, Fig. S2 remains
small. Those are relatively young papers in the dataset and their probability to receive
citations, according to PA, is reduced by that of older papers. The resulting distribution of
B in Fig. 3 shows a much smaller range and a well-defined cutoff. It remains to be seen to
what extent a recently proposed model for citation histories [9] are compatible with the SB
phenomenon.
11
D.
Sleeping Beauties in science
The occurrence of extreme cases of SBs is not limited to physics. Table I lists basic
information about the 15 papers with the highest B values in the WoS dataset (see SI
Appendix, Fig. S4 for their citation histories). This list contains four SBs that were published
in the 1900s. Consistent with previous studies, we find that many SBs are in the field of
physics and chemistry [35]. Two papers are, however, in the field of statistics, which fails
to be noted before as a top discipline producing SBs. One of them slept for more than one
century: the paper by the influential statistician Karl Pearson, published in 1901 in the
journal Philosophical Magazine, shows the relation between principal component analysis
and the minimization chi-distance. The other one, published in 1927 (therefore sleeping for
more than 70 years), introduces the Wilson score interval, one type of confidence interval
for estimating a proportion that improves over the commonly used normal approximation
interval. The 3rd (B = 5, 923), 12th (B = 2, 584), and 15th (B = 2, 184) top-ranked papers
in the WoS dataset were published in Physical Review, but were not ranked as top papers
in the APS dataset, suggesting that the bulk of their citations are mainly from journals not
contained in the APS dataset. The EPR paradox paper (the 14th), however, is ranked at
the top in both datasets.
SI Appendix, Tables S2 and S3 list basic information about the top 10 SB papers in statistics and mathematics, respectively. Publications introducing many important techniques,
like Fisher’s exact test, Metropolis–Hastings algorithm, and Kendall rank correlation coefficient, have high beauty coefficients. We also find numerous examples of SBs in the social
sciences (SI Appendix, Table S4), in contrast with previous results about their alleged absence [35].
How are SBs distributed among different (sub-)disciplines? To further investigate the
multidisciplinary character of the SB phenomenon, we took advantage of journal classifications provided by Journal Citation Reports (JCR) (thomsonreuters.com/en/productsservices/scholarly-scientific-research/research-managementand-evaluation/journal-citationreports.html), which classify scientific journals into one or more subject categories (e.g.
physics, multidisciplinary; mathematics; medicine, general and internal). We first consider
only papers published in journals belonging to at least one JCR subject category, and focus on the top 0.1% of papers with highest B values. Then, we compute the fraction of
12
TABLE I. Top 15 SBs in science. From left to right, we report for each paper its beauty coefficient
B, author(s) and title, publication and awakening year, publication journal, and scientific domain.
See SI Appendix, Fig. S4 for detailed citation histories of these papers.
B
Author(s)
11600 Freundlich, H
Title
Pub., awake Journal
Field
Concerning adsorption in solutions
1906, 2002 Z. Phys. Chem.
Chem.
Preparation of Graphitic Oxide
1958, 2007 J. Am. Chem. Soc.
Chem.
1939, 2004 Phys. Rev.
Phys.
1944, 2002 Trans. Faraday Soc.
Chem.
1951, 1997 Discuss. Faraday Soc.
Chem.
1901, 2002 Philos. Mag.
Statist.
Hummers, WS
10769
Offeman, RE
The Scherrer formula for x-ray particle size
5923 Patterson, AL
determination
Cassie, ABD
5168
Wettability of porous surfaces
Baxter, S
Turkevich, J
A study of the nucleation and growth
4273 Stevenson, PC processes in the synthesis of colloidal
Hillier, J
gold
On lines and planes of closest fit to
3978 Pearson, K
systems of points in space
3892 Stoney, GG
The tension of metallic films deposited by electrolysis 1909, 1989 Proc. R. Soc. Lond. A
Phys.
3560 Pickering, SU
CXCVI.–Emulsions
1907, 1998 J. Chem. Soc., Trans.
Chem.
2962 Wenzel, RN
Resistance of solid surfaces to wetting by water
1936, 2003 Ind. Eng. Chem.
Chem.
1927, 1999 J. Am. Statist. Assoc.
Statist.
1916, 2003 J. Am. Chem. Soc.
Chem.
1934, 1982 Phys. Rev.
Phys.
Probable inference, the law of succession,
2736 Wilson, EB
and statistical inference
The constitution and fundamental properties
2671 Langmuir, I
of solids and liquids Part I Solids
Moller, C;
Note on an approximation treatment for
Plesset, MS
many-electron systems
2584
Relations between the elastic moduli and the
2573 Pugh, SF
1954, 2005 Philos. Mag.
Metallurgy
plastic properties of polycrystalline pure metals
Einstein, A
Can quantum-mechanical description of
2258 Podolsky, B
physical reality be considered complete?
1935, 1994 Phys. Rev.
Phys.
1921, 1995 Phys. Rev.
Phys.
Rosen, N
2184 Washburn, EW The dynamics of capillary flow
those papers that belong to a given subject category. Fig. 4 shows the top 20 categories
producing SBs. Subfields of physics, chemistry, and mathematics are noticeably the top
disciplines, consistently with previous studies [35]. Some disciplines not previously noted
include medicine (internal and surgery), statistics and probability. Particularly interesting is
the category multidisciplinary sciences, ranked third, that includes top journals like Nature,
Science, and PNAS, because (i ) delayed recognition signals that such contributions may be
perceived by the academic community as too premature or futuristic, although it is common
ground among academics to speculate that such venues only publish trending topics, and
13
physics, multidisciplinary
chemistry, multidisciplinary
multidisciplinary sciences
mathematics
medicine, general & internal
physics, applied
surgery
chemistry, inorganic & nuclear
statistics & probability
mechanics
biology
ecology
physics, condensed matter
biochemistry & molecular biology
astronomy & astrophysics
physics, atomic, molecular & chemical
neurosciences
materials science, multidisciplinary
plant sciences
engineering, chemical
4.0%
3.4%
2.8%
2.5%
2.3%
2.0%
2.0%
2.0%
1.9%
1.9%
1.8%
1.6%
1.6%
1.5%
1.3%
1.3%
1.2%
7.6%
7.5%
7.4%
FIG. 4. Top 20 disciplines producing SBs in science. We consider papers with beauty coefficient
in the top 0.1% of the entire WoS database, and compute the fraction of those papers that fall in
a given subject category.
(ii ) journals in the multidisciplinary sciences subject category are really more fit to attract
publications that become field-defining even decades after their appearance.
E.
What triggers the awakening of an SB?
A full answer to this question would require a case-by-case examination, but it can be
addressed in a systematic way by studying the papers that cite the SB before and after its
awakening. To illustrate this strategy, it is worth to examine two paradigmatic examples of
top SBs.
The first is the 1955 Garfield paper introducing the ancestor of the Web of Science
database [43]. This paper slept for almost 50 years, becoming suddenly popular around 2000.
A simple investigation based on co-citations, similar to the one performed in ref. [44], reveals
that the delayed recognition of the 1955 paper by Garfield was triggered by later articles by
14
A
B
C
FIG. 5. Paradigmatic example of the awakening of an SB. (A, blue) Citation history of the paper
Science 122:108 (1955) [43]. The three most co-cited papers are green, JAMA 295:90 (2006) [55];
cyan, Science 178:471 (1972) [56]; and red, Can Med Assoc J 161:979 (1999) [57]. (B and C )
Clouds of the most frequent keywords appearing in the title of papers citing Science 122:108
(1955) [43], published, respectively, before (B ) and after (C ) year 2000.
the same author (Fig. 5A). Such papers, in turn, were cited by very influential works in two
different contexts: (i ) the 1999 article by Kleinberg about the hyperlink-induced topic search
(HITS) algorithm, which can be considered one pioneering works in network science [45];
and (ii ) the 1998 paper by Seglen on the limitations of the journal impact factor, which
historically represents the beginning of the ongoing debate about the (mis)use of citation
15
cumulative distribution function
1.0
0.8
0.6
0.4
0.2
0.0
0.0
B ≥317.9
33.2 B <317.9
B <33.2
0.2
0.4
0.6
0.8
fraction of external citations
1.0
FIG. 6. Interdisciplinary nature of top SBs. Cumulative distribution functions of fraction of
external citations for the group of (red) top 1, 000 SBs (B ≥ 317.93); (blue) from the 1,001st to
the top 1% (33.21 ≤ B < 317.93); and (black) the rest (B < 33.21). The horizontal axis measures
for each paper the fraction of its citations that originate from other subject categories.
indicators in research evaluation [46]. The change in contextual importance of the 1955 paper
by Garfield is further revealed by the frequency of keywords appearing in the titles of its
citing papers before and after year 2000 (Fig. 5B and C ), with the notion of “impact factor”
becoming the main recognizable difference. With a similar motivation, the 1977 paper by
Zachary also tops the ranking of SBs coming from the social sciences [47]. This paper was
essentially unnoticed for about 30 years, but then became suddenly important in network
science research after the publication of the seminal paper by Girvan and Newman, which
adopts the social network described in the Zachary paper as a paradigmatic benchmark to
validate community detection methods on graphs [48] (SI Appendix, Fig. S12).
The examples above suggest that a partial explanation behind the sudden awakening of
top SBs may lie in the fact that the paper in question is suddenly “discovered” as relevant
by an entire community in another discipline. To support this hypothesis, in Fig 6 we
16
divide the papers in the WoS dataset in three disjoint subsets with high, medium, and low
values of B. For each subset we compute the cumulative distribution for the fraction of
citations received by a paper from publications in a discipline (as inferred by the journal of
publication) different from that of the cited paper. Top SBs are clearly different from the
other two categories and are characterized by a typically very high fraction of citations from
other disciplines: for about 80% of the top SBs, as much as 75% or more of citations are of
interdisciplinary nature.
III.
DISCUSSION
The main purpose of this work was to introduce a parameter-free method to quantify
to what extent a paper is an SB. Through a systematic analysis carried out on large-scale
bibliographic databases and over observation windows longer than a century, we have shown
that our method correctly identifies cases that meet the intuitive notion of SBs. We noticed
that our measure is not entirely free of biases: Comparing the degree of beauty between
papers in different disciplines or ages may be problematic due to differences in the overall
citation patterns. Despite this limitation, we found that papers whose citation histories are
characterized by long dormant periods followed by fast growths are not exceptional outliers,
but simply the extreme cases in very heterogeneous but otherwise continuous distributions.
Simple models based on cumulative advantage, although consistent with overall citation
distributions, are not easily reconciled with the observed distributions of beauty coefficients.
Further work is needed to uncover the general mechanisms that may be held responsible for
the awakening of SBs.
ACKNOWLEDGMENTS
We thank Claudio Castellano, Filippo Menczer, Yong-Yeol Ahn, Cassidy Sugimoto, and
Chaoqun Ni for insightful discussions, and the American Physical Society for making the
APS dataset publicly available. This work is partially supported by NSF (grant SMA1446078).
17
[1] Egghe L, Rousseau R (1990) Introduction to Informetrics: Quantitative Methods in Library,
Documentation and Information Science (Elsevier Science, Amsterdam).
[2] Newman MEJ (2004) Coauthorship networks and patterns of scientific collaboration. Proc
Natl Acad Sci USA 101(suppl 1):5200–5205.
[3] Sun X, Kaur J, Milojevi´c S, Flammini A, Menczer F (2013) Social dynamics of science. Sci
Rep 3:1069.
[4] Guimer`
a R, Uzzi B, Spiro J, Amaral LAN (2005) Team assembly mechanisms determine
collaboration network structure and team performance. Science 308(5722):697–702.
[5] Wuchty S, Jones BF, Uzzi B (2007) The increasing dominance of teams in production of
knowledge. Science 316(5827):1036–1039.
[6] Jones BF, Wuchty S, Uzzi B (2008) Multi-university research teams: Shifting impact, geography, and stratification in science. Science 322(5905):1259–1262.
[7] Milojevi´c S (2014) Principles of scientific research team formation and evolution. Proc Natl
Acad Sci USA 111(11):3984–3989.
[8] Radicchi F, Fortunato S, Castellano C (2008) Universality of citation distributions: Toward
an objective measure of scientific impact. Proc Natl Acad Sci USA 105(45):17268–17272.
[9] Wang D, Song C, Barab´
asi AL (2013) Quantifying long-term scientific impact. Science
342(6154):127–132.
[10] Uzzi B, Mukherjee S, Stringer M, Jones B (2013) Atypical combinations and scientific impact.
Science 342(6157):468–472.
[11] Hirsch JE (2005) An index to quantify an individual’s scientific research output. Proc Natl
Acad Sci USA 102(46):16569–16572.
[12] Kinney A (2007) National scientific facilities and their science impact on nonbiomedical
research. Proc Natl Acad Sci USA 104(46):17943–17947.
[13] Davis P, Papanek GF (1984) Faculty ratings of major economics departments by citations.
Am Econ Rev 74(1):225–230.
[14] Bornmann L, Daniel HD (2006) Selecting scientific excellence through committee peer review-a
citation analysis of publications previously published to approval or rejection of post-doctoral
research fellowship applicants. Scientometrics 68(3):427–440.
18
[15] Liu NC, Cheng Y (2005) The academic ranking of world universities. High Educ Eur 30:127–
136.
[16] Sarig¨ol E, Pfitzner R, Scholtes I, Garas A, Schweitzer F (2014) Predicting scientific success
based on coauthorship networks. EPJ Data Science 3(1):9.
[17] Petersen AM, et al. (2014) Reputation and impact in academic careers. Proc Natl Acad Sci
USA 111(43):15316–15321.
[18] de Solla Price DJ (1976) A general theory of bibliometric and other cumulative advantage
processes. J Am Soc Inf Sci 27(5):292–306.
[19] Barab´asi AL, Albert R
(1999) Emergence of scaling in random networks.
Science
286(5439):509–512.
[20] Albert R, Barab´
asi AL (2002) Statistical mechanics of complex networks. Rev Mod Phys
74(1):47–97.
[21] Boccaletti S, Latora V, Moreno Y, Chavez M, Hwang DU (2006) Complex networks: Structure
and dynamics. Phys Rep 424(4–5):175–308.
[22] Krapivsky PL, Redner S (2001) Organization of growing random networks. Phys Rev E Stat
Nonlin Soft Matter Phys 63(6 Pt 2):066123.
[23] Newman MEJ (2009) The first-mover advantage in scientific publication. EPL 86(6):68001.
[24] Hajra KB, Sen P (2004) Phase transitions in an aging network. Phys Rev E Stat Nonlin Soft
Matter Phys 70(5 Pt 2):056103.
[25] Hajra KB, Sen P (2005) Aging in citation networks. Physica A 346(1–2):44–48.
[26] Hajra KB, Sen P (2006) Modelling aging characteristics in citation networks. Physica A
368(2):575–582.
[27] Wang M, Yu G, Yu D (2008) Measuring the preferential attachment mechanism in citation
networks. Physica A 387(18):4692–4698.
[28] Dorogovtsev SN, Mendes JFF (2000) Evolution of networks with aging of sites. Phys Rev E
Stat Nonlin Soft Matter Phys 62:1842.
[29] Dorogovtsev SN, Mendes JF (2001) Scaling properties of scale-free evolving networks: Continuous approach. Phys Rev E Stat Nonlin Soft Matter Phys 63(5 Pt 2):056125.
[30] Zhu H, Wang X, Zhu JY (2003) Effect of aging on network structure. Phys Rev E Stat Nonlin
Soft Matter Phys 68(5 Pt 2):056121.
19
[31] Garfield E (1980) Premature discovery or delayed recognition—why?
Current Contents
21:5–10.
[32] Garfield E (1989) Delayed recognition in scientific discovery: Citation frequency analysis aids
the search for case histories. Current Contents 23:3–9.
[33] Garfield E (1989) More delayed recognition. Part 1. Examples from the genetics of color blindness, the entropy of short-term memory, phosphoinositides, and polymer rheology. Current
Contents 38:3–8.
[34] Garfield E (1990) More delayed recognition. Part 2. From inhibin to scanning electron microscopy. Current Contents 9:3–9.
[35] Gl¨anzel W, Schlemmer B, Thijs B (2003) Better late than never? On the chance to become
highly cited only beyond the standard bibliometric time horizon. Scientometrics 58(3):571–
586.
[36] van Raan AFJ (2004) Sleeping Beauties in science. Scientometrics 59(3):467–472.
[37] Redner S (2005) Citation statistics from 110 years of physical review. Phys Today 58(6):49–54.
[38] Bornmann L, Leydesdorff L, Wang J (2013) Which percentile-based approach should be
preferred for calculating normalized citation impact values? An empirical comparison of
five approaches including a newly developed citation-rank approach (p100). J Informetrics
7(4):933–944.
[39] Bornmann L, Leydesdorff L, Wang J (2014) How to improve the prediction based on citation
impact percentiles for years shortly after the publication date? J Informetrics 8(1):175–180.
[40] Wang J (2013) Citation time window choice for research impact evaluation. Scientometrics
94(3):851–872.
[41] Gl¨anzel W, Garfield E (2004) The myth of delayed recognition. The Scientist 18:8–9.
[42] Marx W, Bornmann L, Cardona M (2010) Reference standards and reference multipliers for
the comparison of the citation impact of papers published in different time periods. J Am Soc
Info Sci Technol 61(10):2061–2069.
[43] Garfield E (1955) Citation indexes for science: A new dimension in documentation through
association of ideas. Science 122(3159):108–111.
[44] Marx W (2014) The Shockley-Queisser paper–a notable example of a scientific sleeping beauty.
Annalen der Physik 526(5-6):A41–A45.
20
[45] Kleinberg JM (1999) Authoritative sources in a hyperlinked environment. J ACM 46(5):604–
632.
[46] Seglen PO (1997) Why the impact factor of journals should not be used for evaluating research.
BMJ 314(7079):497.
[47] Zachary WW (1977) An information flow model for conflict and fission in small groups. J
Anthropol Res 33(4):452–473.
[48] Girvan M, Newman MEJ (2002) Community structure in social and biological networks. Proc
Natl Acad Sci USA 99(12):7821–7826.
[49] Karplus R, Luttinger J (1954) Hall effect in ferromagnetics. Phys Rev 95(5):1154–1160.
[50] Zener C (1951) Interaction between the d-shells in the transition metals. ii. ferromagnetic
compounds of manganese with perovskite structure. Phys Rev 82(3):403–405.
[51] Molina M (1998) Transport of localized and extended excitations in a nonlinear anderson
model. Phys Rev B 58(19):12547–12550.
[52] Nordheim L (1950) β-decay and the nuclear shell model. Phys Rev 78(3):294.
[53] Metzner W, Vollhardt D (1989) Correlated lattice fermions in d = ∞ dimensions. Phys Rev
Lett 62(3):324–327.
[54] Clauset A, Shalizi CR, Newman MEJ (2009) Power-law distributions in empirical data. SIAM
Rev 51(4):661–703.
[55] Garfield E (2006) The history and meaning of the journal impact factor. JAMA 295(1):90–93.
[56] Garfield E (1972) Citation analysis as a tool in journal evaluation. Science 178(4060):471–479.
[57] Garfield E (1999) Journal impact factor: A brief review. Can Med Assoc J 161(8):979–980.
21
Supporting Information
S1.
DATASETS
In this work, we use two large datasets, namely the American Physical Society (APS) and
the Web of Science (WoS). APS contains 463, 348 papers published from 1893 to 2009 in APS
journals and is publicly available upon request at http://journals.aps.org/datasets;
WoS is comprised of 35, 174, 034 papers published between 1900 and 2011 in journals covering
most research fields, and is available upon purchase from Thomson Reuters. Most papers
in the APS dataset are also in the WoS. The APS dataset, though, contains fewer citations:
only those originating from papers within the APS journals are therein recorded. Our
analysis is based on papers that received at least one citation. A total number of 384, 649
and 22, 379, 244 such papers were found in the APS and WoS dataset, respectively. Fig. S1
shows the yearly number of papers with at least one citation received before the end of
the observation period. The fact that recent papers have had less time to accumulate
citations is reflected in the sharp decrease that is noticeable as time approaches the end of
the observation period.
S2.
EXAMPLES OF TOP SLEEPING BEAUTIES
Figs. S2 and S3 show the citation history of the top 24 papers in the APS dataset.
Table S1 presents the comparison between our results and Redner’s results [8].
Fig. S4 displays the citation history of the top 15 Sleeping Beauties in the WoS dataset
showed in Table I of the main text. Tables S2, S3, and S4 present the basic information of
the top Sleeping Beauties in Statistics, Mathematics, and Social Sciences and Humanities,
respectively. See Figs. S5–S8 for corresponding citation histories.
S3.
CHARACTERIZING DECREASING PATTERNS
This section presents a statistical characterization of how yearly citations of papers decrease after the peak. In summary, for most of the papers the yearly citation rate decreases
quickly (possibly exponentially) after its peak. Our analysis focused only papers with pos22
itive beauty coefficient B, for a total of 189, 673 (out of 384, 649; 49.3%) and 14, 689, 643
(out of 22, 379, 244; 65.6%) papers in the APS and WoS dataset, respectively. We further
classify every of these papers into two categories depending on whether or not their yearly
citation counts ct decreased to half of its maximum during the observation period [tm + 1, T ]
(Figs. S9A-B ).
We identify 18, 131 (9.56%) papers in the APS whose ct have not decreased below ctm /2,
and 2, 094, 671 (14.26%) in the WoS dataset. Figs. S9C–D display the histograms of T − tm .
We observe that a large fraction are recently awakening papers, with about 60% of them
getting their maximum yearly citations ctm in the last year of the observation periods (T −
tm = 0).
For the remaining papers whose yearly citations have decreased below ctm /2, we define
the paper “half-life” th as the number of years required by ct to decrease from ctm to ctm /2.
Figs. S9E–H show the distributions of th across all these papers in the APS (Fig. S9E ),
papers whose B values ranked in the top 1% (Fig. S9F ), from 1% to 10% (Fig. S9G), and
the rest (Fig. S9H ). We see that yearly citations of SBs decrease rapidly after the peak
regardless of their B values. These results are confirmed also in the WoS dataset, as shown
in Figs. S9I–L.
S4.
NULL MODELS
To verify that the beauty coefficients cannot be explained by the underlying citation
networks or other well-known mechanisms, we compare the citation history of each paper as
well as the beauty coefficient distribution with those obtained from some null models. Here
we employ two null models on the APS dataset, namely citation network randomization
(NR) and the preferential attachment mechanism (PA).
The NR procedure starts from the original citation network and carries out a series of
link swapping. The end-point nodes (the papers being cited) of a randomly selected pair
of links (citations) are swapped if: (i) the two links do not share source or target node; (ii)
there are no multiple links after swapping; and, (iii) the publication year of the cited article
is not greater than that of the citing article after swapping. Performing Q·E switches, where
E is the number of links in the citation network and Q is set to 50, yields a transformation
of the original citation network into a random directed graph. This procedure preserves for
23
each paper its number of references (out degree) and total number of citations (in degree),
but destroys the dynamics of yearly citations.
PA considers as initial network the empirical APS citation network from 1893 to 1897
when the first citation occurred; it contains 182 nodes and 1 link. In each following year t
until 2009, nt papers are added at the same time, and each paper p brings rp references. nt
is set to the number of APS papers actually published in year t and each rp corresponds to
the number of references of one of the papers in such set. As we progressively add papers
to the citation network, the references they contain are addressed to previously published
papers chosen with probability proportional to one plus the number of citations those papers
already have.
S5.
COARSE TOPICS OF SLEEPING BEAUTIES IN THE APS
Examining the citation relationships between papers with high B values gives us some
coarse topics of Sleeping Beauties. In Fig. S10 we present the citation network of the 100
papers with the highest B values in the APS dataset. Despite many isolated nodes, we
observe some (weakly) connected components. Diving into each component, we find that
each one corresponds to one coarse topic. In Fig. S11, for instance, we show the topic of
each of the 4 largest components and the citation histories of its constituent papers. Except
for Fig. S11(b), we observe that papers belonging to the same group exhibit remarkably
similar citation histories. They are awoken in the same year and exhibit similar up- and
down-going citation patterns. Fig. S11(a) shows the double exchange mechanism works.
This theory was introduced in 1950s and became popular in the 1990s. The second group
shown in Fig. S11(b) is about Quantum Mechanics. The central paper (blue line and blue
node), which is cited by every other paper in the group, is the famous EPR paradox paper
by Einstein, Podolsky, and Rosen. The third group shown in Fig. S11(c) is particularly
interesting, as it exhibits complex fluctuations in the citation histories. Finally, the group
shown in Fig. S11(d) is about graphite and graphene. The central paper (blue line and blue
node) in Fig. S11(d) is a pioneering work on the band structure of graphite, foundation of
the discovery of graphene, the subject of the 2010 Nobel Prize in Physics.
24
Number of publications
4
2.0
1.0 ×10
total
1.5
C >0
0.8
1.0
0.5
0.6
0.0
1893
6
2.0 ×10
0.4
1.5
1910
(a) APS
1930
1950
1970
1990
2009
(b) WoS
1.0
0.2
0.5
0.0
0.0
1900
0.0
1915 0.2 1930
0.41950
Year
0.61970
1990
0.8
2011
1.0
FIG. S1. (Blue solid) Total number of papers per year; (Green dashed) Yearly number of papers
that received citations.
25
Empirical
1994
yearly citations
A
100
80
60
40
20
0
1951
60 D
50
40
30
20
10
0
1955
80 G
70
60
50
40
30
20
10
0
1964
1994
1998
NR
100 B
80
60
40
20
0
1935
70 E
60
50
40
30
20
10
0
1947
50 H
40
30
20
10
0
1955
PA
80 C
70
60
50
40
30
20
10
0
1987
1955
80 F
70
60
50
40
30
20
10
0
2004 1960
70 I
60
50
40
30
20
10
0
1994
1955
1994
1994
2002
year
FIG. S2. Top Sleeping Beauties in physics. Blue curves show yearly citations received by papers:
(A) Phys. Rev. 82, 403 (1951), B = 1, 722 [12]; (B ) Phys. Rev. 47, 777 (1935), B = 1, 419 [4];
(C ) Phys. Rev. 100, 675 (1955), B = 1, 348 [1]; (D) Phys. Rev. 100, 545 (1955), B = 1, 107 [10];
(E ) Phys. Rev. 71, 622 (1947), B = 1, 086 [9]; (F ) Phys. Rev. 118, 141 (1960), B = 841 [2]; (G)
Phys. Rev. 135, A550 (1964), B = 825 [5]; (H ) Phys. Rev. 100, 564 (1955), B = 670 [7]; (I ) Phys.
Rev. 100, 580 (1955), B = 624 [3]. Yearly citations obtained from citation network randomization
(NR) and preferential attachment (PA) model are plotted as green and purple lines, respectively.
Both the NR and PA results are averaged across 10 realizations. The awakening years, identified
using Eq. 3, are indicated by the vertical red lines. The sharp decrease of the curve for the NR
result in panel B is probably due to the decrease of number of publications during the period of
World War II (Fig. S1a). Panels A, C, D, F, and H refer to papers about the double exchange
mechanism. Panel B refers to the EPR paradox paper by Einstein, Podolsky, and Rosen. Panel E
considers the pioneering study on the band structure of graphite.
26
Yearly citations
40 PhysRev.102.1413
35 B =581.73
30
25
20
15
10
5
0
1956
1995
20 PhysRev.104.666
B =413.60
15
10
5
0
1956
PhysRev.71.38
PhysRev.50.955
15 B =477.36
10
5
0
1947
1999
16 PhysRev.55.374
14 B =404.35
12
10
8
6
4
2
0
2005 1939
1996
40 PhysRevLett.9.266
35 B =365.30
30
25
20
15
10
5
0
1962
1996
25 PhysRev.95.1154
B =452.53
15
20
15
10
10
5
5
0
0
1936
1998 1954
2002
40 RevModPhys.36.39
16 PhysRev.55.364
35 B =387.23
14 B =397.67
30
12
25
10
20
8
15
6
10
4
5
2
0
0
1939
1996 1964
1987
16 PhysRev.66.163
PhysRev.105.904
14 B =362.42
20 B =360.10
12
15
10
8
10
6
4
5
2
0
0
1944
1993
1957
1995
B =467.67
35 PhysRev.186.456
B =364.98
30
25
20
15
10
5
0
1969
2001
Year
30 PhysRev.71.809
25 B =443.99
20
15
10
5
0
1947
1999
35 PhysRevLett.8.250
B =377.05
30
25
20
15
10
5
0
1962
1986
35 PhysRev.130.1677
30 B =338.44
25
20
15
10
5
0
1963
1990
FIG. S3. (Blue) Citation histories, (Red) awakening years, and B values of the 15 papers ranked
from 10th to 24th based on the B values in the APS dataset. The ending year is 2009.
27
Publication
Rank
B
Awakening
PR 40, 749 (1932)
45
250.79
1980
PR 46, 1002 (1934)
54
237.40
1975
PR 47, 777 (1935)
2
1419.15
1987
PR 56, 340 (1939)
96
174.59
1987
PR 82, 403 (1951)
1
1722.25
1994
PR 82, 664 (1951)
192
122.56
2007
PR 100, 545 (1955)
4
1106.82
1994
PR 100, 564 (1955)
8
670.42
1994
PR 100, 675 (1955)
3
1348.26
1994
PR 109, 1492 (1958) 147
138.63
2004
PR 115, 485 (1959)
218
115.07
2001
PR 118, 141 (1960)
6
841.47
1994
TABLE S1. Comparison between our results and Redner’s results [8]. The first column lists the 12
revived classics in physics detected by Redner’s analysis and arranged in chronological order. From
the second column, we report our results: the rank position according to their beauty coefficient
B, the value of B, and the awakening year.
28
Yearly citations
B =11600.05
300
250
200
150
100
50
0
1906
160 B =3978.42
140
120
100
80
60
40
20
0
1901
250 B =2671.27
200
150
100
50
0
1916
800 B =10769.06
700
600
500
400
300
200
100
0
2002 1958
200 B =5922.97
B =3892.49
100
50
0
2002 1909
1989
B =2584.08
400
300
200
100
0
2003 1934
150
300
100
200
50
100
0
2007 1939
150
1982
B =5167.63
400
0
2004 1944
100 B =3559.95
80
60
40
20
0
1907
400 B =2962.53
350
300
250
200
150
100
50
0
1998 1936
140 B =2573.16
120
100
80
60
40
20
0
1954
300 B =2258.28
250
200
150
100
50
0
2005 1935
Year
B =4273.11
250
200
150
100
50
0
2002 1951
100 B =2736.18
80
60
40
20
0
2003 1927
160 B =2183.55
140
120
100
80
60
40
20
0
1994
1921
1997
1999
1995
FIG. S4. (Blue) Citation histories, (Red) awakening years, and B values of the top 15 papers,
based on the B values in the WoS dataset. The ending year is 2011.
29
B
Author
Title
Pub., awake Journal
3978 Pearson, K
On lines and planes of closest fit to systems of points in space
1901, 2002
Philos. Mag.
2736 Wilson, EB
Probable inference, the law of succession, and statistical inference
1927, 1999
J. Am. Statist. Assoc.
1909 Mann, HB
Nonparametric tests against trend
1945, 2003
Econometrica
Nonparametric estimation from incomplete observations
1958, 1980
J. Am. Statist. Assoc.
1922, 2006
J. R. Stat. Soc.
1970, 1995
Biometrika
1193 Metropolis, N The monte carlo method
1949, 2004
J. Am. Statist. Assoc.
1124 Moran, PAP
Notes on continuous stochastic phenomena
1950, 1999
Biometrika
1050 Lorenz, MO
Methods of measuring the concentration of wealth
1905, 2005
J. Am. Statist. Assoc.
985 Kendall, MG
A new measure of rank correlation
1938, 2004
Biometrika
Kaplan, EL;
1893
Meier, P
On the interpretation of χ2 from contingency tables,
1760 Fisher, RA
and the calculation of P
Monte-carlo sampling methods using markov chains and
1247 Hastings, WK
their applications
TABLE S2. Basic information about the top 10 papers in Statistics. See Fig. S5 for their citation
Yearly citations
Yearly citations
histories.
160 B =3978.42
140
120
100
80
60
40
20
0
1901
100 B =2736.18
80
60
40
20
0
2002 1927
140 B =1909.04
120
100
80
60
40
20
0
1999 1945
B =1247.13
100 B =1193.01
80
60
40
20
0
1949
120 B =1123.53
100
80
60
40
20
0
2004 1950
250
200
150
100
50
0
1970
1995
Year
1500
B =1893.24
1000
500
2003
0
1958
20
B =1049.73
15
10
5
1999
1980
0
1905
60 B =1760.25
50
40
30
20
10
0
1922
60 B =985.28
50
40
30
20
10
0
2005 1938
2006
2004
FIG. S5. (Blue) Citation histories, (Red) awakening years, and B values of top 10 papers in
Statistics based on the B values in the WoS dataset. The ending year is 2011.
30
B
Author
Title
Pub., awake Journal
1215 Wiener, N
The homogeneous chaos
1938, 2001 Amer. J. Math.
1060 Leray, J
On the movement of a viscous fluid to fill the space
1934, 1995 Acta Math.
851 Pringsheim, A On the theory of the double infinite numerical orders
1900, 2005 Math. Ann.
765 Jensen, JLWV On the convex functions and inequalities between mean values
1906, 2006 Acta Math.
706 Mann, WR
Mean value methods in iteration
1953, 2004 Proc. Am. Math. Soc.
670 Halpern, B
Fixed points of nonexpanding maps
1967, 2004 Bull. Amer. Math. Soc.
On the theory of orthogonal function systems (first announcement)
1910, 1988 Math. Ann.
669 Haar, A
The asymptotic dispersal law of eigen values of linear partial equations
609 Weyl, H
1912, 2002 Math. Ann.
differential (with an application for the theory of cavity radiation)
About second order and higher order differential equations whose
578 Painleve, P
1902, 1990 Acta Math.
general integral is uniform
On the theory of linear and non-linear integral equations chapter i
558 Schmidt, E
1907, 1992 Math. Ann.
development of random functions in specific systems
TABLE S3. Basic information about the top 10 papers in Mathematics. See Fig. S6 for their
Yearly citations
Yearly citations
citation histories.
60 B =1215.38
50
40
30
20
10
0
1938
80 B =1060.01
70
60
50
40
30
20
10
0
2001 1934
60 B =669.62
50
40
30
20
10
0
1967
2004
25 B =669.06
20
15
10
5
0
1910
B =850.50
15
20 B =764.95
15
10
10
5
1995
5
0
1900
0
2005 1906
25 B =608.51
1988
20
15
10
5
0
1912
Year
14 B =578.42
12
10
8
6
4
2
0
2002 1902
70 B =705.71
60
50
40
30
20
10
0
2006 1953
20 B =557.93
2004
15
10
5
1990
0
1907
1992
FIG. S6. (Blue) Citation histories, (Red) awakening years, and B values of top 10 papers in
Mathematics based on the B values in the WoS dataset. The ending year is 2011.
31
B
Author
1901 Stroop, JR
Title
Pub., awake Journal
Studies of interference in serial verbal reactions
1935, 1987 J. Exp. Psychol.
The relation of strength of stimulus to rapidity of habit-formation
1908, 1981 J. Comp. Neurol.
584 Zachary, WW
Information flow model for conflict and fission in small groups
1977, 2005 J. Anthropol. Res.
563 Tobler, WR
Computer movie simulating urban growth in Detroit region
1970, 2003 Econ. Geogr.
Yerkes, RM;
1255
Dodson, JD
Citation indexes for science - new dimension in documentation
545 Garfield, E
1955, 2000 Science
through association of ideas
Heider, F;
545
An experimental study of apparent behavior
1944, 1998 Am. J. Psychol.
521 Watson, JB
Psychology as the behaviorist views it
1913, 1968 Psychol. Rev.
488 Cohen, J
A coefficient of agreement for nominal scales
1960, 2009 Educ. Psychol. Meas.
485 Maslow, AH
A theory of human motivation
1943, 1998 Psychol. Rev.
479 Glaser, BG
The constant comparative method of qualitative analysis
1965, 2004 Social Problems
467 Todd TW
Age changes in the pubic bone
1921, 2003 Am. J. Phys. Anthropol.
Industrial dynamics - a major breakthrough for decision makers
1958, 1993 HBR
Simmel, M
460 Forrester, JW
Perceptron - a probabilistic model for information storage and
453 Rosenblatt, F
1958, 2001 Psychol. Rev.
organization in the brain
446 Hotelling, H
Analysis of a complex of statistical variables into principal components 1933, 1994 J. Educ. Psychol.
Thorndike, EL;
The influence of improvement in one mental function upon the
Woodworth, RS
of efficiency other functions (I)
428
1901, 1992 Psychol. Rev.
Holzinger, KJ;
424
The bi-factor method
1937, 2003 Psychometrika
Swineford, F
Thistlethwaite, DL; Regression-discontinuity analysis 405
1960, 2005 J. Educ. Psychol.
Campbell, DT
an alternative to the ex-post-facto experiment
399 Horn, JL
A rationale and test for the number of factors in factor-analysis
1965, 2000 Psychometrika
375 Fisher, I
The debt-deflation theory of great depressions
1933, 2004 Econometrica
369 Spitzer, HF
Studies in retention
1939, 2004 J. Educ. Psychol.
Cumulative illness rating scale
1968, 1999 J Am Geriatr Soc.
The goal gradient hypothesis and maze learning
1932, 2001 Psychol. Rev.
Chimpanzee and human feet in bipedal walking
1935, 2001 Am. J. Phys. Anthropol.
Linn, BS;
368 Linn, MW;
Gurel, L
358 Hull, CL
Elftman, H;
356
Manter, J
Fornell, C;
Evaluating structural equation models with unobservable variables and
Larcker, DF
measurement error
349
1981, 2004 J. Marketing Res.
Armstrong, JS;
343
Estimating nonresponse bias in mail surveys
1977, 1998 J. Marketing Res.
Overton, TS
342 Wechsler, H
Toward neutral principles of constitutional-law
1959, 1986 Harv. Law Rev.
324 Cohen, J
Eta-squared and partial eta-squared in fixed factor anova designs
1973, 2005 Educ. Psychol. Meas.
324 Dunlap, K
Reactions to rhythmic stimuli, with attempt to synchronize
1910, 1995 Psychol. Rev.
320 Ellsberg, D
Risk, ambiguity, and the savage axioms
1961, 2002 Q. J. Econ.
320 Lewin, K
Defining the ‘field at a given time’
1943, 2006 Psychol. Rev.
TABLE S4. Basic information about the Sleeping Beauties in Social Sciences and Humanities
among the top 1, 000 in the WoS dataset. See Fig. S7 and S8 for their citation histories.
32
Yearly citations
400 B =1901.22
350
300
250
200
150
100
50
0
1935
1987
50 B =544.78
40
30
20
10
0
1944
12 B =467.05
10
8
6
4
2
0
1921
80
B =1254.98
60
40
20
0
1908
1998
1981
25 B =521.17
20
15
10
5
0
1913
1968
30 B =459.91
25
20
15
10
5
0
2003 1958
60 B =584.33
50
40
30
20
10
0
1977
700 B =487.91
600
500
400
300
200
100
0
1960
2005
100 B =485.33
80
60
40
20
0
2009 1943
60 B =453.03
1993
50
40
30
20
10
0
1958
Year
80 B =563.35
70
60
50
40
30
20
10
0
1970
2003
1998
100 B =446.25
2001
80
60
40
20
0
1933
1994
50 B =545.01
40
30
20
10
0
1955
35 B =479.21
30
25
20
15
10
5
0
1965
14 B =428.45
12
10
8
6
4
2
0
1901
2000
2004
1992
FIG. S7. (Blue) Citation histories, (Red) awakening years, and B values of top 15 Sleeping Beauties
in Social Sciences and Humanities based on the B values in the WoS dataset. The ending year is
2011.
33
25 B =404.98
20
15
10
5
Yearly citations
14 B =423.78
12
10
8
6
4
2
0
1937
80 B =368.08
70
60
50
40
30
20
10
0
1968
2003
1999
35 B =342.21
30
25
20
15
10
5
0
1959
1986
120 B =398.93
100
80
60
40
20
0
2005 1965
20 B =375.46
15
10
5
0
1960
14 B =358.18
12
10
8
6
4
2
0
1932
10 B =356.40
8
6
4
2
0
2001 1935
800 B =349.10
700
600
500
400
300
200
100
0
2001 1981
35 B =324.20
30
25
20
15
10
5
0
1973
8 B =323.92
7
6
5
4
3
2
1
0
1910
100 B =320.20
80
60
40
20
0
1995 1961
2005
Year
2000
0
1933
14 B =368.68
12
10
8
6
4
2
0
2004 1939
2004
2002
2004
250 B =343.40
200
150
100
50
0
1977
1998
16 B =319.51
14
12
10
8
6
4
2
0
1943
2006
FIG. S8. (Blue) Citation histories, (Red) awakening years, and B values of 15 Sleeping Beauties
ranked from 16th to 30th in Social Sciences and Humanities based on B values in the WoS dataset.
The ending year is 2011.
34
0.9
0.0
1 2 3 4 5[6,15]
th
.710
P
P
0.0
1 2 3 4 5[6,27]
th
0.3
0.0
P
P
th
.04 .02 .01
0.9
.148
.046.016.007.005
th
1 2 3 4 5[6,21]
th
0.3
0.0
0.3
0.0
1 2 3 4 5[6,15]
0.9
K
0.6
.151
.048.019.009.009
.22
.10
.05 .02 .02
0 1 2 3 4[5,33]
.719
T−tm
H
0.6
0.9 .787
J
D
.60
0.4
0.0
P
0.3
0.0
1 2 3 4 5[6,10]
0.6
.179
.064.026
.011.010
.08
0.6
.162
.074.037
.017.015
0.9 .765
I
0.6
0.3
0.3
.23
0.6
P
0.0
.181
.060.021.008.006
0.4
1987 2009
0 1 2 3 4[5,17]
T−tm
Year
0.9 .777
F
G
P
0.3
0.6
P
P
0.6
.695
0.8
C
.62
0.0
P
.724
0.8
B
80
60
40
20
0
1994 2009 1935
Year
0.9
E
Yearly citations
Yearly citations
A
100
80
60
40
20
0
1951
0.9
.145
.042.015.006.005
1 2 3 4 5[6,23]
th
0.3
0.0
.184
.061.022.008.006
1 2 3 4 5[6,13]
th
.701
L
.183
.066.027
.012.011
1 2 3 4 5[6,27]
th
FIG. S9. Characterization of decreasing citation patterns of Sleeping Beauties. (A–B ) Papers with
positive beauty coefficient B are classified into two categories depending on whether or not their
yearly citation counts have decreased to half of their maximum. (C–D) For papers belonging to the
first class, we measure the length T − tm of the observation window at our disposal. T = 2009 for
the APS and T = 2011 for the WoS are the last year covered by our datasets. tm is instead the year
when we observe the maximum number of yearly citations accumulated by an individual paper.
The figures display the histograms of the quantity T − tm obtained for the APS (C ) and WoS (D)
dataset. (E–H ) For papers that have experienced a fall in yearly citation counts at least below the
half of their peak height cm , we measure th , i.e., the number of years necessary to fall below the
line cm /2. We show that the distribution of th is insensible to the specific dataset considered, and
to their beauty coefficient B. Panels F, G and H refer to the papers of the APS dataset ranked
in the top 1%, top 1% to 10%, below 10%, respectively. Panels I–L show the same histograms as
those of panels E–H, but for the WoS dataset.
35
PhysRev.100.564
PhysRev.104.576
PhysRevA.2.256
PhysRev.100.545
PhysRev.118.141
PhysRev.32.97
PhysRev.82.403
PhysRevLett.25.1543
PhysRev.81.440
PhysRev.32.110
PhysRev.133.A171
PhysRev.100.675
PhysRev.117.117
PhysRev.135.A550
PhysRev.181.682
PhysRev.108.612
PhysRev.86.694
PhysRev.109.1510
RevModPhys.36.39
PhysRevLett.9.266
PhysRev.109.272
PhysRevLett.8.250
PhysRev.104.666
PhysRev.130.1605
PhysRev.105.767
PhysRevLett.9.309
PhysRev.71.622
PhysRevLett.53.2449
RevModPhys.36.31
PhysRev.105.1119
PhysRev.130.1616
PhysRevLett.61.2015
RevModPhys.17.343
PhysRev.85.180
PhysRev.95.1154
PhysRev.37.405
PhysRev.47.777
PhysRev.38.2265
PhysRev.136.B571
PhysRevLett.23.880
PhysRev.55.374
PhysRevB.2.4559
PhysRev.85.166
PhysRev.48.696
FIG. S10. The citation network of the 100 papers with highest B values in the APS dataset.
Isolated nodes are omitted. The size of a node is based on its total number of citations.
36
FIG. S11. The citation network reveals coarse topics of Sleeping Beauties. Papers belonging to
the same group exhibit similar citation histories.
37
yearly (co-)citations
60
50
40
30
20
10
0
1977
J Anthropol Res 33, 452 (1977)
PNAS 99, 7821 (2002)
year
2002
2011
FIG. S12. Citation history of the paper J. Anthropol. Res. 33, 452 (1977) [11]. The most co-cited
paper is PNAS 99, 7821 (2002) [6].
38
Subject category
Range of B
physics, multidisciplinary
chemistry, multidisciplinary
[90.56, 5922.97]
[90.57, 10769.06]
multidisciplinary sciences
[90.54, 3892.49]
mathematics
[90.62, 1215.38]
medicine, general & internal
[90.58, 1522.30]
physics, applied
[90.63, 3978.42]
surgery
[90.57, 799.65]
chemistry, inorganic & nuclear
[90.55, 1333.20]
statistics & probability
[90.56, 2736.18]
mechanics
[90.56, 3978.42]
biology
[90.68, 1247.13]
ecology
[90.60, 1792.29]
physics, condensed matter
[90.58, 3978.42]
biochemistry & molecular biology
[90.62, 839.22]
astronomy & astrophysics
[90.56, 984.81]
physics, atomic, molecular & chemical
[90.60, 774.23]
neurosciences
[90.59, 633.23]
materials science, multidisciplinary
[90.63, 3978.42]
plant sciences
[90.54, 1199.00]
engineering, chemical
[90.60, 2962.53]
TABLE S5. Threshold of B for each of the top 20 subject categories producing the top 0.1% SBs
in the WoS dataset.
39
[1] P. Anderson and H. Hasegawa. Considerations on double exchange. Phys. Rev., 100:675–681,
Oct 1955.
[2] P. de Gennes. Effects of double exchange in magnetic crystals. Phys. Rev., 118:141–154, Apr
1960.
[3] G. Dresselhaus. Spin-orbit coupling effects in zinc blende structures. Phys. Rev., 100:580–586,
Oct 1955.
[4] A. Einstein, B. Podolsky, and N. Rosen. Can quantum-mechanical description of physical
reality be considered complete? Phys. Rev., 47:777–780, May 1935.
[5] P. Fulde and R. Ferrell. Superconductivity in a strong spin-exchange field. Phys. Rev.,
135:A550–A563, Aug 1964.
[6] M. Girvan and M. E. J. Newman. Community structure in social and biological networks.
Proceedings of the National Academy of Sciences, 99(12):7821–7826, 2002.
[7] J. Goodenough.
Theory of the role of covalence in the perovskite-type manganites
[La, m(II)]Mno3 . Phys. Rev., 100:564–573, Oct 1955.
[8] S. Redner. Citation statistics from 110 years of physical review. Physics Today, 58(6):49–54,
2005.
[9] P. Wallace. The band theory of graphite. Phys. Rev., 71:622–634, May 1947.
[10] E. Wollan and W. Koehler. Neutron diffraction study of the magnetic properties of the series
of perovskite-type compounds [(1 − x)La, xCa]Mno3 . Phys. Rev., 100:545–563, Oct 1955.
[11] W. W. Zachary. An information flow model for conflict and fission in small groups. Journal
of Anthropological Research, 33(4):452–473, 1977.
[12] C. Zener. Interaction between the d-shells in the transition metals. ii. ferromagnetic compounds
of manganese with perovskite structure. Phys. Rev., 82:403–405, May 1951.
40


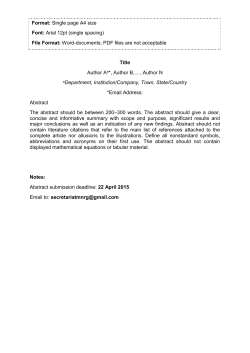


© Copyright 2026