
Farming Families in Crisis
Farming Families in Crisis A profile of the recipients of RABI and ARC-Addington Fund grants during the 2001 foot-and-mouth disease epidemic S P Carruthers April 2002 Copyright 2002 S P Carruthers i Preamble Acknowledgements This study reported here was commissioned and sponsored by the ARC-Addington Fund, Farm Crisis Network (FCN), the Royal Agricultural Benevolent Institution (RABI) and the Rural Stress Information Network (RSIN). The financial support of the Ernest Cook Trust is also gratefully acknowledged. Thanks are to staff of ARC-Addington Fund and RABI for extracting data. Special thanks are due to Katherine Doggrell who both extracted much of the data used in this study and conducted much of the basic data analysis; and to Richard Tranter, Deputy Director of the Centre for Agricultural Strategy, The University of Reading, for critical comment and review of the first draft of the report. The author Dr Peter Carruthers is Executive Director of the John Ray Initiative, an educational charity promoting environmental stewardship and sustainability in accordance with Christian principles and the responsible use of science and technology. He also serves as Chairman of the Agricultural Christian Fellowship and as a member of the national committee of Farm Crisis Network. He was formerly a Senior Research Fellow at the Centre for Agricultural Strategy, The University of Reading. ARC-Addington Fund (ARC-Addington) The Archbishop of Canterbury challenged the Churches to establish a fund to provide financial help to those affected by FMD. The Arthur Rank Centre responded by establishing a new national charity (ARC-Addington) to work alongside RABI and RSABI. The objects are “the relief of poverty suffered by those employed in the agricultural and kindred industries brought about by the effects of the foot and mouth disease epidemic”. Applications for help are dealt with at a local level by a team of volunteers from church, farming and support organisations, thus ensuring that applicants receive pastoral as well as financial support. Farm Crisis Network (FCN) Farm Crisis Network is a network of volunteers existing to support farming families, spiritually, emotionally and practically. The aim is to bring suitably prepared farming people alongside farming families in difficulties, to ‘walk with’ them as they struggle to find their way through their trouble. Volunteers are men and women recruited through churches, chaplains, the Agricultural Christian Fellowship and from responses to publicity. They have to have referees and each has a one-to-one interview. They include farm consultants, sales people, college staff and clergy, as well as farming men and women, many of whom have considerable experience of telephone helplines. ii Royal Agricultural Benevolent Institution (RABI) The Royal Agricultural Benevolent Institution is the national charity in England, Wales and Northern Ireland dedicated to helping members of the farming community suffering hardship. The emergency funds are normally restricted to helping with domestic expenses, but during the FMD crisis this was extended to include other essential expenditure resulting from the epidemic. Rural Stress Information Network (RSIN) The Rural Stress Information Network is the umbrella charity for the rural stress sector. Its aim is to work in partnership to develop an effective network to support those in distress in rural areas. The role of the charity is to support the development of local initiatives to tackle rural stress, raise awareness of the help available, work with those active in rural areas to encourage them to ‘stress-proof’ their approach and to support relevant research into the causes and alleviation of rural stress. The RSIN operated a 24 hour helpline from the start of the outbreak for five months and supported many to access the help available, both financial and practical, working closely with the other ‘Farming Help’ charities. iii Executive Summary Introduction The foot-and-mouth disease (FMD) epidemic of 2001 resulted in the slaughter of more than six million livestock on nearly 10,000 farms – equivalent to about 5% of all UK farms and 10% of livestock farms. The strict controls on the movement of animals and the prevention or delaying of sales impacted much more widely, affecting nearly all livestock businesses and bringing some into severe financial crisis. The Royal Agricultural Benevolent Institution (RABI) and the ARC-Addington Fund (ARCAddington) provided financial assistance to farming families experiencing hardship as a result of the epidemic. The remits of the two donors are complementary. RABI provides assistance with domestic bills; ARC-Addington has a wider remit and assists businesses, and is, hence, able to help in situations where RABI cannot. The Farm Crisis Network (FCN) and the Rural Stress Information Network (RSIN) not only assisted applicants to access grants, but also supported many others affected by the crisis. The RABI and ARC-Addington application forms, together with the knowledge and experience of the support organisations’ personnel, provide a unique insight into a part of the farming community. These families represent the main client group of the four organisations. They may also be representative of a larger group of farmers, which has yet to ‘break cover’. In order both to guide their own future strategies and to inform farming organisations and government, the four organisations commissioned an investigation of the characteristics and condition of recipients of RABI and ARC-Addington Fund grants during the 2001 FMD epidemic. Objective The objective of the study was to analyse and provide an account of the characteristics and condition of recipients of RABI and ARC-Addington grants during the FMD epidemic, using the information contained in samples of application forms. The analysis examined regional variation and, where possible, made comparisons between grant recipients and the farming population as a whole. Analysis Regionally structured samples were drawn from those who had received grants from RABI and ARC-Addington between February and August 2001 and February and October 2001 respectively. Samples represented, overall, 7% and 9.4% of the recipient populations of 7,710 and 10,923. Data were extracted from the forms and analysed, and key statistics derived for a range of variables. It should be noted that as a number of families received grants from both donors, the two populations are not mutually exclusive. However, it was not possible to crosscheck between the two data sets. iv Regional distribution of recipients The regional distribution of grant recipients was related strongly to the regional distribution of livestock farms and less strongly to the distribution of FMD cases. Highest concentrations were in the predominantly livestock regions of the North West, the South West, Wales and Northern Ireland. This emphasises that it was the measures to control FMD (notably livestock movement restrictions), which affected all livestock producers, rather than the specific occurrence of the disease that determined the regional pattern of grant recipients. The distribution of recipients to some extent also reflected the wider pattern of rural deprivation (as indicated by average national ranks of the Index of Multiple Deprivation 2000 for the rural wards within each region of England). RABI recipients represented 3.7% and Addington recipients 4.6% of all holdings in the UK, but the proportions were much higher in the predominantly livestock regions listed above and in the North East. This, together with the fact that holding number over-estimates the number of farm businesses, suggests that in some regions more than 10% of all farms were in receipt of grants. Family characteristics Analysis of recipients’ family characteristics (ie recipients ages, household sizes and numbers of dependent children) suggests that many of those in receipt of grants were younger families with children at home. Grant recipients were, on average, younger than UK farmers as a whole. There were no significant regional differences in recipients’ ages or household sizes, but there were significant regional differences in the numbers of dependent children, with the highest average number in Northern Ireland and the lowest in Yorkshire and the Humber. However, there were also appreciable numbers of recipients of retirement age, particularly among ARC-Addington recipients and in certain regions. This suggests that appreciable numbers of farmers of retirement age who are still farming are experiencing financial hardship. Household finances Off-farm income Some 58% of RABI recipients stated that they had income other than from farming, with the proportions lowest in Northern Ireland (31%) and the East of England (38%) and highest in the North West (85%). Comparison with values derived from the Farm Business Survey (FBS) revealed that grant recipients in England and Wales were more likely to have some off-farm income than farmers as a whole, but the reverse was true in Northern Ireland. Comparison with FBS data also showed that on average in England off-farm incomes of grant recipients were higher than those of farmers as a whole, but in Wales, and, especially, Northern Ireland, they were markedly lower. The most commonly stated source of off-farm v income was spouse/partner’s employment, followed by applicant’s employment. Low frequency of off-farm income and low amounts of off-farm income, combined with very low incomes from farming in general (as evident from FBS data) suggests that the situation in Northern Ireland is particularly critical. State benefits Receipt of state benefits, notably child benefit and working families tax credit, among grant recipients appeared somewhat low, especially in comparison with numbers of dependent children and in the light of the fact that grant recipients are, by definition, those suffering domestic hardship. This merits further investigation. Certainly, it seems likely that some farming families that may qualify for working families tax credit may not be taking it up, a conclusion backed by anecdotal evidence from the experience of caring organisations. Savings and investments Many grant recipients appear to have very limited domestic financial back up, with the problem again, appearing most acute in Northern Ireland. Proportions of RABI recipients stating they had savings averaged 46% and ranged from 4% in Northern Ireland to 81% in the North West. Estimated values of savings averaged £1,594 and ranged from £259 in Northern Ireland to £4,325 in the North East. Farm structure Farm area The average area farmed by grant recipients was about 78 ha. There was much variation both within and between regions. Average areas of recipients farms were similar or greater than regional average holding sizes for all farms. Tenure Comparison of proportions of owned and tenanted land on recipients’ farms with national averages and examination of data on their stated tenure, revealed that there is a higher proportion of wholly tenanted and mixed-tenure farms among grant recipients than in the regions and countries of the UK as a whole. Farm business Overdrafts The overdraft on the farm business account of RABI recipients averaged nearly £24,000, and ranged from as high as £790,000 to a credit of £15,715. There were no significant differences between regions. In most cases regional average overdrafts were lower than the average stated limits of recipients’ overdraft facilities. Average stated and overdraft and overdraft facility reflected farm sized. vi External liabilities Stated total farm business liabilities averaged £135,837 among RABI recipients and stated total debt among ARC-Addington recipients averaged £57,452. Average region total farm business liabilities were less closely related to farm size than were overdrafts, suggesting that for some non-bank debt has extended beyond the value of assets. Examination of debt per unit area on a farm-by-farm basis for ARC-Addington recipients, however, did suggest that farm debt among grant recipients is most acute on smaller farms. Comparisons with farming population as a whole Comparison of grant recipients farm business overdrafts and debts with data derived from the Farm Business Survey 1999/00 revealed that there was, on average, a higher level of debt among grant recipients than among farmers as a whole, particularly to creditors other than the bank and particularly in certain regions. There was much regional variation, with higher than average liabilities in Wales and Scotland. Applying for other grants Some 25% of RABI recipients stated that they were in receipt of other grants. The proportion varied between regions, from just 11% in Northern Ireland to 39% in Yorkshire and the Humber. Conclusions Characteristics of grant recipients The characteristics of grant recipients evident from this study can be summarised as follows. • Younger on average than UK farmers as a whole, many younger families with children at home. • An appreciable proportion in some regions were farmers who were past retirement age, but still farming. • Less likely than farmers in general to have off-farm income if in Northern Ireland, but more likely in England and Wales. • Lower off-farm incomes than farmers in general if in Wales and Northern Ireland, but higher if in England; possibly few opportunities for non-farming income. • Possible low uptake of working families tax credit. • Little domestic financial back up, but much regional variation. • Likely to be in the small-to-medium farm size categories. • More likely to be tenants and mixed-tenure farmers than is the case overall. • Slightly higher overdrafts than farmers in general. • Higher debts to creditors other than the bank than is the case in the farming population in general, but with much regional variation. • Farm debt likely to be more acute on smaller farms. vii Regional effects As might be expected, grant recipients were concentrated in the predominantly livestock production regions of the UK - the North West, the South West, Wales, Northern Ireland, and to a lesser extent, the West Midlands. The distribution of grant recipients in England also showed some relationship to wider pattern of rural deprivation, as indicated by the IMD 2000. These factors are, in fact, related as rural deprivation is higher in regions containing more remote rural areas and, often by association, a predominance of livestock rearing. There were smaller numbers of grant recipients in the East, the South East, Yorkshire and the Humber, the North East and the East Midlands. Livestock production is less frequent in these regions. They are also relatively prosperous, at least the first three. In these eastern regions, grant recipients are likely to represent a ‘residue’ of small livestock producers, who are also suffering financial hardship. With the exception of the North East, the proportion of tenanted land among grant recipients was higher than average for grant recipients. In some ways, these farmers are likely to be even more ‘hidden’ or ‘forgotten’ than those in western England, Wales and Northern Ireland. This mirrors the pockets of rural deprivation in these otherwise affluent regions identified by the Countryside Agency (2000). Key aspects of individual regions of the UK are profiled below (comparisons are internal to the RABI and ARC-Addington data sets). Recommendations for further research Possible avenues of further enquiry include the following. • Further analysis of the existing sample in order to examine the relationship between assets and debt and between key variables and farm area and farm business size, and to identify those recipients that appear in both data sets. • Examining a wider range of other survey and census data to address with greater precision the extent to which recipients are indicative of a larger community. • Drawing a larger sample of RABI recipients who applied using the second, more detailed, version of the form in order to provide a more robust account of certain aspects of farm business and household finances. • A postal, telephone or interview survey of a sub-sample of recipients to establish, more precisely, the condition of recipients’ farm businesses and their wider financial circumstances. • Follow-up enquiries to establish how grants were spent, whether or not recipients felt they made a significant impact on their circumstances, and the present state of recipients. • Further research to validate the (tentative) conclusion that many recipients qualify for certain state benefits, but are not claiming them. viii Contents Preamble .........................................................................................................................................ii Executive Summary .......................................................................................................................iv Introduction.....................................................................................................................................2 FMD 2001...................................................................................................................................2 Helping farming families ............................................................................................................2 Unique insight.............................................................................................................................2 Tip of the iceberg? ......................................................................................................................2 Rationale for investigation..........................................................................................................3 Objective .........................................................................................................................................3 Analysis ..........................................................................................................................................3 Grant recipients...........................................................................................................................3 The data.......................................................................................................................................4 Samples .......................................................................................................................................5 Data extraction and calculation of statistics ...............................................................................5 Regional distribution of recipients..................................................................................................6 Family characteristics .....................................................................................................................8 Household finances.........................................................................................................................9 Off-farm income .........................................................................................................................9 State benefits............................................................................................................................. 11 Savings and investments ...........................................................................................................12 Farm structure ...............................................................................................................................13 Farm area ..................................................................................................................................13 Tenure .......................................................................................................................................14 Farm business................................................................................................................................15 Farming income ........................................................................................................................15 Overdrafts .................................................................................................................................16 External liabilities .....................................................................................................................16 Comparisons with farming population as a whole....................................................................17 Farm debt in relation to farm area ............................................................................................18 Applying for other grants..............................................................................................................19 Conclusions...................................................................................................................................19 Characteristics of grant recipients.............................................................................................19 Regional effects ........................................................................................................................21 Recommendations for further research.........................................................................................25 Further analysis.........................................................................................................................25 Increasing the sample................................................................................................................25 Filling the gaps..........................................................................................................................25 Validation and follow-up ..........................................................................................................25 References.....................................................................................................................................27 Appendix.......................................................................................................................................29 Supplementary tables ................................................................................................................29 RABI application form – Version 1 ..........................................................................................31 RABI application form – Version 2 ..........................................................................................35 RABI application form – Version 3 ..........................................................................................36 ARC-Addington application form ............................................................................................42 Introduction FMD 2001 On the 19th of February 2001, a case of foot-and-mouth disease (FMD) was clinically diagnosed at an abattoir near Brentwood, Essex, and confirmed by laboratory tests on the following day. This marked the start of an epidemic that ran for more than seven months, and spread to 32 counties of Great Britain and to Northern Ireland. More than six million livestock were slaughtered on clinical evidence of infection, on ‘suspicion’, as a precautionary measure or under the livestock welfare disposal scheme (LWDS) (DEFRA, 2002a, 2002b). The cull directly affected 9,867 farms (DEFRA, 2002a, 2002c), equivalent to 7.7% of UK livestock holdings and 4.1% of all UK holdings1. However, the strict controls on the movement of animals and the prevention or delaying of sales impacted much more widely,2 affecting nearly all livestock businesses and bringing some into severe financial crisis. Helping farming families The Royal Agricultural Benevolent Institution (RABI) and the ARC-Addington Fund (ARCAddington) have offered financial assistance to farming households experiencing hardship as a result of the epidemic. By January 2002, RABI had helped more than 8,130 families (a number with multiple grants), while by early February 2002, the ARC-Addington Fund had made 21,403 grants to 11,706 recipients. The two charities between them have disbursed nearly £20 million to more than 15,000 families. The remits of the two donors are complementary. RABI provides assistance with domestic bills; ARC-Addington has a wider remit and assists businesses, and is, hence, able to help in situations where RABI cannot. The Farm Crisis Network (FCN) and the Rural Stress Information Network (RSIN) have not only assisted applicants to access grants, but also supported many others affected by the crisis. Unique insight The RABI and ARC-Addington application forms, together with the knowledge and experience of the support organisations’ personnel, provide a unique insight into the characteristics and condition of a part of the farming community. Early indications were that most of those helped by both RABI and ARC-Addington had already exhausted all other sources of finance and credit and a majority were tenants, while a preliminary analysis of a sample of ARC-Addington recipients revealed a preponderance of small farms (ie of less that 40 ha) and a low level of diversification (ARC-Addington Fund, 2001). Tip of the iceberg? These families represent the main client group of both the grant awarding and farmer support charities. It is possible, also, that they are themselves representative of a larger population of farming families, farming at the margins of viability or in severe domestic debt, but yet to ‘break 1 This refers to the total “number of premises recorded on which livestock have been or were due to be slaughtered” on the 13th January 2002. The number of ‘infected premises’ totalled 2030 (equivalent to 1.6% of UK livestock holdings and 0.85% of all holdings) (DEFRA, 2002a, 2002c). The number of registered holdings tends to under-estimate the number of farm businesses (Burrell et al, 1990), suggesting that the number of farms affected was in excess of 5% of all UK farms and more than 10% of predominantly livestock farms. 2 Problems arising from the FMD epidemic noted by applicants to the RABI additional feed and fertiliser costs; increased travel costs (ie to distant livestock); lower or no income from sales of livestock; reduced or nil income from off-farm work (eg due to Form D restrictions); and increased livestock mortality (eg due to foxes). 2 cover’. Many, if not most, of these are unlikely to belong to any farming organisation; many are, in effect, voiceless and unrepresented. Were it not for the activities of voluntary organisations they would be largely unnoticed and unknown. Rationale for investigation In view of the above, and in order both to guide their own future strategies and to inform farming organisations and government, ARC-Addington, FCN, RABI and RSIN commissioned a study of the characteristics and condition of recipients of RABI and ARC-Addington grants during the 2001 FMD epidemic. This document reports the results of that investigation. Objective The objective of the study was to analyse and provide an account of the characteristics and condition of recipients of RABI and ARC-Addington grants during the FMD epidemic, using the information contained in samples of application forms. The analysis examined regional variation and, where possible, made comparisons between grant recipients and the farming population as a whole. In the light of the results of the analysis, the study also aimed to establish the need and scope for further analysis of the participant organisations' data, and for further data collection. By increasing awareness and understanding of their main client groups, it was anticipated that the work would inform and influence many aspects of the future strategy of the four charities. Although not a specific objective of this study, the study also provided for ARC-Addington and RABI, in effect, a retrospective evaluation and critique of their application and data management procedures, and a stimulus to future ‘streamlining’. Along with the practical experience of the charities, the analysis also provided a basis on which to inform and make recommendations to farming organisations, other voluntary bodies and government. Analysis Grant recipients The analysis focused on those families that had received grants from RABI and ARC-Addington during the FMD epidemic. RABI awarded grants to applicants in England, Wales and Northern Ireland3. ARC-Addington awards grants to applicants in all four countries of the UK. The value of individual RABI grants ranged from £100 to £2,250; individual ARC-Addington grants ranged from £50 to £2,000. RABI awards grants on the following criteria: farming the main source of income, genuine financial hardship, savings less than £8,000, proof of unpaid domestic bills or standing orders, and verification by nominated referee. ARC-Addington’s charitable object is “the relief of poverty suffered by those employed in the agricultural and kindred industries brought about by the effects of the foot-and-mouth disease epidemic” (ARC-Addington Fund, 2000). While the 3 RABI’s counterpart in Scotland is the Royal Scottish Agricultural Benevolent Institution (RSABI), but this organisation was not part of the sponsoring group for this study. 3 majority were farming families, ARC-Addington recipients also included relief milkers, stone wallers, milking machine engineers, agricultural mechanics, craft workers and those running small rural businesses (eg B&B, livery stables, rural crafts). The populations of grant recipients are the result of a process of application and award - of applicants’ decisions to apply and the charities’ assessors’ decisions to award, in accordance with its charitable objects, as above. In both cases, very few applications were rejected (some 5% of RABI and less than 1% of ARCAddington applications were turned down), suggesting that the vast majority of applicants were cases of legitimate need in accordance with the donors’ criteria. Some 62% of RABI recipients received more than one grant; ARC-Addington recipients each received an average of 1.8 grants.4 The data The data that provided the basis of the analysis were contained in the donors’ grant application forms (see Appendix). These forms were not designed for research, but to provide a basis for assessing need and delivering help in an objective and accountable way. Some questions were formulated somewhat imprecisely (eg regarding farm income). From a research viewpoint, however, the main problem was not so much the design of the forms, but the fact that they were not always fully completed. Neither donor imposed any requirement to complete forms in full, and in many cases, answers to some questions were simply left blank. This is more significant for this investigation than for the charities’ assessments of need, as decisions to award grants were informed not only by the data supplied in the application forms, but also by applicants’ written statements, referees’ reports and, in some cases, further enquiries. As this study only investigated grant recipients, these checks help to justify the assumption made throughout that all forms sampled were completed correctly and truthfully. No other checks on veracity were feasible. There does remain, however, the possibility that certain questions may have been left blank if it was perceived that answering them would not help the applicant’s case. In the case of yes/no answers (see below), where the sample consists of the total of those who answer either yes or no, this would result in a biased sample. Despite these shortcomings, however, it was considered that both sets of forms contained sufficient objective and quantitative data to enable a meaningful analysis. The RABI form was relatively detailed compared to the ARC-Addington form. Further, partway through the epidemic, RABI updated its application form incorporating a number of additional questions. The relatively simple form used by ARC-Addington reflected the great reliance placed by the charity on referees’ reports. Copies of the application forms are appended to this report. From these forms, a number of variables were extracted and analysed. 4 A number of recipients received grants from both donors, but it was not possible to establish how many there were in total or to identify which recipients appeared in both the RABI and ARC-Addington samples. 4 Samples Samples were drawn from those who had received RABI and ARC-Addington grants between the start of the FMD epidemic and the end of August 2001. The ARC-Addington sample was later updated on the 17th October, and this sample formed the basis of the analysis. It was not, however, possible to update the RABI sample. Samples were drawn from randomised lists of recipients for Scotland, Wales, Northern Ireland and each region of England. For each region a target of between 5% and 10% of the regional total was set, with a target minimum of 30 per region. As a sample of ARC-Addington recipients had already been drawn and analysed for some regions (ARC-Addington Fund, 2001), these new records were appended to earlier records. The samples represented, overall, 7% and 9.4% respectively of the RABI and ARC-Addington grant recipient populations of 7,710 and 10,923, but there was considerable variation between regions, mostly reflecting the effect of the 30-recipient minimum on regions with few recipients (see Appendix, Tables A1 & A2). As not all questions set on later RABI forms appeared on the earlier version and as not all forms were completed in full, the sample sizes for individual variables were smaller, in some cases considerably smaller, than the overall number of recipients sampled (Appendix, Tables A3 & A4). Data extraction and calculation of statistics Variables were extracted from application forms to Excel workbooks. Variables were either binary (ie Yes or No) or numerical values (eg years, £, ha). For the former, the proportions in each category within each region were calculated. For the quantitative variables, various statistics were derived, notably means, lower and upper quartiles5 and 95% confidence intervals6. In most cases, means for England and the UK were derived from regional means, weighted according to regional recipient populations. For variables with very small sample sizes, however, means were unweighted. Differences between regions were explored by comparisons of means and confidence intervals, and, for some quantitative variables, via analysis of variance. Differences were considered ‘significant’ if the confidence coefficient was more than 95% (P<0.05) (ie there was a less than 1 in 20 chance that a difference as large as that observed could have occurred by chance if there was really no true difference). Comparisons with the farming population as whole were made, where possible, using published data mostly derived from the June Agricultural Census or the 5 Lower and upper quartile values define the range in which falls the middle 50% of all observations. Confidence intervals provide a measure of how precise an estimated effect is – in this case providing an indication of how much confidence that can be placed in the sample mean as an indication of the population mean. The 95% confidence interval is the range computed from the sample data which, were the study repeated multiple times, would contain the true effect (ie the population mean) 95% of the time (ACP/ASIM, 2002; NIST/SEMATECH, 2002). Other statistics calculated in the process of analysis included: median, minimum, maximum, skewness and standard deviation. 6 5 Farm Business Survey. In both cases, correlation coefficients7 were used to explore the relationships between certain variables. Regional distribution of recipients The regional distribution of grant recipients was strongly related to the regional distribution of livestock farms. Highest concentrations were in the North West, the South West, Wales and Northern Ireland (Tables 1 & 2). Coefficients of correlation between regional RABI and ARC-Addington recipient numbers and numbers of livestock holdings8 were 0.92 and 0.66 respectively (comparable values for recipients against numbers of all holdings were 0.72 and 0.54). The distribution of recipients was also positively, though more weakly, related to the regional distribution of FMD cases. Correlation coefficients between regional recipient numbers and FMD cases were 0.37 and 0.48 for RABI and ARC-Addington recipients respectively. The relative weakness of the correlation is explained largely by the high ratio of recipients to FMD cases in regions with relatively low FMD case loads – the East Midlands, the South East, Wales and, most notably, Northern Ireland (Tables 1 & 2). This suggests that the distribution of grant recipients related not so much to the occurrence of FMD, but to the measures to control it (most notably livestock movement restrictions). The former was concentrated in certain regions; the latter were applied across the country. Table 1 Numbers of recipients of RABI grants in relation to holding numbers and FMD cases, by region Region East Midlands East North East North West South East South West West Midlands Yorkshire & the Humber England Wales Northern Ireland UK Number of recipients 230 61 332 1329 128 1322 666 344 4412 1641 1657 7710 As % livestock holdings (1999) 4.49 2.29 12.40 12.15 1.97 6.69 7.16 5.10 6.93 7.95 6.02 6.89 As % all holdings (1999) 1.46 0.36 6.29 7.55 0.66 3.59 3.48 2.12 3.00 5.86 5.32 3.74 FMD Cases 15 11 191 962 7 270 130 140 1726 113 4 1843 Recipients: Cases 15.3 5.5 1.7 1.4 18.3 4.9 5.1 2.5 2.6 14.5 414.3 4.2 Sources: DEFRA (2002d, 2002e). 7 The correlation coefficient is a statistical measure of the extent to which two series of numbers move together. It is defined such that it always varies between +1 (moving perfectly together) and -1 (moving perfectly inversely to one another). A value of zero means that there is no tendency to move either together or in opposite directions (Lexecon, 1994). 8 Ie ‘dairy’, ‘cattle and sheep’ and ‘pigs and poultry’ holdings. 6 Recipient numbers were negatively, though very weakly, correlated with average national ranks of the Index of Multiple Deprivation 2000 (IMD 2000)9 for the rural wards within each region of England. Correlation coefficients were -0.21 and -0.20 for RABI and ARC-Addington recipients respectively. The IMD 2000 enables wards to be ranked according to their levels of deprivation, with the most deprived ward in England having a rank of 1 and the least deprived ranked at 8,414. Hence, the existence of a negative, be it a weak, correlation suggests that the distribution of grant recipients reflects, at least in part, the wider pattern of rural deprivation. Table 2 Numbers of recipients of ARC-Addington Fund grants in relation to holding numbers and FMD cases, by region Region East Midlands East North East North West South East South West West Midlands Yorkshire & the Humber England Wales Scotland Northern Ireland UK Number of recipients 292 97 398 1932 125 2478 991 581 6894 2439 440 1150 10923 As % livestock holdings (1999) 5.71 3.65 14.86 17.66 1.93 12.53 10.66 8.62 10.82 11.81 2.77 4.18 8.55 As % all holdings (1999) 1.86 0.57 7.54 10.97 0.65 6.72 5.17 3.59 4.68 8.71 1.32 3.69 4.56 FMD cases 15 11 191 962 7 270 130 140 1712 113 187 4 2016 Recipients: Cases 19 9 2 2 18 9 8 4 4 22 2 288 5 Sources: DEFRA (2002d, 2002e). RABI recipients represented 3.7% and ARC-Addington recipients 4.6% of all holdings in the UK, but the proportions were higher in the North West (7.6% & 10.9%), the North East (6.29% & 7.54%), Wales (5.86% & 8.71%), Northern Ireland (5.32% & 3.69%) and the South West (3.59% & 6.72%) (Tables 1 & 2). As some recipients received grants from both RABI and ARCAddington, the total number of recipients is somewhere between the larger number and the sum of the two. Given this, and the fact that holding numbers tend to over-represent the numbers of farm businesses, it seems likely that in some regions more than 10% (and perhaps as many as 15%) of all farms were in receipt of grants. 9 The Index of Multiple Deprivation 2000 is constructed from six separate indices reflecting different aspects of deprivation (ie income, employment, health deprivation and disability, education, skills and training, housing and geographical access to services) (Countryside Agency, 2000). 7 Family characteristics Analysis of recipients’ family characteristics suggests that many of those in receipt of grants were younger families with children at home. This is not, perhaps, too surprising. Families with children are likely to feel financial pressures more quickly; while concern for one’s children may overcome ‘pride’ and an unwillingness to accept ‘charity’. Some 30% of ARC-Addington recipients had children of primary school age (Table 3), while RABI recipients had an average of 2.15 dependent children (Table 4) and households averaging 3.53. There were no significant regional differences in household size, but there were significant regional differences in the numbers of dependent children. The average number of dependent children was significantly higher in Northern Ireland than in Yorkshire and the Humber, and significantly lower in Yorkshire and the Humber compared with Northern Ireland, the West Midlands, the North West and Wales (Table 4). RABI recipients averaged 48.4 years old. Regional averages ranged from 45.6 years in the West Midlands and 45.7 in Yorkshire and the Humber to 52.1 in Northern Ireland and 52.3 in the South East, but analysis of variance revealed no significant regional effects. The EC Farm Structure Survey estimated the average age of holders of main holdings in the UK in 1997 at 53 years (House of Commons, 2000); Farmers’ Weekly (2001) stated that the average age of UK farmers was 58 years; while according to NFU (2000), the average age of Britain’s tenant farmers was 58 years. While grant recipients were not necessarily the main holders or principal farmers, these data suggest that RABI recipients were, on average, younger than UK farmers as a whole. In the case of ARC-Addington recipients, although nearly 35% had children of primary school age, some 13% overall were of pensionable age, with the proportion increasing to more than 18% in the South West and nearly 25% in the North West (Table 3). Just under 3% of RABI recipients in the UK were over 65 years, ranging from 0% in Northern Ireland, 2% in the South West and the West Midlands, and 3% in the North West to 10% in Wales, 13% on the North East, 22% in Yorkshire and the Humber, and 27% in the South East.10 This suggests that, particularly in some regions, there are appreciable numbers of farmers of retirement age who are still farming. 10 The apparent difference in the age profiles of RABI and ARC-Addington recipients may be partly explained by the donors respective emphases on helping with domestic bills and assisting farm businesses. Hence, RABI is likely to have attracted younger families with children concerned with immediate domestic needs; ARC-Addington is likely to have drawn older farmers struggling to maintain their businesses. 8 Table 3 Estimated age categories of recipients of ARC-Addington grants, by region Region % undefined % pensionable % primary11 East Midlands 61.3 3.2 35.5 East 70 3.3 26.7 North East 60 5 35 North West 44.7 24.6 30.7 South East 63.3 3.3 33.3 South West 43.1 18.2 38.7 West Midlands 74.2 3.4 21.3 Yorkshire & the Humber 59.6 5.8 34.6 51.9 14.9 33.0 England 46.8 11.4 40.9 Wales 57.5 7.5 30 Scotland 57.7 8.7 32.7 Northern Ireland UK 51.6 13.2 34.6 Table 4 Average numbers of dependent children of recipients of RABI grants, by region Region East Midlands East North East North West South East South West West Midlands Yorkshire & the Humber England Wales Northern Ireland UK Mean 1.78 1.56 1.80 2.16 1.61 1.92 2.31 1.27 1.97 2.05 2.71 2.15 95% CI 1.29 2.27 1.03 2.10 1.39 2.21 1.83 2.48 1.08 2.14 1.62 2.22 1.91 2.72 0.86 1.68 1.79 2.07 2.31 3.36 Household finances Off-farm income The proportion of the total income of farming families derived from farming has decreased over the last few years, and many are increasingly dependent on off-farm income (MAFF, 1999). An estimated 58% of RABI recipients stated they had income other than from farming, with the proportions lowest in Northern Ireland (31%) and the East of England (38%) and highest in the North West (85%)12 (Table 5). The average proportions of RABI recipients receiving off-farm income in England (65%) and Wales (52%) were higher than the corresponding values of 52% and 47% for farmers (and spouses) derived from the Farm 11 The proportion of recipients with children of primary school age. As with all findings derived from yes/no answers, these results need to be treated with some caution. As the proportion returning a no or yes value represents one observation per region, the statistical significance between regions cannot be tested. Also, as stated earlier, the possibility of selective answering cannot be totally excluded. 12 9 Business Survey (FBS) for 1999/00 (DEFRA, 2002f). But, the proportion of RABI recipients with off-farm income in Northern Ireland (31%) was much lower than the FBS value of 58%. Stated weekly amounts for RABI recipients with other income averaged £141; there were no significant regional differences. Estimated average weekly amount for all recipients (ie including those who stated they had no other income) was £81, ranging from £46 in Northern Ireland to £119 in the North West (Table 5). Values, based on the FBS (DEFRA, 2002f), for average offfarm income for all types of farm approximate to £88 per week in England, Wales and Northern Ireland (Table 6). Corresponding values for RABI recipients were £99, £66 and £46. This suggests that in England off-farm incomes of grant recipients were, on average, higher than the estimated national average, but in Wales, and, especially, Northern Ireland, they were markedly lower13 (Tables 5 & 6). The low level of average income from farming on farms in Northern Ireland (Table 6) combined with the low proportion of RABI recipients with off-farm income and its relatively low value suggests that the situation of the RABI/ARC-Addington client group in Northern Ireland may be particularly critical. Table 5 Proportions of recipients of RABI grants stating that they had income other than from farming14 and estimated weekly amounts15, by region Region East Midlands East North East North West South East South West West Midlands Yorkshire & the Humber England Wales Northern Ireland UK With other income (%) 67 38 65 85 67 66 59 59 65 52 31 58 Weekly amount (£) Mean 79 59 72 119 92 95 98 86 99 66 46 81 13 Lower quartile Upper quartile 38 102 26 85 36 98 60 128 45 133 40 111 47 118 48 119 47 117 33 84 30 60 40 97 FBS values include state benefits. RABI recipients were asked simply to state ‘earned or unearned income’ and there answers may or may not include state benefits. That they were also asked to declare whether they were in receipt of state benefits (and in the later version of the form state the amounts) may have prompted some to exclude state benefits from their stated off-farm income. 14 Ie. the number of recipients answering ‘yes’ as a percentage of the total of those replying ‘yes’ or ‘no’ to the question “do you or your spouse/partner have any other earned or unearned income apart from the farm business?”. The proportion of recipients sampled within each region who answered the question at all ranged from 36% to 97% , while the proportion stating the amount ranged from 15% to 48%. 15 The means and quartiles for the population estimated from stated weekly amounts and implied weekly amounts (ie £0 for those stating they had no ‘other income’), adjusted for variations in rates of response to the two questions. 10 Table 6 Average net farm income and off-farm income16 for all types of farm according to the Farm Business Survey, by country, 1999/00 Country Occupier's net income and other farm income (£ per week) England Wales Northern Ireland 183 129 6 Off-farm income (£ per week) Total Employment and self-employment 88 52 88 58 88 65 Investment, pensions and other 48 25 23 Source: DEFRA (2002f) The most commonly stated source of off-farm income was spouse/partner’s employment, followed by applicant’s employment (Table 7). Table 7 Stated sources of income other than from farming of recipients of RABI grants Source Number stating source Spouse/partner's employment 66 Applicant's employment 55 Property rent 5 Other 5 Contracting 4 Investments 1 Land rent 0 Non-agricultural enterprise 0 State benefits The average proportions of RABI recipients in receipt of child benefit (57%) and state pension (22%) (Table 8) broadly reflects the preponderance of younger families with dependent children among the recipient population, as discussed earlier. However, the average proportion of recipients in receipt of child benefit is negatively, though weakly (-0.22), correlated with the average number of dependent children. The weakness of the correlations arises from two outliers (the North West and Yorkshire & The Humber) – removing these increases the correlation coefficient to -0.95. Although the two variables are not directly related (ie only one child is necessary to claim child benefit), this is still a somewhat anomalous result, and merits further investigation. The proportion in receipt of working families tax credit averaged 29%, ranging from 12% in Northern Ireland to 70% in the North West (Table 8). Given that grant recipients are, by 16 Published annual values converted to weekly incomes by dividing by 52. 11 definition, those suffering domestic financial hardship, it can be tentatively concluded that some, perhaps many, farming families that may qualify for working families tax credit may not be taking it up, a conclusion backed by anecdotal evidence from the experience of caring organisations. Table 8 Proportions17 of recipients of RABI grants in receipt of state benefits18, by region Region East Midlands East North East North West South East South West West Midlands Yorkshire & the Humber England Wales Northern Ireland UK Recipients in receipt of state benefits (%) Working families tax credit Child benefit State pension Other state benefit 43 71 44 38 31 67 38 42 12 65 18 27 70 84 67 55 36 69 27 18 40 63 16 20 23 53 13 8 16 38 9 13 42 67 32 30 29 57 21 11 12 31 16 16 33 57 26 23 Savings and investments Many grant recipients appear to have very limited domestic financial back up. The proportions of RABI recipients stating that they had savings and investments averaged 46%, and ranged from 4% in Northern Ireland to 81% in the North West. The stated values of savings of those who had savings averaged £4,455 and ranged from £1,757 in the South East to £11,120 in the North East, although no regional differences were significant. Estimated savings for all recipients averaged £1,594, ranging from £259 in Northern Ireland to £4,325 in the North East (Table 9). The stated value of outstanding household bills of RABI recipients in England and Wales averaged £1,796 (Table 10). This is slightly greater than the estimated average value of savings 17 Ie. the number of recipients answering ‘yes’ as a percentage of the total of those replying ‘yes’ or ‘no’ to the question “are you in receipt of state benefits’, followed by the four categories of benefit (earlier RABI forms) or those supplying weekly amounts against categories of state benefits (later RABI forms). The proportion of recipients sampled within each region who answered the questions at all ranged from 15% to 97% . The proportions stating the amount were much lower as this question was only asked on the later version of the RABI form. As with all findings derived from yes/no answers, these results need to be treated with some caution. As the proportion returning a no or yes value represents one observation per region, the statistical significance between regions cannot be tested. Also, as stated earlier, the possibility of selective answering cannot be totally excluded. This is borne out by comparison of the high proportions of RABI recipients in receipt of state pension with the relatively small proportions of over 60s and over 65s evident from examining age profiles. 18 A question about the amount of state benefits was only asked on the later version of the RABI form, so the sample sizes are small. Average stated weekly amounts of working families tax credit ranged from £72 to £134, child benefit from £28 to £70, state pension from £68 to £142 and other state benefits from £34 to £116. 12 and investments, but such a comparison of averages is of limited value in establishing the condition of individuals.19 Table 9 RABI recipients stating that they had savings/investments20, and stated and estimated values, by region Region Proportion (%) with savings and investments East Midlands East North East North West South East South West West Midlands Yorkshire & the Humber England Wales Northern Ireland UK Stated value (£) Estimated value (£) (all (recipients with savings) recipients)21 Mean Maximum22 Mean 4,821 25,000 3,045 2,927 20,000 1,722 11,120 30,000 4,325 2,374 5,881 1,918 1,757 5,000 769 3,330 25,000 1,742 2,081 9,000 1,334 5,069 20,000 2,611 3,602 30,000 2,035 4,581 16,000 1,756 6,600 6,600 259 4,455 30,000 1,594 63 59 39 81 44 52 64 52 57 38 4 46 Table 10 Stated value of outstanding household bills of recipients of RABI grants, EW England Wales EW Sample 41 7 48 Mean 1,911 1,121 1,796 Minimum 48 177 48 Maximum 14,294 3,200 14,294 Farm structure Farm area The average areas farmed by RABI and ARC-Addington recipients were 77 ha and 80 ha respectively (Table 11). There was considerable variation both within and between regions. As 19 Information about the value of household debts was only requested in the later RABI form, and the sample size is small. Recipient by recipient analysis was not attempted. 20 Ie. the number of recipients answering ‘yes’ as a percentage of the total of those replying ‘yes’ or ‘no’ to the question “do you or your partner have any savings or investments” (earlier RABI forms) or those supplying weekly amounts against categories of savings (later RABI forms). The proportion of recipients sampled within each region who answered the questions at all ranged from 2% to 28% . The proportions stating the amount were much lower, ranging from 1% to 15% , as this question was only asked explicitly on the later version of the RABI form. As with all findings derived from yes/no answers, these results need to be treated with some caution. As the proportion returning a no or yes value represents one observation per region, the statistical significance between regions cannot be tested. Also, as stated earlier, the possibility of selective answering cannot be totally excluded. 21 Estimated from stated weekly amounts and implied weekly amounts (ie £0 for those stating they had no savings and investments), adjusted for variations in rates of response to the two questions. 22 The stated minimum in all cases was zero. 13 might be expected, analysis of variance revealed a significant effect of region on area farmed, with significant differences between some, but not all regions.23 Areas farmed by both RABI and ARC-Addington recipients were similar to or greater than average holding sizes in most regions, and in the UK as a whole. Such comparisons, however, are of limited value, as holding sizes tend to under-estimate farm sizes (Burrell et al, 1990), and June Census holding sizes are averages for all types of farm, while recipients were livestock farmers. Table 11 Average holding size according to June Census 1999, and total area (ha) farmed by recipients of RABI and ARC-Addington grants, by region Region June Census RABI recipients 1999 Mean Mean Lower quartile East Midlands 22 78 65 East 14 86 117 North East 37 109 114 North West 49 50 133 South East 31 62 51 South West 24 49 69 West Midlands 23 49 55 Yorkshire & the Humber 26 67 110 32 England 62 92 32 Wales 53 77 N/A N/A Scotland 156 23 Northern Ireland 34 39 30 UK 71 77 ARC-Addington recipients Upper quartile 108 77 132 121 60 81 65 98 96 93 N/A 49 86 Mean 74 116 103 109 72 66 57 112 101 82 406 36 80 Lower quartile 26 8 33 49 23 28 23 23 33 37 66 18 34 Upper quartile 106 57 124 121 93 81 71 142 99 97 617 47 114 Source: DEFRA (2002i) Tenure Comparison of proportions of owned and tenanted land on RABI and ARC-Addington recipients’ farms with national averages (Table 12), and examination of data on their stated tenure (Table 13), suggest that there is a higher proportion of wholly tenanted and mixedtenure farms among grant recipients than in the regions and countries of the UK as a whole. 23 RABI recipients’ farms in Northern Ireland were significantly smaller than they were in Wales, Yorkshire and the Humber, the South West, the North West and the North East; in addition, recipients’ farms in Yorkshire and the Humber were significantly larger than farms in the West Midlands, while recipients’ farms in the North West and the North East were significantly larger than farms in the South East and the West Midlands. Farms of ARCAddington recipients in Scotland were significantly larger than farms in all other regions, except the East of England; farms in Northern Ireland were significantly smaller than farms in Wales, Yorkshire and the Humber, the North East and the North West, and farms in the North West were significantly larger than farms in the West Midlands. 14 Table 12 Comparison of estimated proportions of owned and rented land farmed by recipients of RABI and ARC-Addington grants with proportions for all farms, by region Region RABI recipients ARC-Addington recipients All farms (2000)24 Owned (%) Rented (%) Owned (%) Rented (%) Owned (%) Rented (%) East Midlands East North East North West South East South West West Midlands Yorkshire & the Humber England Wales Scotland Northern Ireland UK 45 26 47 37 39 54 55 29 42 63 N/A 69 50 55 74 53 63 61 46 45 71 58 37 N/A 31 50 23 19 46 51 19 52 43 23 45 68 17 65 45 78 81 54 49 81 48 57 77 55 32 83 35 55 63 68 48 62 68 69 70 63 66 78 N/A N/A N/A 37 32 52 38 32 31 30 37 34 22 N/A N/A N/A Source: DEFRA (2002g) Table 13 Stated tenure of farms of recipients of RABI grants, by region Region East Midlands East North East North West South East South West West Midlands Yorkshire & the Humber England Wales Northern Ireland UK Wholly owned (%) 28 33 41 51 36 30 47 16 37 34 46 37 Wholly rented (%) Mixed tenure (%) 38 34 48 19 41 19 27 23 43 21 27 42 31 22 66 19 36 27 20 46 0 54 29 33 Farm business Farming income Farming income has declined steadily since the 1970s. In 2000, at £1.88 billion, total income from farming (TIFF) in the UK reached its lowest level for more than 25 years (DEFRA, 2002h; Countryside Agency, 2001). Estimated average farming income per head in the same year was £7,800 (Countryside Agency, 2001). It might be expected that RABI and ARC-Addington 24 Based on analysis of the June Census 2000 (DEFRA, 2002g). Data appear only to be available in this form for England and Wales. 15 recipients would fall into the lowest farm-income categories. However, it was not possible to draw any conclusions from the data available due to the small sample sizes and the way in which the data were collected. Questions about farming income and subsidies were only asked in the later version of the RABI form, and the former was framed in terms of income from sales of grain, livestock, milk and machinery. Stated average income in these terms was £107,058, ranging from £0 to £2,053,790. Subsidies averaged £10,514 and ranged from £0 to £102,491. Table 14 Total overdraft in farm business account25 and limit of overdraft facility declared by RABI recipients, by region Region East Midlands East North East North West South East South West West Midlands Yorkshire & the Humber England Wales Northern Ireland UK Overdraft (£) 23,476 30,295 65,109 27,406 7,781 21,117 17,542 35,641 26,777 26,389 13,336 23,806 Stated total overdraft facility (£) Mean Lower quartile Upper quartile 25,359 775 32,500 37,758 1,000 45,250 71,946 9,000 95,000 54,341 13,000 50,000 12,122 1,300 13,500 30,317 6,500 37,625 31,983 2,875 36,250 36,558 188 31,750 40,741 41,503 12,033 34,733 7,081 5,250 500 5,277 44,143 60,000 15,500 41,362 Overdrafts The stated overdraft in the farm business account of RABI recipients averaged nearly £24,000, ranging from £7,781 in the South East to £65,109 in the North East (Table 14). There was a great deal of variation between individual recipients, with the stated condition of farm business accounts ranging from an overdraft of £790,000 to a small credit, but there were no significant differences between regions. In most cases regional average overdrafts were lower than the average stated limits of recipients’ overdraft facilities (although such a comparison is only a weak indicator of the state of individual recipients). Average stated overdraft facility was significantly lower in Northern Ireland than in Wales, the West Midlands, the South West, the North West and the North East, while that in the South East was significantly lower than in Wales, the South West and the North West. There were positive correlations between regional average area farmed and regional average overdraft (0.69) and overdraft facility (0.80). External liabilities Stated total farm business liabilities averaged £135,837 among RABI recipients and stated total debt among ARC-Addington recipients averaged £57,452 (Tables 15 & 16) (although the questions were worded differently and may not, therefore, be equivalent). Total debt of ARCAddington recipients was significantly lower in Northern Ireland compared with Scotland, 25 Response to the question ‘how much money is there in the farm business account?’. 16 Wales, the South West and the North West, significantly higher in the North West than in the West Midlands, and Yorkshire and the Humber, and in the South West than in Yorkshire and the Humber. Regional average total farm debt of ARC-Addington recipients was positively, though weakly correlated (0.30) with regional average area farmed. This suggests that total farm business liabilities are less closely related to farm size than overdrafts. As bank lending is related to assets, a close correlation between overdraft facility and overdrafts is to be expected. The weaker relationship between total liabilities and farmed area suggests that for some, nonbank debt has extended beyond the value of assets. Table 15 Total farm business liabilities as declared by recipients of RABI grants, by country Country Sample Mean Minimum Maximum England 46 117,907 1,500 1,909,000 Wales 9 257,329 373 1,950,000 Northern Ireland 2 1,500 1,000 2,000 UK 57 135,837 373 1,909,000 Table 16 Stated value of total debt of ARC-Addington grant recipients, by region Region East Midlands East North East North West South East South West West Midlands Yorkshire & the Humber England Wales Scotland Northern Ireland UK Value of total debt (£) Mean Lower quartile 46,654 19,000 41,767 5,750 110,678 1,000 74,251 5,000 53,509 6,625 59,649 5,600 41,145 7,283 28,221 2,773 60,465 5,758 62,719 9,000 71,973 9,750 22,661 1,008 57,452 6,143 Upper quartile 52,500 49,400 55,000 92,000 56,000 82,500 45,000 42,500 72,596 88,000 110,000 27,000 72,742 Comparisons with farming population as a whole Comparison of grant recipients’ farm business overdrafts and debts with data derived from the Farm Business Survey 1999/00 (DEFRA, 2002f) revealed a varying pattern. The overall indication was that there was, on average, a higher level of debt among grant recipients than among farmers as a whole, particularly to creditors other than the bank and particularly in certain regions. • At nearly £27,000, the average overdraft among RABI recipients in England was a little higher than the average value of £24,000 for bank borrowings for all types of farm business (DEFRA, 2002f). 17 • • Total external liabilities among RABI recipients in England and Wales were appreciably higher than published averages - £117,907 compared with £83,800 in England, £257,329 compared with £43,900 in Wales (Tables 15 & 17). Total liabilities among ARC-Addington recipients were lower than published averages in England (£60,465 compared with £83,800), very similar in Northern Ireland (£22,661 compared with £22,400), and higher in Wales (£62,719 compared with £43,900) and Scotland (£71,973 compared with £62,700) (Tables 16 & 17). Farm debt in relation to farm area Farm business debt per ha among ARC-Addington recipients averaged £1,057 overall, ranging from £719 in Scotland to £3,588 in the East of England, suggesting at least an approximate relationship to land values (Table 18). Total farm debt was positively, but weakly correlated with farm area (0.39) and debt per ha was negatively, but very weakly, correlated with total farm area (-0.15) (Table 18). In both cases, correlations were markedly stronger in some regions than in others, suggesting that in at least some regions farm debt among grant recipients is most acute on smaller farms. Table 17 Average total external liabilities (£) of farm businesses in the UK, by tenure and country, 1999/00 Owner occupied Tenanted Mixed tenure All types of tenure England 78,100 54,000 110,100 83,800 Wales 41,800 26,800 57,300 43,900 Scotland 72,600 25,800 83,300 62,700 N Ireland 22,400 Source: DEFRA (2002g) Table 18 Declared farm business debt per ha and correlations between stated farm area and total debt and debt per ha of recipients of ARC-Addington grants, by region Region East Midlands East North East North West South East South West Mean debt (£) per ha 1150 3588 812 1047 1202 1404 Total area vs total debt 0.37 0.35 0.79 0.21 0.35 0.51 18 Total area vs debt per ha -0.44 -0.15 0.11 -0.15 -0.25 -0.12 West Midlands Yorkshire & the Humber England Wales Scotland Northern Ireland UK 974 866 1179 944 719 696 1057 0.51 0.32 0.42 0.39 0.16 0.35 0.39 -0.17 -0.24 -0.15 -0.16 -0.35 -0.04 -0.15 Applying for other grants The data enabled some investigation of whether or not farmers had sought help by applying for grants from another donor. Some 25% of RABI recipients stated that they were in receipt of other grants. The proportion varied between regions, from just 11% in Northern Ireland to 39% in Yorkshire and the Humber (Table 19). Table 19 Proportions of recipients of RABI grants declaring that they were in receipt of other grants, by region Region % declaring 'other grants' East Midlands 30 East 22 North East 25 North West 25 South East 18 South West 29 West Midlands 23 Yorkshire & the Humber 39 27 England 25 Wales 11 Northern Ireland UK 25 Conclusions Characteristics of grant recipients Prior to, and during, this study, a number of questions were raised or hypotheses proposed regarding the characteristics of grant recipients. These arose particularly from the direct experience of the sponsoring organisations or from an early analysis of ARC-Addington recipients (ARC-Addington Fund, 2001). These hypotheses are addressed below. Grant recipients are on average older than farmers in general. No. RABI recipients were on average younger than UK farmers as a whole and there was good evidence that many of those in receipt of grants from both RABI and ARC-Addington were 19 younger families with children at home. However, there were also appreciable numbers of recipients of pensionable age, particularly among ARC-Addington recipients and in certain regions, suggesting that many farmers of retirement age who are still farming are experiencing financial hardship. Older farmers are more likely to be tenants. This hypothesis arose from the observation that tenant farmers in particular will continue farming after reaching retirement age as they cannot afford to move to alternative accommodation. Comparisons between age and tenure at regional level provide little evidence for this. This is only a very coarse indicator, however. A case-by-case analysis was not attempted, but could be the subject of further research. Grant recipients were less likely to have off-farm income than farmers in general. This was only true in Northern Ireland where the proportion of RABI recipients stating they had off-farm income (31%) was appreciably lower than the proportion estimated by the FBS (58%). In England and Wales, RABI recipients were more likely to have off-farm income than FBS samples. Grant recipients had lower than average off-farm incomes. This was true in Wales and, particularly, Northern Ireland, where amounts of off-farm income stated by RABI recipients were markedly lower than FBS averages (£46 per week compared with £88 per week). In England the reverse was true, where RABI recipients’ average off-farm income was £99 per week, compared with the FBS value of £88 per week. There are few opportunities for alternative income. The data provided very limited evidence for this. Sources of income other than from farming stated by RABI recipients were almost exclusively the applicant’s or spouse’s employment; none cited non-agricultural enterprises. As RABI recipients were almost exclusively livestock farmers, the differences in both occurrence and value of off-farm incomes between RABI recipients and FBS farmers does seem likely to reflect the paucity of opportunities for off-farm income and/or the difficulties experienced by livestock farmers in taking them up, particularly in certain regions. Similarly, ARC-Addington Fund (2001) noted the very low level of diversification (c 10%) among recipients, and the fragile nature of those enterprises that had been taken up. There is poor uptake of state benefits among grant recipients. The main indication of this study in this respect is the possibility that many farming families that may qualify for working families tax credit are not taking it up. This conclusion is based on comparison of the proportions of RABI recipients stating they were in receipt of this benefit and the level of financial hardship implicit in their being eligible for assistance. Child benefit presents a somewhat anomalous picture, notably in Northern Ireland. As stated earlier, the possibility of selective answering of questions means that conclusions about uptake of state benefits are necessarily tentative. Further investigation is merited. Grant recipients have little domestic financial back up in terms of savings and investments. Yes. RABI recipients appeared to have few savings and investments, although there was much regional variation. Few recipients provided data on the value of household bills, but a national 20 comparison showed household bills as similar to or less than estimated savings. This comparison is of limited value, however, in establishing the situation of individual families. Grant recipients have smaller than average farms. The areas farmed by recipients were on average similar or slightly greater than average holdings sizes in most regions, and appreciably larger in Scotland. However, published data on holding size tends to under-estimate farmed area and also refers to all farm types. Examination of lower and upper quartiles does suggest that recipients farms are clustered towards the smaller end of the range. There are more tenant farmers among grant recipients than in the farming population as a whole. Yes. The analysis pointed to an appreciably higher than average proportion of wholly tenanted and mixed tenure farms among both RABI and ARC-Addington recipients. This was true across all regions. Grant recipients have lower than average farming incomes. The application forms did not provide sufficient data to address this question. A question about farming income was only asked in the later version of the RABI form and in a form that would make comparison with published data difficult. Grant recipients have high bank overdrafts. The average overdraft among RABI recipients in England (£27,000) was a little higher than the average value for bank borrowings for all types of farm business (£24,000). As might be expected overdrafts varied greatly between individual recipients, but were on average lower than stated limits of overdraft facilities. Both overdrafts and overdraft facilities showed a close relationship to farm size. Grant recipients have many debts to creditors other than the bank Yes. The analysis indicated a higher level of debt, on average, among grant recipients than among farmers as a whole, notably to creditors other than the bank. There was, however, appreciable variation, regionally and between the two sets of recipients. External liabilities were less closely related to farm size, suggesting a much weaker relationship between assets and liabilities than is effective through bank borrowing. Farm debt is most acute on smaller farms. Yes. Analysis of debt per unit area among ARC-Addington recipients provided evidence that, at least in some regions, farm debt in relation to farm assets (ie land) is greater on smaller farms. This confirms the conclusion of the earlier analysis of ARC-Addington data (ARC-Addington Fund, 2001). Average debt per ha at regional level followed a pattern that very approximately reflected land values. Regional effects As might be expected, grant recipients were concentrated in the predominantly livestock production regions of the UK - the North West, the South West, Wales, Northern Ireland, and to a lesser extent, the West Midlands. The distribution was less related to the incidence of FMD than to the livestock movement restrictions to control it. The distribution of grant recipients in 21 England also showed some relationship to the wider pattern of rural deprivation, as indicated by the IMD 2000. These factors are, in fact, related, as rural deprivation is higher in regions containing more remote rural areas and, often by association, a predominance of livestock rearing. There were smaller numbers of grant recipients in the East, the South East, Yorkshire and the Humber, the North East and the East Midlands. Livestock production is less frequent in these regions. They are also relatively prosperous, at least the first three. Grant recipients are likely to represent a ‘residue’ of smaller livestock producers, who are also suffering financial hardship. With the exception of the North East, the proportion of tenanted land among grant recipients was higher than average for grant recipients. In some ways, these farmers are likely to be even more ‘hidden’ or ‘forgotten’ than those in western England, Wales and Northern Ireland. This mirrors the pockets of rural deprivation in these otherwise affluent regions identified by the Countryside Agency (2000). The individual regions of the UK are profiled in Tables 20 to 23, in terms of their ranks according to the key characteristics examined in this study (all ranks are in ascending order with the region with the smallest value for the variable ranked 1 and the region with the largest value ranked 10 or 11). 22 Table 20 Rankings of regions according to numbers of grant recipients, and numbers of grant recipients in relation to regional holding numbers Region RABI ARC-Addington Number As % livestock As % all Number of As % livestock As % all recipients holdings (1999) holdings (1999) recipients holdings (1999) holdings (1999) East Midlands East North East North West South East South West West Midlands Yorkshire & the Humber Wales Scotland Northern Ireland 3 1 4 8 2 7 6 5 9 3 2 10 9 1 6 7 4 8 3 1 9 10 2 6 5 4 8 10 5 7 3 1 4 9 2 11 7 6 10 5 8 Table 21 Rankings of regions according to family characteristics RABI %>65 East Midlands East North East North West South East South West West Midlands Yorkshire & The Humber Wales Scotland Northern Ireland 5 6 8 4 10 3 2 9 7 1 ARC-Addington RABI % pensionable age Dependent children 1 2 5 11 2 10 4 6 9 7 8 4 2 5 8 3 6 9 1 7 10 23 5 3 10 11 1 9 7 6 8 2 4 4 1 9 11 2 8 7 5 10 3 6 Table 22 Rankings of regions according to household financial characteristics of RABI recipients Off-farm income % receiving state benefit % with Amount Working families tax credit East Midlands East North East North West South East South West West Midlands Yorkshire & The Humber Wales Northern Ireland 8 2 6 10 8 7 4 4 3 1 5 2 4 10 7 8 9 6 3 1 Child benefit 9 6 1 10 7 8 4 3 5 1 State pension 9 7 6 10 8 5 3 2 4 1 9 8 5 10 7 3 2 1 6 3 Savings and investments Other % with Amount 8 9 7 10 5 6 1 3 2 4 8 7 3 10 4 5 9 5 2 1 7 4 10 3 1 5 2 8 6 9 Table 23 Rankings of regions according to farm structure and farm business characteristics Region East Midlands East North East North West South East South West West Midlands Yorkshire & The Humber Wales Scotland Northern Ireland Farm structure RABI ARC-Addington RABI Area farmed Area farmed % rented land 4 9 8 10 2 5 3 7 6 1 5 10 7 8 4 3 2 9 6 11 1 6 10 5 8 7 4 3 9 2 1 24 Farm business ARC-Addington RABI ARC-Addington ARC-Addington % rented land Overdraft External Debt per ha liabilities 8 9 5 4 9 3 6 7 1 11 2 5 8 10 7 2 4 3 9 6 1 5 4 11 10 6 7 3 2 8 9 1 8 11 3 7 9 10 6 4 5 2 1 Recommendations for further research Further analysis The analysis reported here was constrained by the time and resources available. It was not feasible to follow up every possible line of enquiry. Effort was directed at those characteristics and relationships, analysis of which was mostly likely to yield reliable and relevant results. However, further interrogation of the existing sample would be possible. Areas for consideration might include examining the relationship between assets and debt for individual recipients and a more detailed exploration of similarities and differences between the two data sets. The former would also encompass further study of the relationships between key variables and farm area and farm business size. It may also be possible, though likely to be time consuming, to identify those recipients that appear in both data sets, in order to establish the total number of recipients and derive and analyse a unique sample. Examining a wider range of other survey and census data may enable the characteristics of grant recipients to be related to the wider farming population in more depth. This would help to address with greater precision the extent to which recipients are indicative of a larger community. Increasing the sample The samples drawn and data extracted represent, of course, only a small part of the data available, and a larger sample could be drawn and analysed. A random sample across all recipients of both charities seems unlikely to be of any great value, but a larger sample of RABI recipients who applied using the second, more detailed, version of the form may provide a more robust account of certain aspects of farm business and household finances, which were only included in this latter form. However, it is uncertain whether or not what are likely to be modest findings would merit the costs of such an exercise. Filling the gaps The application forms were not designed for research and left many gaps in accurately profiling the recipient population, most notably in relation to household and farm business financial situations. These gaps would be best filled via a postal and/or telephone questionnaire survey of a sample of recipients, possibly with an interview follow up of a sub-set. A particular aim would be to establish, more precisely, the condition of recipients’ farm businesses, as well as their wider financial circumstances. This exercise could be combined with the validation and follow up work proposed below. Validation and follow-up Some of the key findings of this analysis might be validated as part of a follow-up exercise (possibly combined with the ‘gap plugging’ exercise proposed above). Verification of data and validation of conclusions may be served by a postal or telephone questionnaire survey, again with the possibility of interviewing a subset thereafter. 25 Follow-up enquiries designed to establish how grants were spent, whether or not recipients felt they made a significant impact on their circumstances, and the present state of recipients would enhance greatly the findings of this study as well as further inform the four organisations’ future strategies. A particularly important line of enquiry would be seek to validate the (tentative) conclusion that many recipients qualify for certain state benefits, but are not claiming them. Were this to prove the case, a priority for the charities will be to implement a scheme to raise awareness and provide assistance in claiming state benefits, in collaboration with other agencies. 26 References ACP/ASIM (2002) Effective Clinical Practice. Primer on 95% Confidence Intervals. http://www.acponline.org/journals/ecp/sepoct01/primerci.htm. ARC-Addington Fund (2001) Review: July 2001. Stoneleigh, Warwickshire: The Arthur Rank Centre. Burrell, A; Hill, B & Medland, J (1990) AGRIFACTS. A handbook of UK and EEC agricultural and food statistics. London: Harvester Wheatsheaf. Countryside Agency (2000) The State of the Countryside 2000. Regional reports (8 volumes). Cheltenham: Countryside Agency. Countryside Agency (2001) The State of the Countryside 2001. Cheltenham: Countryside Agency. DEFRA (2002a) Foot and Mouth Disease. Statistics on foot and mouth disease. http://www.defra.gov.uk/footandmouth/cases/statistics/generalstats.asp. DEFRA (2002b) Foot and Mouth Disease. Livestock Welfare (Disposal) Scheme. http://www.defra.gov.uk/footandmouth/cases/statistics/lwdsstats.asp. DEFRA (2002c) Foot and Mouth Disease. http://www.defra.gov.uk/footandmouth/. DEFRA (2002d) Foot and Mouth Disease. Confirmed FMD Cases by County, Metropolitan District and Unitary Authority Boundaries. http://www.defra.gov.uk/footandmouth/newcounties/ county.asp DEFRA (2002e) Publications. June Agricultural Census. Agricultural Census statistics for the UK 1999. 2. Regional and county data, 1999. http://www.defra.gov.uk/esg/m_publications.htm. DEFRA (2002f) Farm Incomes in the UK 1999/00. http://www.defra.gov.uk/esg/m_ publications.htm. DEFRA (2002g) June Census Analyses 2000 – England & Wales. http://www.defra.gov.uk/esg/ m_ publications.htm. DEFRA (2002h) Summary of UK food and farming. http://www.defra.gov.uk/esg/m_ overview.htm. DEFRA (2002i) Agricultural Census Statistics for the UK 1999. http://www.defra.gov.uk/esg/ m_ publications.htm. Farmers Weekly (2001) Farm crisis sparks rural brain-drain. Farmers Weekly Interactive, 2 November 2001. http://www.fwi.co.uk/live/news/fwi24698.html. 27 House of Commons (2000) Written answers to questions, Agriculture, Fisheries and Food. House of Commons Hansard Written Answers for 20 Mar 2000 (pt 1), Column: 385W. http://www.parliament.the-stationery-office.co.uk/pa/cm199900/cmhansrd/vo000320/text/0. Lexecon (1994) Beyond Argument. http://www.lexecon.co.uk/publications/media/1994/beyond_ argument.pdf. MAFF (1999) Farm Incomes in the United Kingdom, 1998/99. London: The Stationery Office. NIST/SEMATECH (2002) Engineering statistics handbook. http://www.itl.nist.gov/div898/ handbook/index.htm. 28 Appendix Supplementary tables Table A1 Numbers of recipients of RABI grants and sample sizes, by region Region East Midlands East North East North West South East South West West Midlands Yorkshire & the Humber England Wales Northern Ireland UK Number of recipients 230 61 332 1329 128 1322 666 344 4412 1641 1657 7710 Sample size 30 27 32 75 28 97 62 33 384 99 53 536 Sample as % recipients 13.0 44.3 9.6 5.6 21.9 7.3 9.3 9.6 8.7 6.0 3.2 7.0 Table A2 Numbers of recipients of ARC-Addington grants and samples sizes, by region Region East Midlands East North East North West South East South West West Midlands Yorkshire & the Humber England Wales Scotland Northern Ireland UK Number of recipients 292 97 398 1932 125 2478 991 581 6894 2439 440 1150 10923 Sample size 30 30 36 174 30 223 89 52 664 220 40 104 1028 29 Sample as % recipients 10.3 30.9 9.0 9.0 24.0 9.0 9.0 9.0 9.6 9.0 9.1 9.0 9.4 Table A3 Samples sizes of individual variables for recipients of RABI grants, by region Variable Total recipients Sample Age of recipient Dependent children Other income Value of answer EM E NE NW SE SW WM YH E Years Number Declaring income Y/N Stating amount £ State benefits Working families tax credit Y/N Child benefit Y/N State pension Y/N Other Y/N Savings Declaring Y/N Stating amount £ Household bills £ Area farmed ha Stated tenure Category Farm business account Credit £ Overdraft facility £ Total liabilities £ 230 30 30 18 15 8 14 17 16 13 19 9 2 27 29 21 27 0 61 27 27 16 13 4 13 15 13 12 17 9 4 27 27 20 24 4 332 1329 128 1322 666 344 32 75 28 97 62 33 31 72 26 93 58 32 25 44 18 61 32 22 23 27 15 74 44 32 9 17 9 43 25 16 17 20 11 52 39 32 23 37 16 59 43 32 17 18 11 45 31 32 15 11 11 44 26 32 18 26 16 65 39 33 5 17 6 26 20 15 4 10 4 8 6 3 31 71 26 94 58 32 32 71 28 92 59 32 21 46 23 68 40 28 28 61 18 80 48 32 5 12 5 9 4 7 Table A4 Samples sizes of individual variables for recipients of ARC-Addington grants Value of answer EM E NE NW SE SW WM YH E W S NI UK 292 97 398 1932 125 2478 991 581 6894 2439 440 1150 10923 Total recipients Number Number 30 30 36 174 30 223 89 52 664 220 40 104 1028 Sample 30 27 39 179 28 346 89 52 790 220 40 104 1154 Area farmed ha £ 23 15 29 153 22 257 70 47 888 173 20 79 1160 Debt 30 W NI 4412 1641 1657 384 99 53 369 97 48 236 62 35 243 67 51 131 28 15 198 56 51 242 69 51 183 58 51 164 53 51 233 60 51 107 20 1 41 7 0 366 95 52 370 98 52 267 68 31 318 86 43 46 9 2 UK 7710 536 514 333 361 174 305 362 292 268 344 128 48 513 520 366 447 57 RABI application form – Version 1 CONFIDENTIAL ROYAL AGRICULTURAL BENEVOLENT INSTITUTION Shaw House, 27 West Way, Oxford, OX2 0QH Registered Charity no. 208858 Fax Number: 01865 202025 APPLICATION FOR ASSISTANCE FOOT AND MOUTH DISEASE CRISIS FUND 1. PARTICULARS OF APPLICANT Surname…………………………………. First names………………………………………... Date of birth……………………………… Age on application………………………………... Address……………………………………………………………………………………………. ……………………………………………………………………………………………………… ……………………………………………………………………………………………………... Postcode……………………….. Telephone no………………………………………………. Have we helped you in the past?.................................................Please give date………………. 2. PARTICULARS OF SPOUSE/PARTNER (indicate which is applicable) Surname…………………………………. First names………………………………………... Date of birth……………………………… Age on application………………………………... 3. NUMBER OF DEPENDENT CHILDREN WHO NORMALLY LIVE WITH YOU Please give ages……………………………………………………………………………. 4. Please give details of any other people who normally live with you ……………………………………………………………………………………………………… ……………………………………………………………………………………………………… 31 5. FARMING DETAILS a) Is the farm owned or rented?.................................................................... b) If owned, is there a mortgage or loan secured on the property? YES/NO i) If YES please state how much………………………….. c) Please state how many acres are: i) Rented……………………………………………. ii) Owned…………………………………………… d) Please give your holding no………………………………………………………………. e) Please give brief details including numbers of all livestock, crops and pasture ……………………………………………………………………………………………… ……………………………………………………………………………………………… ……………………………………………………………………………………………… ……………………………………………………………………………………………… ……………………………………………………………………………………………… 6. OTHER INCOME a) Do you or your spouse partner have any other earned or unearned income apart from the farm business? YES/NO If yes, please give brief details and approximate weekly amount. ……………………………………………………………………………………………… ……………………………………………………………………………………………… b) Are you in receipt of any State Benefits? Working Families’ Tax Credit YES/NO Child Benefit YES/NO State Pension YES/NO Any other Benefit (please specify)……………………………………………….. 7. SAVINGS Do you or your partner have any savings or investments? YES/NO If yes, please give details………………………………………………………………….. ……………………………………………………………………………………………… ……………………………………………………………………………………………… ……………………………………………………………………………………………… 32 8. FARM BUSINESS ACCOUNT How much money is there in the account? £ CR………………………………... £ DR………………………………... If you have an overdraft facility, please state limit £…………………………………… 9. Have you contacted any other charitable organisations, e.g. The Addington Fund? YES/NO 10. PLEASE GIVE BRIEF DETAILS BELOW OF HOW THE FMD CRISIS IS AFFECTING YOU PERSONALLY AND ANY OUTSTANDING DEBTS YOU MAY HAVE:- 33 11. If we can assist you, who should the cheque be made payable to? ……………………………………………………………………………………………… 12. REFEREE DETAILS Please give full name, address, telephone number and occupation of someone who will provide a reference; e.g. Accountant, Bank Manager, Minister of Religion, Vet, GP, NFU/FUW official or another farmer. THIS MUST NOT BE A RELATIVE. Please contact the person to ensure they are willing to provide a reference. Name……………………………………………………………………………………….. Address……………………………………………………………………………………. ……………………………………………………………………………………………… ……………………………………………………………………………………………… Postcode……………………….. Telephone no………………………………………. Occupation (if retired please state former occupation)………………………………… 13. DECLARATION I………..…………………………………………………………………………………… Declare that the information given here is correct to the best of my knowledge and belief. Applicant’s signature……………………………………………………………………... Date………………………………………………………………………………………… (The information on this form may be entered on a computer) 34 RABI application form – Version 2 CONFIDENTIAL ROYAL AGRICULTURAL BENEVOLENT INSTITUTION Shaw House, 27 West Way, Oxford, OX2 0QH Registered Charity no. 208858 Fax Number: 01865 202025 SUPPLEMENTARY APPLICATION FOR ASSISTANCE FOOT AND MOUTH DISEASE CRISIS FUND 1. PARTICULARS OF APPLICANT Surname…………………………………. First names………………………………………... Date of birth……………………………… Age on application………………………………... Address……………………………………………………………………………………………. ……………………………………………………………………………………………………… ……………………………………………………………………………………………………... Postcode……………………….. Telephone no………………………………………………. HOLDING NO……………………………………………………………………………………. How much have you received from RABI to date?................................................................... Please give date of assistance…………………………………………………………………….. Have you received any financial help from any other organisation e.g. The Addington Fund? YES/NO If yes, please state which organisation and how much you received…………………………... ……………………………………………………………………………………………………… What is your acreage?................................................................................................................. What stock do you have on the farm?....................................................................................… Please describe present situation below Signed………………………………………………………..Date………………………………. 35 RABI application form – Version 3 CONFIDENTIAL ROYAL AGRICULTURAL BENEVOLENT INSTITUTION Shaw House, 27 West Way, Oxford, OX2 0QH Registered Charity no. 208858 Fax Number: 01865 202025 Office Telephone Number: 01865 724931 Helpline Telephone Number: 01865 727888 APPLICATION FOR ASSISTANCE TO BE COMPLETED IN BLOCK CAPITALS 1. PARTICULARS OF APPLICANT Surname…………………………………. First names………………………………………... Date of birth……………………………… Address……………………………………………………………………………………………. ……………………………………………………………………………………………………… ……………………………………………………………………………………………………... Postcode…………………………………. Telephone no………………………………………. Have we helped you in the past?.............................Please give date(s)…………………. Amount of Grant(s)……………….. Are you a farmer/farm employee? (please indicate which is applicable) 2. PARTICULARS OF SPOUSE/PARTNER (please indicate which is applicable) Surname…………………………………. First names………………………………………... Date of birth……………………………… 3. NUMBER OF DEPENDENT CHILDREN WHO NORMALLY LIVE WITH YOU Please give sex and ages…………………………………………………………………………... 4. Please give details of any other people who normally live with you including their contribution to the household ……………………………………………………………………………………………………… ……………………………………………………………………………………………………… 5. FARMING DETAILS a) Is the farm owned or rented?……………………. b) If owned, is there a mortgage or loan secured on the property? YES/NO c) c) Please state how many acres are: 36 i) Rented ………………………………. ii) Owned ……………………………… d) Please give your Holding no. …………………………………………………………….. e) How many employees do you have? …………………………………………………….. f) What livestock do you have on the farm? Please give details including numbers and ages of stock ……………………………………………………………………………………………… ……………………………………………………………………………………………… ……………………………………………………………………………………………… g) If livestock has been slaughtered due to FMD please give date, numbers, age and types of livestock slaughtered Date FMD (Slaughter) Type Age No.s Date Welfare (Slaughter) Type Age No.s h) Date that restocking may start…………………………………………………………… i) How much government compensation have you received or expecting to receive? (if received please give date)………………………………………………………………… Please give full details of acreages of all crops and pasture: ……………………………………………………………………………………………… ……………………………………………………………………………………………… ……………………………………………………………………………………………… j) Please give details of stocks held (e.g. hay/straw/silage/grain) ……………………………………………………………………………………………… ……………………………………………………………………………………………… ……………………………………………………………………………………………… 6. SUBSIDIES – ANNUAL PAYMENTS SOURCE Arable Area Payments Sheep Annual Premium Beef Special Premium Suckler Cow Premium Hill Livestock Compensatory Allowance Set Aside Land Management Supplements (Countryside Stewardship Scheme, Woodland Grant, Farm Woodland Premium etc.) Other TOTAL PER YEAR 37 AMOUNT £ 7. FARM INCOME SOURCE Grain Sales per Year Livestock Sales per Year Machinery Sales per Year Milk Sales per Year Other per Year AMOUNT £ TOTAL per Year 8. FARM BUSINESS ACCOUNT How much money is there in the account? £ CREDIT…………………………………. £ DEBIT…………………………………… If you have an overdraft facility please state limit £……………………………………………. 9. LIABILITIES Amount owing to suppliers Bank overdraft Bank loan Lease & HP agreements Other (e.g. rental charges) AMOUNT £ TOTAL 10. PERSONAL FINANCIAL DETAILS SELF Savings/Capital Bank, current a/c Bank, deposit a/c Building Society National Savings Stocks & Shares Property (other than house lived in) Other TOTAL 38 SPOUSE/PARTNER 11. OTHER INCOME a) Do you or your spouse/partner have any other earned or unearned income apart from the farm business? YES/NO If yes, please give details and approximate monthly amount. SOURCE……………………………………AMOUNT £……………………per month SOURCE……………………………………AMOUNT £……………………per month SOURCE……………………………………AMOUNT £……………………per month b) HOUSEHOLD/DOMESTIC DEBTS Please list all bills with dates and amounts, if applicable, and send with application form Electricity Gas Water Telephone Council Tax Other c) WEEKLY AMOUNT OF STATE BENEFITS BENEFIT Working Families’ Tax Credit Child Benefit State Pension Council Tax Benefit Housing Benefit Other (please specify) AMOUNT £ TOTAL 12. Have you contacted any other charitable organisation e.g. The Addington Fund? YES/NO If yes, which organisations and how much assistance did you receive? ……………… ……………………………………………………………………………………………… 39 a) Have you received any financial/business advice? YES/NO……………………............ ……………………………………………………………………………………………… b) Membership of organisation i.e. NFU/WFU/CLA/TFA (please indicate as applicable) 13. PLEASE GIVE DETAILS BELOW OF YOUR REASONS FOR MAKING THIS APPLICATION: PLEASE TURN OVER 40 14. If we can assist you, who should the cheque be made payable to? ……………………………………………………………………………………………… 15. REFEREE DETAILS Please give full name, address, telephone number and occupation of someone who will provide a reference; e.g. Accountant, Bank Manager, Minister of Religion, Vet, GP, NFU/FUW official or another farmer. THIS MUST NOT BE A RELATIVE. Please contact the person to ensure they are willing to provide a reference. Name……………………………………………………………………………………….. Address……………………………………………………………………………………. ……………………………………………………………………………………………… ……………………………………………………………………………………………… Postcode……………………………… Tel. no……………………………………… Occupation (if retired please state former occupation)………………………………… 16. DECLARATION I………..…………………………………………………………………………………… declare that the information given here is correct to the best of my knowledge and belief. Applicant’s signature……………………………………………………………………... Date………………………………………………………………………………………… (The information on this form may be entered on a computer) FOR OFFICE USE ONLY DATE FORM SENT SENT BY Newhelplineform 01/07/01 41 ARC-Addington application form STRICTLY CONFIDENTIAL ARC-ADDINGTON TRUST APPLICATION FORM FOR FUNDING Please complete as many details as possible so that the trustees can assess the help required. Fax completed form to 024 7669 6274 or e-mail to : [email protected] NAME OF APPLICANT: ADDRESS: CASE NUMBER TEL.: MOBILE: NAME & ADDRESS OF REFEREE: TEL.: MOBILE: NUMBER OF CHILDREN: TYPE OF FARM: ACREAGE: OWNED: DESCRIPTION OF LIVESTOCK SITUATION: AGES: TENANTED: SPECIFIC PROBLEM: LOANS SECURED AGAINST FARM: OVERDRAFT SITUATION: NEGOTIATIONS WITH BANK: YES/NO SAVINGS ACCOUNTS: PERSONAL BUSINESS: INCOME FROM OTHER SOURCES: STATE BENEFITS OBTAINED/APPLIED FOR: HELP REQUIRED FROM THE FUND: IF A GRANT WAS PREVIOUSLY AWARDED PLEASE GIVE DATE: ASSESSMENT: HOW MUCH DO YOU RECOMMEND THE TRUST SHOULD GIVE: HOW DOES THE APPLICANT WANT TO BE PAID: IF BY CHEQUE PLEASE GIVE NAME & ADDRESS OF PAYEE: OTHER AGENCIES CONTACTED FOR HELP (RABI, etc.): NB Families with disabled children can get help from: Family Fund Trust, PO Box 50, York. YO1 9XZ Royal British legion may be able to give assistance to anyone who has served for more than a week in the 42 armed forces If you would like a hard copy of the report, please contact the Farm Crisis Network office: Farm Crisis Network 38 De Montfort Street Leicester LE1 7GP Tel/Fax: 0116 255 0362 e-mail: [email protected] www.farmcrisisnetwork.org.uk Contact details for the partner organisations which together commissioned and sponsored this report are as follows: ARC-Addington Fund National Agricultural Centre Stoneleigh Park Warwickshire CV8 2LZ Tel: 024 7669 0587 e-mail: [email protected] Farm Crisis Network (FCN) 38 De Montfort Street Leicester LE1 7GP Tel/Fax: 0116 255 0362 e-mail: [email protected] www.farmcrisisnetwork.org.uk Royal Agricultural Benevolent Institution (RABI) Shaw House 27 West Way Oxford OX2 0QH Tel: 01865 724931 e-mail: [email protected] www.rabi.org.uk Rural Stress Information Network (RSIN) Arthur Rank Centre Stoneleigh Park Warwickshire CV8 2LZ Tel: 024 7641 2916 e-mail: [email protected] www.rsin.org.uk 43


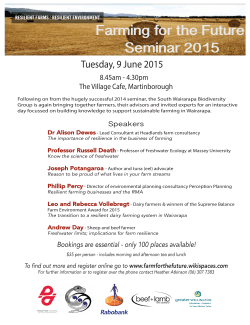
© Copyright 2026