
Transformations of the ethnic structure in Hungary after the turn of
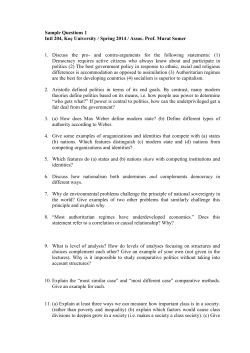
Human Geographies – Journal of Studies and Research in Human Geography Vol. 9, No. 1, May 2015 | www.humangeographies.org.ro ISSN-print: 1843–6587 | ISSN-online: 2067–2284 Transformations of the ethnic structure in Hungary after the turn of the millennium Patrik Tátrai Hungarian Academy of Sciene, Hungary The paper studies the changes concerning the ethnic structure of post-socialist Hungary. Based on the data of the 2011 census, the number of the non-Hungarian population has signicantly increased between 2001 and 2011 and so has had the number of those who refused to answer. Behind this phenomenon several reasons can be identied, like the methodical changes in the data collection of the census, migration and subjective factors. Regarding the methodology, double identication in three ethnic categories was allowed in the last census, which resulted in the growing number of respondents who claimed both Hungarian and minority identity. Meanwhile, migration (including cross-border residential mobility) from Romania, Ukraine, Serbia and Slovakia has changed the ethnic landscape. Beyond the above factors, subjective factors have also contributed in the changes. The present paper argues that the self-identication of some minority groups is related to the symbolic ethnicity and the double and hybrid identities, thus the results of the census cannot be interpreted merely by the assimilationist approach. Key Words: Migration, Cross-border residential mobility, Assimilation, Double ethnic attachment, Hybridity, Symbolic ethnicity, Hungary. Article Info: Received: January 9, 2015; Revised: May 15, 2015; Accepted: May 22, 2015; Online: May 30, 2015. Introduction The ethnic composition of Hungary – based on census data – has signicantly changed between 2001 and 2011. The revealing picture seems to be surprising for the rst sight. While the number and the rate of the Hungarians are diminishing, those of the minorities are – except one or two groups – increasing. These processes somewhat contradict the expected results as all the previous Hungarian analyses were reporting about an intensifying assimilation process. Furthermore there has been a homogenisation process in nearly all the nation states of the region, which was the dominant trend in Hungary as well. Correspondence address Address: Patrik Tátrai, HAS RCAES Geographical Institute, 1112 Budapest, Budaörsi út 45, Hungary. Phone: +36705148597 | Email: [email protected] ©2015 Human Geographies; The author DOI:10.5719/hgeo.2015.91.6 80 P.Tátrai How is it possible then that the number of the minority population is growing, while literature reports about their linguistic and ethnic assimilation? If the data are analysed only supercially, more seemingly contradicting issues can be detected. How is it possible that in case of 63 settlements the proportion of the ethnic minorities is over 50%, and in case of 3138 settlements the proportion of the Hungarians is over 50%, when there are all together 3154 settlements in Hungary? And how come that after hundred years of nation building and ethnic homogenisation processes, the recent proportion of population with Hungarian native language only slightly exceeds the values measured in 1880 in the present territory of Hungary? The aim of this study is to provide answers for these questions phrased, of course, in a quasi-naive way. These questions highlight the main issues that have to be analysed in order to identify the changes taking place in the last decades. The analysis of these topics will hopefully provide the answer for the following questions: what kind of factors, what kind of processes and in what directions have been and will be forming the ethnic composition and the ethno-spatial pattern of Hungary. Changes in the ethnic makeup of Hungary between 1990 and 2011 – from a statistical point of view According to the last three censuses, the ethnic composition of Hungary has undergone signicant alterations in the last two decades, which, on the one hand, is a consequence of the changes regarding the number of members belonging to certain ethnic groups and, on the other, the modied data collection methodology of the census. If only the proportion of the Hungarians and the minorities is taken into consideration, the population, that earlier seemed to be ethnically homogeneous, today is characterised by ethnic diversity. While 271 thousand people (2.6% of the total population) out of the 10.4 million inhabitants of Hungary had ethnic background other than Hungarian in 1990, their number grew to 531 thousand (5.2%) by 2001, and according to the last census out of the 9.9 million people 769 thousand (7.7%) persons declerad nonHungarian ethnic afliation. Besides the declining number of the total population, the growing number of the minorities forecast that the number of persons claiming Hungarian ethnicity is diminishing. Speaking in numbers, while the 97.8% of the total population declared themselves to be Hungarian in 1990, this rate dropped back to 83.7% by 2011. However, this phenomenon is not due to the growth of the minorities but due to the nearly 1.5 million inhabitants (14.7%) who did not answer the questions of ethnic belonging. There are several reasons standing in the background of the above introduced changes. One of the most easily detected and most important reasons is the changing methodology of data acquisition. The 1990 and pre-1990 censuses intended to measure ethnic attachment by questions focusing on ethnicity and mother tongue. Answering the questions was compulsory and only one answer could be given for a question. This corresponds with the modern statistical imagination which has tried to describe cultural identity and people's ethnicity with one and only category (Anderson 1991. 166). This method, characterizing the whole region, stems from Transformations of the ethnic structure in Hungary 81 the ideology of the 19-20th century nation state, which, as to be able to exercise control more easily, categorise people (Kertzer and Arel 2002. 10). In the broader region ethnicity is thus considered to be not only a statistical category but an assigned status as well (Brubaker 1996). This routine was also one of the devices used by the rivalling nationalisms of the region: everybody had to decide to which group (or rather category) to belong to. As this choice determined the statistical size, the local and national demographics and thereby the local and national lobbyist skills of a given community and the power relations, the data of the census regarding the ethnicity is always rather seriously inuenced by the politics (Kertzer and Arel 2002). The 2001 census underwent signicant changes compared to the previous practices. Besides the questions focusing on ethnicity and mother tongue, questions regarding the cultural attachment and the language used in communities of family and friendship were also asked. For each of the four questions three answers could be given. It was also an important innovation of the 2001 census that answering the questions of ethnicity and religious denomination was not compulsory. The 2011 census generally used the same method as ten years earlier, but at some points it differed from the previous one. Ethnicity gained a bigger attention, as this year two questions focused on this topic. Besides, the number of the possibly chosen answers was reduced from three to two, and the question about cultural attachment was removed from the census. Furthermore, the questionnaires could be lled in both online and on paper. The paper-based lling in could be carried out both with the help of ofcial interviewers, and also alone, which gave the complete freedom to undertake any identities. After introducing the changes carried out in the methodology, the modication in the values of the above categories of ethnicity is presented (Table 1). The broad category of cultural attachment was the most popular among the minority population in 2001. Most of the persons claimed to belong to an ethnic group via this category. Nearly as many persons declared to belong to an ethnic group based on their ethnicity, thus the second most often used category of self-identication turned out to be the category of ethnicity. The least persons belonged to any ethnic group based on their mother tongue. In all the categories used in the 2011 census the number of persons was increasing, although by rather diverse amounts. While Table 1. The number of persons belonging to minority ethnic groups and non-responding persons according to the census categories, 2001–2011 Census categories concerning ethnic affiliation 2001 2011 Ethnicity Number of persons belonging to minority ethnic groups Change 2001 2011 (2001= 100%) 357,274 603,455 168.9 570,537 1,455,883 Change (2001= 100%) 255.2 Mother tongue 179,961 188,616 104.8 541,106 1,443,840 266.8 Used language 230,589 333,363 144.6 558,246 1,486,218 266.2 Cultural attachment 360,871 .. .. 628,328 .. .. Number of non-responding persons Nationality 532,439 768,735 144.4 524,103 1,398,731 266.9 ..= no data. Source: the author’s calculation based on the data of the 2001 and 2011 censuses (HCSO) 82 P.Tátrai the rate of the growth in the category of 'ethnicity' reached nearly the 70%, this rate was around 45% in the category of 'used language' and only around 5% in the category of 'mother tongue'. As to see in details the signicant changes between 2001 and 2011 presented above, it is necessary to look at how the number of minority population developed by ethnic groups and census categories (Table 2). Not only the number of persons belonging to any minority ethnic groups altered rather greatly in the examined period, but large differences are detected in the changes by ethnic groups. The main ethnic processes and their theoretical frameworks After reviewing the above presented data there are more questions to be answered. What kinds of processes shape the ethnic pattern of Hungary? How can these changes be interpreted? What kind of causes and factors stand in the background of the processes varied by ethnic groups and census categories? To answer these questions, rst I take into consideration the possible inuencing issues, and then I analyze their applicability for interpreting the processes. Table 2. Changes in the number of persons belonging to the recognized and other main ethnic groups between 2001 and 2011 Ethnic groups/ Nationalities Number by nationality a 2001 2011 Hungarian 9,627,057 8,504,492 88 88 88 88 Bulgarian 2,316 6,272 262 223 247 271 Roma 205,720 315,583 163 112 115 153 Greek 6,619 4,642 156 97 119 70 Croatian 25,730 26,774 151 96 109 104 5,144 7,001 193 118 143 136 120,344 185,696 212 113 181 154 Polish German Ethnicity Change (2001=100%) Mother Used Nationality tongue language Armenian 1,165 3,571 531 151 165 307 Romanian 14,781 35,641 330 164 219 241 Rusyn 2,079 3,882 303 90 106 187 Serbian 7,350 10,038 189 109 136 137 Slovakian 39,266 35,208 168 84 90 90 Slovenian 4,832 2,820 79 54 56 58 Ukrainian 7,393 7,396 111 69 72 100 Arab 2,367 5,461 325 204 241 231 Chinese 2,915 6,770 271 241 238 232 Russian 5,512 13,337 264 227 260 242 Other 77,662 95,143 77 60 149 123 No answer 524,103 1,398,731 255 267 266 267 All together 10,683,599 10,671,958 103 99 99 104 Population 10,198,315 9,937,628 97 97 97 97 a: in 2001 including persons having cultural attachment. Source: the author’s calculation based on the data of the 2001 and 2011 censuses (HCSO) Transformations of the ethnic structure in Hungary 83 Three factors determine the modication of the size of any ethnic groups: the natural increase (the balance of birth and mortality), the net migration (the balance of emigration and immigration) and the changes in the ethnic self-identication called as subjective factors in the following. The phenomenon of not replying questions regarding ethnic afliation partly belongs to this latest category but due to its importance it is worth discussing it separately. Natural population change Based on the 2011 census, except for the Roma, there is no signicant difference in the various indices of natural increase (e.g. in the number of live births for 100 women) between the ethnic groups. Natural decline characterizes all the ethnic groups apart from the Roma community. In the background one can identify low birth rate and population ageing. Most minority groups, especially the bigger communities in whose reinforcement immigration plays a minor role, have older age structure and higher average age than the national average. The ageing of the minority native speakers is especially striking, which reects the intense linguistic assimilation of the young generations (Table 3). At the same time the change of the ageing index between 1990 and 2011 is not even, its uctuation detected in more groups indicates that the changing size of minority groups cannot be described simply as linear assimilation or ageing. Table 3. The ageing index, the average age and the number of live births per 100 women by ethnic groups between 1990 and 2011 Ethnic groups/ Nationalities Ageing index by mother tongue Average age by ethnicity Number of live births per 100 women by nationality 1990 2001 2011 1990 2001 2011 by nationality 2011 Hungarian 91 127 171 94 132 175 41.5 153 150 Bulgarian 463 420 248 .. 240 290 43.8 130 137 2001 2011 Roma 14 21 27 11 12 14 26.3 239 233 Greek 393 468 365 .. 222 149 39.8 108 117 Croatian 375 458 604 297 298 365 47.3 154 154 Polish 76 126 207 .. 108 218 42.7 134 131 German Armenian 598 267 964 112 628 160 230 .. 310 165 245 341 44.1 44.0 147 128 138 138 Romanian 235 271 233 156 209 173 41.3 142 139 .. 285 534 .. 227 342 45.7 145 162 Serbian 435 243 290 370 214 186 41.2 123 121 Slovakian 891 724 737 514 403 447 49.9 161 165 Slovenian 399 445 969 281 336 510 49.5 171 177 Ukrainian 320 157 244 .. 156 160 39.7 130 129 No answer .. 54 106 .. 52 107 37.8 140 132 Rusyn Population 92 123 161 92 123 161 41.5 153 147 ..= no data. Source: the author’s calculation based on the data of the census 1990, 2001 and 2011 (HCSO) 84 P.Tátrai The highest values of ageing index are interrelated with the declining size of certain ethnic groups (Slovenians and Slovaks) between 2001 and 2011. Though there is no big difference between the ethnic groups in the number of the live birth per 100 women, the minorities' ageing index is generally higher. In other words, although the number of children born by either Hungarian or non-Hungarian mothers is very similar, there are less children with minority attachment, which can be interpreted as a sign of assimilation. Researching assimilation from demographic point of view, Sándor Szilágyi distinguishes between the biological and the ethnic reproduction, as for example not all the Slovak mothers will have Slovak children (Szilágyi 2004. 178-179). Based on the demographic indices regarding the natural increase, a clear cleavage has emerged between the Roma and non-Roma people. The age structure of the Roma population is rather young; their average age is by 15 years lower than that of the total population. Based on these facts, it can be stated that the positive natural increase plays an important role in the growing number of the Roma population only. However, as it will be presented later, their growth is not only down to this factor. Migration The migration processes between 2001 and 2011 have signicantly contributed to the alteration of the ethnic pattern of Hungary. There are no solid statistics regarding the size of this process; only approximate evaluation and indirect data are available. Based on the statistics, the examined period resulted in migration surplus in Hungary, meaning that more people moved into the country than moved out. Data concern mainly the arrivals, thus this paper focuses on them. In the last two decades, 45–80% of the foreigners residing legally in Hungary arrived from the neighbouring countries, and most of them (81% according to the 2001 census) had Hungarian mother tongue (Gödri 2010). Based on the 2011 census, immigration played a key role not only in Hungarians' demography, but it was one of the most important sources of the increasing non-Hungarian population: primarily the Romanian, Slovakian, Serbian and German ethnic groups gained new members (Table 4). However, understanding migration's role in the transformation of ethnic makeup seems to be more complicated if we take into account that considerable proportion of the non-Hungarian population born abroad also self-identied as Hungarian. This may partly be explained with the high share of migrants with ethnic Hungarian background, but anyway, the phenomenon highlights that the ethnic groups' boundaries are becoming more blurred. Migration has considerably contributed to the maintenance (e.g. Slovakians, Ukrainians) and growth (e.g. Romanians, Serbians, Germans) of some ethnic groups. However in case of the ethnic groups whose settlement pattern is rather dispersed (Bulgarians, Greeks, Polish, Armenians, Ukrainians) the number of persons born abroad is traditionally higher, which implies that many of the members of these groups immigrated in the recent decades (Tóth and Vékás 2009; 2013). Of course, in case of the newly immigrated communities non-recognized as traditional minority by law (e.g. Arabs, Chinese) immigration is obviously the main source of their increment. Migration has an essential effect not only on the ethnic Transformations of the ethnic structure in Hungary 85 Table 4. The number, the proportion and the changing rates of persons born abroad regarding the national minority groups, 2001-2011 Ethnic group Number by nationality Foreign born Foreign born, % Change 2001=100% 2001 2,316 2011 6,272 2001 977 2011 1,062 2001 42.2 2011 16.9 Roma 205,720 315,583 932 1,490 0.5 0.5 159.9 Greek 6,619 4,642 1,290 1,092 19.5 23.5 84.7 Croatian 25,730 26,774 2,050 2,018 8.0 7.5 98.4 Polish 5,144 7,001 2,162 2,303 42.0 32.9 106.5 120,344 185,696 9,756 17,500 8.1 9.4 179.4 Bulgarian German 108.7 Armenian 1,165 3,571 366 566 31.4 15.8 154.6 Romanian 14,781 35,641 7,286 26,821 49.3 75.3 368.1 Rusyn 2,079 3,882 1,081 1,000 52.0 25.8 92.5 Serbian 7,350 10,038 2,808 5,087 38.2 50.7 181.2 Slovakian 39,266 35,208 2,360 5,315 6.0 15.1 225.2 Slovenian 4,832 2,820 307 194 6.4 6.9 63.2 Ukrainian 7,393 7,396 3,668 6,021 49.6 81.4 164.1 Source: Tóth and Vékás 2013. 1262. pattern of the population but on the ethno-spatial structure as well. Tóth and Kincses analysed the preferences in residency choice of those who moved to Hungary between 2001 and 2008, nding out that there are three preferred regions: the central region that attracts the foreign citizens with its strong economy, the borders zones that have the advantage to be close to the areas of origin, and the third area, less important than the two mentioned earlier, around the lake Balaton, which becomes the new home of the pensioners arriving to Hungary mainly from Western-Europe (Tóth and Kincses 2010). As the result of the migration processes in the last decades, nowadays the biggest communities of all the minorities, except the Slovenians, live in Budapest. The concentration of new immigrant groups in Budapest and its agglomeration zone is specically striking. An increasing number of people with Ukrainian, Romanian and Serbian background also live next to the main transport corridors between the borderland of their country of origin and the capital city (e.g. near the M3, M4, M5 motorways and highways). Due to the internal economic migration processes, the minorities became increasingly urbanised. Nevertheless, the spatial pattern of the sizeable minorities has changed relatively little except the Romanians: while 2/3rd of them lived close to the Romanian border in 1990, nowadays only 1/3rd of them live there (and 40% in the central region) (Kocsis and Bottlik 2009). In general all the Hungarian ethnic groups, except for the Romas, have undergone a regional and local spatial deconcentration process since the collapse of the communism (Table 5.), and they are living in growing number off their traditional settlements – rst of all in Budapest and its agglomeration. As a contrast, in case of the Roma population exactly the opposite process can be observed. Becoming more and more marginalized and facing to rising unemployment during the market transition period, a growing number of them moved back to depopulating, peripheral, backward villages, which in some cases contributed to selective migration, ethnic change and rural ghettoization (Virág, 2006; Pásztor 86 P.Tátrai Table 5. The distribution of selected ethnic groups among settlements with their various proportion within the population of the settlements in 1990 and 2011 (%) Roma Croatian German Romanian Serbian Slovakian Slovenian * 1990 2011 1990 2011 1990 2011 1990 2011 1990 2011 1990 2011 1990 2011 0–1 25.5 5.0 20.0 28.4 35.3 14.7 49.8 75.0 51.9 84.6 40.3 31.5 19.3 35.3 1–5 33.0 32.2 5.9 24.7 19.4 39.2 8.5 11.3 21.0 12.6 14.6 18.2 12.6 2.1 5–20 31.4 40.3 11.0 13.2 27.3 22.4 9.1 3.2 21.3 0.5 14.8 28.9 2.0 26.1 20–50 9.4 19.0 21.6 16.8 15.8 21.9 15.2 4.6 0 0 30.3 20.4 9.9 7.1 50–x 0.7 3.5 41.4 16.9 2.1 1.8 17.4 5.8 5.8 2.3 0 1.1 56.2 29.4 112,9 308,9 13,6 23,5 30,6 131,9 10,6 * Proportion within the total population of settlements (%) ** All together (thousands persons) 26,3 2,9 7,2 10,2 29,6 1,9 2,3 ** Source: the author’s calculation based on the data of the census1990, 2001 and 2011 (HCSO) and Pénzes 2012). Due to this process their local concentration grew mainly in the underdeveloped North-East Hungary and South-Transdanubia. Cross-border residential mobility In the last decade, beside the above described migration processes, a new, shortdistance form of international migration has appeared in Hungary, namely the cross-border residential mobility. As denied by Jagodič (2011. 60), “cross-border residential mobility involves the movements of people who decide to buy real estate and move to the other side of the border, while maintaining at the same time strong relations with their place of origin.” The cross border residential mobility usually means a daily basis commuting as well (e.g. job, school, shopping, use of services, visiting friends, etc.), thus migrants are present on both sides of the border, and use both sides of the border area. Due to the close ties with the place of origin, crossborder residential mobility is mostly approached from the perspective of transnationalism (e.g. Strüver 2005, van Houtum and Gielis 2006, Jagodič 2011), while other scholars involve the theoretical framework of border studies to understand the phenomenon (Balogh 2013). In Hungary, this phenomenon is predominantly perceived in rural areas in the suburban zone of cities near the border, therefore Hungarian literature generally applies the term 'cross-border suburbanization' (e.g. Hardi 2012) which rather limit itself to urban sprawl across the state border (see Balogh 2013). For the development of the cross-border suburbanization the combination of several factors is needed: a city near to the border, free international movement, the easy transit across the border and, of course, the differing expenses at the two sides of the border (e.g. more favourable property prices in the rural settlements in the Hungarian side of the border) (Hardi 2012). In Hungary, such a constellation can be detected next to the Slovakian and Romanian borders. In the followings I will focus on these regions. Up to today probably less than 10 thousand persons moved to Hungary to crossborder suburbanisation zones. In case of the most visible and the most studied Bratislava agglomeration the estimations signicantly differ from each other and Transformations of the ethnic structure in Hungary 87 range from 2-3 thousands (Hardi 2012) to 5 thousand migrants (Slavík et al. 2011) resettled in Hungary. There is no exact information about the ethnic composition of the migrants, but presumably – due to the cultural proximity and the lack of language barriers – Hungarians may be overrepresented when compared to the ethnic structure of the city of origin. Nevertheless, it is expected that in case of the majority of the migrants “the identication with the nation of origin is still very high” (van Houtum and Gielis 2006. 196). On the Slovak-Hungarian border zone Košice is another but less signicant example for cross-border suburbanization (Figure 1). On the RomanianHungarian border the cross-border agglomeration of Oradea is considered to be the most important one. The Hungarian part of the agglomeration is situated around the small town of Biharkeresztes, where the most of the newly immigrated population is ethnic Hungarian (Lovas Kiss 2011), but numerous people declare themselves to be (also) Romanians in more than 10 – predominantly rural – localities (Nagy 2013. 46-47) (Figure 2). In this case the picture shown by the population census is more complex, as some of these villages are home for autochthon Romanian communities as well (e.g. Bedö, Körösszakál, Körösszegapáti). Although it can be presupposed that – due to the cultural similarity and the already existing Romanian institutions – the majority of the migrant Romanians settle down in these villages, the number of the Romanian population decreased by circa 100 persons in these localities, while it was increasing by 400 persons in the surrounding settlements between 2001 and 2011. Thus the immigration of the Romanians and the assimilation of the autochthonous communities are going on simultaneously at this area. Besides Oradea, the most signicant cross-border suburban zone of the Romanian border zone, people also move to Hungary from Arad and Satu Mare. In case of the Hungarian part of the Arad agglomeration – similarly to the example of Oradea – Figure 1. The change in the proportion of Slovaks between 2001 and 2011 (% point) Sources: the authors' edition, based on the data of the census (HCSO) 88 P.Tátrai Figure 2. The change in the proportion of Romanians between 2001 and 2011 (% point) Sources: the authors' edition, based on the data of the census (HCSO) the area most affected by migration (Battonya, Dombegyháza, Lökösháza and Nagylak) and the area of the autochthon Romanians somewhat overlap each other. It is also true of this territory that the number of the Romanian population is growing, apart from the autochthon Romanian settlements. The population moving from Satu Mare was detected in 10 villages around Csengersima in a very low concentration. According to the census, the number of persons with Romanian ethnic background does not reach 200 people. On the whole, it is clear that immigration has a decisive role in the growth of some of the recognized ethnic groups (e.g. Romanian, Ukrainian, Slovak) and all of the new migrant communities. Although only the minor part of the migration gain is realised via cross-border suburbanization, due to the novelty of this process it is worth introducing the phenomenon in details. Based on the statistical data, the ethnic groups' demography differs by subgroups: the analysis of the Romanians and Slovaks revealed that while immigration increases, assimilation reduces their number. Based on these, the present study argues that the ethnic groups in Hungary are far from being homogenous. They can be divided into those living on their traditional settlements, are better assimilated and declare themselves to be Hungarians as well, and into those who immigrated to Hungary lately, who are less assimilated and live off the given ethnic groups' traditional settlements. Subjective Factors From a demographic perspective, the change in the size of the ethnic groups is due to two kind of factors: the objective (natural reproduction, migration) and the subjective factors (the change in the (self-)identication and the decrease in the ethnic reproduction). Researching the transformation of the ethnic composition in Hungary and in the broad Central and Eastern Europe (CEE), these subjective elements are mostly analysed by applying the assimilation discourse. The recent Transformations of the ethnic structure in Hungary 89 change in the size of the minority ethnic groups in Hungary was also approached through the assimilation/dissimilation dichotomy by Ágnes Tóth and János Vékás attributing the growth of the minority groups mainly to dissimilation (Tóth and Vékás 2013). In the following it will be argued that applying other theoretical framework than assimilation is more protable for explaining the growing size of the non-Hungarian ethnic groups. The present paper also claims that the assimilation theory can be also a relevant approach – but only for interpreting other phenomenon than the growth of minority ethnic groups. Presupposing the theory that assimilation/dissimilation is the main source of the increase in the number of minorities appears to be false, since on the one hand the direction of assimilation mostly reects the power relations and the ethnic hierarchy and on the other hand the detailed census data (see below) and the everyday experiences contradict this hypothesis. At the same time, rival concepts such as hybridity, hybrid identities and double attachment describe some of the contemporary identity change processes better. The Hungarian case reveals that the declaration of double or multiple identity gained ground due to the changes in the census methods, and Homi Bhabha's (1994) theory of hybridity is suitable for describing these identity constructions. Minorities in Hungary can thus be characterised by double and multiple ethnic attachments (e.g. Bindorffer 2001; Szarka 2003b, Kozma 2007, Homišinová 2008) and hybrid identities (e.g. Kovács 2002), which has been realised in the statistics from 2001 on. The extent of this phenomenon signicantly increased between 2001 and 2011: while 36% of the non-Hungarians claimed more than one ethnicity in 2001, by 2011 their percentage grew to 72. Thus nearly ¾ part of the minorities self-declares to belong to two nationalities, and the minority identity is most often paired with the Hungarian one (Tóth and Vékás 2009. 8). In other words it means that the Hungarian identity is accompanied by a minority identity, as the predominant majority (around 80%) of the persons claiming double identity marked Hungarian to be their rst ethnicity (Kapitány 2013. 32). Due to the high proportion of minorities having double attachment, it is not surprising that the territorial distribution of the population declaring more than one ethnicity partially overlaps with the territorial distribution of the most numerous minority ethnic groups (mainly the Slovaks, Germans and the Roma). Although almost the half of the hybrids lives in urban areas, their highest concentration can be found in the traditional rural settlements of the minorities (Figure 3). Applying the theory of the double attachment and the hybridity still do not explain completely why did the number of minorities increase in such an outstanding way after the turn of the millennium, since the opportunities to declare multiple ethnic afliation (in statistical sense) decreased between 2001 and 2011. Thus the present study argues that another approach, the theory of symbolic ethnicity introduced by Herbert Gans (1979) helps to answer the research questions. Symbolic ethnicity “proposes that ethnicity can survive without signicant social or cultural participation”, moreover it “proposes the rejection of or a departure from active ethnicity: from participation in ethnic groups and in ethnic culture. It hypothesizes a passive ethnicity, involving the temporary and periodic expression of feelings about or toward the ethnic group or culture through material and nonmaterial symbols.” What is even more important, symbolic ethnicity is “available to all who are embedded in the assimilation and acculturation processes.” (Gans 2008. 90 P.Tátrai Figure 3. The percentage of persons who declared to belong to two ethnicities, 2011 (%) Sources: the authors' edition, based on the data of the census (HCSO) 123). Thus in case of symbolic ethnicity it is not necessary to know or practice the ethnic culture and language, or to use the ethnic minority institutions. Accordingly, symbolic ethnicity does not mean ethnic revival (Gans 1979. 1). In our view, the trend recorded in the censuses regarding the increasing number of minorities started in the 1990s is due to not only the changes in the methodology of the census, but also due to the symbolic ethnic identication – except in case of the Roma population. What is our concept based on? Partly on the fact that while the results of the various eldworks report about existing and continuous assimilation in case of all the non-Roma minorities (e.g. Bindorffer 2001; Kozma 2007; Homišinová 2008; Bartha et al. 2013), the census data show increasing number of minoritites. On the other hand, the growing gap between the data on ethnicity and on mother tongue (Table 6) completely coincides with the theory of the symbolic ethnicity. The 2011 census data prove that language competency is not a precondition to belong to a certain ethnicity. While in the earlier decades the ethnic identity was mainly expressed through the 'mother tongue' category, this phenomenon, mainly due to the advanced assimilation, has been altered by today, and minority attachment is represented through the rather subjective 'ethnicity' category (Szarka 2003b. 414; Tóth and Vékás 2005. 148; Kozma 2007. 264). As the result of all these processes, the number of those who declared to belong to a minority ethnic group by all the categories has signicantly decreased (Table 6). Not only the above indices, but the size of most of the ethnic groups has also uctuated rather highly from census to census, which conrms the existence of the symbolic ethnic attachments in Hungary. This phenomenon is visible both on national and local level, but analyzing the latter one more spectecular cases emerge: some minorities have been multiplied in number or appeared out of the blue, and later their number may have decreased drastically without relevant migration process. Transformations of the ethnic structure in Hungary 91 Table 6. Changes in the MTE-index1 and the ethnic homogeneity index2 of the main ethnic groups 1980–2011 MTE-index Ethnic group Hungarian Bulgarian Ethnic homogeneity index 1980 1990 2001 2011 2001 2011 99.4 100.8 101.4 101.1 96.4 96.4 .. .. 95.7 81.5 27.5 16.8 Roma 435.9 33.7 25.5 17.6 18.0 13.5 Greek .. .. 76.6 47.8 21.8 28.7 147.4 129.5 91.9 58.2 33.9 39.4 Croatian Polish .. .. 87.1 53.2 29.1 30.4 276.1 121.7 54.4 29.0 15.2 14.1 Armenian .. .. 47.4 13.5 14.8 7.2 Romanian 114.3 81.3 106.1 52.7 28.2 21.9 .. .. 101.4 30.1 22.8 13.6 Serbian 122.1 101.7 88.8 51.4 30.1 24.1 Slovak 176.4 121.9 66.8 33.4 14.5 18.5 Slovenian 181.5 136.1 105.1 72.2 40.3 44.1 Ukrainian .. .. 96.4 60.1 42.7 20.8 German Rusyn All recognized minority groups .. .. 43.2 26.7 19.3 16.2 Arab .. .. 103.0 64.6 .. 37.2 Chinese .. .. 106.1 94.6 .. 80.5 Russian .. .. 139.1 119.6 .. 28.2 Non-Hungarians all together 183.8 68.7 50.4 31.3 .. 17.1 ..= no data. Source: the author’s calculation based on the data of the census 1980, 1990, 2001 and 2011 (HCSO) The ‘MTE (Mother Tongue per Ethnicity)-index’ of an ethnic group is calculated as the number of the group members affiliated with ‘mother tongue’ category per 100 group members affiliated with ‘ethnicity’ category. 2 The ’homogeneity index’ of an ethnic group is calculated as the number of the group members affiliated with at least one census category per 100 group members affiliated with all the census categories. Besides the hectic change in the number of the minority groups, their age structure is also characterized by signicant modications as seen in the past censuses (Table 3). Though the age structure of some of the main minority groups (e.g. Croats, Slovaks, Slovenians) reects the effects of intergenerational assimilation, in other cases (e.g. Germans and the micro-minority communities) the ethnic identity of the young-middle generation often become stronger. After the turn of the millennium mostly urban regions were characterized by this 'rediscovery' of ethnic roots, which meant a signicant transformation compared to the past period, when the persons moving to cities got almost completely assimilated during a generation (Szarka 2003a. 296). Researching the Roma population reveals somewhat different patterns, although their data analysed on the local level showed the most visible changes. According to census results only the minor part (around 40%, though this rate is rather diverse in space and time) of the persons regarded to be Roma by the non- 92 P.Tátrai Roma declares any kind of Roma attachment or identity. But in contrast with other minorities, this uctuation is to be examined mainly off the framework of symbolic ethnicity, primarily due to the diversity of Roma identity constructions and their stigmatized being. The currently intensifying Roma self-classication as Roma thus reects their increasing exclusion from the majority society. In the above an attempt was made to underpin that the increasing number of minorities is to be interpreted in the frameworks of double attachment, hybridity and symbolic ethnicity rather than assimilation/dissimilation. Double attachment and hybridity explain the self-identication of the people who have both Hungarian and minority identities, are attached to both cultures, use the minorityrelated institutions and attend minority events. The theory of symbolic ethnicity seems to be a useful approach in case of people who, as the result of assimilation processes, have primarily Hungarian ethnolinguistic afliation, but they keep tally on their minority roots as well, even though in their everyday life they are hardly or not at all in contact with the minority culture and institutions. However, both statistics and eld research proved that besides the above approaches assimilation is also a rather important factor nowadays, which still results in identity change of minorities. The data on the language use show the continuous linguistic assimilation of minorities and the ageing of the minority language users, while the ethnic data reect ethnic assimilation, mainly in the traditional settlement area of the minority ethnic groups (Figure 1 and 2). Focusing on the Hungarians, the assimilation hypothesis is strengthened by the slight increase in the rate of Hungarians (97.8%-98%) between the 2001 and 2011 census among those who declared any ethnic afliation (Kapitány 2013. 33). As a conclusion the present paper claims that in contemporary Hungary double attachment, hybridity, symbolic ethnicity and assimilation are simultaneously existing phenomena acting oppositely. Persons not declaring ethno-linguistic afliation Starting with the 2001 census, it is not compulsory to provide answers for questions concerning ethno-linguistic afliation in Hungary. In 2001 only 541–629 thousand persons (5.3–6.2% of the population depending on the census category) took this opportunity, but their number signicantly increased by 2011, to 1443–1487 thousand persons, which was the 14.5–15% of the population. This trend fully aligns with the regional tendencies, as for example 25% and 7% of the population in the Czech Republic and Slovakia did not reply to these questions as well. Károly Kocsis (2005. 9) presumed two main causes in the background of the undeclared ethnicity: the weakening of national consciousness and the diminishing importance of ethnic belonging. At the same time Balázs Kapitány (2013. 28–29), based on examples from the Carpathian Basin, highlighted another four possible factors inuencing this phenomenon: the hidden minority identity; the enumerators' intentional sabotage of registrating some people afliated with certain minorities; the extensive mistrust of the census and supplying of data in general; and the diminishing willingness to answer these questions due to the selfcompletion census questionnaires. Although all of the above mentioned factors could have a greater or lesser impact, in our view only the latest two factors could have a really signicant effect. Transformations of the ethnic structure in Hungary 93 After examining the reasons, it is also a worth reviewing what is known about the group of persons who did not reply ethno-linguistic questions in 2011. Most of all, they are a rather heterogeneous group. Their geographical distribution is quite even, there is only a coherent area of small villages in North East Hungary characterised by high willingness to respond. Relating to this, it can be concluded that generally the larger the settlement, the lower the proportion of non-responding residents: while in villages with less than 500 inhabitants only 8.7% of the residents did not answer, this value increase to 16.7% in cities with more than 100 thousand inhabitants. In contrast to the 2001 census, the local level data of the 2011 census does not reveal a strikingly high number of non-respondents in localities with high minority population. The age structure of the non-respondents is somewhat younger than that of the total population. Other differences along education, economic activity and employment do not seem relevant in this issue. On the whole, the non-respondents may be differentiated along two factors: the size of the settlements and the age of the respondents (thus young urban residents responded the least, and elderly persons living in small villages responded the most often), however the differences are not outstanding. Conclusions The interpretation of the ethnic processes taking place between the latest two censuses is a complex mission. Stating that the number of the minority afliated population has increased or decreased are both true, depending on the category taken into consideration or on the basis of the comparison (the total population, or the ones that give substantive responses). Thus it can be concluded that the ethnic self-classication of the minorities and the willingness to respond depend as much on the methodology of the census as on the actual social relations. Analyzing the changes in the ethnic composition it is visible that the signicant part of the former tendencies, based of the 2001 census, has been continued. Out of these László Szarka (2003b. 414-416) highlighted four major points: the minority groups have increased in number; the role of the mother tongue and the ethnicity has been interchanged; the geographical distribution of the minority groups has changed signicantly (moving to cities, decreasing concentration); the role of assimilation and double attachments is simultaneously important. Based on the 2011 census it can be concluded that these processes still go on, but some factors have gained bigger importance. Out of these factors the (international) migration plays the most important and growing role including one of its new forms, the cross-border suburbanisation. The second special character of the period between 2001 and 2011 was that the number of persons with minority attachment was growing, even though several factors anticipated its decrease: (1) based on the eld research the examined period can be characterised with continuous assimilation; (2) the modications of the research methods used in census should have resulted in a diminishing number of ethnic minorities; (3) the migration gain of the minorities and (4) the natural reproduction of the Roma was not so signicant that it would explain the growth. This contradiction can be resolved by the theory of symbolic ethnicity, which means that, in our view, the great majority of the persons who have minority afliation is not attached through mother tongue, culture or 94 P.Tátrai use of institutions to a certain ethnic group, but only by their subjective declaration, therefore the growth seen in the statistical data should not labelled as 'ethnic rebirth'. Our supposition is underpinned by most of the statistical indices (e.g. the uctuation of the data, the growing gap between the data of 'mother tongue' and 'ethnicity' categories). However, recent ethnic processes can not be solely interpreted by the theory of symbolic ethnicity. The present paper argues that on the one hand the number of persons with minority afliation is positively inuenced by the symbolic ethnic, double and hybrid identities, on the other it is decreased by the assimilation (in general to Hungarians). Regarding this issue, it should be stressed that the Roma population, increasing due to their positive natural reproduction and their intensifying selfclassication as Roma, differs nearly in all aspects from the other ethnic groups. By 2011, the balance of the above factors manifested in signicant increase in the number of ethnic minorities compared to the previous periods. Studying the ethnic processes pointed out the signicant differences or even cleavages within most of the ethnic groups. Hence it is essential to distinguish subgroups within ethnic groups: the rather assimilated communities living in their traditional settlement area and the newly immigrated, less assimilated communities living off their traditional land. These differences are manifested both in ethnic, language use and demographic data. Beyond the autohthonousallochthonous dichotomy there exist other cleavages within the ethnic groups. For example Judit Durst's research on Roma women's fertility revealed considerable differences. Even within the same settlement, different strategies were observed between Roma groups; some live in “traditional”, big family with many children, but some tend to follow non-Roma fertility patterns with only one or two children (Durst 2010). Taking into consideration all of these phenomena, it seems clear that the ethnic groups are not homogenous, unitary groups; furthermore the declaration of double attachment in census stretches and blurs the ethnic boundaries even in statistical sense. Thus, as a conclusion, this study revealed, what antropologists and sociologists (e.g. Barth 1969; Jenkins 1997; Brubaker 2002) have already emphasised, namely that people classied as part of a certain statistical group are characterized by heterogenous features. Accordingly, ethnic groups should not be reied “as if they were internally homogeneous, externally bounded groups, even unitary collective actors with common purposes” (Brubaker 2002. 164). Considering the above, it is worth rethinking also from statistical point of view the relationship between the ethnic groups and the categories associated with them. References Anderson, B 1991, Imagined Communities. Reection on the Origin and Spread of Nationalism, Verso, London. Balogh, P 2013, 'Sleeping abroad but working at home: cross-border residential mobility between transnationalism and (re)bordering', Geograska Annaler: Series B, Human Geography, vol. 95, no. 2, pp. 189–204. Barth, F 1969, 'Introduction', in F Barth (ed), Ethnic Groups and Boundaries: The Social Organization of Culture Difference, George Allen & Unwin, London, pp. 9–38. Bartha, Cs, Borbély, A, Erb, M & Uhrin, E 2013, 'A generációs nyelvátadás mint Transformations of the ethnic structure in Hungary 95 nyelvmegorzési univerzálé: egy XXI. századi összehasonlító szociolingvisztikai vizsgálat eredményeibol', in Cs, Fedinec, Z, Ilyés, A, Simon & B, Vizi (eds), A közép-európaiság dicsérete és kritikája, Kalligram, Pozsony, pp. 557–576. Bhabha, H 1994, The Location of Culture, London, Routledge. Bindorffer, Gy 2001, 'Kettos identitás. Etnikai és nemzeti azonosságtudat Dunabogdányban', Új Mandátum & MTA Kisebbségkutató Intézet, Budapest. Brubaker, R 1996, Nationalism Reframed: Nationhood and tbe National Question in the New Europe, Cambridge University Press, Cambridge. Brubaker, R 2002, 'Ethnicity without groups', European Journal of Sociology, vol. 43, no. 2, pp. 163–189. Durst, J 2010, '“What Makes Us Gypsies, Who Knows…?!”: Ethnicity and Reproduction', in M Stewart & M Rövid (eds), Multi-disciplinary Approaches to Romany Studies, CEU Press, Budapest, pp. 13–34. Gans, H 1979, 'Symbolic ethnicity: The future of ethnic groups and cultures in America', Ethnic and Racial Studies, vol. 2, no. 1, pp. 1–20. Gans, H 2008, 'Reections on symbolic ethnicity', Ethnicities, vol. 9, no. 1, pp. 123–130. Gielis, R 2009, 'Borders Make the Difference: Migrant Transnationalism as a Border Experience', Tijdschrift voor Economische en Sociale Geograe, vol. 100, no. 5, pp. 598–609. Gödri, I 2010, 'The role of ethnicity and social capital in immigration to Hungary', Working Papers on Population, Family and Welfare, no. 12, Demographic Research Institute, Hungarian Central Statistical Ofce, Budapest. Hardi, T 2012, 'Cross-border suburbanisation: The case of Bratislava', in T Csapó & A Balogh (eds), Development of the Settlement Network in the Central European Countries: Past, Present, and Future, Springer Verlag, Berlin & Heidelberg, pp. 193–206. Hungarian Central Statistical Ofce censuses, viewed on 21 February 2015, www.ksh.hu/nepszamlalas/?langcode=en Homišinová, M 2008, 'Identitás, nyelvhasználat, asszimiláció', MTA Kisebbségkutató Intézet & Gondolat, Budapest. Jagodič, D 2011, 'Cross-border residential mobility in the context of the European Union: the case of the Italian–Slovenian border', Razprave in gradivo/Treatises and Documents, vol. 65, pp. 60–87. Jenkins, R 1997, Rethinking Ethnicity, London, Sage. Kapitány, B 2013, 'Kárpát-medencei népszámlálási körkép', Demográa, vol. 56, no. 1, pp. 25–64. Kertzer, DI & Arel, D 2002, 'Censuses, identity formation, and the struggle for political power', in DI Kertzer & D Arel (eds), Census and Identity. The Politics of Race, Ethnicity, and Language in National Censuses, Cambridge University Press, Cambridge, pp. 1–42. Kocsis, K 2005, 'Changing ethnic patterns in the Carpatho-Pannonian region (1989-2002)', Minorities Research, vol. 7, pp. 8–28. Kocsis, K & Bottlik, Zs 2009, 'Magyarország etnikai térképe – Ethnic Map of Hungary', MTA Földrajztudományi Kutatóintézet, Budapest. Kovács, É 2002, 'Az asszimiláció ambivalenciái', Korall, vol. 10, pp. 200–207. Kozma, I 2007, 'Identitás-repertoárok a magyarországi örmények, ruszinok és lengyelek körében', in Gy Bindorffer (ed), Változatok a kettos identitásra, Gondolat & MTA Kisebbségkutató Intézet, Budapest, pp. 255–300. Lampl, Zs 2010, 'Túl a város peremén. Esettanulmány a Pozsonyból kiköltözött fels csallóközi és Rajka környéki lakosságról', in T, Hardi, M, Lados & K. Tóth (eds), Magyar–szlovák agglomeráció Pozsony környékén, Gyor & Somorja, MTA RKK NYUTI & Fórum Kisebbségkutató Intézet, pp. 77–131. Lovas Kiss, A 2011, The impacts of the European Union accession to the situation and the economic, social structure of several settlements of the Region of Bihar, Department of Ethnography, University of Debrecen, Debrecen. Nagy, E 2013, '„Határtalan” stratégiák és változó falu–város viszonyrendszer: a 96 P.Tátrai szuburbanizációs folyamatok mozgatórugói a magyar–román határtérségben', Településföldrajzi Tanulmányok, vol. 2, no. 1, pp. 32–51. Pásztor, IZ & Pénzes, J 2012, 'Spatial distribution and demographic trends of the Roma population in Northeastern Hungary', in J Pénzes & Zs Radics (eds), Roma population on the peripheries of the Visegrad countries, Didakt, Debrecen, pp. 60–76. Slavík, V, Grác, R, Klobučník, M & Kohútová, K 2011, 'Development of Suburbanization of Slovakia on the Example of the Bratislava Region', in T Marszal (ed), Urban Regions as Engines of Development, Warszawa, Polish Academy of Science, Commitee for Spatial Economy and Regional Planning, pp. 35–58. Strüver, A 2005, 'Spheres of transnationalism within the European Union: on open doors, thresholds and drawbridges along the Dutch–German border', Journal of Ethnic and Migration Studies, vol. 31, no. 2, pp. 323–343. Szarka, L 2003a, 'Etnikai változások a déli szláv kisebbségeknél', in N Kovács & L Szarka (eds), Tér és terep. Tanulmányok az etnicitás és az identitás kérdéskörébol II, Budapest, Akadémiai Kiadó, pp. 285–311. Szarka, L 2003b, 'A 2001. évi magyarországi népszámlálás nemzetiségi adatairól', in N Kovács & L Szarka (eds), Tér és terep. Tanulmányok az etnicitás és az identitás kérdéskörébol II, Budapest, Akadémiai Kiadó, pp. 411–416. Szilágyi, NS 2004, 'Az asszimiláció és hatása a népesedési folyamatokra', in T Kiss (ed), Népesedési folyamatok az ezredfordulón Erdélyben, Kolozsvár, RMDSZ Ügyvezeto Elnöksége, pp. 157–234. Tóth, Á & Vékás, J 2005, 'Lojalitás és szolidaritás. Államhatalmi homogenizálódás vagy a keresztkötodések erosödése?', in N, Kovács, A. Osvát & L. Szarka (eds), Etnikai identitás, politikai lojalitás, Budapest, Balassi Kiadó, pp. 123–149. Tóth, Á & Vékás, J 2009, 'Borders and Identity', Hungarian Statistical Review, vol. 87, no. 13, pp. 3–31. Tóth, Á & Vékás, J 2013, 'A magyarországi nemzetiségek létszámváltozása 2001 és 2011 között', Statisztikai Szemle, vol. 91, no. 12, pp. 1256–1267. Tóth, G & Kincses, Á 2010, 'Regional distribution of immigrants in Hungary', Hungarian Geographical Bulletin, vol. 59, no. 2, pp. 107–130. van Houtum, H & Gielis, R 2006, 'Elastic migration: the case of Dutch short-distance transmigrants in Belgian and German borderlands', Tijdschrift voor Economische en Sociale Geograe, vol. 97, no. 2, pp. 195–202. Virág, T 2006, 'The regional ghetto', Review of Sociology of the Hungarian Sociological Association, vol. 12, no. 1, pp. 51–70. Waters, MC 1996, 'Optional Ethnicities: For Whites Only?', in S Pedraza & R Rumbaut (eds), Origins and Destinies: Immigration, Race and Ethnicity in America, Wadsworth Press, Belmont, pp. 444–454.


© Copyright 2026