
California Self-Help Counties and Transportation Funding
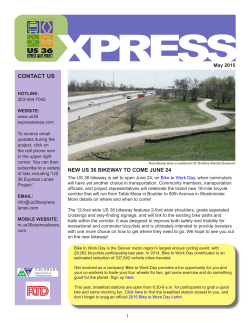
California Self-Help Counties and Transportation Funding 2015 IBTTA Washington Briefing Tuesday, March 31, 2015 Michael Blomquist Toll Program Director Riverside County Transportation Commission Traditional Transportation Funding Not keeping up with transportation needs CA revenue to cover only 45% of costs Local revenues: $158.4 billion 65% of CA total California Transportation Revenue Shortfall, 2011-2020 600 500 400 300 Source: 2011 Statewide $538 billion Transportation System Needs Assessment, 2011-2020 $242 billion 200 100 0 Revenue Costs California’s Need: Significant, Steady Funding California’s Response: Go Local CA needs funds for an efficient system Freeways, rail, transit, bikes/pedestrians Goods movement: ports to rail and trucks Personal mobility: accessible, quality of life Local Response Local sales taxes Dedicated portion for transportation Local tolls User pays for use Self-Help Counties Coalition Founded in the 80’s, 20 agencies 81% of CA’s pop. included (30M) Each with a sales tax program Voter approved, 2/3 vote Tax dedicated to transportation State Board of Equalization collects sales tax Transfers transportation portion to each county Administrative fee Self-Help Counties Coalition Project Funding $3-4 billion generated annually $95 billion estimated spending over the next 28 years Variety: freeways, mass transit, active transportation, etc. Tailored: Each agency’s sales tax program meets local needs Riverside County Riverside County: Measure A Riverside County Transportation Commission created in 1976 Administers Measure A funding; county transportation services 32-member board, small staff 1988: Original Measure A 78.9% voter approval 20-year plan (1989-2009) 2002: Extension of Measure A 30-year plan (2009-2039) Estimated revenue: $4.7 billion Measure A Half-Cent Sales Tax Revenue $180.0 $160.0 Millions $140.0 $120.0 Actual $100.0 $80.0 Projection $60.0 $40.0 $20.0 $- Budget Why do Voters Support These Sales Tax Measures? Accountability Oversight by local elected officials Access to local officials - RCTC Board composition Citizen’s Oversight Committee Transparency Published expenditure plan – tangible projects Specific project and program commitments Promises made, PROMISES KEPT Responsibility Small staff, small administrative costs – 1% cap Why Local Tolling? Finite funding Tolling precedent • Measure A sales tax can’t fund it all • Gas tax erosion • Highway Trust Fund uncertainty • CA state fund limits • User-based financing • Southern California • National Build more improvements Access other financing sources • Leverage Measure A revenue • Meet voter commitments • Toll revenue bonds • Federal loans (TIFIA) San Francisco Bay Area • • • • • • • • • • • Golden Gate Bridge I-680 Express Lanes Antioch Bridge Benicia-Martinez Bridge Carquinez Bridge Dumbarton Bridge Richmond-San Rafael Bridge San Francisco-Oakland Bay Bridge San Mateo-Hayward Bridge I-880 Express Lanes SR 237 Express Lanes Existing Facilities San Francisco Monterey Los Angeles County • I-10 • I-110 Metro Express Orange County • • • • • SR 73 Toll Road SR 133 Toll Road SR 241 Toll Road SR 261 Toll Road SR 91 Express Lanes Ventura San Los Angeles Bernardino Orange Riverside San Diego San Diego County • I-15 Express Lanes • SR 125 South Bay Expressway San Francisco Bay Area • • • • • • • • • • • Golden Gate Bridge I-680 Express Lanes Antioch Bridge Benicia-Martinez Bridge Carquinez Bridge Dumbarton Bridge Richmond-San Rafael Bridge San Francisco-Oakland Bay Bridge San Mateo-Hayward Bridge I-880 Express Lanes SR 237 Express Lanes Monterey County Existing and Planned Facilities San Francisco San Francisco Bay Area • I-580 Express Lanes • SR 237 Extension • I-680 Southern Segment, Sunol Northbound, Contra Costa County Northern Segment • I-880 Express Lanes • SR 85 Express Lanes • U.S. 101 • I-80 Express Lanes Riverside County • SR 156 Toll road Ventura County • U.S. 101 HOT Lanes Los Angeles County • I-10 • I-110 Metro Express Orange County • SR 241/91 Express Lanes Connector • SR 241 Toll Road Extension • I-405 Express Lanes Orange County • • • • • SR 73 Toll Road SR 133 Toll Road SR 241 Toll Road SR 261 Toll Road SR 91 Express Lanes • RCTC 91 Express Lanes Extension • RCTC I-15 Express Lanes Monterey Los Angeles County • • • • I-5 Express Lanes I-405 Express Lanes SR 710 Bypass High Desert Corridor Ventura San Los Angeles Bernardino Orange Riverside San Diego San Bernardino County • I-10 Express Lanes • I-15 Express Lanes • High Desert Corridor San Diego County • SR 11/Otay East Border Crossing • I-805 Managed Lanes • I-5 Managed Lanes • SR 78 Managed Lanes San Diego County • I-15 Express Lanes • SR 125 South Bay Expressway RCTC and Tolled Express Lanes RCTC to operate and maintain in Riverside County Established customers: 64% of existing 91 Express Lanes customers live in Inland Counties Extend proven 91 Express Lanes – seamless : one account, one transponder Construct new I-15 Express Lanes Toll revenue used to construct, operate & maintain 91 Project Financing Tolls Measure A sales tax Express Lanes General Purpose Lanes General Purpose Lanes Toll Revenue Bonds Sales Tax - Bonds • Tax-Exempt (Current Interest Bonds and Capital Appreciation Bonds) • Investment grade ratings • Tax-Exempt Sales Tax Bonds (Current Interest Bonds) • Strong AA ratings Federal TIFIA Loan Sales Tax – Pay-as-you-go • Maximum of $451 million approved by TIFIA Credit Council • Investment grade rating • Predevelopment costs • Additional contributions during construction 91 Project Financing RCTC Measure A Sales Tax Contributions Amount Pre-Development Sales Tax (2007-13) $73,597,000 Sales Tax Bonds (2013) $462,200,000 Pay-as-you-Go Sales Tax (>2013) $134,452,000 $670,249,000 Type of Debt Amount Interest Rate Toll Revenue Bonds $176,655,000 6.28% Measure A Sales Tax Bonds $462,200,000 4.54% Federal TIFIA Loan $421,054,000 3.47% $1,059,909,000 4.41% (weighted avg.) Summary Benefits of Local Sales Taxes, Local Tolls Significant and Steady fund sources Mobility: increased ability to move people and goods Voter Accountability and Voter Confidence in programs Sales tax programs are Single Purpose and Mode Neutral Local choice - Constituent Approved and Locally Controlled Job creation: local infrastructure spending creates local jobs


© Copyright 2026