
Health Indicators El Paso County 2012 Report
El Paso County
Health Indicators
2012 Report
Table of Contents
Introduction...............................................................................................3
Acknowledgements .................................................................................................4
Methodology............................................................................................................5
Health Disparities....................................................................................................6
Who We Are: El Paso County Demographic and Socioeconomic Data.....................8
Morbidity and Mortality Data..................................................................................13
Health Indicators:
Access to Care.......….......................................................................................17
Environmental Health..................................................................................20
Food Safety.....................................................................................................23
Healthy Eating and Active Living...................................................................26
Mental Health and Substance Abuse.............................................................32
Motor Vehicle Injuries ..................................................................................36
Oral Health....................................................................................................39
Tobacco Use...................................................................................................41
Unsafe Sexual Practices and Teen Pregnancy................................................44
Vaccine-Preventable Infectious Diseases......................................................48
Glossary of Terms...................................................................................................51
El Paso County Health Indicators 2012 Report
Page 2
Introduction
Welcome to the El Paso County
Health Indicators 2012 Report.
This report provides objective
information regarding the
health of our residents and
identifies health trends and/or
issues that may be of concern
in our county. This report was
compiled by the El Paso County
Public Health epidemiology
staff, who collected, verified,
and analyzed populationbased health data. In order
to assure that the health data
presented in this report was
relevant and understandable to
the community, Public Health
convened a community group
to review and provide feedback.
This group, called the Healthy
Community Collaborative
(HCC), is comprised of health
leaders, elected officials, and
interested citizens from our
community. We are grateful
to have had the guidance and
support of the HCC for this
process.
The HCC will continue to
provide leadership as we work
together to create a Community
Health Improvement Plan
(CHIP) that will help guide
efforts towards improving
health in the community.
The HCC will identify health
focus areas for intervention;
target resources to address
health issues; guide outreach
to disparate populations; and
determine what strategies can
be implemented to positively
influence health outcomes. The
CHIP will be released in 2012
and will provide a road map for
improving the health of El Paso
County residents.
This is an exciting time for El
Paso County to demonstrate our
success as a health leader in the
state and in the nation.
Throughout this health
assessment process, Public
Health has been aligning
its work with Colorado’s 10
Winnable Battles, which
represent key public health
and environmental issues in
the state where progress can
be made in the next five years.
In our county, Public Health
and the HCC will be seeking
opportunities to team up with
the Colorado Department of
Public Health and Environment
and other regional partners
in order to share ideas and
resources as they relate to
achieving common goals in
these areas.
If you have any questions about
this report or would like to
join the HCC and help improve
the health and wellbeing of
our county, please contact us
at [email protected].
Thank you.
Jill Law, R.N., B.S.N.
Interim Public Health Director
Bernadette Albanese, M.D., M.P.H.
Medical Director
El Paso County Public Health
Colorado’s 10 Winnable Battles
are:
■ Clean Air
■ Clean Water
■ Infectious Disease Prevention
■ Injury Prevention
■ Mental Health and Substance Abuse
■ Obesity
■ Oral Health
■ Safe Food
■ Tobacco
■ Unintended Pregnancy
“The mission of El Paso County Public Health
is to protect and promote public health and
environmental quality in the community
through people, prevention, and partnerships.”
El Paso County Health Indicators 2012 Report
Page 3
Acknowledgements
El Paso County Public Health gratefully acknowledges Amy Anderson, M.P.H., Kelley
Vivian, Danielle Oller, M.F.A., Susan Wheelan, M.B.A., Kandi Buckland, R.N., M.P.A., and
Kathy Rice, M.S. for their invaluable work and input into this report. We also extend a
special thank you to Dr. Alyson Shupe and her staff at the Colorado Department of Public
Health and Environment (CDPHE) Health Statistics Section; CDPHE’s Office of Planning
and Partnerships; as well as many other programs at CDPHE for their data contributions,
expertise, and technical assistance during this process.
El Paso County Public Health is also appreciative of members of the Healthy Community
Collaborative (HCC), who provided vital insight and feedback about the content of this report.
The HCC is a stakeholder group of community partners who came together in 2011 to create
an action plan to improve the health of the people of El Paso County. HCC membership
includes representatives from schools, hospitals and health systems, non-profit organizations,
city and county government agencies, public health, medical providers, and interested
citizens.
El Paso County Health Indicators 2012 Report
Page 4
Methodology
Data Sources
Population-based health data
is routinely and systematically
collected by a number of
national and state agencies.
Information on birth, death,
disease, injury, hospitalization,
health-risk behaviors,
and sociodemographic
characteristics are accessible
either at the county level for El
Paso County or at the state level
for Colorado. Data for the El
Paso County Health Indicators
2011 Report was obtained
primarily from standardized
data sources, which included:
Population counts and other
administrative data
▪▪Colorado State
Demography Office
▪▪Colorado Department of
Labor and Employment
▪▪Colorado Department of
Education
Birth and death data
▪▪Colorado Department
of Public Health and
Environment
Socioeconomic data
▪▪United States Census Bureau
▪▪Colorado Department of
Labor and Employment
Disease or injury surveillance
data
▪▪Colorado Department
of Public Health and
Environment
▪▪National Highway Traffic
Safety Administration
▪▪Colorado Hospital
Association
Health survey data
▪▪American Community
Survey (ACS)
▪▪Behavioral Risk Factor
Surveillance System
(BRFSS)
▪▪Colorado Child Health
Survey
▪▪Colorado Health Access
Survey (formerly, Colorado
Household Survey)
▪▪National Immunization
Survey (NIS)
▪▪National Survey on Drug
Use and Health
▪▪Pregnancy Risk Factor
Monitoring System
(PRAMS)
▪▪Youth Risk Behavior
Surveillance System
(YRBS)
Note: This is not an exhaustive
list of all data sources used
in this report. Citations are
provided at the end of each
chapter with references to the
original data source.
Technical Notes
▪▪County versus state level
data—Some of the data was
only available at the state level
due to sampling limitations,
and those values are used as
surrogate measures where
county level data was not
available.
▪▪Combining years of data—In
some instances when analyzing
county level data, multiple
years of data were combined to
provide more stable estimates,
particularly when using health
survey data. These estimates
represent an annual average
during the specified time
frame, usually no more than
five years.
▪▪Margin of error (see
Glossary of Terms)—When
measurements are calculated
from a sample of people within
a population, these values are
subject to a level of uncertainty
or error. This uncertainty can
be represented through the
use of a margin of error, which
indicates a range of values for
which there is a 95 percent
probability of containing
the true value for the entire
population.
In this report, many of the
data values presented have
a margin of error. However,
for ease of reading and
presentation, margins of error
were only included when
making notable comparisons
(particularly when describing
health disparities). Error bars
are included on some figures in
the report and these represent
the (95 percent) upper and
lower limits of the margin of
error. When comparing values
between groups of a population
or across time periods, if
margin of errors overlap
then there is no statistically
significant difference between
the measured values.
Alternatively, if margin
of errors do not overlap,
then there is a statistically
significant difference between
the measured values. ▪
El Paso County Health Indicators 2012 Report
Page 5
Health Disparities
Health disparities, also referred
to as health inequities, are
differences in the occurrence
of disease or health conditions,
health outcomes, risk factors, or
access to health care based on
demographic or socioeconomic
characteristics of subgroups
of a population.1 In order to
interpret health disparities
within a population, it is critical
to understand root causes
and contributing factors that
influence health behaviors and
health outcomes. These factors
have been characterized as the
‘social determinants of health.’
The World Health Organization
defines the social determinants
of health as “the circumstances
into which people are born, live,
work, and age; and the systems
put in place to deal with illness.
These circumstances are in turn
shaped by a wider set of forces:
economics, social policies, and
politics.”2
The Colorado Department of
Public Health and Environment
(CDPHE) created a health
equity model that defines
many social determinants of
health and how they impact
health behaviors across the life
course (Figure 1).3 Life course
spans from pregnancy through
childhood, adolescence, and
adulthood. The right side
of the model represents the
summary health outcome
measures commonly used to
describe population health
(for example, death rates from
cardiovascular disease, rates
of obesity, or life expectancy).
The remainder of the model
depicts the various social,
economic, and environmental
factors impacting decisions
people make about their health
Health Equity
An Explanatory Model for Conceptualizing the Social
Determinants of Health
NATIONAL INFLUENCES
GOVERNMENT POLICIES
U.S. CULTURE & CULTURAL NORMS
LIFE COURSE
PREGNANCY
EARLY
CHILDHOOD
CHILDHOOD
ADOLESCENCE
ADULTHOOD
OLDER ADULTS
SOCIAL DETERMINANTS OF
HEALTH
ECONOMIC
OPPORTUNITY
PHYSICAL
ENVIRONMENT
• Income
• Employment
• Education
• Housing
Built
Environment
– Recreation
– Food
–Transportation
Environmental
quality
– Housing
– Water
– Air
Safety
SOCIAL
FACTORS
• Participation
• Social support
• Leadership
• Political
influence
• Organizational
networks
• Violence
• Racism
+
HEALTH
FACTORS
HEALTH
BEHAVIORS &
CONDITIONS
• Nutrition
• Physical
activity
• Tobacco use
• Skin cancer
• Injury
• Oral health
• Sexual health
• Obesity
• Cholesterol
• High blood
pressure
MENTAL
HEALTH
• Mental health
status
• Substance
abuse
• Functional
status
El Paso County Health Indicators 2012 Report
=
ACCESS ,
UTILIZATION
& QUALITY
CARE
• Health
insurance
coverage
• Received
needed care
• Provider
availability
• Preventive
care
POPULATION
OUTCOMES
QUALITY OF LIFE
MORBIDITY
MORTALITY
LIFE EXPECTANCY
Page 6
behaviors, which ultimately
have an affect on better or worse
health outcomes. The model
also illustrates the complex role
that health and mental health
conditions and access to care
have on health outcomes. In
total, the model is intended to
highlight the multiplicity of
factors that have been shown to
play a role in health at both the
population and individual level.
Health disparities are rooted
in differences based on social
determinants of health,
which help explain why
certain populations have a
disproportionate share of
disease burden. Identifying
health disparities defines
those people in a population
that are at higher risk for
worse health outcomes. For
example, circumstances in
early life can have a profound
effect on health at all ages.
Inadequate education can
limit employment options
during early adulthood, which
could lead to substantially
lower family income, causing
a family to live in a poorer
neighborhood that does not
have easy access to healthy food
outlets, which in turn impacts
eating behaviors that result
in higher obesity rates among
people with lower educational
attainment. Additionally, these
socioeconomic conditions may
contribute to having poor access
to care or undertaking other
high risk health behaviors, such
as cigarette smoking.
Why Health Disparity Matters
Achieving good health in a
community is dependent upon
identifying which people are
affected by health disparities
and engage in high risk
behaviors. Understanding what
has an effect on unhealthy
behavior is instrumental to
designing and implementing
successful programs to
improve health outcomes.
Positive change may require
intervention directed not
only at certain people within
a population, but at policies
that support change in social,
economic, or environmental
circumstances within a
community.
Health disparities or inequities
are present in El Paso County.
In this report, differences in
health behaviors, outcomes, or
risk are presented by age, sex,
race/ethnicity, income status,
and/or educational attainment
in order to highlight where
disparities exist. In the section
containing socioeconomic
data for El Paso County, maps
are included to illustrate
where people who may have
health disparities live in the
county. Presenting data in this
manner is intended to help
identify where and with whom
focused efforts are needed to
have significant and sustained
progress in improving health. ■
The World Health
Organization
defines the social
determinants of
health as “the
circumstances into
which people are
born, live, work,
and age; and the
systems put in place
to deal with illness.
These circumstances
are in turn shaped
by a wider set of
forces: economics,
social policies, and
politics.”
National Cancer Institute [Internet]. Available from: http://crchd.cancer.gov/disparities/defined.html.
World Health Organization [Internet]. Available from www.who.int/social_determinants/thecommission/finalreport/key_concepts/en/index.html.
3
Colorado Department of Health and Environment [Internet]. Social Determinants of Health. Available from: www.coprevent.org/search/label/sdoh.
1
2
El Paso County Health Indicators 2012 Report
Page 7
Who We Are:
El Paso County Demographic and Socioeconomic Data
El Paso County is located in
the south central region of
Colorado. As of July 2010,
the county had an estimated
627,096 residents and the
population is projected to
reach nearly 1 million over the
next three decades (Figure
1).1 El Paso County is a mix of
urban, suburban, and rural
communities with about
two-thirds (419,353) of the
population residing within
the city of Colorado Springs.
The variation in population
density throughout the county
is demonstrated in Figure 2,
which indicates the number of
people per square mile.2
and other non-Hispanic races
comprise 6.3 percent and 4.8
percent of the total population,
respectively.1 Vital statistics
data showed that during 2010,
there were 9,187 live births and
3,530 deaths in El Paso County.4
El Paso County’s population
is comprised of 50.2 percent
females. The median age is 34.1
years, with 26.1 percent of the
population under the age of 18
years and 10.0 percent over the
age of 65 years (Table 1).1,3 The
racial and ethnic breakdown
in the county shows the
population to be predominantly
non-Hispanic white (73.9
percent), followed by 15.0
percent Hispanic of any race
(Figure 3); non-Hispanic black
El Paso County has a large
military presence, including
four military installations – Fort
Carson Army Base, Peterson
Air Force Base, Schriever Air
Force Base, and the United
States Air Force Academy. A
2011 report from the Greater
Colorado Springs Chamber of
Commerce estimates that these
four installations employ nearly
40,500 military personnel
and approximately 21,000
civilian/contract personnel.5
Three-quarters of military
personnel are estimated to
live in communities outside
the military bases. El Paso
County is home to 58 percent
of Colorado’s military retiree
population, according to this
report.
The median household income
in El Paso County was $51,548
in 2010 (Figure 4), with 19.1
percent of children younger
than 18 years and 10.4 percent
of families living below the
Census Bureau’s 2010 poverty
threshold.6 Families living in
poverty are more concentrated
in south Colorado Springs,
and south-central and eastern
El Paso County (Figure 5).
An estimated 8.9 percent
of households in El Paso
County received Supplemental
Nutrition Assistance Program
benefits (SNAP, formerly known
as food stamps) in 2010; among
households receiving SNAP,
56.2 percent were below the
poverty threshold and 60.3
percent included children
younger than 18 years of age.7
According to the Colorado
Department of Labor and
Employment, the average
unemployment rate in El Paso
County during 2011 was 9.5
percent.8
In 2010, 22.0 percent of El Paso
County residents ages 25 years
and older held a high school
diploma or equivalent as their
highest degree, and just over
one-third held a bachelor’s
degree or higher (Figure 6).9
El Paso County Health Indicators 2012 Report
Page 8
Figure 1. Population estimates and projected forecast,
El Paso County 2000 to 2040
1,000,000
984,019
900,000
800,000
Population
700,000
600,000
500,000
400,000
Estimate
627,096
Forecast
519,802
300,000
200,000
100,000
0
Year
Table 1. Age distribution of El Paso County population, 2010
Age
Under 18 years
18 to 24 years
25 to 44 years
45 to 64 years
65 years and older
The on-time graduation rate,
defined as the number of
students who completed high
school within four years, for the
class of 2010 was 78.4 percent.10
During the same academic year,
2.1 percent of seventh to twelfth
grade students dropped out of
school in El Paso County.
Number
163,425
68,648
170,547
161,656
62,820
Percent of population
26.1%
10.9%
27.2%
25.8%
10.0%
Spanish-speaking.9 Of those
speaking a language other than
English at home, 36.2 percent
were considered linguistically
isolated (defined as speaking
English “less than very well”). ▪
An estimated 11.0 percent of
people ages 5 years and older
in El Paso County spoke a
language other than English
at home in 2010, with more
than half (58.3 percent) being
El Paso County Health Indicators 2012 Report
Page 9
Figure 2. Population density (people/square mile), by census tract, El Paso County 2010
Figure 3. Hispanic population, percent by census tract, El Paso County 2010
El Paso County Health Indicators 2012 Report
Page 10
Figure 4. Annual household income, El Paso County 2010
$75,000 and higher
32.9%
$50,000-$74,999
19.4%
$25,000-$49,999
24.6%
Less than $25,000
23.2%
0
5
10
15
20
Percent of households
25
30
35
Figure 5. Percent of families below poverty threshold, by census tract,
El Paso County 2006 to 2010
El Paso County Health Indicators 2012 Report
Page 11
Figure 6. Educational attainment among adults ages 25 years and older,
El Paso County 2010
Graduate or professional degree
13.0%
Bachelor's degree
21.1%
Associate's degree
10.0%
Some college
26.8%
High school graduate
22.0%
Less than high school
7.2%
0
5
10
15
20
25
Percent of adults ages 25 years and older
30
Colorado State Demography Office [Internet]. Population Data. Available from: www.colorado.gov/cs/Satellite/DOLA-Main/CBON/1251593300013.
U.S. Census Bureau [Internet]. 2010 Census. Population, Housing Units, Area, and Density: 2010 – County – Census Tract (Table GCT-PH1). Available
from: http://factfinder2.census.gov/main.html.
3
U.S. Census Bureau [Internet]. 2010 Census. Profile of General Population and Housing Characteristics (Table DP-1). Available from:
http://factfinder2.census.gov/main.html.
4
Colorado Department of Public Health and Environment [Internet]. 2010 State and County Birth and Death Summary Tables. Available from:
www.chd.dphe.state.co.us/topics.aspx?q=Maternal_Child_Health_Data.
5
Greater Colorado Springs Chamber of Commerce [Internet]. Colorado’s Valuable National Assets: A brief look at Colorado’s military [April 2011].
Available from: www.coloradospringschamber.org/military/.
6
U.S. Census Bureau [Internet]. 2006-2010 American Community Surveys. Selected Economic Characteristics in the United States (Table DP03).
Available from: http://factfinder2.census.gov/main.html.
7
U.S. Census Bureau [Internet]. 2010 American Community Survey. Food Stamps/SNAP (Table S2201). Available from:
http://factfinder2.census.gov/main.html.
8
Colorado Department of Labor and Employment [Internet]. 2010 Local Area Unemployment Statistics. Available from:
http://lmigateway.coworkforce.com/lmigateway/default.asp.
9
U.S. Census Bureau [Internet]. 2010 American Community Survey. Selected Social Characteristics in the United States (Table DP02). Available from:
http://factfinder2.census.gov/main.html.
10
Colorado Department of Education [Internet]. 2009-2010 Colorado Education Statistics. Available from: www.cde.state.co.us/index_stats.htm.
1
2
El Paso County Health Indicators 2012 Report
Page 12
Morbidity and Mortality Data
of Healthy People 2020, the
decennial national public
health improvement plan, is
to improve the quality and
length of healthy lives among
Americans.1 Reducing disability,
injury, disease, and premature
death are key priorities in
achieving this goal. This section
provides data on general health
status, life expectancy, and
causes of death.
How is it measured?
Morbidity data quantifies the
occurrence of illness or disease
and mortality measures death.
In this section, self-reported
health status represents a
morbidity indicator and is
obtained from health surveys of
adults. Mortality indicators are
derived from death certificates,
and demonstrate disease
severity as well as differences
in the risk of dying between
subgroups of a population or
geographic area. Life expectancy
represents the average number
of years of life expected
after birth; while healthy life
expectancy is the average
number of years that a person
can expect to live in “good or
excellent health” – that is, in the
absence of significant disease,
injury, or disability. Years of
potential life lost is a measure
of premature mortality, which
is calculated as the estimated
number of years of life lost
among people in a population
who die before reaching a
given age. Deaths occurring
in younger persons contribute
more to this measure than
deaths among older persons.
How are we doing in El
Paso County?
In El Paso County, 10.6 percent
of adults ages 18 and older
reported being in fair or poor
health in 2009-2010, and
89.4 percent reported being
in good or better health.2 This
self-reported measure has high
correlation with actual health
status and mortality.3
Figure 1 shows the trend in life
expectancy for El Paso County
between 1987 and 2007.4 While
life expectancy has increased
overall in the past two decades,
sex and racial disparities remain
evident, particularly among
black males. This gap becomes
more apparent when examining
healthy life expectancy in
Colorado, where there are
substantial differences between
white, non-Hispanic persons
as compared to the white,
Hispanic or black populations
(Table 1).5 Among white, nonHispanic persons in Colorado,
approximately 9 percent of
one’s life is expected to be
spent in fair or poor health. In
comparison, for black persons
this proportion increases to
17 percent; and among white,
Hispanic persons, 23 percent
of one’s life is expected to be
in fair or poor health.6 For El
Paso County's population as a
whole, there is approximately
an eight year difference between
life expectancy (79.6 years) and
healthy life expectancy (71.7
years).
From 2007 to 2009, the three
Figure 1. Life expectancy, by sex and race,
El Paso County 1987 to 2007
85
80
81.2
79.5
77.3
Age (years)
One of the overarching goals
75
74.9
76.9
73.6
71.8
70
68.4
White male
White female
65
Black male
Black female
60
1987
1992
1997
El Paso County Health Indicators 2012 Report
2002
2007
Page 13
leading causes of death for all
ages in El Paso County were
cancer, heart disease, and
unintentional injuries
(Table 2).7 However, the impact
of certain diseases on mortality
may be better understood
when illustrated by age group
(Table 3).8 Infant mortality
is commonly attributed to
abnormal fetal development and
Sudden Infant Death Syndrome
(SIDS). For children and young
adults, preventable injuries
including accidents, homicide,
and suicide play a dominant
role. Cancer and chronic heart
or respiratory diseases emerge
as major causes of death in
the middle and older age adult
groups.
Preventable deaths substantially
contribute to premature
mortality, or deaths occurring
before an expected age. During
2007 to 2009, residents of
El Paso County experienced
significantly more premature
death than the Colorado
average (4,090.7 versus
3,713.9 age-adjusted years of
potential life lost per 100,000
population younger than age
65, respectively).9 In El Paso
County, an estimated 727.7
years of potential life were
lost annually per 100,000
population younger than age 65
due to accidents and 476.7 years
of potential life were lost due to
suicide. Other leading causes
of years of potential life lost
include cancer (572.0), heart
disease (404.8) and chronic
liver disease and cirrhosis
(112.4). ▪
Table 1. Life expectancy and healthy life expectancy, by race/ethnicity,
Colorado 2008 to 2010
Life expectancy (years)
Healthy life expectancy (years)
Total
80.0
71.0
White, non-Hispanic
80.2
73.0
White, Hispanic
79.2
61.1
Black
76.8
64.0
Table 2. Top 10 causes of death, El Paso County 2007 to 2009
Rank
Cause of death
Deaths per 100,000
population per year
1
Cancer
128.5
2
Heart disease
113.6
3
Unintentional injuries
38.7
4
Chronic lower respiratory diseases
38.0
5
Cerebrovascular diseases
33.1
6
Suicide
18.6
7
Alzheimer's disease
15.6
8
Diabetes mellitus
12.8
9
Chronic liver disease and cirrhosis
9.7
10
Influenza and pneumonia
9.4
El Paso County Health Indicators 2012 Report
Page 14
Table 3. Age-specific leading causes of death, El Paso County 2007 to 2009
Age group
Top 5 leading causes of death
Infants <1 year 1. Congenital malformations & chromosomal
abnormalities
2. Length of gestation & fetal malnutrition
3. SIDS
4. Complications of pregnancy, labor & delivery
5. Blood-related disorders
Ages 1 to 14 years 1. Accidents
2. Homicide
3. Cancer
4. Heart disease
5. Congenital malformations & chromosomal
abnormalities
Ages 15 to 24 years 1. Accidents
2. Suicide
3. Homicide
4. Cancer
5. Heart disease
Ages 25 to 44 years 1. Accidents
2. Suicide
3. Cancer
4. Heart Disease
5. Homicide
Ages 45 to 64 years 1. Cancer
2. Heart disease
3. Accidents
4. Suicide
5. Chronic liver disease & cirrhosis
Ages 65 years and 1. Cancer
older 2. Heart disease
3. Chronic lower respiratory diseases
4. Cerebrovascular disease
5. Alzheimer’s disease
“From 2007 to 2009,
the three leading
causes of death for
all ages in El Paso
County were cancer,
heart disease,
and unintentional
injuries. However,
the impact of certain
diseases on mortality
may be better
understood when
illustrated by age
group.”
U.S. Department of Health and Human Services, Office of Disease Prevention and Health Promotion [Internet]. Healthy People 2020. Available at
www.healthypeople.gov/2020/about/default.aspx.
2
Colorado Department of Public Health and Environment [Internet]. Colorado Health Information Dataset: 2009-2010 Behavioral Risk Factor
Surveillance System. Available from: www.chd.dphe.state.co.us/cohid/topics.aspx?q=Behavioral_Risk_Factors.
3
Jylhä M. What is self-rated health and why does it predict mortality? Towards a unified conceptual model. Soc Sci Med 2009;69:307-316.
4
Kulkami S, Levin-Rector A, Ezzati M, and Murray C. Falling behind: life expectancy in U.S. counties from 2000-2007 in an international context.
Population Health Metrics 2011; 9:16.
5
Colorado Department of Public Health and Environment (CDPHE). 2008-2010 Life Expectancy Estimates. Provided by CDPHE Health Statistics on
Sept 28, 2011.
6
Bol K. Living Longer? Living Better? Estimates of Life Expectancy and Healthy Life Expectancy in Colorado. Colorado Department of Public Health
and Environment Health Watch 2012; 82:1-12.
7
Colorado Department of Public Health and Environment [Internet]. Colorado Health Information Dataset: 2007-2009 Death Data. Available at
www.chd.dphe.state.co.us/cohid/topics.aspx?q=Death_Data.
8
Colorado Department of Public Health and Environment (CDPHE). 2007-2009 Age-Specific Leading Causes of Death. Provided by CDPHE Health
Statistics on Aug 17, 2011.
9
Colorado Department of Public Health and Environment (CDPHE). 2007-2009 Years of Potential Life Lost Estimates. Provided by CDPHE Health
Statistics on Oct 26, 2011.
1
El Paso County Health Indicators 2012 Report
Page 15
Health Indicators
▪ Access to Care
▪ Environmental Health
▪ Food Safety
▪ Healthy Eating and Active Living
▪ Mental Health and Substance Abuse
▪ Motor Vehicle Injuries
▪ Oral Health
▪ Tobacco Use
▪ Unsafe Sexual Practices and Teen Pregnancy
▪ Vaccine-Preventable Infectious Diseases
El Paso County Health Indicators 2012 Report
Page 16
Health Indicators
Access to Care
Access to health care
Other factors that impact an
commonly classified into
individual’s ability to access
private or public. In this report,
encompasses a broad concept
the
health
care
system
include
private insurance represents
related to the availability,
affordability, and accessibility of lack of transportation, long wait employer-sponsored, directtimes to get an appointment,
purchase, and military-based
health services.1 Those services
and difficulties with language or plans; while public insurance
may include preventive or
literacy.
represents federal and state
specialty care, and emergency
government-based public plans,
treatment. While having
How is it measured?
including Medicaid, Medicare,
health insurance provides a
While
health
insurance
does
and Child Health Plan Plus
gateway towards accessing the
not ensure access to care,
(CHP+). Individuals with
health care system, insurance
having some form of coverage
health insurance may still be
alone may not ensure the
is
a
widely
accepted
proxy
underinsured, which is defined
necessary levels of access.
for measuring health care
as having out-of-pocket medical
Insurance coverage must be
access.
Health
insurance
is
expenses that exceed an insured
comprehensive and affordable
in terms of out-of-pocket
expenses, and is dependent on
Figure 1. Health insurance coverage, by type,
having adequate numbers and
El Paso County 2011
types of providers who accept
an individual’s health insurance.
Health care providers should be
Other
geographically accessible and
0.5%
offer services adequate to meet
the needs of clients.
Uninsured
Private
12.5%
Evidence shows that uninsured
5.0%
individuals experience more
CHP+
adverse outcomes, including
0.9%
death, as compared to insured
individuals.2 Those without
Medicaid
Employerinsurance are more likely to be
8.8%
sponsored
younger, of minority race or
63.6%
ethnicity, unemployed, have
lower levels of education or
Medicare
income, and to smoke. These
8.9%
factors are co-contributors to
being uninsured that, in turn,
impact an individual’s ability
to seek care when needed, have
a regular source of care other
than in an acute care setting,
and maintain continuity of
care.3
El Paso County Health Indicators 2012 Report
Page 17
individual’s ability to pay from
usual sources of family income.
considered to be underinsured.
Medicaid and CHP+ are public
insurance programs for certain
groups of individuals and
families. Eligibility is based
upon requirements such as
age, income and assets, and
whether the individual is
pregnant, blind, or disabled.
Although El Paso County
has a higher proportion of
qualified individuals enrolled
in these programs overall
when compared to Colorado
(86.3 percent vs. 78.8 percent,
respectively), there are still
persons who qualify but remain
unenrolled. In El Paso County
in 2009, 10.3 percent (4,212)
How are we doing in El
Paso County?
Data from the 2011 Colorado
Health Access Survey showed
that about 13 percent of El Paso
County residents did not have
any form of public or private
health insurance (Figure 1).4
Most residents (63.6 percent)
were insured through an
employer-sponsored health plan
and nearly 19 percent reported
insurance coverage through a
public plan such as Medicaid or
Medicare. Of those with private
or public insurance for the past
12 months, 12.3 percent were
of children ages 18 years and
younger who were eligible for
either Medicaid or CHP+ were
not enrolled.5 Furthermore,
24.5 percent (3,104) of eligible
adults ages 19-64 years were not
enrolled in Medicaid.
Figure 2 shows the usual
source of care for those with
and without current health
insurance during 2011. Those
with insurance coverage
primarily visit doctor’s offices
or other private clinics (70.2
percent), whereas only 23.5
percent of uninsured individuals
identified such places as
their usual source of care.4 In
contrast, 44.0 percent of those
80
Percent
70
60
Community health center or
other public clinic
50
Doctor's office or private clinic
40
Hospital emergency room or
urgent care center
30
Other
Figure 2. Usual source of health
care, by insurance status,
El Paso County 2011
20
10
0
Insured
Uninsured
Insurance status
Cholesterol screening in past five
years, age 18+ (2009)
Sigmoidoscopy or colonoscopy ever,
age 50+ (2010)
Uninsured
PSA test in past two years, male age
40+ (2010)
Figure 3. Health screening of
adults ages 18 years and older,
by insurance status,
Colorado 2009 and 2010
Insured
Healthy People
2020
Pap smear in past three years, female
age 18+ (2010)
Clinical breast exam and mammogram
in past two years, female age 50+
(2010)
0
25
50
Percent
75
100
Note: Error bars represent the 95% margin of error
for each value.
El Paso County Health Indicators 2012 Report
Page 18
without coverage typically
sought care at emergency rooms
or urgent care centers, and 27.9
percent utilized community
health centers or other public
clinics.
The disparity of access between
insured and uninsured
individuals is further
demonstrated when examining
the utilization of preventive
health services. Colorado data
from 2009 and 2010 showed
that insured adults ages 18 years
and older are near or at the
Healthy People 2020 targets
for various health screenings
(Figure 3).6 However, the
proportion of uninsured adults
receiving the same services is
significantly lower than insured
persons.
Seeking care from a primary
care provider for routine
and preventive care often
is not an option for the unor underinsured. Beyond
insurance status, access to
primary care is dependent on
the proximity to and number of
providers in a community.1 The
rate of primary care physicians
per population in El Paso
County has been consistently
lower than the state average.
In 2010, there were 65 primary
care physicians per 100,000
population in Colorado, but
only 44 per 100,000 in El Paso
County.7 ▪
“44 percent of those without
insurance coverage typically sought
care at emergency rooms or urgent
care centers, and 27.9 percent
utilized community health centers or
other public clinics.”
Robert Wood Johnson Foundation [Internet]. 2011 County Health Rankings: Access to Care. Available from:
www.countyhealthrankings.org/health-factors/access-care.
2
Wilper AP, Woolhandler S, Lasser KE, et al. Health insurance and mortality in US adults. Am J Public Health 2009;99:2289-2295.
3
Institute of Medicine. America’s uninsured crisis: consequences for health and health care. Washington, D.C.: National Academies Press, 2009.
4
Colorado Health Access Survey, 2011. Denver, CO: The Colorado Trust.
5
Colorado Health Institute [Internet]. Uninsured, Health Coverage, and Access Data Tables. Available from:
http://datacenter.coloradohealthinstitute.org/data_topic.jsp?c=2.
6
Colorado Department of Public Health and Environment (CDPHE). 2009-2010 Behavioral Risk Factor Surveillance System. Provided by CDPHE Health
Statistics on Sept 16, 2011.
7
Colorado Health Institute [Internet]. Workforce Data Tables. Available from: http://datacenter.coloradohealthinstitute.org/data_topic.jsp?c=5.
1
El Paso County Health Indicators 2012 Report
Page 19
Health Indicators
Environmental Health
People have a reciprocal
relationship with the
surrounding environment –
each influencing the health of
the other. The World Health
Organization estimates that
globally nearly one-quarter of
premature deaths and overall
disease burden (years of healthy
life lost) can be attributed to
modifiable environmental
factors.1 These environmental
factors include physical,
chemical and biological hazards
that directly affect health
and also increase unhealthy
behaviors.
Children, elderly persons, and
those with chronic lung or heart
conditions are particularly
sensitive to poor environmental
quality.2 Air pollution (indoor
and outdoor) has been linked
to decreased lung function and
worsening of conditions such as
asthma, and radon is linked to
lung cancer. For drinking water,
certain contaminants such as
bacteria and viruses can cause
acute gastrointestinal illness,
while others (like metals or
solvents) may become a health
concern after years of exposure
to levels above standards
set by the Environmental
Protection Agency (EPA).
The built environment refers
to man-made resources and
infrastructure intended to
support human activity.3
However, the built environment
can also pose health risks,
and create barriers to healthy
behaviors such as physical
activity.
How is it measured?
Environmental health
indicators have been compiled
by the Colorado Department of
Public Health and Environment
(CDPHE). CDPHE uses air
monitoring stations around the
state to collect data on ozone
levels and PM2.5 (particles 2.5
micrometers and smaller),
which includes very small
particles of dust, dirt, smoke,
and soot that can get deep
into the lungs. The National
Ambient Air Quality Standards
are federal limits for allowable
levels of these air pollutants.
Because the values are
measured from fixed geographic
points, the data can only reflect
air quality at those specific
locations, not the actual air
quality of the entire county.
For drinking water, CDPHE
collects data from certified
laboratories that perform
required testing of public
drinking water systems; data is
readily available from a subset
of public water systems called
‘community water systems,’
which is a system that provides
drinking water to at least 25
people or more year-round
in their residences. Arsenic
and nitrates are two elements
that are routinely tested in
Colorado drinking water
systems. Information regarding
household sources of water is
collected through the Behavioral
Risk Factor Surveillance System
(BRFSS), a state-based survey of
adults. BRFSS also collects data
about radon awareness; other
data on measuring radon levels
comes from results of indoor
radon tests that are done by
homeowners. Statistics related
to transportation are obtained
from the United States Census
Bureau.
How are we doing in El
Paso County?
For the period 2006 to 2010,
the average annual level of
PM2.5 measured within El
Paso County remained below
the federal standard of 15
micrograms per cubic meter
(Figure 1).4 Ground level ozone
is the major component of
what is referred to as smog. For
ozone levels, Figure 2 illustrates
favorable trends in El Paso
County between 2006 and 2010,
showing a decreasing number of
days per year that the county’s
average daily ozone levels
exceeded the national standard
levels.4 Automotive traffic is
an important contributor to
air pollutants, particularly in
urban areas. In El Paso County
in 2010, people 16 years of age
and older either drove (77.6
percent) or carpooled to work
(9.1 percent); less than 1 percent
used public transportation and
about 5 percent walked to get to
work (Table 1).5
Radon is a colorless, odorless,
radioactive gas that forms
naturally in soil. Radon is
known to cause lung cancer and
can seep into homes through
cracks and openings in floors
El Paso County Health Indicators 2012 Report
Page 20
Figure 1. Annual average level of PM2.5 in El Paso County, 2006 to 2010
U.S. standard is 15 micrograms per cubic meter
10
9
8.2
Micrograms per cubic meter
8
7.3
7
6.1
6
6.2
5.6
5
4
3
2
1
0
2006
2007
and crawl spaces.6 While indoor
radon testing of homes is not
mandated in Colorado, 36.0
percent of adults in El Paso
County stated they had their
home tested for radon as of
2009.7 For many counties in
Colorado (including El Paso),
40 to 60 percent of homes
tested for radon showed results
above the EPA action level of
four picocuries per liter (Figure
3).6
The Safe Drinking Water Act
regulates acceptable levels
of contaminants in drinking
water obtained through public
water systems.8 However, this
federal law does not apply to
private wells serving less than
25 people. In 2009, one out of
ten adults in El Paso County
reported having a private
well as the main source of
their household water.9 The
remainder were primarily
served by public water systems.
People drinking water from
a private well are responsible
for having the well tested for
2008
2009
common contaminants such as
arsenic, nitrates, and bacteria.
Arsenic is an element that
occurs naturally in rocks and
soil and can be present in
drinking water in Colorado.8
The most concerning health
effects of arsenic are those
that can occur after long-term
exposure over many years.
Chronic arsenic exposure may
increase the risk of certain
cancers, skin changes, nerve
problems, or problems with the
circulatory system. The EPA
has set the standard for the
maximum contaminant level
for arsenic in drinking water
at 10 micrograms per liter. In
2010, 92 percent of community
water systems (44 of 48 total
systems) had arsenic testing
results available and all showed
an average level below five
micrograms per liter.8
2010
from runoff due to industrial
use of fertilizer, leakage from
sewage and septic tanks, or
decaying natural material
(such as animal waste).8 Young
infants suffer the most severe
consequence of excessive nitrate
exposure by affecting the body’s
ability to carry oxygen in the
blood. As with arsenic, the
EPA sets the standard for the
maximum nitrate concentration
in drinking water, which is
currently 10 milligrams per
liter. In 2009, 85 percent of
community water systems
(41 of 48 total systems) in El
Paso County had available
data and all results showed an
average nitrate level below five
milligrams per liter.8 ▪
Nitrate is a naturally occurring
chemical found in soil and
water; excessive nitrate levels
in drinking water can result
El Paso County Health Indicators 2012 Report
Page 21
Figure 2. Number of days per year the
average daily ozone levels exceeded United
States standard ozone concentrations,
El Paso County 2006 to 2010
U.S. standard is 0.075 parts per million
6
5
Means of transportation
5
4
Number of days
Table 1. Primary means of
transportation to work among
people 16 years of age and older,
El Paso County 2010
3
2
2
2
1
1
Percent of workers
Drove alone – car, truck, or van
77.6%
Carpooled – car, truck, or van
9.1%
Public transportation (excluding taxicab)
0.9%
Walked
4.9%
Other means
1.7%
Worked at home
5.8%
0
0
2006
2007
2008
2009
2010
Figure 3. Percent of indoor air radon tests above the Environmental Protection Agency
action level of 4 picocuries per liter, by county, 2005 to 2009
World Health Organization (WHO). Preventing disease through healthy environments. Geneva, Switzerland: WHO; 2006.
Colorado Department of Public Health and Environment [Internet]. Colorado Environmental Public Health Tracking, Environment Topics. Available
from: www.coepht.dphe.state.co.us/environmentTopics.aspx.
3
Robert Wood Johnson Foundation [Internet]. 2011 County Health Rankings. Available from:
www.countyhealthrankings.org/health-factors/built-environment.
4
Colorado Department of Public Health and Environment [Internet]. Colorado Environmental Public Health Tracking, Air Quality. Available from:
www.coepht.dphe.state.co.us/Environment/airQuality.aspx.
5
U.S. Census Bureau [Internet]. 2010 American Community Survey. Selected Economic Characteristics in the United States (Table DP03). Available
from: http://factfinder2.census.gov/main.html.
6
Colorado Department of Public Health and Environment [Internet]. Colorado Environmental Public Health Tracking, Radon. Available from:
www.coepht.dphe.state.co.us/Environment/radon.aspx.
7
Colorado Department of Public Health and Environment [Internet]. 2009 Colorado Behavioral Risk Factor Surveillance System, Radon Charts.
Available from: www.chd.dphe.state.co.us/BRFSS%202009%20results_Radon3.pdf.
8
Colorado Department of Public Health and Environment [Internet]. Colorado Environmental Public Health Tracking, Drinking Water. Available from:
www.coepht.dphe.state.co.us/Environment/drinkingWater.aspx.
9
Colorado Department of Public Health and Environment [Internet]. 2009 Colorado Behavioral Risk Factor Surveillance System, Drinking Water
Charts. Available from: www.chd.dphe.state.co.us/BRFSS%202009%20results_drinking%20water.pdf.
1
2
El Paso County Health Indicators 2012 Report
Page 22
Health Indicators
Food Safety
Improvements in tracking
foodborne disease by public
health and advances in
laboratory testing have allowed
faster and more accurate
detection of foodborne illness
outbreaks. Nationally in
2011, there were 16 large,
multistate outbreaks related to
contaminated food that were
investigated by the Centers for
Disease Control and Prevention
(CDC).3 Cases from Colorado
were reported in seven of
those outbreaks. Overall, 31
foodborne illness outbreaks
were reported in Colorado in
2011.4
However, even in the home,
people need to take precaution
in proper food handling,
storage, and preparation in
order to prevent foodborne
illness.6
How is it measured?
The CDC and state and local
health departments have
surveillance systems in place
to track foodborne illness and
outbreaks in the United States,
which are notifiable conditions
in all states. Data on the
Figure 1. Incidence of common foodborne illness
pathogens, El Paso County and Colorado 2008 to 2011*
18
El Paso County
16
Campylobacter
14
Salmonella
E. coli
12
9.5
10
10.0
9.9
8.8
9.0
8
7.7
6
4
2.7
2
7.9
6.9
1.9
1.8
1.6
0
2008
2009
2010
2011
Year
Colorado
18
16
Cases per 100,000 population
Any foodborne illness or
outbreak represents faulty
links in the food safety system.
Contamination of food can
occur at any step from the
point of production (such as
on a farm) to where food is
processed, distributed, sold,
or prepared in the home
or at food establishments.
National regulatory agencies
(including the Food and
Drug Administration, the
United States Department of
Agriculture Food Safety and
Inspection Service, and the
Environmental Protection
Agency) are charged with
reducing the risk of food
contamination by establishing
and enforcing food safety
standards; inspecting domestic
and imported food products;
and working with the food
industry to conduct risk
assessments and mitigate
violations in safety standards.5
Cases per 100,000 population
Foodborne illness, also
commonly referred to as ‘food
poisoning’, is estimated to
cause illness in one out of
six (48 million) people in the
United States every year, as
well as 128,000 hospitalizations
and 3,000 deaths.1 Infants,
young children, older adults,
pregnant women, and those
with weakened immune systems
are at the greatest risk for
foodborne illness.2
14
15.5
16.0
15.2
16.1
Campylobacter
Salmonella
14.6
12
E. coli
12.5
11.5
10
10.2
8
6
4.2
4
4.3
3.4
3.3
2
0
2008
2009
2010
2011
Year
*2011 data is preliminary
El Paso County Health Indicators 2012 Report
Page 23
incidence of foodborne illness
or outbreaks are tracked over
time to help measure the overall
effectiveness of food safety
measures.
According to the Colorado
Department of Public Health
and Environment, a retail food
establishment is defined as “a
retail operation that stores,
prepares, or packages food for
human consumption or serves
or otherwise provides food
for human consumption to
consumers directly or indirectly
through a delivery service,
whether such food is consumed
on or off the premises or
whether there is a charge
for such food.”7 Retail food
establishments are required
to be licensed in Colorado
and are inspected regularly to
ensure compliance with state
regulations. Food inspectors
review many factors, but focus
on ‘critical’ violations that
are directly related to risk of
illness (for instance, improper
temperature for food storage
or cooking). Data from retail
food inspections serves as an
indicator of risk for foodborne
illness.
Table 1. Percent of regular inspections with one or more
critical violations, by category, El Paso County 2011
Percent of inspections with one
or more violation in the category
28%
20%
19%
19%
10%
10%
6%
3%
Violation category
Personnel
Food temperature control
Handwashing and toilet facilities
Poisonous or toxic items
Sanitization
Food source
Water, sewage, plumbing systems
Pest control
El Paso County (Figure 1) and
only Salmonella has shown a
sustained decrease in incidence
since 2008.
Although individual cases of
norovirus are not tracked,
norovirus remains an important
cause of foodborne illness
outbreaks. For 2011, there
were 31 reported outbreaks
in Colorado related to
contaminated food, of which
11 (35 percent) were confirmed
or suspected to be due to
norovirus.4 In El Paso County,
norovirus accounted for one
of three foodborne illness
outbreaks reported in 2011.8
0.33 to 2.88 depending on
facility type, with 100-200 seat
restaurants and grocery stores
with delis having the highest
rates of critical violations at 2.17
and 2.88 per regular inspection,
respectively. Violations are
also grouped into broader
categories that represent
the source of risk (Table 1).9
Personnel-related violations
(including problems with sick
food handlers, improper hand
washing, bare hand contact
with food, and other hygienic
practices) were seen in 28
percent of regular inspections in
2011. In one in five inspections,
food temperature control
issues (not keeping food cold
or hot enough) were cited, and
problems with toilet or hand
washing facilities were noted 19
percent of the time. One in five
regular inspections resulted in
three or more critical violations.
Retail food establishments are
How are we doing in El
the most common setting for
Paso County?
foodborne illness outbreaks,
In the United States and
so monitoring violations
Colorado, the pathogens which
identified during inspections
account for the majority of
is important to improve food
reported cases of foodborne
safety. In December 2011,
illnesses are norovirus,
there were 2,339 licensed retail
Salmonella, Campylobacter,
food establishments in El Paso
and shiga-toxin producing E.
County. Throughout 2011,
coli (also referred to as ‘STEC’). these facilities received 4,552
Preliminary data from 2011
regular inspections to assure
shows 123 reported cases of
compliance with food safety
Salmonella, Campylobacter,
regulations.9 Overall, there
and E. coli identified in El Paso
was an average of 1.41 critical
County and 1,518 in Colorado.4
violations per regular inspection
Overall disease rates are higher
in 2011. This rate ranges from
in Colorado as compared to
El Paso County Health Indicators 2012 Report
Page 24
Centers for Disease Control and Prevention [Internet]. 2011 Estimates for Foodborne Illness. Available from:
www.cdc.gov/foodborneburden/index.html.
2
U.S. Department of Agriculture, Food Safety and Inspection Service [Internet]. Fact Sheets: At-Risk Populations. Available from:
www.fsis.usda.gov/Fact_Sheets/index.asp.
3
Centers for Disease Control and Prevention [Internet]. Multistate Foodborne Outbreaks. Available from:
www.cdc.gov/outbreaknet/outbreaks.html.
4
Colorado Department of Public Health and Environment, Disease Control and Environmental Epidemiology Division. Colorado Electronic Disease
Reporting System. Accessed on Mar 30, 2012.
5
U.S. Department of Health and Human Services [Internet]. How Government Responds to Food Illness Outbreaks. Available from:
http://foodsafety.gov/poisoning/responds/index.html.
6
U.S. Department of Health and Human Services [Internet]. Keep Food Safe. Available from: http://foodsafety.gov/index.html.
7
Colorado Department of Public Health and Environment [Internet]. State Board of Health, Colorado Food Establishment Rules and Regulations.
Available from: www.cdphe.state.co.us/regulations/consumer/101002Retailfood.pdf.
8
El Paso County Public Health (EPCPH). 2011 Communicable Disease Summary Data. Provided by EPCPH Communicable Disease Program on Apr 2,
2012.
9
El Paso County Public Health (EPCPH). 2011 Retail Food Establishment Inspection Data. Provided by EPCPH Environmental Health on Feb 16, 2012.
1
El Paso County Health Indicators 2012 Report
Page 25
Health Indicators
Healthy Eating and Active Living
Good nutrition and physical
activity are essential to good
health. Benefits associated
with a healthy diet and regular
exercise include:
▪ decreased risk of chronic
diseases such as type 2
diabetes, hypertension, and
certain cancers.
▪ decreased risk of
overweight and obesity.
▪ decreased risk of vitamin
and mineral deficiencies.1
A healthful diet includes a
variety of nutrient-dense
foods within and across the
food groups, especially whole
grains, fruits, vegetables, lowfat or fat-free dairy products,
and lean protein sources. A
healthful diet also limits the
intake of saturated and trans
fats, cholesterol, added sugars,
sodium, and alcohol.
with reducing the number of
calories consumed, creates a
“calorie deficit” that results in
weight loss. Most weight loss
occurs because of decreased
caloric intake. However,
evidence shows weight loss is
best maintained by engaging in
regular physical activity.2
Physical activity reduces risks
of cardiovascular disease and
diabetes beyond that produced
by weight reduction alone. In
addition, physical activity helps
to:
▪ reduce high blood pressure.
▪ reduce risk for type 2
diabetes, heart attack,
stroke, and several forms of
cancer.
▪ reduce arthritis pain and
associated disability.
▪ reduce risk for osteoporosis
and falls.
▪ reduce symptoms of
depression and anxiety.2
In 2008, the United States
Department of Health and
Human Services released
guidelines for physical activity.3
Adults ages 18 to 64 years
should engage in two hours
and 30 minutes of moderateintensity, or one hour and 15
minutes of vigorous-intensity,
aerobic physical activity
each week. Children and
adolescents (ages 6 to 17 years)
should engage in one hour of
Expending calories through
physical activity, combined
Figure 1. Percent of adults 18 years and older who are obese (BMI ≥30),
1995 to 2010
25
21.2%
Percent of adults
20
18.6%
20.1%
15
El Paso County
10
Colorado
10.1%
5
0
Year
El Paso County Health Indicators 2012 Report
Page 26
Figure 2. Percent of population with unhealthy weight,
El Paso County and Colorado 2008 to 2010
Adults (El Paso County 2009-10)
21.2%
37.1%
Obese
Adolescents (Colorado 2009)
7.1%
Children (El Paso County 2008-10)
11.1%
13.9%
0
14.6%
10
20
physical activity every day.
Both age groups are advised
to participate in musclestrengthening activities at least
twice weekly.
How is it measured?
Diet is measured in a variety
of ways, and one indicator of a
healthy diet is reported fruit and
vegetable consumption. Barriers
that restrict access to healthier
food exist for some populations
related to geography, income,
and education levels. Measuring
the locations of neighborhood
grocery stores and farmers’
markets compared to the
density of fast food restaurants
may explain patterns of
food consumption and the
availability of more or less
nutritional foods in a particular
setting.
Perhaps the most telling
indicators of diet and physical
activity are the outcome
measures for overweight and
obesity, high cholesterol,
Overweight
30
Percent
40
50
“An estimated
37.1 percent
of the adult
population in
El Paso County
were overweight
and 21.2 percent
were obese in
2009 to 2010.”
60
hypertension, and diabetes.
Overweight and obesity are
labels for ranges of weight
that are greater than what is
generally considered healthy
for a given height, and have
been linked to increased risk of
certain health problems.
For estimating prevalence
of unhealthy weight at the
population level, measures of
weight and height are used to
calculate “body mass index”
(BMI). BMI is used because, for
most people, it correlates with
their amount of body fat.
▪ An adult who has a BMI
between 25 and 29.9 is
considered overweight.
▪ An adult who has a BMI of
30 or higher is considered
obese.
A common source of adult BMI
data is the Behavioral Risk
Factor Surveillance System
which is a state-based health
survey of adults 18 years and
older. For adolescents and
children, BMI calculations are
compared to percentiles of BMIfor-age ranges. The percentile
indicates the relative position of
the child’s BMI among children
of the same sex and age in the
United States. Adolescent BMI
data is extracted from the statebased Youth Risk Behavior
Survey of high school students.
For younger children, BMI data
is derived from the Colorado
Child Health survey. Data for
overweight and obese children
and adolescents are available at
the state level.
Physical activity is measured
by quantifying the duration
and relative intensity levels
of various activities in
which people engage. At the
population level, these measures
are commonly obtained from
the aforementioned health
surveys.
El Paso County Health Indicators 2012 Report
Page 27
Eating, physical activity, and
sedentary behaviors of children
and youth impact the risk of
being overweight and obese.
Statewide, nearly two-thirds of
children under 14 years of age
regularly eat fast food and a
substantial proportion engage
in sedentary activities for two or
more hours per average school
day (Table 1).10
The United States Preventive
Services Task Force presented
evidence that breastfeeding
provides substantial health
benefits for children, with
improved health outcomes
related to the duration and
exclusivity of breastfeeding.11
For example, children who were
not breastfed were more likely
to have asthma, type 2 diabetes,
and obesity. Interestingly, data
shows that in El Paso County
nearly 90 percent of new
mothers initiate breastfeeding
after birth, although nearly
one-third of those mothers
do not continue breastfeeding
beyond 2 months (Figure 5).12
Figure 3. Percent of adults 18 years and older who are obese
(BMI ≥30), by selected characteristics,
El Paso County 2009 to 2010
Race/ethnicity
People who are overweight
or obese are at risk for poor
health outcomes including
hypertension, high cholesterol,
and non-gestational diabetes.
In El Paso County, the number
of adults with these conditions
has increased substantially in
the past decade, paralleling
trends in obesity. Between
2003 and 2009, hypertension
among adults has risen from
14.7 percent to 19.2 percent,
and high cholesterol rose from
25.5 percent to 34.5 percent
among those who had their
As shown in Figure 2, 28.5
percent of El Paso County
children ages 2 to 14 years were
of excessive weight, which is not
significantly different than the
state average of 25.8 percent
(2008 to 2010).8 Additionally,
almost one in five Colorado
high school students were at an
unhealthy weight in 2009.9
Annual
household
income
Disparities exist for people who
are overweight and obese based
on income, education, gender,
and race (Figure 3). There is a
trend, although not statistically
significant, for black adults
to have higher prevalence of
obesity as compared to white or
Hispanic adults. Also, obesity
is more common among people
in households earning less
than $25,000 per year and,
interestingly, is higher in people
who graduated high school or
have a more advanced degree.6
cholesterol levels checked.5 The
prevalence of non-gestational
diabetes increased from 3.8
percent among adults in
2003-2004 to 5.4 percent in
2009-2010, representing a 42
percent increase overall. Figure
4 illustrates that people with
unhealthy BMI are substantially
more likely to suffer from
hypertension, high cholesterol,
and non-gestational diabetes.7
Educational
attainment
How are we doing in El
Paso County?
Although Colorado continues to
rank as one of the leanest states
in terms of weight indicators,
it has not escaped the national
obesity epidemic. The
proportion of Colorado adults
who are obese has more than
doubled in the past 15 years—
from 10.1 percent in 1995 to 21.4
percent in 2010—meaning more
than one of every five Colorado
adults are obese (Figure 1).4,5
An estimated 37.1 percent of
the adult population in El Paso
County were overweight and
21.2 percent were obese in 2009
to 2010 (Figure 2).6
Some college or more
High school graduate
Less than high school
$50,000 or more
$25,000-$49,999
Less than $25,000
Other
Black
Hispanic
White
0
10
20
30
40
Percent of adults
50
60
Note: Error bars represent the 95% margin of error for each value.
El Paso County Health Indicators 2012 Report
Page 28
Physical activity measures
indicate that many adults
are meeting recommended
guidelines. In El Paso County
in 2009, 57.0 percent of
adults reported engaging in
two hours and 30 minutes of
moderate physical activity (e.g.,
brisk walking) or one hour of
vigorous physical activity (e.g.,
running) per week.13 In contrast,
fewer children and youth are
meeting the recommendation
for daily physical activity.
Only 38.0 percent of Colorado
children ages 5 to 14 met the
recommended weekly amount
of moderate physical activity in
2010.10 Just over one-quarter of
Colorado high school students
met the recommended weekly
amounts of exercise in 2009
(Table 1).9
Geographic characteristics of a
community may have barriers
for healthy eating. For example,
where people live impacts the
availability of nearby full-service
grocery stores with fresh fruits
and vegetables, which can then
influence food choices. In 2008,
only 44 percent of zip codes in
El Paso County had some form
of healthy food outlet (defined
as a grocery store, produce
stand, or farmer’s market).
This value was below the range
found in neighboring Colorado
counties and the state average
of 59 percent, and well below
the national benchmark of 92
percent (Table 2).14 ■
Figure 4. Percent of adults 18 years and older with co-existing conditions
based on weight status, El Paso County 2009
60
50
Percent
40
Diabetes
Hypertension
30
High cholesterol
20
10
0
Normal weight
(BMI<25)
Overweight
(BMI 25-29.9)
Obese
(BMI≥30)
Weight status
Note: Error bars represent the 95% margin of error for each value.
Table 1. Percent of children and adolescents engaging in selected eating and
recreational behaviors, Colorado 2009 and 2010
Ages 1-14 years
(2010)
Ages 15-19 years
(2009)
81.3%
75.6%
63.3%
n/a
Engaging in recommended daily physical activityc
38.0%
(ages 5-14)
26.9%
Watching TV or videos two or more hours on average
school dayd
34.1%
(ages 5-14)
45.6%
Playing video games or using computer two or more
hours on average school dayd
11.0%
(ages 5-14)
35.2%
Consuming less than recommended daily amount of fruit
and vegetablesa
Eating fast food one or more times per weekb
a Five or
more servings per day.
counter or drive thru, before being eaten.
c 60 minutes of physical activity per day.
d Unrelated to school
n/a: Measure unavailable for age group
b Food is paid for at a
El Paso County Health Indicators 2012 Report
Page 29
Figure 5. Percent of new mothers who breastfed their infant and duration of
breastfeeding, 2008 to 2010
100
90
80
El Paso County
70
Colorado
Percent
60
50
40
30
20
10
0
2 months or less
Initiated Breastfeeding
More than 2 months
Duration of Breastfeeding
Note: Error bars represent the 95% margin of error for each value.
Table 2. Accessibility of healthy food outlets based on zip code in selected
Colorado counties, 2008
Place
Colorado
Adams County
Arapahoe County
Denver County
Douglas County
El Paso County
Jefferson County
Larimer County
Pueblo County
Weld County
National Benchmark
Percent of zip codes with
access to at least one
healthy food outlet*
59%
83%
83%
70%
69%
44%
83%
73%
82%
52%
92%
* Healthy food outlet is defined as a grocery store or produce
stand/farmers’ market
Centers for Disease Control and Prevention [Internet]. Nutrition Resources for Health Professionals. Available from:
www.cdc.gov/nccdphp/dnpao/index.html.
2
Centers for Disease Control and Prevention [Internet]. Physical Activity for a Healthy Weight. Available from:
www.cdc.gov/healthyweight/physical_activity/index.html.
3
U.S. Department of Health and Human Services [Internet]. 2008 Physical Activity Guidelines [Oct 2008]. Available from:
www.health.gov/paguidelines/guidelines/default.aspx#toc.
4
Centers for Disease Control and Prevention [Internet]. 1995-2002 Behavioral Risk Factor Surveillance System: Prevalence and Trends Data. Available
from: http://apps.nccd.cdc.gov/brfss/.
5
Colorado Department of Public Health and Environment [Internet]. Colorado Health Information Dataset: 2003-2010 Behavioral Risk Factor
Surveillance System. Available from: www.chd.dphe.state.co.us/cohid/topics.aspx?q=Behavioral_Risk_Factors.
6
Colorado Department of Public Health and Environment (CDPHE). 2009-2010 Behavioral Risk Factor Surveillance System. Provided by CDPHE Health
Statistics on Aug 30, 2011.
7
Colorado Department of Public Health and Environment (CDPHE). 2009 Behavioral Risk Factor Surveillance System. Provided by CDPHE Health
Statistics on July 14, 2011.
8
Colorado Department of Public Health and Environment (CDPHE). 2008-2010 Colorado Child Health Survey Data. Provided by CDPHE Health
Statistics on March 29, 2012.
1
El Paso County Health Indicators 2012 Report
Page 30
Colorado Department of Public Health and Environment [Internet]. Adolescent Health Data: 2009 Youth Risk Behavior Survey. Available from:
www.chd.dphe.state.co.us/topics.aspx?q=Adolescent_Health_Data.
10
Colorado Department of Public Health and Environment [Internet]. Maternal and Child Health Data: 2010 Colorado Child Health Survey.
Available from: www.chd.dphe.state.co.us/topics.aspx?q=Maternal_Child_Health_Data.
11
U.S. Preventive Services Task Force. Primary Care Interventions to Promote Breastfeeding: U.S. Preventive Services Task Force Recommendation
Statement. Originally published in Ann Intern Med 2008;149:560-4. AHRQ Publication No. 09-05126-EF-2, October 2008. Available from:
www.uspreventiveservicestaskforce.org/uspstf08/breastfeeding/brfeedrs.htm.
12
Colorado Department of Public Health and Environment [Internet]. Colorado Health Information Dataset: 2008-2010 Pregnancy Risk
Assessment Monitoring System. Available from: www.chd.dphe.state.co.us/cohid/topics.aspx?q=Pregnancy_Risk_Assessment_Data.
13
Centers for Disease Control and Prevention [Internet]. 2009 Selected Metropolitan/Micropolitan Area Risk Trends: Behavioral Risk Factor
Surveillance System City and County Data. Available from: http://apps.nccd.cdc.gov/BRFSS-SMART/SelMMSAPrevData.asp.
14
Robert Wood Johnson Foundation [Internet]. 2011 County Health Rankings. Available from: www.countyhealthrankings.org/colorado/el-paso.
9
El Paso County Health Indicators 2012 Report
Page 31
Health Indicators
Mental Health and Substance Abuse
Mental health is “a state
of well-being in which the
individual realizes his or her
own abilities, can cope with the
normal stresses of life, can work
productively and fruitfully, and
is able to make a contribution to
his or her community.”1 There is
emerging evidence that positive
mental health is associated with
improved health outcomes.
Mental illness is defined as
“collectively all diagnosable
mental disorders” or
“health conditions that are
characterized by alterations in
thinking, mood, or behavior
(or some combination thereof)
associated with distress and/
or impaired functioning.”2
Depression is the most common
type of mental illness, affecting
more than 26 percent of the
heroin, and methamphetamine.
Substance abuse includes the
over-consumption of alcohol
(e.g., binge drinking) as well
as the misuse of prescription
drugs for purposes other than
prescribed. Mental disorders
and substance abuse have
substantial co-morbidity,
meaning people can suffer from
both conditions at the same
time.
United States adult population.3
Evidence has shown that
mental disorders, especially
depression, are strongly related
to the occurrence, successful
treatment, and course of many
chronic diseases including
diabetes, cancer, cardiovascular
disease, asthma, and obesity.4,5
Poor mental health also impacts
risk behaviors for chronic
disease, such as physical
inactivity, smoking, excessive
drinking, and insufficient sleep.
How is it measured?
Mental health and substance
use are commonly measured
through the Behavioral Risk
Factor Surveillance System, a
state-based survey of adults.
Adolescent data is obtained
from the Youth Risk Behavior
Survey, a state-based survey
among high school students that
measures behaviors related to
Substance abuse or misuse is
the consumption of mind—and
behavior—altering substances
that have negative behavioral
and health outcomes.6
Substance abuse may involve
alcohol, tobacco, or illicit drugs
such as marijuana, cocaine,
Figure 1. Rate of suicide attempts resulting in hospitalization, by age and sex,
El Paso County 2008 to 2010
Male
98.9
45-54
Age (years)
Female
36.6
36.6
55+
53.4
132.1
35-44
75.1
125.4
25-34
89.9
139
15-24
79.3
0
25
50
75
100
125
Suicide hospitalizations per 100,000 population
El Paso County Health Indicators 2012 Report
150
Page 32
Figure 2. Suicide death rate, by age
and sex, El Paso County
2008 to 2010
Female
8.4
55+
34.2
20.3
Age (years)
45-54
48.2
20
35-44
34.7
11.3
25-34
29.2
7.6
15-24
30.4
0
sexual activity, injury, tobacco
and substance abuse, diet,
and physical activity; data are
available at the state level only.
Hospitalization and death data
are used to describe the severity
of mental health and substance
abuse. Additionally, national
surveys conducted by the
Substance Abuse and Mental
Health Services Administration
(SAMHSA) provide
supplemental information on
substance abuse at the state
level.
How are we doing in El
Paso County?
In El Paso County between
2009 and 2010, 14.1 percent
of adults 18 years and older
reported having poor mental
health for more than a week
within the past month, a finding
similar to the Colorado average
(12.7 percent).7 For depression
specifically, 8.2 percent of El
Paso County adults reported
symptoms meeting criteria
for being currently depressed
(2008 data).8 Mental health
data for Colorado adolescents
shows that 25.4 percent of
high school students describe
Male
10
20
30
40
Suicide deaths per 100,000 population
having depression symptoms in
the previous year (2009 data);
these findings were significantly
more common among females
(31.7 percent) than males (19.3
percent).9
Severe, untreated depression
may lead people to contemplate
suicide, attempt suicide, or die
from suicide. In El Paso County,
higher rates of hospitalization
due to suicide attempts are
found for females and among
people between 15 to 44 years of
age (Figure 1).10 The number of
suicide deaths in El Paso County
has ranged from 69 to 131 per
year between 2006 and 2010.
Adjusted for population size, the
suicide rate in 2009 to 2010 was
19.7 per 100,000 population in
El Paso County, as compared
to the Colorado average of 18.1
per 100,000 population.11 Males
have higher suicide death rates
across all age groups (Figure 2).
SAMHSA surveys from 2008
and 2009 indicate that illicit
drug use is significantly higher
among adults ages 18 to 25
years than any other age
group (Table 1). Marijuana
use is two to three times more
50
common than other illicit
drug use in every age category
and is used significantly more
often in Colorado than for the
United States as a whole.12
Among Colorado high school
students, in 2009, about one
in four students reported binge
drinking (consuming five or
more alcoholic drinks within a
few hours), and 24.8 percent
stated having used marijuana in
the previous month.9 Between
3 and 4 percent of students
reported usage of either heroin
or methamphetamine in their
lifetime.
Depressed mood among
adolescents impacts other risk
behaviors in this age group. As
shown in Figure 3, substance
abuse, tobacco use, and sexual
activity are significantly more
common among high school
students who also report having
symptoms of depression; these
students are also ten times
more likely to contemplate
suicide.13 In contrast, students
without significant depression
symptoms are more likely to
engage in some form of physical
activity. ■
El Paso County Health Indicators 2012 Report
Page 33
Table 1. Percent of population who report using illicit drugs in past 30 days, by age,
Colorado 2008 to 2009
Age
Illicit drugs *
(other than
marijuana)
Marijuana
Colorado
United States
Colorado
United States
12-17 years
18-25 years
4.3%
(3.3-5.5)
4.5%
(4.2-4.7)
10.2%
(8.2-12.6)
7.0%
(6.7-7.3)
9.9%
(7.7-12.5)
8.1%
(7.7-8.5)
24.3%
(20.9-28.1)
17.3%
(16.8-17.9)
26 years and
older
2.5%
(1.7-3.7)
2.6%
(2.5-2.8)
7.4%
(5.6-9.6)
4.4%
(4.2-4.7)
*Includes cocaine, heroin, hallucinogens, inhalants, and nonmedical use of prescription-type pain relievers,
tranquilizers, stimulants, and sedatives.
Note: Numbers in parentheses represent the 95% margin of error for each value.
Figure 3. Correlation between symptoms of depression and other behaviors among
Colorado students in ninth through twelfth grades, 2009
60
Not having
depression
symptoms
Percent of students
50
40
Having
depression
symptoms
30
20
10
0
Binge
drinking
Used
Used
Sexually Considered
tobacco marijuana active
suicide
Physically
active
Note: Error bars represent the 95% margin of error for each value.
World Health Organization. Strengthening Mental Health Promotion. Geneva, World Health Organization (Fact sheet no. 220), 2001.
U.S. Department of Health and Human Services. Mental Health: A Report of the Surgeon General. Rockville, MD: U.S. Department of Health and
Human Services; Substance Abuse and Mental Health Services Administration, Center for Mental Health Services, National Institutes of Health,
National Institute of Mental Health, 1999.
3
Kessler RC, Chiu WT, Demler O, Walters EE. Prevalence, severity, and comorbidity of 12-month DSM-IV disorders in the National Comorbidity
Survey Replication. Arch Gen Psychiatry 2005;62:617–627.
4
Chapman DP, Perry GS, Strine TW.The vital link between chronic disease and depressive disorders. Prev Chronic Dis 2005;2(1):A14.
5
Centers for Disease Control and Prevention [Internet]. Mental Health Basics. Available from: www.cdc.gov/mentalhealth/basics.htm.
6
U.S. Department of Health and Human Services [Internet]. Healthy People 2020: Substance Abuse. Available from:
www.healthypeople.gov/2020/topicsobjectives2020/overview.aspx?topicid=40.
7
Colorado Department of Public Health and Environment [Internet]. Colorado Health Information Dataset: 2009-2010 Behavioral Risk Factor
Surveillance System. Available from: www.chd.dphe.state.co.us/cohid/topics.aspx?q=Behavioral_Risk_Factors.
8
Colorado Department of Public Health and Environment (CDPHE). 2008 Behavioral Risk Factor Surveillance System. Provided by CDPHE Health
Statistics on Aug 30, 2011.
1
2
El Paso County Health Indicators 2012 Report
Page 34
Colorado Department of Public Health and Environment [Internet]. Adolescent Health Data: 2009 Youth Risk Behavior Survey. Available from:
www.chd.dphe.state.co.us/topics.aspx?q=Adolescent_Health_Data.
10
Colorado Department of Public Health and Environment [Internet]. Colorado Health Information Dataset: 2008-2010 Injury Hospitalizations.
Available from: www.chd.dphe.state.co.us/cohid/topics.aspx?q=Injury_Hospitalizations.
11
Colorado Department of Public Health and Environment [Internet]. Colorado Health Information Dataset: 1999-2010 Death Data. Available from:
www.chd.dphe.state.co.us/cohid/topics.aspx?q=Death_Data.
12
Substance Abuse and Mental Health Services Administration [Internet]. State Estimates of Substance Use and Mental Disorders from the 20082009 National Surveys on Drug Use and Health [June 2011]. Available from: http://store.samhsa.gov/shin/content//SMA11-4641/SMA11-4641.pdf.
13
Colorado Department of Education [Internet]. Healthy Kids Colorado Survey, 2009 State Report [Dec 2010]. Available from:
www.cde.state.co.us/HealthAndWellness/download/CSHReport2009.pdf.
9
El Paso County Health Indicators 2012 Report
Page 35
Health Indicators
Motor Vehicle Injuries
Motor vehicle-related injuries
are the leading cause of death
for people ages 5 to 34 years
old in the United States, and
the top cause of death for teens
nationally.1 Nearly one in three
deaths from vehicle crashes
involve an impaired driver.
Motor vehicle-related injuries
send more than 4 million
people to hospital emergency
departments every year.
National Highway Traffic Safety
Administration, and Colorado
hospital discharge data. CDOT
publishes information on all
motor vehicle crashes, including
those causing property damage,
injury, and fatalities. Crashes
are examined for contributing
factors such as impaired
drivers, occupant protection,
inexperienced drivers, and
speeding.
Motor vehicle injuries and
fatalities are preventable,
however. The use of ageappropriate seat restraints in
cars, and helmets and safety
gear for motorcyclists reduce
the risk of injury or death. It
is estimated that child safety
seats reduce deaths nationally
by 71 percent for infants and
54 percent for toddlers.2 Focus
areas for further reducing
the risk of injury from motor
vehicles include teen driver
education and alcohol-impaired
driving prevention.
Risk factors for injuries, such
as seat belt usage, driving
while impaired, and riding
with someone who is impaired
are collected through statebased surveys, including
the Behavioral Risk Factor
Surveillance System survey
of adults and the Youth Risk
Behavior Survey of high school
students.
The rate of motor vehicle traffic
fatalities in El Paso County has
declined 53 percent between
2000 and 2010, from 13.7
to 6.5 fatalities per 100,000
population, respectively.4
In 2010, there were 8,335
reported traffic crashes in El
Paso County of which 37 (less
than 1 percent) resulted in at
least one fatality.5 Among 448
motor vehicle-related deaths in
Colorado in 2010, 41 (9 percent)
occurred within El Paso County.
Table 1 highlights several
characteristics of motor vehicle
traffic fatalities in El Paso
How are we doing in El
Paso County?
The rate of motor vehicle
Figure 1. Rate of motor vehicle traffic fatalities, by age and sex,
2006 to 2010
20
17.8
17.6
18
Deaths per 100,000 population
How is it measured?
Motor vehicle traffic injuries
and fatalities are those which
occur on a public trafficway
(roadways, shoulders,
roadsides, medians) and involve
at least one motor vehicle.
These injury measures include
pedestrians, bicyclists, and
other non-motorists involved
in the accident. Data regarding
motor vehicle traffic crashes,
injuries, and deaths are
obtained from the Colorado
Department of Transportation
(CDOT), the Electronic
Accident Reporting System, the
traffic injuries resulting in
hospitalization in El Paso
County declined from 95.6
injuries per 100,000 population
in 2000 to 53.7 injuries per
100,000 population in 2010,
which was lower than the 2010
state average rate of 58.8 per
100,000.3
16
El Paso County
14
11.3
12
10
11.2
Colorado
9.9
8.3
7.7
8
5.9
6
4
2
0
Female
15-19 years
Male
Female
Male
20 years and older
El Paso County Health Indicators 2012 Report
Page 36
County and demonstrates the
impact on fatalities of passenger
restraint systems, helmet usage,
impaired driving, and speeding.
For example, nearly two out of
five fatalities involved alcoholimpaired drivers, and in threequarters of motorcycle fatalities
either a driver or rider were not
wearing a helmet.4 Additionally,
residents of El Paso County
who ride motorcycles are 60
percent more likely than drivers
to be involved in an injury
crash.5 Although overall, 85
percent of vehicle occupants
use age-appropriate seat
restraints, more than half of
passenger vehicle fatalities in
El Paso County involved an
unrestrained passenger.4,5
Disparities exist in terms of age
and sex when examining motor
vehicle traffic fatalities (Figure
1). The fatality rate is higher
among teens ages 15 to 19 years
old compared to adults 20 years
and older (9.1 versus 8.5 per
100,000 population in El Paso
County, respectively).4 Motor
vehicle traffic fatality rates
in males remain higher than
females, regardless of age.
Adolescent driving behaviors
may contribute to poor
outcomes for this age group.
Teens ages 15 to 19 years
accounted for 12.2 percent
of motor vehicle fatalities in
2010 (Table 1). Survey data
from 2009 shows that nearly
8 percent of Colorado high
school students reported driving
after consuming alcohol and
approximately one in four
students admitted to getting in a
car with someone they knew to
have consumed alcohol.6 Since
1999, several state laws have
been enacted to promote safety
among young drivers including
graduated driver licensing and
bans on cell phone use (Figure
2).7 Concurrently, there has
been a 56 percent decrease
in motor vehicle fatalities
among teens ages 15 to 19 years
between 1999 and 2010.4 ■
Table 1. Characteristics of motor vehicle traffic fatalities in El Paso County, 2010
Vehicle and driver-related factors
Percent of total fatalities
Occupant in a passenger vehicle
(all seat positions)
Unrestrained driver or passenger
73.1%
46.7% of passenger vehicle occupant fatalities
Motorcycle
19.5%
Driver or rider not wearing helmet
75.0% of motorcycle fatalities
Alcohol-impaired driver (BAC = 0.08+)
39.0%
Speeding-related crash
43.9%
Teen fatalities (ages 15-19)
12.2%
Figure 2. Rate of motor vehicle traffic fatalities among adolescents ages 15 to 19 years and
enactment of state laws, Colorado 1995 to 2010
40
Deaths per 100,000 population
35
36.6
Graduated Driver
Licensing Law enacted
(1999)
Cell phone ban among
drivers of all ages with
instruction permit
(2005)
30
25
20
15
11.5
10
Cell phone ban among all
drivers under age 18
(2009)
5
0
Year
El Paso County Health Indicators 2012 Report
Page 37
Centers for Disease Control and Prevention [Internet]. Winnable Battles: Motor Vehicle Injuries. Available from:
www.cdc.gov/WinnableBattles/MotorVehicleInjury/index.html.
2
U.S. Department of Transportation, National Highway Traffic Safety Administration (NHTSA) [Internet]. Traffic Safety Facts 2009: Children. Washington (DC): NHTSA; 2009. Available from: www-nrd.nhtsa.dot.gov/pubs/811387.pdf.
3
Colorado Department of Public Health and Environment [Internet]. Colorado Health Information Dataset: 2000-2010 Injury Hospitalizations.
Available from: www.chd.dphe.state.co.us/cohid/topics.aspx?q=Injury_Hospitalizations.
4
U.S. Department of Transportation, National Highway Traffic Safety Administration [Internet]. Fatality Analysis Reporting System Encyclopedia:
2000-2010 Fatality Query. Available from: www-fars.nhtsa.dot.gov//QueryTool/QuerySection/SelectYear.aspx.
5
Colorado Department of Transportation [Internet]. FY 2011 Problem Identification Report. Available from:
www.coloradodot.info/programs/safety-data-sources-information/2011%20Problem%20Identification_DRAFT1.pdf/view.
6
Colorado Department of Public Health and Environment [Internet]. Adolescent Health Data: 2009 Youth Risk Behavior Survey. Available from:
www.chd.dphe.state.co.us/topics.aspx?q=Adolescent_Health_Data.
7
Colorado Revised Statutes [Internet]. Title 42, Article 4. Available from: www.state.co.us/gov_dir/leg_dir/olls/analyses/title42.pdf.
1
El Paso County Health Indicators 2012 Report
Page 38
Health Indicators
Oral Health
The World Health Organization
defines good oral health as
being free of chronic mouth
and facial pain, oral and throat
cancer, oral sores, birth defects
such as cleft lip and palate,
periodontal (gum) disease,
tooth decay and tooth loss, and
other diseases and disorders
that affect the mouth and oral
cavity.1 Behavioral factors that
negatively impact oral health
include unhealthy diet, tobacco
use, excessive alcohol use, and
poor oral hygiene. These are
the same risk factors for other
chronic diseases like diabetes,
cardiovascular disease, chronic
respiratory disease, and certain
cancers.
How is it measured?
Oral health is challenging to
measure, particularly at the
population level. One approach
quantifies the prevalence of
certain oral conditions within a
population, such as the number
of children with dental caries
(cavities) or the number of
adults with oral and throat
cancers. Another approach
is to evaluate behaviors or
conditions that contribute to
better or worse oral health. Such
measures include rates of dental
insurance coverage, the number
of people who recently visited
a dentist, and the number of
people exposed to optimally
fluoridated water.
How are we doing in El
Paso County?
Because oral cancer rates for
El Paso County are quite low,
data was analyzed for other oral
health measures. According
to the 2011 Colorado Health
Access Survey, approximately
35 percent of El Paso County
residents did not have dental
insurance in 2011.2 Availability
of insurance coverage impacted
access to dental services; only
44.5 percent of people without
current dental insurance
coverage reported visiting a
dentist or dental hygienist in the
previous year, compared to 76.9
percent of those with dental
insurance (Figure 1).
There are disparities in
utilization of dental services
based on age. As shown in
Figure 1, 50 to 70 percent of
adults 18 years of age and older
visited a dental provider in
the previous year.2 Children
ages 6 to 17 years were most
likely to have had a dental visit,
with 83.1 percent receiving
Dental
insurance
status
Figure 1. Percent of El Paso County residents who visited a dentist or dental hygienist in the
previous 12 months, by selected characteristics, 2011
Uninsured
Insured
55+ years
Age
35-54 years
18-34 years
6-17 years
0-5 years
Sex
Female
Male
0
10
20
30
40
50
60
70
Percent who visited a dental provider
80
90
100
Note: Error bars represent the 95% margin of error for each value.
El Paso County Health Indicators 2012 Report
Page 39
dental care in 2011. However,
dental visits tended to be lower
among children 5 years of age
and younger, with only 45.2
percent of these children seeing
a dentist or dental hygienist
within the previous year.
The American Academy of
Pediatric Dentistry recommends
all children see a dentist
between 6 months and 1 year
of age, or when the first tooth
arrives.3 This early visit plays an
important role in establishing
a child’s dental care routine,
which helps prevent future
tooth decay. Even with these
recommendations, data from
the 2010 Child Health Survey of
Colorado children 1 to 5 years
old showed that only 7.9 percent
of young children had seen a
dentist prior to age 2, and only
66.5 percent had ever visited a
dentist.4
(2.0 percent), or tooth pain
(0.4 percent) for their child.
Data from the Colorado Oral
Health Survey, for which
third grade children in the
2006-2007 school year had an
oral examination by a dental
hygienist, indicated that 54.4
percent of El Paso County third
graders had treated or untreated
cavities and 38.7 percent had
protective dental sealants on
one or more of their permanent
molars (Figure 2).6
According to the U.S. Public
Health Service, optimal
fluoride level in drinking water
is between 0.7 - 1.2 parts per
million, depending on mean
daily air temperature for a
geographic area.7 Scientific
studies have concluded that
fluoridated public water
supplies can prevent and
even reverse tooth decay by
enhancing remineralization,
the process by which fluoride
“rebuilds” tooth enamel that
is beginning to decay.8 The
Healthy People 2020 objective
is for roughly 80 percent of
people served by public water
systems to have optimally
fluoridated water.9 For Colorado
in 2010, nearly 70 percent
of the population served by
public water systems received
fluoridated water at or above
0.7 parts per million; in marked
contrast, for El Paso County that
figure was only 8.7 percent.10 ▪
Figure 2. Percent of third grade students with dental
sealants or cavities, 2006 to 2007
60
54.4%
57.2%
Lack of pediatric dental care can
have long term outcomes. In
2010, 18.2 percent of Colorado
parents with children ages 14
years and younger reported that
the primary problem with their
child’s teeth was crooked teeth
or teeth that needed braces.5
Parents also reported issues
with cavities (14.3 percent),
broken teeth or missing fillings
Percent of third graders
50
40
38.7%
35.0%
El Paso County
30
Colorado
20
10
0
Protective dental sealants
Treated or untreated cavities
World Health Organization [Internet]. Available from: www.who.int/mediacentre/factsheets/fs318/en/index.html
Colorado Health Access Survey. 2011. Denver, CO: The Colorado Trust.
3
American Academy of Pediatric Dentistry [Internet]. Available from: www.aapd.org/publications/brochures/babycare.asp
4
Colorado Department of Public Health and Environment (CDPHE). 2010 Colorado Child Health Survey Data. Provided by CDPHE Health Statistics on
Aug. 26, 2011.
5
Colorado Department of Public Health and Environment [Internet]. 2010 Colorado Child Health Survey. Available from:
www.cdphe.state.co.us/hs/mchdata/Copy%20of%20chs2010PUB2.pdf.
6
Colorado Department of Public Health and Environment. Colorado Oral Health Survey, 2006-2007 School Year [Oct 2007, revised July 2011].
Available from: www.cdphe.state.co.us/hs/oral/BSS%2006-07%20Report.pdf and
www.cdphe.state.co.us/hs/mchdata/Oral%20Health%20County%20Estimates%202006-2007.pdf.
7
U.S. Department of Health and Human Services, Public Health Service. “Review of Fluoride: Benefits and Risks”, 1991. Available from:
http://health.gov/environment/ReviewofFluoride/.
8
National Cancer Institute [Internet]. Available from: www.cancer.gov/cancertopics/factsheet/Risk/fluoridated-water.
9
U.S. Department of Health and Human Services, Office of Disease Prevention and Health Promotion [Internet]. Healthy People 2020. Oral Health
Objectives. Available from: www.healthypeople.gov/2020/topicsobjectives2020/overview.aspx?topicid=32.
10
Centers for Disease Control and Prevention [Internet]. Oral Health Maps for Water Fluoridation. Available from:
http://apps.nccd.cdc.gov/gisdoh/waterfluor.aspx.
1
2
El Paso County Health Indicators 2012 Report
Page 40
Health Indicators
Tobacco Use
Exposure to secondhand
smoke can result from being
in proximity to smoke from
the burning tip of a cigarette
or smoke exhaled from a
smoker’s lungs. Secondhand
smoke exposes nonsmokers
to the same carcinogens and
toxins as smokers.2 Infants and
children with chronic exposure
may develop any number of
health problems including
exacerbation of asthma,
respiratory infections, and ear
infections. Adult nonsmokers
who are exposed to secondhand
smoke at home or at work
increase their risk of developing
heart disease by 25 to 30
percent, and increase risk for
lung cancer by 20 to 30 percent.
25
20
Percent of adults
The association between
tobacco use and adverse health
outcomes is well established,
and cigarette smoking is
considered a leading cause of
preventable death. Smoking
harms nearly every organ in
the body and has a causative
relationship with many diseases
including lung cancer, coronary
heart disease, and chronic
obstructive pulmonary disease.1
In addition, smoking impacts
early childhood development
and reproductive health.
Females who smoke are at
increased risk for infertility,
preterm delivery, or having a
baby with low birth weight, and
their infants are also at higher
risk for Sudden Infant Death
Syndrome (SIDS).
Figure 1. Percent of adults 18 years and older who report
being a current cigarette smoker, 1995 to 2010
21.8%
20.4%
17.5%
16.5%
15
El Paso County
Colorado
10
5
0
How is it measured?
Data on tobacco use (namely
cigarette smoking behavior)
is commonly ascertained
through the Behavioral Risk
Factor Surveillance System, a
state-based survey of adults.
Cigarette smoking among youth
is measured using the Youth
Risk Behavior Survey (YRBS),
also a state-based survey among
high school students that
assesses behaviors related to
sexual activity, injury, tobacco
and substance abuse, diet, and
physical activity.
How are we doing in El
Paso County?
Although cigarette smoking
rates among adults in El Paso
County have declined in recent
years, as of 2010 nearly 18
percent of adults 18 years and
older are current smokers
(Figure 1).3,4 This smoking
rate is slightly higher than the
Colorado average for adult
smokers (16.5 percent) and
substantially higher than the
Healthy People 2020 goal of
reducing smoking prevalence to
12 percent of adults.5
Secondhand smoke exposure
among children and adolescents
is measured using data from the
Colorado Child Health Survey
or YRBS. Statistics on state
and local tobacco taxes and
smoke-free indoor air policies
can provide indirect data
on the potential exposure to
secondhand smoke.
There are disparities among
persons who smoke cigarettes
in El Paso County, based on
age, sex, race/ethnicity, and
other socioeconomic factors
(Figure 2).6 As indicated, 38.0
percent of people with less than
a high school education are
smokers compared to only 12.6
percent of people with some
El Paso County Health Indicators 2012 Report
Page 41
Figure 2. Percent of adults 18 years and older who currently
smoke, by selected characteristics, El Paso County 2009 to 2010
Some college or more
High school graduate
Less than high school
$50,000 or more
$25,000-$49,999
Less than $25,000
65+ years
55-64 years
Age
45-54 years
35-44 years
25-34 years
18-24 years
Female
Sex
Youth smoking data for
Colorado demonstrate that
17.7 percent of high school
students reported recent use
of cigarettes, which is trending
higher than the Healthy People
2020 goal of 16 percent.5,8
About one in three high school
students who ever try smoking
a cigarette become regular,
daily smokers before leaving
high school.9 Cigarette sales
to minors are prohibited by
federal and state laws, which
are intended to curb youth from
starting smoking. As of 2009,
only 13.2 percent of Colorado’s
underage high school student
smokers were purchasing
cigarettes from a store or
vending machine (Figure 4).8
However, the majority of these
young smokers are obtaining
cigarettes from an adult by
asking them to purchase
cigarettes or by bumming them
from another youth or adult.
and personal vehicles have
become a primary source for
secondhand smoke exposure.11
Children are exposed to more
secondhand smoke than nonsmoking adults, and children
who live with smokers are
particularly vulnerable. Between
2007 and 2009, 5.5 percent of
El Paso County children ages
1 to 14 years lived in homes
where someone had smoked
one or more times in the past
week.12 In addition, 8.1 percent
As a result of such policies,
private settings such as homes
Annual
household Educational
attainment
income
Another group showing
disparities is pregnant females,
for which data illustrates a
higher smoking prevalence
among younger mothers (Figure
3).7 Between 2008 and 2010, 40
to 50 percent of females ages 15
to 24 years who recently gave
birth reported smoking prior to
pregnancy. Younger mothers
tend to smoke more, and all
mothers regardless of age tend
to stop smoking while pregnant
and start smoking soon after
their baby is born.
The Colorado Clean Indoor
Air Act was implemented on
July 1, 2006 to provide strong
protection against exposure to
secondhand smoke. This law
banned smoking from all nonexempt indoor public places
such as restaurants, bars, and
workplaces.10 The smoke-free
law was amended in 2008 to
include casinos.
Male
0
10
20
30
40
Percent who currently smoke
50
60
Figure 3. Percent of new mothers who smoked before, during, or
after pregnancy, by age, El Paso County 2008 to 2010
70
Before pregnancy
60
During pregnancy
50
After pregnancy
Percent
college education. Adults whose
annual household income is
less than $25,000 smoke at
almost three times the rate of
adults in households who earn
$50,000 or more. Adults ages
18 to 34 show the highest rates
of smoking, and more males
smoke than females.
40
30
20
10
0
15-19
20-24
25-34
35+
Age (years)
Note: Error bars represent the 95% margin of error for each value.
El Paso County Health Indicators 2012 Report
Page 42
of children frequently rode in
a car with someone who was
smoking.
“Between 2007 and 2009, 5.5 percent of El Paso
County children ages 1 to 14 years old lived in
homes where someone had smoked one or more
times in the past week.”
Federal and state cigarette tax
increases have helped reduce
smoking rates, especially among
youth.13 By the end of 2011, the
Figure 4. Usual method of acquiring cigarettes (in past 30 days)
national average for state excise
among underage high school students who currently smoke,
cigarette taxes was $1.46 per
Colorado 2009
pack, with a range of $0.17 to
Took them from
$4.35; Colorado had the 18th
A person 18 years
store/family
lowest state cigarette excise tax
or older provided
4.3%
them
at $0.84.14 Many counties and
9.0%
cities nationwide have imposed
additional, local cigarette
taxes—the highest being New
Gave someone
York City, where a pack of
money to buy
cigarettes includes $6.86 in
30.8%
Store or gas station
12.3%
federal, state, and local cigarette
Vending machine
15
taxes. Colorado does not have
0.9%
any local cigarette taxes, but
Other
federal and state taxes equate to
14.7%
Borrowed/
$1.85 per pack. ■
bummed them
28.0%
Centers for Disease Control and Prevention [Internet]. Available from:
www.cdc.gov/tobacco/data_statistics/fact_sheets/health_effects/effects_cig_smoking/index.htm.
2
Centers for Disease Control and Prevention [Internet]. Available from:
www.cdc.gov/tobacco/data_statistics/fact_sheets/secondhand_smoke/health_effects/index.htm.
3
Colorado Department of Public Health and Environment [Internet]. Colorado Health Information Dataset: 2003-2010 Behavioral Risk Factor
Surveillance System. Available from: www.chd.dphe.state.co.us/cohid/topics.aspx?q=Behavioral_Risk_Factors.
4
Centers for Disease Control and Prevention [Internet]. Behavioral Risk Factor Surveillance System: 1995-2002 Prevalence and Trends Data. Available
from: http://apps.nccd.cdc.gov/brfss/.
5
U.S. Department of Health and Human Services, Office of Disease Prevention and Health Promotion [Internet]. Healthy People 2020. Tobacco Use
Objectives. Available from: www.healthypeople.gov/2020/topicsobjectives2020/objectiveslist.aspx?topicId=41.
6
Colorado Department of Public Health and Environment (CDPHE). 2009-2010 Behavioral Risk Factor Surveillance System. Provided by CDPHE Health
Statistics on Aug 30 2011.
7
Colorado Department of Public Health and Environment [Internet]. Colorado Health Information Dataset: 2008-2010 Pregnancy Risk Assessment
Monitoring System. Available from: www.chd.dphe.state.co.us/cohid/topics.aspx?q=Pregnancy_Risk_Assessment_Data.
8
Colorado Department of Public Health and Environment [Internet]. Adolescent Health Data: 2009 Youth Risk Behavior Survey. Available from:
www.chd.dphe.state.co.us/topics.aspx?q=Adolescent_Health_Data.
9
Centers for Disease Control and Prevention. “Selected Cigarette Smoking Initiation and Quitting Behaviors Among High School Students – United
States, 1997,” MMWR 47(10):386-389, May 22, 1998. Available from: www.cdc.gov/mmwr/preview/mmwrhtml/00052816.htm.
10
Colorado Department of Public Health and Environment [Internet]. Smoke Free Colorado Resources: The Law. Available from:
www.smokefreecolorado.org/the-law.html.
11
Centers for Disease Control and Prevention. “Nonsmokers’ Exposure to Secondhand Smoke in the United States, 1999-2008,” MMWR 59(35):11411146, September 10, 2010. Available from: www.cdc.gov/mmwr/pdf/wk/mm5935.pdf.
12
Colorado Department of Public Health and Environment [Internet]. Colorado Health Indicators: Tobacco Use Exposure. Available from:
www.chd.dphe.state.co.us/HealthIndicators/Default.aspx.
13
The Task Force on Community Preventive Services. The guide to community preventive services: what works to promote health? New York, NY:
Oxford University Press; 2005. Available from: www.thecommunityguide.org/tobacco/tobacco.pdf.
14
Centers for Disease Control and Prevention [Internet]. State Tobacco Activities Tracking and Evaluation System: State Excise Tax Fact Sheet.
Available from: www.cdc.gov/tobacco/statesystem.
15
Campaign for Tobacco-Free Kids [Internet]. Top Combined State-Local Cigarette Tax Rates Fact Sheet. Available from:
www.tobaccofreekids.org/research/factsheets/pdf/0267.pdf.
1
El Paso County Health Indicators 2012 Report
Page 43
Health Indicators
Unsafe Sexual Practices and Teen Pregnancy
Unsafe sexual practices lead
to adverse outcomes including
unintentional pregnancy
(especially for adolescents) and
sexually transmitted infections
(STIs). Unintended (unwanted
or mistimed) pregnancies are
related to individual behaviors
and methods used to prevent
pregnancy. Teen pregnancy
and teen mothering have
been associated with repeat
pregnancies and poor fetal or
infant outcomes related to lack
of prenatal care, gestational
complications, low maternal
weight gain, preterm delivery,
and low birth weight.1 Adverse
socioeconomic effects related to
teen pregnancy have included
single parenthood, marital
instability, school dropout and
lower educational attainment,
unemployment, and welfare
dependency. STIs can cause
serious health problems,
particularly in females (pelvic
inflammatory disease, infertility,
cervical cancer) and in newborns
(low birth weight, severe infection,
brain injury).
How is it measured?
Data on unintended pregnancy
is collected from a statebased survey of mothers
who recently gave birth and
is administered through the
Pregnancy Risk Assessment
Monitoring System. Teen birth
rates, also referred to as teen
fertility rates, are presented as
the number of live births per
1,000 females ages 15 to 17
years. For pregnancy outcomes,
infants born weighing less than
5 pounds, 8 ounces (2,500
grams) are considered low
birth weight. Adolescent data
is obtained from the Youth
Risk Behavior Survey (YRBS),
a state-based survey among
high school students that
measures behaviors related to
Figure 1: Proportion of pregnancies* that were unintended, by maternal age and race/ethnicity,
El Paso County 2008 to 2010
90
80
70
Percent
60
50
40
30
20
10
0
15-19
20-24
25-34
Age (years)
35+
White nonHispanic
White
Hispanic
Black
Other
Race/ethnicity
*Resulting in a live birth.
Note: Error bars represent the 95% margin of error for each value.
El Paso County Health Indicators 2012 Report
Page 44
How are we doing in El
Paso County?
Figure 1 illustrates the
proportion of pregnancies
resulting in a live birth that
were unintended in El Paso
County. From 2008 to 2010,
an estimated 70.1 percent of
pregnancies among teens 15 to
19 years old were unintended.2
Among all pregnancies resulting
in live births in El Paso County
in 2010, 36.2 percent were
unintended.
Teen birth rates in El Paso
County and Colorado have been
trending downward in the past
decade (Figure 2). The rates in
El Paso County remained lower
than Colorado as a whole; in
2010 the teen birth rate was 14.7
live births per 1,000 females
ages 15 to 17 years in El Paso
County compared to 17.4 for
Colorado.3 In 2010, 12 percent
of live births to teens 15 to 19
years old in El Paso County
resulted in low birth weight
Figure 2: Birth rate for teens
ages 15 to 17 years,
2000 to 2010
infants, which is higher than the
proportion for females 20 to 44
years old (9.1 percent).
Data from the 2009 YRBS
indicated that, overall, 60.0
percent of Colorado high school
students reported abstaining
from sexual activity. For those
students who had sex at least
once in their life, prevalence was
higher among male high school
students (43.7 percent) than for
females (36.2 percent) (Figure
3).4 Nearly 14 percent of high
school students reported having
four or more sexual partners in
their lifetime.
35
Live births per 1,000 females ages 15-17 years
sexual activity, injury, tobacco
and substance abuse, diet,
and physical activity; data are
available at the state level only.
STI rates are obtained through
the Colorado Department of
Public Health and Environment
reportable conditions.
29.4
30
25
27.2
20
17.4
15
14.7
El Paso County
Colorado
10
5
0
Year
Figure 3: Sexual behavior
among students in ninth
through twelfth grade,
Colorado 2009
55
50
45
Male
40
Female
Percent
35
30
25
20
15
10
5
Note: Error bars represent the 95% margin of
error for each value.
0
Ever had sex
Had sex in past 3 Had sex before age
months
13 years
El Paso County Health Indicators 2012 Report
Had sex with 4+
partners in life
Page 45
Among high school students
who were currently sexually
active (defined as having
sex within the three months
prior to the survey), 26.4
percent stated using hormonal
contraception as a method of
preventing pregnancy. Only six
out of 10 sexually active high
school students reported using
condoms, which also protect
against STIs such as gonorrhea,
chlamydia, and human
immunodeficiency virus (HIV).4
In addition, just 11.2 percent of
sexually active students used
both condoms and hormonal
contraception. In El Paso
County, these sexual behaviors
play a role in the high rate of
STIs in the teen population.
In 2010, the rate of chlamydia
among teens 15 to 19 years
old was 1,277.9 per 100,000
population, and for gonorrhea
the rate was 122.8 per 100,000
population.5
The rate of STIs for all ages
in El Paso County has been
consistently higher than the
state average (Figure 4). While
trends for gonorrhea have been
improving in the past decade,
chlamydia infections have
remained relatively unchanged.
Furthermore, the greatest
number of STIs has continually
been among people between
the ages of 15 and 29 years
(84.5 percent of the county's
chlamydia and gonorrhea cases
in 2010.)5
Unsafe sexual practices
contribute to the incidence
of HIV and acquired immune
deficiency syndrome (AIDS). In
El Paso County, there were 35
new diagnoses of HIV in 2010
and it is estimated that 428
people are living with HIV and
an additional 308 are living
with AIDS.6 The rate of HIV
infection in El Paso County is
lower than Denver, Adams, and
Arapahoe Counties (Table 1). ▪
“The rates of sexually transmitted
infection for all ages in El Paso County
are higher than the state average.”
Table 1: HIV incidence in selected Colorado Counties, 2006 to 2010
County
New HIV infections per
100,000 population
Denver
30.3
Adams
12.7
Arapahoe
11.2
El Paso
4.7
Pueblo
4.2
Jefferson
3.7
Larimer
3.2
Weld
2.7
Douglas
2.3
El Paso County Health Indicators 2012 Report
Page 46
Figure 4: Rates of sexually transmitted infections, 2006 to 2010
140
Gonorrhea
127.0
120
Cases per 100,000 population
El Paso County
100
Colorado
80
65.2
76.8
60
55.4
40
20
0
2006
2007
600
Cases per 100,000 population
500
2008
Year
2009
2010
Chlamydia
490.7
435.4
400
386.7
300
341.4
El Paso County
Colorado
200
100
0
2006
2007
2008
Year
2009
2010
Robert Wood Johnson Foundation [Internet]. 2011 County Health Rankings. Available from: www.countyhealthrankings.org/health-factors/unsafe-sex.
Colorado Department of Public Health and Environment [Internet]. Colorado Health Information Dataset: 2008-2010 Pregnancy Risk Assessment
Monitoring System. Available from: www.chd.dphe.state.co.us/cohid/topics.aspx?q=Pregnancy_Risk_Assessment_Data.
3
Colorado Department of Public Health and Environment [Internet]. Colorado Health Information Dataset: 2000-2010 Birth Data. Available from:
www.chd.dphe.state.co.us/cohid/topics.aspx?q=Birth_Data.
4
Centers for Disease Control and Prevention [Internet]. 2009 Youth Risk Behavior Surveillance System. Available from: www.cdc.gov/yrbs/.
5
Colorado Department of Public Health and Environment (CDPHE). 2006-2010 Rates of Chlamydia and Gonorrhea. Provided by CDPHE STI/HIV
Surveillance Program on July 28, 2011.
6
Colorado Department of Public Health and Environment [Internet]. Colorado HIV Surveillance Report [4th Quarter 2010]. Available from:
www.cdphe.state.co.us/dc/HIVandSTD/HIV_STDSurv/HIV.AIDS.Surv.rpt.4thQuarter.2010.pdf.
1
2
El Paso County Health Indicators 2012 Report
Page 47
Health Indicators
Vaccine-Preventable Infectious Diseases
Death and illness from
infectious diseases have
declined markedly in the United
States over the past century and
these successes are considered
one of the 10 great public
health achievements, according
to the Centers for Disease
Control and Prevention.1 Over
this time, disease control
resulted from improvements
in sanitation and hygiene,
the discovery of antibiotics,
and the implementation of
universal childhood vaccination
programs. Immunizations also
are largely responsible for the
increase in life expectancy in
the United States during the
20th century because of their
ability to increase childhood
survival of certain diseases.2
Immunizations are widely
available for once common
childhood infectious diseases
such as polio, tetanus, measles,
mumps, varicella (chickenpox),
and pertussis (whooping
cough).
Vaccines protect individuals
by inducing the production of
protective antibodies against
the germ, which either prevent
infection from occurring or
reduce the severity of illness.
However, immunized people
also help protect those in their
home and community who
are vulnerable to infectious
diseases, including people with
weakened immune systems
that cannot receive vaccines
or babies who are too young
to receive vaccines. For many
vaccines, when more than
90 percent of a population is
immunized against a particular
infectious disease, this level
of immunity makes spread
of infection from one person
to another unlikely. Even
individuals not vaccinated
are offered some protection
because the disease has little
opportunity to spread within
the community. This concept is
referred to as ‘herd immunity’.3
How is it measured?
The incidence of vaccinepreventable infectious diseases
is measured through public
health surveillance systems at
the local, state, and national
level. In Colorado, the State
Board of Health determines
which conditions and diseases
are required to be reported
to state and local health
departments. Immunization
rates in Colorado are most
commonly assessed through
school-based audits conducted
by the Colorado Department of
Public Health and Environment.
Additional data also is available
through parent and health
care provider surveys that are
performed at the national level
by the Centers for Disease
Control and Prevention.
Cases per 100,000 population
How are we doing in El
Paso County?
The diphtheria-tetanuspertussis (DTaP) vaccine is
recommended for all children
Figure 1. Rate of pertussis, by age group, El Paso County 2009 to 2011 between the ages of 2 months
35
and 18 months who do not have
31.5
a medical contraindication to
30
vaccination. In Colorado in
2010, 86.0 percent of children
25
ages 19 to 35 months had
received four DTaP doses,
20
with no significant change
15
in uptake since 2008 (86.5
10.5
percent).4 With immunization
9.6
10
levels being lower than desired,
pertussis remains prevalent in
5
1.8
our community. Figure 1 shows
1.5
the rate of pertussis by age
0
<1 year
1-5 years
6-17 years
18-44 years
45+ years
group in El Paso County from
Age
2008 to 2010.5 Infants have
El Paso County Health Indicators 2012 Report
Page 48
the highest rate of pertussis
infection at 31.5 cases per
100,000 population, and suffer
the most severe consequences
including prolonged illness,
hospitalization, and death.
However, a substantial number
of pertussis cases occur in
adults ages 18 years and older
(29 percent of all cases between
2009 and 2011). Adolescents
and adults with pertussis may
have delayed diagnosis or not
seek medical care at all, but
are infectious and can spread
disease within their homes,
workplaces, or schools.
The pneumococcal conjugate
vaccine (PCV) protects
children against several
types of infections caused by
Streptococcus pneumoniae,
such as bloodstream
infection and meningitis.
PCV is recommended to be
administered in four doses to
children between the ages of
2 months and 15 months. In
Colorado in 2010, 81.6 percent
of children ages 19 to 35 months
had received four PCV doses,
showing no difference since
2008 (82.5 percent).4 Serious
pneumococcal infections
disproportionately impact the
health of infants and young
children as well as elderly adults
(Figure 2).5 For children, the
highest rates of infection are for
those under 1 year of age; and
among adults the rate of disease
rises markedly for people 65
years and older (who are at
higher risk for pneumonia).
Adult pneumococcal vaccine
(also referred to as the
‘pneumonia’ vaccine) is
recommended for people 65
years and older, and national
data shows that in 2010,
coverage was 59.7 percent
overall.6 Among people ages 65
years and older, non-Hispanic
whites had higher vaccination
coverage (63.5 percent)
compared with Hispanics
(39.0 percent), non-Hispanic
blacks (46.2 percent), and nonHispanic Asians (48.2 percent).
In El Paso County, nearly
three-quarters of senior adults
had reported ever receiving a
pneumococcal vaccine (2009 to
2010).7
The Colorado Board of Health
requires children entering
kindergarten to have received
Figure 2. Rate of serious pneumococcal infection, by age group,
El Paso County 2009 to 2011
35
31.5
30.3
Cases per 100,000 population
30
25
20
16.7
15
10
8.1
5
3.1
0
<1 year
1-4 years
5-17 years
Age
18-64 years
65+ years
vaccinations for DTaP; measles,
mumps, rubella (MMR); polio;
hepatitis B; and varicella, unless
an exemption has been made for
religious or medical reasons.8
Statewide for the 2010 to 2011
school year, between 79 and
93 percent of kindergartners
entered school being upto-date on these required
vaccines, with MMR having
the lowest compliance. Overall,
6.3 percent of kindergartners
exempted from one or more
required vaccines. The percent
of kindergartners who claimed
an exemption was highest for
varicella and MMR and lowest
for DTaP.
Data on immunization rates
for adolescents shows more
variability, in part because
newer vaccines have just
recently been recommended
and more time is needed before
a vaccine is commonly used
in the population. Certain
adolescent vaccines serve to
boost immunity that has been
lost over time from childhood
immunizations (e.g., MMR).
Other immunizations are
recommended for adolescents
because this age group is more
susceptible to certain diseases
(e.g., meningitis, human
papillomavirus). Table 1 shows
the percent of Colorado youth
ages 13 to 17 years who are
up to date on recommended
vaccinations. More than 85
percent of adolescents have
received the MMR and pertussis
(Tdap) booster doses; however,
less than 60 percent are
receiving the vaccine to prevent
meningitis and only 40.9
percent of females have received
the human papillomavirus
vaccine. ■
El Paso County Health Indicators 2012 Report
Page 49
Figure 3. Percent of Colorado kindergarteners
up-to-date on required immunizations at school entry,
2010-11 school year
100
92.6%
90
90.6%
82.6%
80
80.3%
79.4%
Varicella
MMR
Percent Vaccinated
70
60
50
40
30
20
10
0
DTaP
Hepatitis B
Polio
Table 1. Percent of Colorado adolescents ages 13 to 17
years who received recommended vaccines, 2010
Vaccine
Percent of
adolescents
Tdap
85.7%
Meningitis
59.6%
MMR
92.6%
HPV (females only)
40.9%
“The Colorado
Board of
Health requires
children entering
kindergarten to
have received
vaccinations for
DTaP; measles,
mumps, rubella
(MMR); polio;
hepatitis B; and
varicella, unless an
exemption has been
made for religious
or medical reasons.
Statewide for the
2010 to 2011 school
year, between 79
and 93 percent of
kindergartners
entered school
being up-to-date
on these required
vaccines, with MMR
having the lowest
compliance.”
Centers for Disease Control and Prevention. “Achievements in Public Health, 1900-1999: Control of Infectious Diseases,” MMWR 48(29): 621-629,
July 30, 1999. Available from: www.cdc.gov/mmwr/preview/mmwrhtml/mm4829a1.htm.
2
U.S. Department of Health and Human Services [Internet]. Healthy People 2020: Immunization and Infectious Diseases. Available from:
www.healthypeople.gov/2020/topicsobjectives2020/overview.aspx?topicId=23.
3
U.S. Department of Health and Human Services, National Institutes of Health [Internet]. Community Immunity. Available from:
www.niaid.nih.gov/topics/Pages/communityImmunity.aspx.
4
Centers for Disease Control and Prevention [Internet]. 2007-2010 National Immunization Survey Data [Internet]. Available from:
www.cdc.gov/vaccines/stats-surv/nis/default.htm#nis.
5
Colorado Department of Public Health and Environment, Disease Control and Environmental Epidemiology Division. Colorado Electronic Disease
Reporting System. Accessed on Apr 2, 2012.
6
Centers for Disease Control and Prevention. “Adult Vaccination Coverage – United States, 2010,” MMWR 61(04): 66-72, February 3, 2010. Available
from: www.cdc.gov/mmwr/preview/mmwrhtml/mm6104a2.htm?s_cid=mm6104a2_w.
7
Colorado Department of Public Health and Environment [Internet]. Colorado Health Information Dataset: 2009-2010 Behavioral Risk Factor
Surveillance System. Available from: www.chd.dphe.state.co.us/cohid/topics.aspx?q=Behavioral_Risk_Factors.
8
Colorado Department of Public Health and Environment, Immunization Section [Internet]. 2010-2011 Immunization School Survey Assessment.
Available from: www.cdphe.state.co.us/dc/immunization/11-12schoolYear/School%20Imm%20Survey%209-16-11%20B.pdf.
1
El Paso County Health Indicators 2012 Report
Page 50
Glossary of Terms
Age-adjusted Rate
Rate of a disease or health condition for a given population that has been standardized to control for
the influence different age groups might have on health-related events when comparing populations.
Age-adjusted rates are commonly used when comparing death data between two populations.
Age-specific Rate
Rate of a disease or health condition for a particular age group within a given population. Teen
fertility rates are one example.
Birth Rate
The number of live births to females of a specific age group per 1,000 females in the specified age
group. Also referred to as a fertility rate.
Census Tract
A small, relatively permanent statistical subdivision of a county created for the purpose of
presenting data. Census tracts are designated by the United States Census Bureau and intended to
be homogeneous with respect to population characteristics, economic status, and living conditions.
Census tracts usually have between 2,500 and 8,000 persons and do not cross county boundaries. The
spatial size of census tracts varies widely depending on the density of a particular settlement.
Healthy People 2020
Health goals defined at the national level by the Department of Health and Human Services,
which communicate a vision for improving health and achieving health equity with a set of specific
measurable objectives; these objectives are defined as targets to be achieved by the year 2020.
Incidence
Measures the occurrence of new cases of a disease, health condition, or health-related event that
occurs within a specified population over a period of time (commonly based on an annual basis). For
example, the number of Colorado children newly diagnosed with asthma during 2011. Incidence is
commonly reported as a rate of disease or condition per 100,000 population.
Margin of Error/Error Bars (See Methodology)
When measurements are calculated from a sample of people within a population, these values are
subject to a level of uncertainty or error. This uncertainty can be represented through the use of
a margin of error, which indicates a range of values for which there is a 95 percent probability of
containing the true value for the entire population. Error Bars are included on some Figures in the
report and these represent the (95%) upper and lower limits of the margin of error.
Morbidity
A general term used to describe the occurrence of disease or health conditions. Morbidity does not
include death.
Mortality
A term used to describe the occurrence of death.
El Paso County Health Indicators 2012 Report
Page 51
Poverty Threshold
Income thresholds developed by the United States Census Bureau that incorporate the size and
composition of a family to determine who is in poverty. If a family’s income is less than the family’s
poverty threshold, then that family and each individual member is considered to be in poverty. These
thresholds are updated annually to account for inflation. The Census Bureau’s poverty thresholds are
calculated differently than the poverty guidelines issued by the Department of Health and Human
Services to determine eligibility for public assistance.
Prevalence
Measures the presence of existing cases of a disease, health condition, or other attribute within a
population at a specific point in time. For example, the proportion of Colorado adults who were
current smokers in 2011.
Proportion
The ratio of a part to the whole, commonly expressed as a percent.
Rate
A measure of frequency often used to describe how often a disease, health condition, or health-related
event is occurring in a population. Fertility rates, incidence rates, and mortality rates are common
examples.
Years of Potential Life Lost (YPLL)
A measure of premature death which describes the number of years that an individual was expected to
live beyond his or her death. A cause of death that is more common among children and young adults
(e.g., accidents) will result in more YPLL than would a chronic disease more common among elderly
persons.
El Paso County Health Indicators 2012 Report
Page 52
El Paso County Public Health
1675 W. Garden of the Gods Road, Suite 2044
Colorado Springs, Colorado 80907
www.elpasocountyhealth.org
(719) 578-3199
El Paso County Health Indicators 2012 Report
Page 53


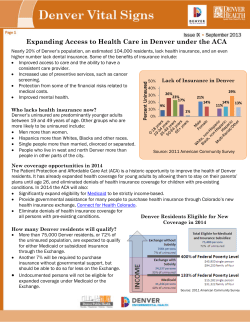


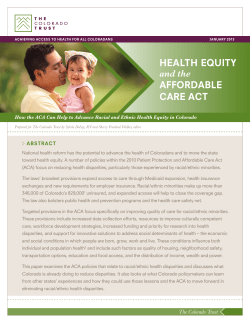
© Copyright 2026