
Chapter 5 Results and discussion
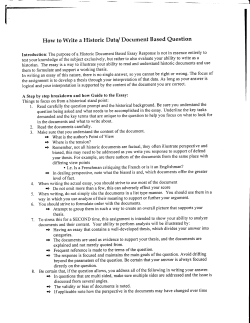
Chapter 5 Results and discussion 5.1 Preformulation and authentication of drug A. Differential Scanning Colorimetry Fig. 5.1 DSC curve for RPG Fig. 5.2 DSC curve for MTF The physical state of RPG and MTF was confirmed by DSC. (Fig. 5.1 & 5.2) The DSC curve for RPG and MTF showed sharp endotherm at 136.69oC and 234.59oC, confirming samples were in pure state. Ph.D. Thesis 61 Chapter 5 Results and discussion B. Ultra Violet Spectrum Table 5.1 max of RPG and MTF in different solvents. max (nm) S. No. Solvent RPG MTF 1 Methanol 236.0 237.5 2 Distilled water 240.5 234.0 3 0.1 N HCl 237.5 233.0 4 Phosphate buffer (PH 6.8) 236.0 238.5 5 Octanol 240.5 237.0 Ph.D. Thesis 62 Chapter 5 Results and discussion C. Fourier Transform Infra Red Spectroscopy (FTIR) Fig. 5.3 FTIR spectrum of RPG Ph.D. Thesis 63 Chapter 5 Results and discussion Fig. 5.4 FTIR spectrum of MTF RPG and MTF were identified on the basis of UV and FTIR analysis. The drug samples exhibited absorption maxima in the range of 200-400 nm, which was same as mentioned in literature. The FTIR of the drug Ph.D. Thesis 64 Chapter 5 Results and discussion confirmed characteristic absorption bands. On the basis of above studies, it was proved that drug samples were authentic. E. pH solubility profile Table 5.2 Solubility of RPG & MTF at different pH Conc. (g mL-l) S. No. Media RPG MTF 665.9 893.3 1. 0.1 N HCl (PH 1.2) 2. Acetate buffer (PH 4.5) - 904.8 3. Phosphate buffer (PH 6.8) - 500.3 4. Distilled water (PH 7.2) - 997.4 5. Borate buffer (PH 8.6) - 629.9 884.6 - 6. Ethanolic phosphate buffer (5:5; PH 6.8) On the basis of the above studies the solubility of MTF was increased, as pH was increased and showed maximum solubility in alkaline medium. However RPG was found to be soluble in ethanolic phosphate buffer. F. Stability at different temperatures The max was obtained at 240 and 234 nm for RPG and MTF respectively. This showed that no degradation of the drugs had occurred at 370C and 80C indicating stability of the drugs. 5.2 Analytical methodology 5.2.1 Repaglinide High Performance Thin Layer Chromatography (HPTLC) i) Mobile phase optimization The TLC procedure was optimized with a view to develop a stabilityindicating assay method. Both the pure drug and the degraded drug solution were spotted on the TLC plates and run in different solvent Ph.D. Thesis 65 Chapter 5 Results and discussion systems. Initially, chloroform/methanol/ammonia was tried. The mobile phase chloroform/methanol/ammonia (7.5:1.5:0.9, v/v/v) gave good resolution with RF value of 0.38 for repaglinide but typical peak nature was missing. Also the spot for repaglinide was slightly diffused. Addition of 1.5 mL of glacial acetic acid to the above mobile phase improved the spot characteristics. Finally, the mobile phase consisting of chloroform/methanol/ammonia/glacial acetic acid (7.5:1.5:0.9:0.1, v/v/v/v) gave a sharp and symmetrical peak with RF value 0.38 ± 0.02 (Fig. 5.5). Well-defined spots were obtained when the chamber was saturated with the mobile phase for 30 min at room temperature. Fig. 5.5 Typical chromatogram of standard RPG (400 ng spot-1); peak 1: RF: 0.38 ± 0.02, mobile phase chloroform/methanol/ammonia/glacial acetic acid (7.5:1.5:0.9:0.1, v/v/v/v) at 240 nm. ii) Validation A. Linearity The linear regression data for the calibration curves (n=3) showed a good linear relationship over concentration range 50–800 ng spot−1 with respect to the peak area. The regression equation was found to be Y = Ph.D. Thesis 66 Chapter 5 Results and discussion 12.138 + 74.235 with correlation coefficient (r ± S.D.) of 0.998 ± 0.032. No significant difference was observed in the slopes of standard curves (ANOVA, P > 0.05). B.Precision Precision was considered at two levels of ICH suggestions i.e. repeatability and intermediate precision. Repeatability of sample application was determined as intra-day variation whereas intermediate precision was determined by carrying out inter-day variation at three different concentration levels 100, 300 and 500 ng spot-1 in triplicates. % R.S.D. was found in the range between 0.1648–0.2859% and 0.1285– 0.3539%, respectively (Table 5.3). The low value of % R.S.D. (<1%) reveals an excellent precision of the method. Table 5.3 Intra- and inter-day precision of HPTLC method (n=3) Amt Intra-day precision ng Mean S.D. %RSD Inter-day precision SE Mean S.D. %RSD SE -1 spot area 100 4738.65 13.55 0.2859 7.8233 4625.43 12.43 0.3539 7.1766 300 15342.95 25.30 0.1648 14.6073 14832.75 14.57 0.2098 8.4122 500 25683.54 55.63 0.2169 32.1189 26893.54 45.44 0.1285 26.2355 area iii) Accuracy, as recovery The proposed method when used for extraction and subsequent estimation of repaglinide from bulk drug and nanoemulsion formulation formed after spiking with 50%, 100% and 150% of additional drug afforded recovery of 98.79–99.61%, as listed in Table 5.4 Ph.D. Thesis 67 Chapter 5 Results and discussion Table 5.4 Accuracy, as recovery studies (n=6) Excess Theoretical Amount (%) (%) S.E. drug content (ng) obtained (ng) Recovery R.S.D. 0 200 198.76 99.38 0.486 0.572 50 300 298.84 99.61 0.354 0.584 100 400 396.61 99.15 0.515 1.153 150 500 493.97 98.79 0.286 0.654 added to analyte (%) iv) Robustness The S.D. of peak areas was calculated for each parameter and RSD was found to be less than 2%. The low values of % RSD as shown in Table 5.5 indicated robustness of the method. Table 5.5 Robustness testing (n=6) Parameters S.D % R.S.D. S.E. Mobile phase composition (± 0.2 mL) 1.36 1.14 0.785 Amount of mobile phase (±5%) 1.08 0.85 0.623 Temperature (± 5%) 1.34 1.04 0.773 Plate pretreatment (± 5 min) 0.89 0.67 0.513 Relative humidity (± 5%) 1.44 1.21 0.831 Time from spotting to chromatography 0.75 0.63 0.433 0.93 0.74 0.536 ( ± 20 min) Time from chromatography to scanning ( ± 20 min) v) Specificity The peak purity of repaglinide was assessed by comparing the spectra at peak start, peak apex and peak end positions of the spot, i.e. r2 (S, M) = 0.9997 and r2 (M, E) = 0.9979. Good correlation (r2 = 0.9998) was also obtained between standard and sample spectra of repaglinide. Ph.D. Thesis 68 Chapter 5 Results and discussion vi) Sensitivity The signal-to-noise ratios 3:1 and 10:1 were considered as LOD and LOQ, respectively. The LOD and LOQ were found to be 0.023 and 0.069 ng spot-1, respectively. vii) Nanoemulsion analysis for RPG A single spot at RF 0.38 was observed in the chromatogram of the drug samples extracted from prepared formulation. There was no interference from the excipients commonly present in the formulation. The drug content was found to be 99.39 ± 0.35 % with a % RSD of 0.62 for six replicate determinations. It may therefore be inferred that degradation of repaglinide had not occurred in the prepared nanoemulsion formulation that were analysed by this method. The good performance of the method indicated the suitability of this method for routine analysis of repaglinide in pharmaceutical dosage form. viii) Forced degradation of repaglinide Fig. 5.6 Forced degradation study; (A) Chromatogram of acid treated RPG (peak 1: degraded, RF: 0.19; peak 2: repaglinide, RF: 0.38; peak 3: degraded. RF: 0.43); (B) Chromatogram of base treated RPG (peak 1: degraded, RF: 0.20; peak 2: degraded, RF: 0.25; peak 3: degraded, RF: 0.29; peak 4: repaglinide, RF: 0.38; peak 5: degraded, RF: 0.51). Ph.D. Thesis 69 Chapter 5 Results and discussion A. Acid & base induced degradation The chromatogram of the acid degraded sample for repaglinide showed peak at RF 0.19 and 0.43 (Fig. 5.6A). The chromatogram of the base degraded sample showed peak at RF value of 0.20, 0.25, 0.29 and 0.51 (Fig. 5.6B). The areas of the degraded peaks were found to be lesser than the area of standard drug concentration (400 ng spot -1) indicating that repaglinide undergoes degradation under acidic and basic conditions. B. Photo-UV degradation The photo degraded sample showed one additional peak at R F 0.22 when drug solution was left in daylight for 3 days. The drug was degraded when exposed to UV irradiation for 10 days and showed additional peaks at RF value of 0.53. C. Dry & wet heat degradation The samples degraded under dry heat and wet heat conditions (Figs. 5.7A & 5.7B) showed additional peaks at RF 0.16, 0.46 and 0.51, respectively. The spots of degraded products were well resolved from the drug spot. Fig. 5.7 Chromatograms of (A) dry heat degraded RPG (peak 1: degraded, RF: 0.16, peak 2: repaglinide, RF: 0.38, peak 3: degraded, RF: 0.45); (B) wet heat degraded RPG (peak 1: repaglinide, RF: 0.38, peak 2: degraded, RF: 0.51). Ph.D. Thesis 70 Chapter 5 Results and discussion D. Peroxide-induced degradation The sample degraded with 30% v/v hydrogen peroxide showed additional peaks at RF value of 0.41, 0.46 and 0.62 (Fig. 5.8A). The spots of degraded products were well resolved from the drug spot. ix) Detection of the related impurities The spots other than the principal spot (repaglinide) from the sample solution was not intense than the principal spot from the standard solution. The sample solution showed one additional spot at R F0.06 (Fig. 5.8B). However, the peak area of the additional spot was found to be much less as compared to the peak area of principal spot from the standard solution. Fig. 5.8 Chromatogram of (A) hydrogen peroxide treated RPG (peak 1: repaglinide, RF: 0.38, peak 2: degraded, RF: 0.41, peak: 2 degraded, RF: 0.46, peak 3: degraded, RF: 0.62); (B) impurity profiling (peak 1: impurity, RF: 0.06. peak 2: repaglinide, RF: 0.38). x) Degradation kinetics In basic medium, a decrease in the concentration of drug with increasing time was observed. At the selected temperatures (50, 70 and 90 0C), the degradation process followed pseudo first-order kinetics. Apparent first order degradation rate constant and half life were obtained from the Ph.D. Thesis 71 Chapter 5 Results and discussion slopes of the straight lines at each temperature. Data obtained from first order kinetics treatment was further subjected to fitting in Arrhenius equation; [K = Ae-Ea/RT], Where K is rate constant, A is frequency factor, Ea is energy of activation (Cal mol–1), R is gas constant (1.987 cal deg-1 mol-1) and T is absolute temperature (oK). A plot of (2 + log Kobs) values versus (1/T × 103) the Arrhenius plot was obtained (Fig. 5.9), which was found to be linear in the temperature range of 40–90 0C. The degradation rate constant at room temperature (K250) was obtained by extrapolating the resulting line in Arrhenius plot to 25 0C (Fig. 5.10) and was found to be 12.4 × 10⁻² h−1 and calculated t1/2 and t0.9 were 5.59 and 0.848 h respectively. Fig. 5.9 Pseudo first-order plot for the degradation of RPG with 1M NaOH at various temperatures using HPTLC method. Ct, concentration at time t, C0, concentration at time zero. Ph.D. Thesis 72 Chapter 5 Results and discussion Fig. 5.10 Arrhenius plot for RPG degradation in 1M NaOH and its extrapolation for predicting the degradation at room temperature (25 °C). 5.3 Formulation development and optimization of repaglinide nanoemulsion A. Screening of components i. Oils Modified or hydrolysed vegetable oils have been widely used since these excipients formed good emulsification systems with large number of surfactants approved for oral administration and exhibited better drug solubility properties (Kimura et al, 1994, Constantinides, 1995, Hauss et al, 1998). They offer formulative and physiological advantages and their degradation products resemble the natural end products of intestinal digestion. ii. Surfactants An important criterion for selection of the surfactants is that the required HLB value to form o/w nanoemulsion was >10 (Kommuru et al, 2001). The surfactant chosen must be able to lower the interfacial tension to a very small value to aid dispersion process during the preparation of the nanoemulsion, provided a flexible film that can readily deform the Ph.D. Thesis 73 Chapter 5 Results and discussion correct curvature at the interfacial region for the desired nanoemulsion type. iii. Cosurfactants Transient negative interfacial tension is rarely achieved by the use of single surfactant, usually necessitating the addition of a cosurfactant. Fluid interfacial film is again achieved by the addition of a cosurfactant. B. Phase solubility studies Phase solubility studies were done to determine the most suitable oil for the preparation of nanoemulsion for repaglinide. Table 5.6 Phase solubility determination (n=3) S. No. Oil Average ± S.D. (mg mL-1) 1 Sefsol 218 182.06 + 0.04 2 Sefsol :Tween 80 (2:1) 94.23 + 0.08 3 Sefsol :Tween 80 (1:1) 89.98 + 1.06 4 Caproyl 90 45.7 + 0.75 5 Hydrogenated castor oil 64.37 + 9.35 6 Triacetin 35.85 + 2.20 7 Labrafac 23.54 + 1.22 8 Tween 80 98.73 + 8.39 9 Lauroglycol 15.68 + 3.59 10 Tween 20 43.48 + 7.12 Ph.D. Thesis 74 Chapter 5 Results and discussion 200 180 160 solubility (mg/mL) 140 120 100 80 60 40 20 0 SF 218 S:T 80 S:T 80 T80 H C O CP 90 T20 oils (2:1) (1:1) TCN LBF LRG IPM OA Fig. 5.11 Bar diagram showing the highest solubility of repaglinide in sefsol 218, HCO-Hydrogenated castor oil, CP90 -Caproyl 90, SF218 Sefsol 218, T80 -Tween 80. T20 -Tween 20, TCN - Triacetin, LBFLabrafac, LRG - Lauroglycol, IPM -Isopropyl myristate, OA - Oleic acid, S:T 80 (2:1)- Sefsol:Tween 80 (2:1) , S:T 80 (1:1) - Sefsol:Tween 80(1:1). Oil represents one of the most important excipients in the nanoemulsion formulation, which can solubilize marked amounts of the lipophilic drug and also because it can increase the amount of lipophilic drug transportation (Holm et al, 2002). Sefsol 218 was found to solubilize Ph.D. Thesis 75 Chapter 5 Results and discussion maximum quantity of repaglinide i.e. 182.06 ± 7.68 mg/mL for the preparation of nanoemulsion (Fig. 5.11). Therefore, it was selected as the oil phase for the development of nanoemulsion. Higher oil solubility of a poorly water soluble drug will favor an overall stability of the formulation with effective dose optimization leading to cost effective delivery system for repaglinide. Tween 80 was selected as the surfactant and transcutol as the co-surfactant. Surfactant lowers the interfacial tension to a very small value to aid dispersion process and provide a flexible film that can readily deform around the droplets. The presence of co-surfactants allows the interfacial film sufficient flexibility to take up different curvatures required to form nanoemulsion over a wide range of composition (Gosh, Murthy, 2006). Milli-Q water was taken as the aqueous phase. All the selected excipients for the preparation of formulations were under the GRAS (Generally Regarded as Safe) category (Table 5.6). C. Phase diagram construction Pseudoternary phase diagrams were developed using the aqueous titration method. Slow titration with the aqueous phase was performed for each combination of oil and Smix, separately. The amount of aqueous phase added was varied to produce a water concentration in the range of 5% to 95% of total volume at around 5% intervals. The phase behavior of nanoemulsion system comprising oil, water and S mix ratio can be studied with the aid of ternary phase diagram in which each corner of the diagram represents 100% of that particular component. Special care was taken to ensure that observations are not made on metastable systems (Gosh, Murthy, 2006). The pseudoternary phase diagrams were constructed using sefsol-218 as oily phase, Smix ratio (Tween 80 as a surfactant and transcutol as a co-surfactant) and water. In the phase diagrams, only o/w nanoemulsion region is shown, other phases are not Ph.D. Thesis 76 Chapter 5 Results and discussion shown due to overcrowding of the diagrams. Pseudoternary phase diagrams were constructed separately for each Smix ratio (Fig. 5.12A–F). In Fig. 5.12A, (Smix ratio 1:0) surfactant was used alone without cosurfactant and observed that a low amount of oil (27%, v/v) was solubilized at high concentration of surfactant (48% v/v). Oil solubilization was decreased as the concentration of surfactant was increased. On addition of co-surfactant, solubilization of oil was increased at lower concentration of Smix (1:1) and the region for nanoemulsion in phase diagram was increased, as shown in Fig. 5.12B. With slight increase in the concentration of co-surfcatant (Smix ratio 2:1), no marked difference in nanoemulsion region in phase diagram, Fig. 5.12C was observed. In Smix ratio 3:1, (Fig. 5.12D), there was an increrement in the nanoemulsion region with increasing concentration of co-surfactant. But as the concentration of surfactant increasing in S mix 1:2 and 1:3, the region for nanoemulsion was decreasing due to decreasing oil solubilization (Fig. 5.12E & F). This indicates that the proper ratio of Smix is important for a wide range of nanoemulsion region in phase diagram. Different formulations having less than 27% of the oily phase and minimum quantity of Smix were selected from phase diagrams for further studies. This may be attributed to the fact that the addition of cosurfactant may lead to greater penetration of the oil phase in the hydrophobic region of the surfactant monomers thereby further decreasing the interfacial tension, which will lead to increase in the fluidity of the interface and thus increasing the entropy of the system (Gosh, Murthy, 2006). While studying the phase diagrams (Fig. 5.12 A–5.12 F), it can be seen that transient negative interfacial tension is rarely achieved by the use of single surfactant, usually necessitating the addition of a cosurfactant. Fluid interfacial film is again achieved by the addition of a co-surfactant. In the absence of co-surfactant, a highly rigid Ph.D. Thesis 77 Chapter 5 Results and discussion film is formed by the surfactant and thus it produces nanoemulsion over only a very limited range of concentration (Lawrence, Rees, 2000). Fig. 5.12 Pseudo-ternary phase diagrams [Smix ratio = 1:0 (A), 1:1 (B), 2:1 (C),3:1 (D), 1:2 (E), 1:3 (F)].The dotted area represents o/w nanoemulsion region. D. Thermodynamic stability Nanoemulsions are thermodynamically stable systems with no phase separation, creaming or cracking. Therefore, the selected formulations were subjected to thermodynamic studies (i.e. heating cooling cycle, centrifugation and freeze–thaw cycle). The observation for thermodynamic stability studies are given in Table 5.7. Formulations, which did not pass the thermodynamic tests, were dropped out and the remaining were subjected to dispersibility test. In case of macroemulsions, the interfacial energy is much larger than the entropy and hence the process of emulsification is non-spontaneous i.e. energy is needed to produce the emulsion by the use of high-speed mixture, whereas in case of nanoemulsion the interfacial tension is made Ph.D. Thesis 78 Chapter 5 Results and discussion sufficiently low so that interfacial energy become comparable or even lower than the entropy of dispersion, and hence the free energy of the system becomes zero or negative. This explains the thermodynamic stability of nanoemulsion (Razdan, Deverajan, 2003). E. Dispersibility tests The use of gastro-intestinal fluids for dilution of nanoemulsion may result in the gradual desorption of surfactant located at the globule interface leading to precipitation of the drug or phase separation of the nanoemulsion making the formulation useless. The dispersibility test was carried out to assess the efficiency of nanoemulsion and the results are demonstrated in Table 5.7 Formulations, which failed dispersibility test i.e B, C, D and E were discarded. Ph.D. Thesis 79 Chapter 5 Results and discussion Table 5.7 Observations for thermodynamic stability study and dispersibility test of repaglinide nanoemulsion formulations. Smix Formulation ratio code 1:0 1:1 2:1 % Smix % Oil % Observations based on Observations Water themodynamic stability test HCa Centb Fc based dispersibility test Distilled H2 O on Inference 0.1 N HCl RN 1 20 5 75 x – – – – Failed RN 2 25 10 65 x – – – – Failed RN 3 25 5 70 x – – – – Failed RN 4 30 20 50 x – – B B Failed RN 5 30 10 60 C C Failed RN 6 30 5 65 A A Passed RN 7 35 15 50 x B B Failed RN 8 35 10 55 x C C Failed RN 9 35 5 60 x C C Failed RN 10 40 10 50 x – B B Failed RN 11 40 5 55 x – B B Failed RN 12 45 5 50 A A Passed RN 13 30 5 65 A A Passed RN 14 35 5 60 x – B B Failed Ph.D. Thesis 80 Chapter 5 3:1 1:2 1:3 Results and discussion RN 15 40 10 50 x – B B Failed RN 16 40 5 55 A A Passed RN 17 45 5 50 A A Passed RN 18 40 5 55 A A Passed RN 19 40 10 50 A A Passed RN 20 40 10 50 x C C Failed RN 21 30 5 65 x B B Failed RN 22 30 10 60 x B B Failed RN 23 35 5 60 x B B Failed RN 24 40 5 55 x C C Failed RN 25 40 10 50 x D D Failed RN 26 45 5 50 x B B Failed RN 27 30 20 50 x – – D D Failed RN 28 35 15 50 x – – E E Failed RN 29 40 10 50 x E E Failed RN 30 45 5 50 x D D Failed a Heating–cooling cycle, bCentrifugation, cFreeze–thaw cycle. Ph.D. Thesis 81 Chapter 5 Results and discussion F. Formulation of drug containing nanoemulsion Six formulations (RN12, RN13, RN16, RN17, RN18 and RN19) were selected on the basis of above studies, which were subjected to further studies after addition of drug. The composition of selected formulations is given in Table 5.7 G. Characterization of repaglinide nanoemulsion i) Visual observation The nanoemulsion was clear transparent, easily flowable liquid whereas the macroemulsion was opaque and milky/cloudy white in appearance. ii) Surface morphology Morphology and structure of the nanoemulsion droplets were determined by Transmission electron microscopy (TEM). The surrounding was bright and the nanoemulsion appeared dark (Fig. 5.13A). A “positive” image was seen using TEM. It is capable of point-to-point resolution; therefore, droplet sizes were measured using TEM. iii) Droplet size analysis (particle size distribution) The RN13 formulation was presented minimum droplet size (76.23 ± 4.14 nm) whereas RN17and RN18 showed increase in the droplet size due to increased concentration of oil (Table 5.8). In formulation RN13, the distribution of droplets was in the range of 76–89 nm and the maximum droplets (82%) were below a size of 90 nm (Fig. 5.13B). The formulation showed nano droplets with low values of polydispersity indicating uniformity in the nanoemulsion formulation. The polydispersity values were 0.214, 0.183, 0.195, 0.229, 0.407 and 0.198 for different formulations RN12, RN13, RN16, RN17, RN18 and RN19 respectively (Table 5.8). Ph.D. Thesis 82 Chapter 5 Results and discussion Fig. 5.13 Transmission electron microscopic positive image of optimized repaglinide nanoemulsion (Formulation RN13). B. Size distribution by intensity of optimized nanoemulsion (Formulation RN13) iv) Viscosity determination The viscosities of the nanoemulsions (RN12, RN13 RN16, RN17, RN18 and RN19) are given in Table 5.8. The viscosity of nanoemulsion formulation was very low as expected as one of the characteristic. It was observed from the Table 5.8 that viscosity of all the formulations was less than 24 cps. Formumlation RN13 has the minimum viscosity i.e. Ph.D. Thesis 83 Chapter 5 Results and discussion 21.447 ± 0.215 cps. Results also revealed that the viscosity is directly proportional to the concentration of oils and surfactants used in the formulation. It can be observed that, in general, viscosity of all formulations was very low. v) Refractive index Refractive index (RI) being an optical property is used to characterize the isotropic nature of the nanoemulsion. It was observed from the Table 5.8 that the selected nanoemulsion formulations were chemically stable and remained isotropic in nature, thus having no drug excipient interactions. The observation table shows that as the concentration of the oils increases in the formulation, the RI increases (RN19) (Table 5.8). vi) Electrical conductivity Type of nanoemulsion (o/w or w/o) and the stability of the nanoemulsion (phase inversion on storage) can be determined by electrical conductivity (σ). The conductivity of the formulations is given in the Table 5.8 The lowest σ was found 403.213 ± 1.181μS/cm for RN17 and the highest was 527.106 ± 2.125μS/cm for RN12. This indicated that the formulation was o/w type. Electrical conductivity is directly proportional to the percentage of water. Higher the electrical conductivity more will be the percentage of water, which allows more freedom for mobility of ions. Ph.D. Thesis 84 Chapter 5 Results and discussion Table 5.8 Droplet size, polydispersity index, viscosity, refractive index and electrical conductivity of selected repaglinide nanoemulsion formulations. Formulation Droplet size ± S.D. Polydispersity indexa ± Viscosity ± S.D. Refractive index ± Conductivity code (nm)a S.D. (cps)a S.Da (μS/cm) ± S.Da RN 12 92.18 ± 8.31 0.214 ± 0.013 23.195 ± 0.342 1.6852 ± 0.008 527.106 ± 2.125 RN 13 76.23 ± 4.14 0.183 ± 0.011 21.447 ± 0.215 1.6605 ± 0.004 512.413 ± 3.157 RN 16 89.75 ± 6. 43 0.195 ± 0.014 22.412 ± 0.435 1.6962 ± 0.008 458.416 ± 4.685 RN 17 91.24 ± 11.82 0.229 ± 0.016 21.984 ± 0.463 1.6756 ± 0.005 403.213 ± 1.181 RN 18 96.19 ± 14. 97 0.407 ± 0.013 23.056 ± 0.216 1.7912 ± 0.007 452.415 ± 1.105 RN 19 97.15 ± 9.16 0.198 ± 0.017 23.857 ± 0.541 1.8502 ± 0.008 501.183 ± 5.764 a Mean ± S.D., n = 3 Ph.D. Thesis 85 Chapter 5 Results and discussion 5.4 In vitro drug release for repaglinide Dissolution studies were performed to compare the release of drug (2 mg repaglinide) from six different formulations (RN12, RN13, RN16, RN17, RN18, RN19) and marketed formulation i.e. Repaglinide tablet (REGAN) manufactured by Ranbaxy India Pvt. Ltd., India. The concentration was determined by extrapolation of calibration curve and graph was plotted between time and percent cumulative release (Fig. 5.14). The pattern of drug release in distilled water and simulated gastric fluid was found very similar to each other in all formulations. The highest release i.e. 98.22% was obtained in case of RN13. The minimum release was observed in RN19 formulation (61.90%), this may be due to bigger globule size, which may slow down the release of the drug from nanoemulsion formulation. All the nanoemulsion formulations showed better results as compared to conventional marketed formulation, (i.e. tablet) because of small globule size, low viscosity and low polydispersity values. Release of drug from RN19 (10% v/v, oil) was lower than that from RN12, RN13, RN16, RN17 and RN18 (5% v/v, oil) because of higher oil concentration and bigger droplet size. In addition to this, the higher oil concentration may restrain the release of drug into the medium due to lipophilic character of repaglinide as the partitioning of drug will be more towards the oil. Ph.D. Thesis 86 Chapter 5 Results and discussion 120 % Drug release 100 80 60 RN12 RN13 40 RN16 RN17 20 RN18 RN19 CF 0 0 1 2 3 4 5 6 7 8 9 10 11 12 13 14 15 16 17 18 19 20 21 22 23 24 Time (Hrs) Fig. 5.14 Comparative in vitro release profile of different formulations of repaglinide. The complete dissolution of repaglinide in oily phase showed maximum release because of small droplet size, and eventually higher surface area, which permits faster rate of drug release. The RN13 formulation (for each dose i.e. R1, R2 & R3) was selected for in vivo studies because it offered highest drug release (98.22%), optimum globule size (76.23 nm), minimum polydispersity value (0.183), lower viscosity (21.45 cps) and 30% v/v of Smix (tween 80 as surfactant, transcutol as the co-surfactant). 5.5 Biochemical evaluation of repaglinide The rats were divided into six groups, each containing six animals. A treatment schedule is given in (Table 5.9). The time course profile of blood glucose response in rats is shown in Table 5.10. The blood glucose level in diabetic rats significantly (p<0.001) reduced in orally administered drug (2 mg) upon 12 hrs and was reported as 109.99 ± 7.92 mg/dl from 304.40 ± 20.73 mg/dl, it was 169.02 ± 18.18 mg/dl (p<0.01), 99.74 ± 8.52 mg/dl (p<0.001) and 100.36 ± 9.50 mg/dl (p<0.001) from 301.73 ± 12.53 mg/dl, 302.32 ± 11.21 mg/dl and 309.63 ± 15.21 mg/dl for 12 hrs in case of orally Ph.D. Thesis 87 Chapter 5 Results and discussion administered nano-emulsion containing 0.5, 1.0 and 2 mg of repaglinide.The findings showed nano emulsion (having 1 mg/kg repaglinide) significantly decreased blood glucose level which was almost similar to oral conventional formulation of 2 mg repaglinide in diabetic rats. Table 5.9 Treatment schedules of repaglinide formulations for antidiabetic activity in SD rats. Groups I Drugs Normal Treatment schedule Normal saline 10 mL/kg p.o. single dose control II III Diabetic Normal saline 10 mL/kg p.o. single dose + control STZ (100 µg/g i.p.) Standard Conventional formulation of repaglinide 2 mg/kg p.o. single dose given to diabetic rats IV R1 (RN13) Optimized nanoemulsion of repaglinide 0.5 mg/kg p.o. single dose given to diabetic rats V R2 (RN13) Optimized nanoemulsion of repaglinide 1.0 mg/kg p.o. single dose given to diabetic rats VI R3 (RN13) Optimized nanoemulsion of repaglinide 2 mg/kg p.o. single dose given to diabetic rats Ph.D. Thesis 88 Chapter 5 Results and discussion Table 5.10 Effects of repaglinide nanoemulsion on glucose level in the control and experimental groups of rat. Time (h) 0 2 8 12 24 Normal control Diabetic control (NC) (DC) 85.64 ± 4.88 305.24 ± 21.09* 84.93 ± 3.99 305.84 ± 20.95 * 306.51 ± 39.18 * 313.19 ± 20.25 * 323.60 ± 23.93 * 86.13 ± 4.79 84.28 ± 3.47 83.41 ± 4.31 CF R1 R2 R3 304.40 ± 20.73* 301.73 ± 12.53* 302.32 ± 11.21* 309.63 ± 15.21* 184.98 ± 11.32## 229.84 ± 6.65# 192.11 ± 16.18## 189.00 ± 16.50## (39%) (24%) (36%) (39%) 110.69 ± 7.43## 186.50 ± 23.54# 99.92 ± 8.68## 99.27 ± 7.14## (63%) (38%) (67%) (68%) 109.99 ± 7.92## 219.12 ± 35.30# 100.18 ± 8.47## 100.36 ± 9.52## (64%) (27%) (67%) (68%) 187.97 ± 11.05## 283.51 ± 31.70 ns 177.90 ± 9.16## 181.93 ± 9.61## (38%) (6%) (41%) (41%) All values are expressed as Mean ± SEM of 6 rats in each group, *P<0.001 considered more significant, when compared with NC, #P<0.01 and ##P<0.001 considered significant, when compared with DC, P>0.05 considered non significant (ns), when compared with DC, % = Percentage reduction in blood glucose level, CF=Conventional formulation (2 mg/kg), R1, R2 and R3 = Nanoemulsion 0.5 mg/kg, 1 mg/kg and 2 mg/kg respectively. Ph.D. Thesis 89 Chapter 5 Results and discussion 5.6 Formulation development and optimization of metformin A. Screening of components i. Oils Modified or hydrolysed vegetable oils have been widely used since these excipients form good emulsification systems with large number of surfactants approved for oral administration and exhibit better drug solubility properties (Kimura et al, 1994, Constantinides, 1995, Hauss et al, 1998). They offer formulative and physiological advantages and their degradation products resemble the natural end products of intestinal digestion. ii. Surfactants An important criterion for selection of the surfactants is that the required HLB value to form o/w nanoemulsion is >10 (Kommuru et al, 2001). The surfactant chosen must be able to lower the interfacial tension to a very small value to aid dispersion process during the preparation of the nanoemulsion, provide a flexible film that can readily deform the correct curvature at the interfacial region for the desired nanoemulsion type. iii. Cosurfactants Transient negative interfacial tension is rarely achieved by the use of single surfactant, usually necessitating the addition of a cosurfactant. Fluid interfacial film is again achieved by the addition of a cosurfactant. B. Phase solubility studies Phase solubility studies were done to determine the most suitable oil for the preparation of nanoemulsion for metformin. Oil represents one of the most important excipients in the nanoemulsion formulation, which can solubilize marked amounts of the lipophilic drug and also because it can increase the amount of lipophilic drug transportation (Holm et al, 2002). Hydrogenated castor oil was found to solubilize maximum quantity of metformin i.e. 124.37 + 8.32 mg/mL for Ph.D. Thesis 90 Chapter 5 Results and discussion the preparation of nanoemulsion (Fig. 5.15). Therefore, it was selected as the oil phase for the development of nanoemulsion. Tween 80 selected as the surfactant and transcutol as cosurfactant. Surfactant lowers the interfacial tension to a very small value to aid dispersion process and provide a flexible film that can readily deform around the droplets. The presence of co-surfactants allows the interfacial film sufficient flexibility to take up different curvatures required to form nanoemulsion over a wide range of composition (Gosh, Murthy, 2006). Milli-Q water was taken as the aqueous phase. All the selected excipients for the preparation of formulations were under the GRAS (Generally Regarded as Safe) category. Table 5.11 Phase solubility determination of MTF (n=3) S. No. 1 2 3 4 5 6 7 8 9 10 11 12 Oil Oleic acid Isopropyl myristate Triacetin Caproyl 90 Hydrogenated castor oil Transcutol Labrafac Tween 80 Lauroglycol Tween 20 Hydrogenated castor oil : Tween 80 (2:1) Hydrogenated castor oil : Tween 80 (1:1) Ph.D. Thesis Average ± S.D. (mg mL-1) 3.67 ± 0.01 11.82 ± 0.04 15.45 ± 1.04 8.15 ± 0.64 124.37 ± 8.32 35.85 ± 1.30 10.04 ± 0.25 87.34 ± 9.36 15.68 ± 1.53 9.12 ± 8.14 85.34 ± 4.32 78.63 ± 3.43 91 Chapter 5 Results and discussion Fig. 5.15 Bar diagram showing the highest solubility of metformin in Hydrogenated castor oil. HCO-Hydrogenated castor oil, TRS-Transcutol CP90 -Caproyl 90, T80 -Tween 80. T20 -Tween 20, TCN - Triacetin, LBF- Labrafac, LRG - Lauroglycol, IPM -Isopropyl myristate, OA Oleic acid, HCO:T 80 (2:1) , HCO:Tween 80(1:1). Ph.D. Thesis 92 Chapter 5 Results and discussion Table 5.12 Observations for thermodynamic stability study and dispersibility test of metformin nanoemulsion formulations. Formulation Smix ratio % Smix % Oil % Water Observations based on Observations based on themodynamic stability test dispersibility test Cen HCa b t Fc Distilled H2O Inference 0.1 N HCl – – × – – – 70 × – – – – Failed 20 50 × – – B B Failed 30 10 60 √ √ √ C C Failed MN6 30 5 65 √ √ √ B B Failed MN7 35 15 50 √ √ × B B Failed MN8 35 10 55 √ √ × C C Failed 35 5 60 √ √ × C C Failed 40 10 50 √ x – B B Failed MN11 40 5 55 √ √ √ A A Passed MN12 45 5 50 √ √ √ A A Passed 30 5 65 √ √ – B B Failed 35 5 60 √ x – B B Failed MN1 20 5 MN2 25 10 65 25 5 30 MN5 MN3 MN4 MN9 MN10 MN13 MN14 Ph.D. Thesis 1:0 1:1 2:1 75 × 93 – – – Failed Failed Chapter 5 MN15 40 10 50 √ x – B B Failed MN16 40 5 55 √ √ √ A A Passed MN17 45 5 50 √ √ √ A A Passed MN18 40 5 55 √ x x C C Failed 40 10 50 √ √ √ A A Passed MN20 40 10 50 √ √ x B B Failed MN21 30 5 65 √ √ √ A A Passed MN22 30 10 60 √ √ × B B Failed 35 5 60 √ √ × B B Failed 40 5 55 √ √ x C C Failed MN25 40 10 50 √ √ x D D Failed MN26 45 5 50 √ √ x B B Failed MN27 30 20 50 × – – D D Failed 35 15 50 × – – E E Failed 40 10 50 √ √ x E E Failed 45 5 50 √ √ x D D Failed MN19 MN23 MN24 MN28 MN29 MN30 a Results and discussion 3:1 1:2 1:3 Heating–cooling cycle, bCentrifugation, cFreeze–thaw cycle. Ph.D. Thesis 94 Chapter 5 Results and discussion C. Phase diagram construction The pseudoternary phase diagrams were constructed using hydrogenated castor oil as oily phase, Smix ratio (Tween 80 as a surfactant and transcutol as a co-surfactant) and water. In the phase diagrams, only o/w nanoemulsion region is shown, other phases are not shown due to overcrowding of the diagrams. Pseudo ternary phase diagrams were constructed separately for each Smix ratio (Fig. 5.16A–F). In Fig. 5.16A, (Smix ratio 1:0) surfactant was used alone without co-surfactant and observed that a low amount of oil (20%, v/v) was solubilized at higher concentration of surfactant (30% v/v). Oil solubilization was decreased as the concentration of surfactant was increased. On addition of cosurfactant, solubilization of oil was increased at lower concentration of Smix (1:1) and the region for nanoemulsion in phase diagram was increased, as shown in Fig. 5.16B. With slight increase in the concentration of co-surfcatant (Smix ratio 2:1), no marked difference in nanoemulsion region in phase diagram, Fig. 5.16C was observed. In Smix ratio 3:1 and 1:2 (Fig. 5.16D & 5.16E), there was an increrement in the nanoemulsion region with increasing concentration of co-surfactant. But as the concentration of surfactant increasing in Smix 1:3, the region for nanoemulsion was decreasing due to decreasing oil solubilization (Fig. 5.16F). This indicates that the proper ratio of Smix is important for a wide range of nanoemulsion region in phase diagram. Different formulations having less than 25% of the oily phase and minimum quantity of S mix were selected from phase diagrams for further studies. This may be attributed to the fact that the addition of co-surfactant may lead to greater penetration of the oil phase in the hydrophobic region of the surfactant monomers thereby further decreasing the interfacial tension, which will lead to increase in the fluidity of the interface and thus increasing the entropy of the system (Gosh, Murthy, 2006). While studying the phase Ph.D. Thesis 95 Chapter 5 Results and discussion diagrams (Fig. 5.16A–5.16F), it can be seen that transient negative interfacial tension is rarely achieved by the use of single surfactant, usually necessitating the addition of a cosurfactant. Fluid interfacial film is again achieved by the addition of a co-surfactant. In the absence of cosurfactant, a highly rigid film is formed by the surfactant and thus produces nanoemulsion over only a very limited range of concentration (Lawrence, Rees, 2000). Water Water A Water C B Oil Smix Oil Smix Water Water Smix Oil Smix Water F E D Oil Oil Smix Smix Oil Fig. 5.16 Pseudo-ternary phase diagrams [Smix ratio = 1:0 (A), 1:1 (B), 2:1 (C),3:1 (D), 1:2 (E), 1:3 (F)]. The dotted area represents o/w nanoemulsion region. D. Thermodynamic stability studies Nanoemulsions are thermodynamically stable systems with no phase separation, creaming or cracking. Therefore, the selected formulations were subjected to thermodynamic studies (i.e. heating cooling cycle, centrifugation and freeze–thaw cycle). The observation for thermodynamic stability studies are given in Table 5.12 Formulations, which did not pass the thermodynamic tests, were dropped out and the Ph.D. Thesis 96 Chapter 5 remaining Results and discussion were subjected to dispersibility test. In case of macroemulsions, the interfacial energy is much larger than the entropy and hence the process of emulsification is non-spontaneous i.e. energy is needed to produce the emulsion by the use of high-speed mixture, whereas in case of nanoemulsion the interfacial tension is made sufficiently low so that interfacial energy become comparable or even lower than the entropy of dispersion, and hence the free energy of the system becomes zero or negative. This explains the thermodynamic stability of nanoemulsion (Razdan, Deverajan, 2003). E. Dispersibility tests The use of gastro-intestinal fluids for dilution of nanoemulsion may result in the gradual desorption of surfactant located at the globule interface leading to precipitation of the drug or phase separation of the nanoemulsion making the formulation useless. The dispersibility test was carried out to assess the efficiency of nanoemulsion and the results are demonstrated. Formulations, which failed (grade B, C, D and E) dispersibility test, were discarded for further studies. (Table 5.12) F. Formulation of drug containing nanoemulsion Six formulations (MN11, MN12, MN16, MN17, MN19, and MN21) were selected and were subjected to further studies after addition of MTF (125 mg added to each selected formulation). The composition of selected formulations is given in Table 5.12. G. Characterization of metformin nanoemulsion i. Visual observation The nanoemulsion was clear transparent, easily flowable liquid whereas the macroemulsion was opaque and milky/cloudy white in appearance. ii. Surface morphology Morphology and structure of the nanoemulsion droplets were determined by Transmission electron microscopy (TEM). The surrounding was Ph.D. Thesis 97 Chapter 5 Results and discussion bright and the nanoemulsion appeared dark (Fig. 5.17A). A “positive” image was seen using TEM. It is capable of point-to-point resolution; therefore, droplet sizes were measured using TEM. iii. Droplet size analysis Droplet size measurement is the important parameter to optimize the nanoemulsion formulation as well as to distinguish between the nanoemulsion from microemulsion. Polydispersity is the ratio of standard deviation to the mean droplet size and denotes the uniformity of droplet size within the formulation. The lower the polydispersity value, higher is the uniformity of the droplet size in the formulation. The MN21 formulation presented minimum droplet size (92.25 ± 3.54) nm whereas MN19 showed increase in the droplet size due to increased concentration of oil (Table 5.12). In formulation MN21, the distribution of droplets was in the range of 92–98 nm and the maximum droplets (80%) were below a size of 96 nm (Fig. 5.17B). The formulation showed nano droplets with low values of polydispersity indicating uniformity in the nanoemulsion formulation. The polydispersity values were 0.198, 0.185, 0.187, 0.196, 0.204 and 0.172 for different formulations MN11, MN12, MN16, MN17, MN19 and MN21, respectively (Table 5.12). iv. Viscosity determination The viscosites of the nanoemulsions (MN11, MN12 MN16, MN17, MN19 and MN21) are given in Table 5.13. The viscosity of nanoemulsion formulation was very low as expected as one of the characteristic. It was observed from the Table 5.13 that viscosity of all the formulations was less than 24 cps. Formumlation MN21 has the minimum viscosity i.e. 22.124 ± 0.327 cps. Results also revealed that the viscosity is directly proportional to the concentration of oils and surfactants used in the formulation. It can be observed that, in general, viscosity of all formulations was very low. Ph.D. Thesis 98 Chapter 5 Results and discussion v. Refractive index Refractive index (RI) being an optical property is used to characterize the isotropic nature of the nanoemulsion. It was observed from the Table 5.13 that the selected nanoemulsion formulations were chemically stable and remained isotropic in nature, thus having no drug excipient interactions. The observation table shows that as the concentration of the oils increases in the formulation, the RI increases (MN19) (Table 5.13). vi. Electrical conductivity Electrical conductivity (σ) was determined to check not only the type of nanoemulsion (o/w or w/o) but also the stability of the nanoemulsion (phase inversion on storage). The conductivity of the formulations is given in the Table 5.13. The lowest σ was found 445.278 ± 1.142 μS/cm for MN11 and highest conductivity was 532.118 ± 2.451 μS/cm for MN21. This indicated that the formulation was o/w type. Because the current was passed through the water and the diffraction was seen. Electrical conductivity is directly proportional to the percentage of water. Higher the electrical conductivity more will be the percentage of water, which allows more freedom for mobility of ions. Ph.D. Thesis 99 Chapter 5 Results and discussion Fig. 5.17 Transmission electron microscopic positive image and size distribution by intensity of optimized nanoemulsion of optimized metformin nanoemulsion formulation MN21). Ph.D. Thesis 100 Chapter 5 Results and discussion Table 5.13 In vitro characterization of the selected metformin nanoemulsion formulations. a Formulation Droplet Size Polydispersity Viscosity ± S.D. Refractive Index Conductivity Code ± S.D. (nm)a Indexa (cps)a ± S.Da (μS/cm) ± S.Da MN11 96.21 ± 3.42 0.198 ± 0.018 23.192 ± 0.332 1.6926 ± 0.007 445.278 ± 1.142 MN12 95.14 ± 7.38 0.185 ± 0.014 23.459 ± 0.269 1.6698 ± 0.009 502.412 ± 2.198 MN16 93.45 ± 4.52 0.187 ± 0.017 22.956 ± 0.389 1.6529 ± 0.006 487.478 ± 4.453 MN17 98.19 ± 7.46 0.196 ± 0.013 23.423 ± 0.423 1.6851 ± 0.005 468.196 ± 4.429 MN19 94.59 ± 5.26 0.204 ± 0.014 23.054 ± 0.425 1.8252 ± 0.007 458.413 ± 1.123 MN21 92.25 ± 3.54 0.172 ± 0.013 22.124 ± 0.327 1.6421 ± 0.006 532.118 ± 2.451 Mean ± S.D., n = 3 Ph.D. Thesis 101 Chapter 5 Results and discussion 5.7 In vitro drug release study of metformin The composition of selected formulations used for in vitro release is given in Table 5.12 Dissolution studies were performed to compare the release of drug from six different formulations (MN11, MN12, MN16, MN17, MN19, MN21) and marketed formulation i.e. metformin tablet (GLUMET ®). The concentration was determined by extrapolation of calibration curve and graph was plotted between time and percent cumulative release (Fig. 5.18). The pattern of drug release in distilled water and simulated gastric fluid was found very similar to each other in all formulations. The highest release i.e. 98.70% was obtained in case of MN21. The minimum release was observed in MN19 formulation (76.41%), this may be due to bigger globule size, which may slow down the release of the drug from nanoemulsion formulation. All the nanoemulsion formulations showed better results as compared to conventional marketed formulation, (i.e. tablet) because of small globule size, low viscosity and low polydispersity values. Release of drug from MN19 (10% v/v, oil) was lower than that from MN11, MN12, MN16, MN17 and MN21 (5% v/v, oil) because of higher oil concentration and bigger droplet size. In addition to this, the higher oil concentration may restrain the release of drug into the medium due to lipophilic character of metformin as the partitioning of drug will be more towards the oil. The complete dissolution of metformin in oily phase showed maximum release because of small droplet size, and eventually higher surface area, which permits faster rate of drug release. The MN21 formulation (for each dose i.e. M1, M2 & M3) was selected for in- vivo studies because it offered highest drug release (98.70% %), optimum globule size (92.25 nm), minimum polydispersity value (0.172), lower viscosity (22.124 cps) and 30% v/v of S mix (tween 80 as surfactant, transcutol as the co-surfactant). Ph.D. Thesis 102 Chapter 5 Results and discussion Fig. 5.18 In vitro release profile of different metformin nanoemulsions. 5.8 Biochemical evaluation of metformin The rats were divided into six groups, each containing six animals. A treatment schedule is given in Table 5.14. The time course profile of blood glucose response in rats is shown in Table 5.15. The blood glucose level in diabetic rats significantly (p<0.001) reduced in orally administered drug (500 mg) upon 8 hrs and was reported as 96.62 ± 6.62 mg/dl from 392.82 ± 12.51 mg/dl, it was 293.68 ± 17.46 mg/dl (p<0.01), 95.34 ± 10.56 mg/dl (p<0.001) and 96.95 ± 9.84 mg/dl (p<0.001) from 392.93 ± 11.78 mg/dl, 392.96 ± 15.71 mg/dl and 394.83 ± 9.23 mg/dl for 8 hrs in case of orally administered nano-emulsion containing 35, 70 and 140 mg of metformin.The findings showed nano emulsion (having 70 mg/kg metformin) significantly decreased blood glucose level which was almost similar to oral conventional formulation of 500 mg metformin in diabetic rats. Ph.D. Thesis 103 Chapter 5 Results and discussion Table 5.14 Treatment schedules of metformin nanoformulations for antidiabetic activity in SD rats. Groups Drugs I Normal control II IV V VI Normal saline 10 mL/kg p.o. single dose Diabetic Normal saline 10 mL/kg p.o. single dose + STZ control III Treatment schedule Standard (100 µg/g i.p.) Conventional formulation of metformin 500 mg/kg p.o. single dose given to diabetic rats M1 Optimized nanoemulsion of metformin 35 mg/kg (MN21) p.o. single dose given to diabetic rats M2 Optimized nanoemulsion of metformin 70 mg/kg (MN21) p.o. single dose given to diabetic rats M3 Optimized nanoemulsion of metformin 140 mg/kg (MN21) p.o. single dose given to diabetic rats Ph.D. Thesis 104 Chapter 5 Results and discussion Table 5.15 Effects of metformin nanoemulsion on glucose level in the control and experimental groups of rat. Time (h) 0 2 8 12 24 NC DC CF M1 (MN 21) M2 (MN 21) M3 (MN 21) 81.45 ± 2.98 305.24 ± 21.09* 392.82 ± 12.51* 392.93 ± 11.78* 392.96 ± 15.71* 394.83 ± 9.23* 81.17 ± 2.63 305.84 ± 20.95 * 189.65 ± 10.2## 282.1 ± 5.63# 152.41 ± 9.86## 144.47 ± 10.11## (52%) (28%) (61%) (63%) 306.51 ± 39.18 * 96.62 ± 6.62## 293.68 ± 17.46# 95.34 ± 10.56## 96.95 ± 9.84## (75%) (25%) (76%) (75%) 313.19 ± 20.25 * 131.79 ± 8.37## 311.68 ± 15.33# 132.87 ± 7.47## 130.77 ± 8.23## (66%) (21%) (66%) (67%) 323.60 ± 23.93 * 191.24 ± 16.29## 351.83 ± 27.79ns 177.90 ± 9.16## 194.35 ± 14.36## (51%) (10%) (55%) (51%) 84.22 ± 3.23 80.85 ± 2.75 78.17 ± 2.46 Mean ± SEM., n = 6 * P<0.001 considered more significant, when compared with Normal control (NC), # P<0.01 and ##P<0.001 considered significant, when compared with Diabetic control (DC), P>0.05 considered non significant (ns), when compared with DC, % = Percentage reduction in blood glucose level, CF=Conventional formulation (500 mg/kg), M1, M2 and M3 = Nanoemulsion 35 mg/kg, 70 mg/kg and 140 mg/kg respectively. Ph.D. Thesis 105 Chapter 5 Results and discussion 5.9 Stability studies During stability studies, droplet size, viscosity, drug content, refractive index and electrical conductivity were determined at 0, 30, 60, and 90 days. As can be seen from Table 5.16 & 5.17, the values of these parameters were slightly varied with respect to time but the changes in the values of observed parameters were not found to be statistically significant (P > 0.05). Stability studies at 8 ± 2 0C, 25 0C /60 % RH and 40 0C /75 % RH predicted highest degradation of 0.99% of repaglinide and 0.98% of metformin in the optimized formulations (RN13 & MN21) at 40 0C by the end of 90 days. . Ph.D. Thesis 106 Chapter 5 Results and discussion Table 5.16 Percent drug remaining, droplet size, viscosity, refractive index and conductivity in optimized repaglinide nanoemulsion formulation (RN13), stored at elevated temperatures for 3 months. Time (Days) Temperature /RH %Drug remained 0 30 60 90 0 30 60 90 0 30 60 90 8 ± 20C 8 ± 20C 8 ± 20C 8 ± 20C 250C/60 % RH 250C/60 % RH 250C/60 % RH 250C/60 % RH 400C/75 % RH 400C/75 % RH 400C/75 % RH 400C/75 % RH 100 99.89 99.53 98.98 100 99.87 99.84 99.86 100 99.97 99.94 98.59 Ph.D. Thesis Mean droplet ± SD (nm) 92.25 ± 3.54 92.13 ± 4.58 92.18 ± 3.26 92.20 ± 4.62 92.25 ± 3.54 92.19 ± 7.34 92.16 ± 2.68 92.28 ± 5.36 92.25 ± 3.54 91.86 ± 6.34 92.17 ± 4.30 92.19 ± 3.56 Mean viscosity ± SD (cP) Refractive index Conductivity (μS/cm) ± S.Da 22.124 ± 0.327 21.356 ± 0.243 21.024 ± 0.249 22.448 ± 0.143 22.124 ± 0.327 22.256 ± 0.418 22.246 ± 0.247 22.578 ± 0.356 22.124 ± 0.327 22.359 ± 0.260 22.356 ± 0.298 22.379 ± 0.431 1.6421 ± 0.006 1.639 ± 0.004 1.667 ± 0.002 1.6398 ± 0.002 1.6421 ± 0.006 1.6580 ± 0.002 1.6528 ± 0.004 1.6389 ± 0.006 1.6421 ± 0.006 1.6578 ± 0.002 1.6543 ± 0.007 1.6389 ± 0.004 532.118 ± 2.451 524.234 ± 3.234 516.128 ± 3.284 522.473 ± 5.263 532.118 ± 2.451 512.241 ± 4.756 506.782 ± 5.248 512.326 ± 3.536 532.118 ± 2.451 509.238 ± 3.86 513.536 ± 5.278 501.486 ± 3.896 107 Chapter 5 Results and discussion Table 5.17 Percent drug remaining, droplet size, viscosity and refractive index in optimized metformin nanoformulation (MN21), stored at elevated temperatures for 3 months. Time (Days) Temperature /RH %Drug remained 0 30 60 90 0 30 60 90 0 30 60 90 8 ± 20C 8 ± 20C 8 ± 20C 8 ± 20C 250C/60 % RH 250C/60 % RH 250C/60 % RH 250C/60 % RH 400C/75 % RH 400C/75 % RH 400C/75 % RH 400C/75 % RH 100 99.89 99.53 98.98 100 99.69 99.54 99.24 100 99.95 99.91 98.64 Ph.D. Thesis Mean droplet ± SD (nm) 76.23 ± 4.14 76.12 ± 3.19 76.09 ± 6.23 76.12 ± 4.42 76.23 ± 4.14 76.15 ± 2.53 75.42 ± 7.24 75.49 ± 4.18 76.23 ± 4.14 75.89 ± 2.51 76.02 ± 8.36 76.04 ± 4.28 Mean viscosity ± SD (cP) Refractive index Conductivity (μS/cm) ± S.Da 21.447 ± 0.215 21.356 ± 0.243 21.024 ± 0.249 22.448 ± 0.143 21.447 ± 0.215 21.752 ± 0.168 23.412 ± 0.273 22.129 ± 0.214 21.447 ± 0.215 20.423 ± 0.249 21.021 ± 0.186 21.267 ± 0.243 1.6605 ± 0.004 1.6643 ± 0.003 1.6594 ± 0.006 1.6526 ± 0.008 1.6605 ± 0.004 1.6589 ± 0.005 1.6526 ± 0.009 1.6725 ± 0.003 1.6605 ± 0.004 1.6452 ± 0.003 1.6463 ± 0.008 1.6526 ± 0.006 512.413 ± 3.157 505.256 ± 3.692 502.692 ± 3.683 523.294 ± 4.263 512.413 ± 3.157 509.267 ± 2.726 498.446 ± 4.182 501.786 ± 2.148 512.413 ± 3.157 523.243 ± 3.023 516.436 ± 2.173 525.526 ± 4.186 108


© Copyright 2026