
2014 Annual Report - Myers Industries, Inc.
Reuseable Containers | Material Handling
2014 Annual Report | Realigned and Refocused
Dear Fellow Shareholders,
Our Company took several important strategic steps this year that
I believe have transformed Myers into a more focused Company,
better positioned to deliver long-term value to our customers,
shareholders and employees. I have a high degree of confidence in
our Company’s future and we will focus a great deal of our strategic
and operational efforts in 2015 on ensuring the long-term success
of this transformation.
2014 was a somewhat challenging year for our businesses due
to a number of factors. Poor weather conditions early in the year
negatively impacted orders, and those weather conditions became
further exacerbated by transportation and logistical issues that
plagued much of the industrial end-markets in North America during
that same timeframe. The Brazilian economic climate also weighed
on our results, and our Material Handling segment was further
challenged by weakened commodity prices within our agricultural
end markets.
Despite these temporary headwinds on our operating performance,
we were able to deliver significant value to our shareholders in 2014
through dividends, share repurchases and strategic M&A activity.
In 2014 we returned a total of $70.6 million to shareholders through
a combination of the following:
• Increased our quarterly dividend by 44% to $0.52 per share.
• Repurchased 2.7 million shares of our common stock for
approximately $55 million.
• Sold WEK Industries, Inc., formerly a division of our Engineered
Products segment, for $20 million.
• Acquired Scepter Corporation and Scepter Manufacturing
for $157 million.
• More recently, we completed the sale of our Lawn & Garden
business in February of 2015 for $110 million, the proceeds
of which were used entirely to pay down debt.
The result of these strategic actions was a realignment of our
reportable operating segments and a reduction from four to two
distinct lines of business
– Material Handling and
Scepter Corporation
Distribution. This has created
a more focused Myers with a
core product platform that we
believe has excellent potential
to accelerate growth.
In 2015 and beyond we plan
to capitalize on our leading
position in our core markets
by leveraging the strength
of our brands to expand
into new markets with both
existing and new product
introductions. Growth of our
product portfolio in Material
Handling will be a key
Scepter is North America’s number
one supplier of portable fuel containers.
component of this strategy.
Serving consumer and military
We’ll also be increasing
markets, Scepter is known for their
our marketing efforts
high-quality, expertly engineered, EPA
surrounding our customerapproved containers.
based approach to product
development. We believe
these efforts will be instrumental in driving customer conversion
rates on our new products. Furthermore, we will leverage our
recent Scepter acquisition to benefit both Material Handling and
Distribution by actively implementing cross-selling initiatives in the
marine, industrial and automotive end markets. This should allow
each segment to access channels and customers that they were
not previously able to penetrate on a stand-alone basis.
In addition to our investments in growth opportunities, we will also
continue to strengthen our business through a number of ongoing
operations excellence
initiatives including further
About Scepter
cost reduction measures.
We remain committed to
Scepter, which was acquired by Myers
developing our culture of
Industries in July of 2014, is an innovative
efficiency and sustainability.
global plastic products manufacturer of
In 2015 our increased
marine fuel containers, portable fuel and
sustainability efforts will be
water containers, military ammunition
geared toward reductions
containers, and industrial shipping and
in our water consumption,
storage containers.
carbon footprint and land
Capabilities:
waste, and increasing our
• In-house product design engineers
use of recycled materials.
In 2015 we will maintain
our balanced approach
to capital allocation which
will continue to drive value
for shareholders. We
expect to generate free
cash flow in excess of net
income, pay down debt,
opportunistically buy back
stock and continue payment
of our quarterly dividend.
Capital expenditures will be
approximately $27.5 million,
the majority of which will
be focused on growth and
productivity projects.
and toolmakers develop unique
products to meet the need of the
larger market or the specific need
of one customer
• In-house mold design and
manufacturing results in shorter
lead time to market and better
quality control
• State-of-the-art blow- and
injection-molding machines
equipped with robotic technology
result in fast, safer, and more
cost effective manufacturing
Markets:
• Marine
• Consumer
• Military
• Industrial
In summary, Myers is
Impact:
streamlined, re-focused,
• Complements and grows Material
in an excellent financial
Handling Segment with adjacent
position, and stronger than
products and technologies
ever from an operational
•
Expands end markets and
standpoint. The Company is
geographic reach
now positioned to be a faster
• Provides opportunities for crossgrowing, more profitable
selling with existing businesses
and most importantly,
• With annual sales of approximately
more valuable company
$100 million, Scepter increases
to all of our stakeholders.
Material Handling revenue by 30%
We look forward to
continued collaborations
with our customers to
develop valuable solutions for their businesses. We express our
appreciation to our hard-working, valuable employees that enable
the success of our Company on a daily basis. Lastly, we’d like to
thank all of our shareholders for your continued support.
Sincerely,
John C. Orr
President & Chief Executive Officer
MATERIAL HANDLING
Liquid Goods Storage
The Caliber® intermediate bulk container is made of FDA-approved materials, designed to store and transport
liquid food products such as juice, honey, oil, or tomato sauces.
Myers Industries Material Handling Segment is our largest and fastest
growing business segment. The portfolio of companies that comprise
the Material Handling Segment include the industry’s most recognized
brands for reusable and recyclable plastic containers, pallets,
crates, storage bins, carts, cabinets, fuel containers, and specialty
molded products. Used across multiple markets including industrial,
agriculture, food processing, healthcare and consumer, Myers’
Material Handling is a solutions provider in all markets served.
All Myers companies within the Material Handling Segment are
committed to providing customers high-quality, durable containers that
protect contents during transport and organize goods, while providing
an increase in production efficiency, a decrease in freight and inventory
costs and optimized storage space. The segment supports the overall
strategic goals of Myers Industries through new product innovation,
continuous operation improvements, targeted market focus, and
expansion into new geographies and markets.
Known throughout the polymer manufacturing industry as an expert
molding company, Myers Industries broad manufacturing portfolio
gives us the distinction of being one of the only plastics manufacturers
offering customers several different molding technologies: rotational-,
injection-, blow-, structural foam-molding, and thermoforming. In
addition, Myers’ Material Handling also offers metal forming, wood
fabrication and powder coating. This diversity in molding and
secondary manufacturing capabilities allows our engineers to work
closely with the customer to design the product that is the precise
solution to meet its needs.
Moving forward, the streamlined approach to the Myers business will
afford the Material Handling Segment the opportunity to laser focus on
markets with the highest sustainable sales and profit, invest in growth
platforms with the highest value creation and further expand capabilities
to grow our position in the RV and Marine markets.
*Front cover photos, clockwise from left to right: Intrepid™ Intermediate Bulk Container,
Indicator Storage Bins, Marine Portable Fuel Container, Plastic Beverage Crates.
DISTRIBUTION
Automotive Inventory Management Systems
The MTS Xpress automotive vending machine systems are designed to provide real-time inventory management,
reduce consumption, improve productivity and eliminate the cost of expediting tools and supplies.
Myers Industries Distribution Segment is the largest single source for
tire, wheel and undervehicle service tools, equipment and supplies
in the United States. Offering more than 12,000 different products,
Myers Distribution supplies everything the professional needs to service
passenger car, truck and off-road tires, wheels and related components.
Known for broad product selection, rapid availability and personal service,
Myers helps its customers which include independent tire dealers, auto
dealerships, general repair facilities and commercial auto and truck fleets
be more productive and profitably grow their businesses.
The Myers Distribution Segment maintains a thorough understanding
of the marketplace and is a solution focused organization committed
to providing customers with new innovative products and services in a
timely manner. In today’s digital world this means offering customers
a new state-of-the-art ecommerce order site, top-of-the-line Tire
Pressure Monitoring Systems, web-based “Torque Tracker” programs
for commercial fleets, and the new MTS Xpress inventory management
program. Also known as a vending program, the MTS Xpress offers
online vendor managed inventory and is designed to help customers
manage the cost of their consumable inventory and secure highly valuable tools
with low initial investment.
In addition to the products and services Myers offers as a wholesale distributor, the
Distribution Segment also manufactures and supplies the most comprehensive line
of tire repair and retreading products in the United States which include tire plugs
and cements, tire patches, and sealing compound for all types of tire repair from
small to large.
As Myers moves into the next phase of a streamlined approach to business, the
Distribution Segment will continue to focus on expanding their brand position in key
domestic markets and emerging international markets, and delivering a continuous
flow of new products and services with “first-to-market” speed. The segment will
also continue to maintain efficiency and high customer satisfaction ratings through
implementation of innovative supply chain management technology.
*Back cover photos, from left to right: Tire Pressure Monitoring System (TPMS) and Off-the-Road
Tire Repair.
Financial Section
Myers Industries, Inc. | 2014 Annual Report
SECURITIES AND EXCHANGE COMMISSION
WASHINGTON, D.C. 20549
FORM 10-K
È
ANNUAL REPORT PURSUANT TO SECTION 13 OR 15(d)
OF THE SECURITIES EXCHANGE ACT OF 1934
FOR THE FISCAL YEAR ENDED December 31, 2014
COMMISSION FILE NUMBER 001-08524
MYERS INDUSTRIES, INC.
(Exact name of registrant as specified in its charter)
OHIO
34-0778636
(State or other jurisdiction of
incorporation or organization)
(IRS Employer Identification Number)
1293 S. MAIN STREET, AKRON, OHIO
44301
(330) 253-5592
(Address of Principal Executive Offices)
(Zip Code)
(Telephone Number)
Securities Registered Pursuant to
Section 12(b) of the Act:
Name of Each Exchange
On which registered:
Common Stock, Without Par Value
New York Stock Exchange
(Title of Class)
Securities Registered Pursuant to Section 12(g) of the Act: None
Indicate by check mark if the registrant is a well-known seasoned issuer, as defined in Rule 405 of the Securities
Act. Yes ‘ No È
Indicate by check mark if the registrant is not required to file reports pursuant to Section 13 or Section 15(d) of
the Act. Yes ‘ No È
Indicate by check mark whether the registrant (1) has filed all reports required to be filed by Section 13 or 15(d)
of the Securities Exchange Act of 1934 during the preceding 12 months (or for such shorter period that the registrant
was required to file such reports), and (2) has been subject to the filing requirements for the past 90
days. Yes È No ‘
Indicate by check mark whether the registrant has submitted electronically and posted on its corporate Web site,
if any, every Interactive Data File required to be submitted and posted pursuant to Rule 405 of Regulation S-T
(232.405 of this chapter) during the preceding 12 months (or for such shorter period that the registrant was required
to submit and post such files). Yes È No ‘
Indicate by check mark if disclosure of delinquent filers pursuant to Item 405 of Regulation S-K (229.405 of this
chapter) is not contained herein, and will not be contained, to the best of registrant’s knowledge, in definitive proxy or
information statements incorporated by reference in Part III of this Form 10-K or any amendment to this Form 10-K. È
Indicate by check mark whether the Registrant is a large accelerated filer, an accelerated filer, a non-accelerated
filer or a smaller reporting company. See the definitions of “large accelerated filer,” “accelerated filer,” and “smaller
reporting company” in Rule 12b-2 of the Exchange Act. (Check one):
Large accelerated filer ‘ Accelerated filer È
Non-accelerated filer ‘ Smaller reporting company ‘
Indicate by check mark whether the Registrant is a shell company (as defined in Rule 12b-2 of the
Act). Yes ‘ No È
State the aggregate market value of the voting and non-voting common equity held by non-affiliates computed by
reference to the closing sale price on the New York Stock Exchange as of June 30, 2014: $598,535,243
Indicate the number of shares outstanding of registrant’s common stock as of March 26, 2015: 30,945,498
Shares of Common Stock, without par value.
DOCUMENTS INCORPORATED BY REFERENCE:
Portions of the Registrant’s Definitive Proxy Statement for its 2015 Annual Meeting of Stockholders are
incorporated by reference in Part III of this Form 10-K.
TABLE OF CONTENTS
PART I
ITEM 1. Business
ITEM 1A. Risk Factors
ITEM 1B. Unresolved Staff Comments
ITEM 2. Properties
ITEM 3. Legal Proceedings
1
12
18
19
20
PART II
ITEM 5. Market for Registrant’s Common Stock and Related Stockholder Matters and
Issuer Purchases of Equity Securities
ITEM 6. Selected Financial Data
ITEM 7. Management’s Discussion and Analysis of Results of Operations and Financial
Condition
ITEM 7A. Quantitative and Qualitative Disclosures About Market Risk
ITEM 8. Financial Statements and Supplementary Data
Report of Independent Registered Public Accounting Firm
Consolidated Statements of Operations
Consolidated Statements of Comprehensive Income (Loss)
Consolidated Statements of Financial Position
Consolidated Statements of Shareholders’ Equity
Consolidated Statements of Cash Flows
Notes to Consolidated Financial Statements
ITEM 9. Changes in and Disagreements with Accountants on Accounting and Financial
Disclosure
ITEM 9A. Controls and Procedures
ITEM 9B. Other Information
27
34
38
38
39
40
41
43
44
45
ITEM 10. Directors and Executive Officers of the Registrant
ITEM 11. Executive Compensation
ITEM 12. Security Ownership of Certain Beneficial Owners and Management
ITEM 13. Certain Relationships and Related Transactions
ITEM 14. Principal Accounting Fees and Services
78
78
78
79
79
ITEM 15. Exhibits, Financial Statement Schedules
79
23
25
73
73
78
Part III
PART IV
SIGNATURES
83
PART I
ITEM 1. Business
(a) General Development of Business
Myers Industries, Inc. (the “Company”) was founded in Akron, Ohio, in 1933. The terms “Myers
Industries,” “Company” “we,” “us,” or “our” wherever used herein refer to the Company, unless the
context indicates to the contrary. Since then, the Company has grown from a small storefront
distributing tire service supplies into an international manufacturing and distribution enterprise. In
1971, the Company went public, and the stock is traded on the New York Stock Exchange under the
ticker symbol MYE.
Headquartered in Akron, Ohio, the Company manufactures a diverse range of polymer products
for industrial, agricultural, automotive, commercial and consumer markets. Myers Industries is a
leader in the manufacturing of plastic reusable material handling containers and pallets, and plastic
fuel tanks. Other principal product lines include plastic storage and organization containers, rubber
tire repair products and custom plastic and rubber products.
The Company is also the largest wholesale distributor of tools, equipment and supplies for the
tire, wheel and undervehicle service industry in the United States. The distribution products range
from tire balancers and alignment systems to valve caps, tire repair tools and other consumable
service supplies.
As of December 31, 2014, the Company operated 22 manufacturing facilities, 19 sales offices,
four distribution centers and three distribution branches located throughout North, Central and South
America; had approximately 15,500 manufactured products and over 12,500 distributed products;
and had 3,241 employees.
Serving customers around the world, products and related services from Myers Industries’
brands provide a wide range of performance benefits to customers in diverse niche markets. Some of
these benefits include increasing productivity, driving green initiatives, lowering material handling
costs, improving product quality, reducing labor costs, shortening assembly times, eliminating solid
waste and increasing profitability.
The Company’s business strategy is focused on sustainable, profitable growth guided by five key
operating principles: 1) Customer Dedication, 2) Innovation, 3) Operations Excellence, 4)
Organization Development, and 5) Financial Strength. Applying these principles to our business, the
Company emphasizes:
•
Industry-leading innovation of niche, high margin products;
•
Being the low-cost provider of certain commodity products where our brands excel;
•
Achieving leadership in key product areas through breadth of offering, consistent quality and
superior customer service;
•
Operations excellence initiatives to reduce costs and improve productivity within our
manufacturing and distribution footprint;
•
Leveraging brand equity and capabilities to grow business with existing customers and
cultivate new ones, particularly in emerging growth markets where we can deliver the
greatest value and achieve the best returns;
•
Investing in new technologies and processes to reinforce customer dedication and market
strength across our key business segments;
1
•
Succession plans through our management teams at all levels in the Company, ensuring the
right people are in the right positions to grow for organization development; and
•
Selective acquisitions as opportunities arise to enhance our leadership in key markets and
add to shareholder value.
The Company continually reviews its segments and brands for strategic fit and growth potential.
The review process is dedicated to furthering innovation and brand leadership in our markets,
building strong customer relationships and positioning the Company for strong financial performance.
(b) Financial Information About Segments
The response to this section of Item 1 is contained in the Industry Segments footnote of the Notes
to Consolidated Financial Statements under Item 8 of this report.
(c) Description of Business
During the second quarter of 2014, the Company realigned its reportable segments as a result of
organizational changes to better align its resources to support its ongoing business strategy. As a
result of the segment realignment, the Company conducts its business activities in two distinct
business segments: Material Handling and Distribution. The realignment is consistent with the manner
in which our Chief Operating Decision Maker evaluates performance and makes resource allocation
decisions.
Also during the second quarter of 2014, the Company’s Board of Directors approved the
commencement of the sale process to divest its Lawn and Garden business to allow it to focus
resources on its core growth platforms. The divestiture of the Lawn and Garden business was
completed in February 2015. The Lawn and Garden business served the North American horticulture
market with plastic products such as seedling trays, nursery products, hanging baskets, custom print
containers as well as decorative resin planters. The operating results for the Lawn and Garden
business are classified as discontinued operations in the Consolidated Statements of Operations
under Item 8 of this report.
In our Material Handling Segment, we design, manufacture, and market a variety of plastic
products. These range from plastic reusable material handling containers and small parts storage
bins to plastic RV tanks and parts, marine tanks and parts, portable plastic fuel tanks and water
containers, portable marine fuel containers, ammunition containers, storage totes, shipping containers
and beverage crates.
The Distribution Segment is engaged in the distribution of tools, equipment and supplies used for
tire, wheel and undervehicle service on passenger, heavy truck and off-road vehicles and the
manufacturing of tire repair materials and custom rubber products.
Information regarding the revenues of each segment classified as continuing operations is
contained in the Industry Segments footnote of the Notes to the Consolidated Financial Statements
under Item 8 of this report.
2
The following table summarizes the key attributes of our business segments for the year ended December 31, 2014:
Material Handling Segment
Net Sales
$432
69%
Key Product Areas
•
•
•
•
•
•
Product Brands
Plastic Reusable Containers &
Pallets
Plastic Storage &
Organizational Products
Plastic Carts
Metal Carts
Wooden Dollies
Custom Products
•
•
•
•
•
•
•
Akro-Mils™
Jamco Products
Buckhorn®
Novel do Nordeste S.A.
Myers do Brasil™
Ameri-Kart®
Scepter
Key Capabilities & Services
•
•
•
•
•
•
•
•
•
•
•
•
•
•
•
Product Design
Prototyping
Product Testing
Material Formulation
Injection Molding
Structural Foam Molding
Metal Forming
Stainless Steel Forming
Wood Fabrication
Powder Coating
Material Regrind & Recycling
Plastic Blow Molding
Plastic Rotational Molding
Thermoforming
Infrared Welding
Representative Markets
•
•
•
•
•
•
•
•
•
•
•
•
•
•
•
•
Agriculture
Automotive
Commercial
Food Processing
Food Distribution
Healthcare
Industrial
Manufacturing
Retail Distribution
Wholesale Distribution
Consumer
Recreational Vehicle
Marine
Military
Food & Beverage
Custom
Distribution Segment
Net Sales
$192
31%
Key Product Areas
•
•
•
•
•
•
•
•
•
•
Product Brands
Tire Valves & Accessories
Tire Changing &
Balancing Equipment
Lifts & Alignment Equipment
Service Equipment
Hand Tools
Tire Repair & Retread
Equipment & Supplies
Brake, Transmission & Allied
Service Equipment & Supplies
Highway Markings
Industrial Rubber
General Shop Supplies
•
•
•
•
•
•
•
Myers Tire Supply®
Myers Tire Supply
International™
Patch Rubber Company®
Elrick
Fleetline
MTS
Key Capabilities & Services
•
•
•
•
•
•
•
•
•
•
•
•
•
Broad Sales Coverage
Local Sales
Four Strategically Placed
Distribution Centers
International Distribution
Personalized Service
National Accounts
Product Training
Repair/Service Training
New Products/Services
“Speed to Market”
Rubber Mixing
Rubber Compounding
Rubber Calendaring
Tiered Product Offerings
Representative Markets
•
•
•
•
•
•
•
•
•
•
•
•
Retail Tire Dealers
Truck Tire Dealers
Auto Dealers
Commercial Auto & Truck
Fleets
General Repair & Services
Facilities
Tire Retreaders
Tire Repair
Governmental Agencies
Telecommunications
Industrial
Road Construction
Mining
Lawn and Garden (Discontinued Operations)
Net Sales
$188
Key Product Areas
•
•
•
Plastic Horticultural Pots,
Trays, Flats & Hanging Baskets
Decorative Resin Planters
Custom Products
Product Brands
•
•
•
•
•
•
Dillen®
ITML™
Listo™
Pro Cal™
Planters’ Pride®
Akro-Mils Lawn & Garden
3
Key Capabilities & Services
•
•
•
•
•
•
•
•
•
Product Design
•
Prototyping
Testing
Material Formulation
Injection Molding
Thermoforming
•
Co-Extrusion Thermoforming
Custom Printing & Labeling
Material Regrind & Recycling
Representative Markets
Horticulture:
-Growers
-Nurseries
-Greenhouses
-Retail Garden Centers
Consumer:
-Retail Garden Centers
-Retail Home Centers
Segments Overview
Material Handling Segment
The Material Handling Segment is comprised of plastic reusable material handling containers,
pallets and bins; metal shelving, cabinet and racking systems and plastic recreational vehicle tank
and parts, marine tanks, portable fuel and water containers as well as ammunition containers. The
major brands in this segment which include Buckhorn®, Novel®, Myers do Brasil™, Jamco
Products, Akro-Mils™, Ameri-Kart® and Scepter, have strong leadership positions across markets
such as automotive, appliance, general industrial/manufacturing, retail distribution, agriculture, and
food processing. This leadership position is built through constant innovation, diverse manufacturing
processes, consistent quality and superior customer service resulting in significant productivity and
cost-saving benefits for our customers.
Buckhorn’s reusable containers and pallets are used in closed-loop supply chains to help
customers reduce material handling costs by replacing single-use cardboard boxes, easily damaged
wooden pallets and high-cost steel containers. Cost-reduction benefits include: improving product
protection, increasing handling efficiencies, reducing freight costs and eliminating solid waste and
disposal costs. Small parts bins, storage systems and transport products from Akro-Mils provide
similar benefits by creating storage and organization efficiency throughout our end users’ operations.
Buckhorn offers a product selection rich in both breadth and depth, as well as a direct sales
force with the packaging and material handling expertise that makes Buckhorn a key solutions partner
for our customers. Buckhorn’s product line spans injection-molded hand-held containers and totes;
injection and structural foam-molded bulk transport containers in both collapsible and fixed-wall
styles; and injection and structural foam pallets. Buckhorn also produces custom material handling
packaging. Customers rely on Buckhorn’s single-source efficiency and the productivity and
profitability benefits delivered through value-added innovation, broad product selection, quality and
packaging conversion services.
Buckhorn hand-held containers include attached lid, detached lid, bi-color and specialty styles
that stack and/or nest for efficient space usage, thus lowering freight and storage costs. In
manufacturing plants across North America, our container and pallet systems are reused hundreds of
times to ship products such as small fasteners or large components from suppliers directly to
assembly areas — protecting parts throughout the supply chain and reducing scrap rates. Our
attached lid containers and pallets are used in retail distribution centers to organize inventory, sort
orders and then transport products directly to stores. In the food processing and distribution industry,
our specialty containers provide superior protection to food products while in transit and are more
sanitary than cardboard boxes.
Buckhorn’s selection of collapsible and fixed-wall bulk transport containers leads the North
American material handling industry. Bulk containers perform both light and heavy-duty tasks,
whether distributing seed products, carrying large automotive components or shipping liquids across
long distances. These containers range in size from footprints of 32” x 30” to 70” x 48”; heights up to
65”; and weight capacities up to 3,000 lbs. Bulk containers are compatible with forklifts for easy
handling. Many of the containers collapse to a third of their size for space-saving stacking, storage
and return transport, thus helping to reduce freight and storage costs.
Examples of bulk container applications include our CenterFlow™ Container, which is used by
leading seed distributors to efficiently transport and dispense up to 2,500 lbs. of their products. The
unique CenterFlow Container can be emptied in approximately 30 seconds, then broken down for
return shipping and refilling, thus eliminating waste created by traditional seed bags. Manufacturers
of tomato paste employ our Caliber® and Citadel® bulk containers to move processed tomato
products across the country in railcars. The smooth-sided, impact-resistant containers replace
4
wooden crates and steel containers that can cause product damage and contamination. Citadel
containers can carry up to 3,000 lbs. /300 gallons of liquefied product, safely stack when fully loaded
and are designed for long-term indoor or outdoor storage of loads. This product line is applicable to
other food processing and ingredient niches such as concentrates, oils, syrups and similar products.
Buckhorn also manufactures Intrepid™, a 48 “by 40” intermediate bulk container designed to
replace expendable corrugated combo bins. Intrepid is constructed of FDA approved materials and
stores and handles a variety of applications including food, liquid, powder and granular products.
Corrugated boxes are prone to a variety of problems, including leakage, shifting off the pallet during
transport, debris, dust and limited one-time use. Intrepid addresses these issues. Intrepid is reusable
and collapses in seconds, saving space in storage and return freight. Its heavy-duty, injection-molded
design prevents leakage. The collapsible panels are attached to the base, eliminating shifting during
transport, preventing damage from splinters, nails and dust. It stacks securely with or without a lid
and has a capacity up to 2,500 pounds. This container is the perfect addition to our extensive offering
for the food and distribution markets.
Buckhorn’s innovation in bulk containers also focuses on specific niche markets where the
Company’s expertise can bring significant value in a closed loop supply chain. For example, in 2011
Buckhorn acquired tooling assets and intellectual property for a reusable plastic container used in
producing, shipping, storing and processing bulk natural cheese. The “640 Cheese Box” is a natural
extension to Buckhorn’s bulk container product line, offering many benefits over the industry’s
traditional wood boxes by providing end users with less waste and faster cycle times. It is compatible
with cheese industry manufacturing processes including dolly and forklift transport, automation,
vacuum chambers, inverters, packaging and weighing. The 640 Cheese Box has a 24” x 30” x 37”
footprint and a 710-lb. fill capacity. It reduces waste and improves sanitation and quality by replacing
wood boxes, which can splinter and contaminate cheese during the material handling process. USDA
approved, the container allows for faster cool down to 40 degrees within seven days, thereby
minimizing cold storage requirements and producing more consistent cheese from the core to the
outside surface.
Buckhorn’s plastic pallets interwork with the hand-held containers and totes to create a
completely reusable system and provide efficient space utilization in plants, warehouses and truck
trailers — helping customers to reduce storage and freight costs. Buckhorn also produces a wide
range of specialty pallets for niche-type shipping applications, such as drum pallets for chemical and
liquid transport.
Novel is Brazil’s leading designer and manufacturer of reusable plastic crates and totes used for
closed-loop shipping and storage in the region’s fast-growing food and agriculture industries. Novel’s
product line is primarily focused on injection-molded containers but also produces a diverse range of
plastic industrial safety products. With strong relationships to major international companies in its
markets, Novel complements Myers Industries’ material handling business in Brazil and aligns with
the Company’s material handling and geographic growth strategy.
Myers do Brazil serves a number of growing industries in Brazil with storage and organization
solutions featuring plastic shipping containers and plastic pallets, serving the agriculture, automotive,
beverage processing and distribution markets as well as industrial and retail markets.
Akro-Mils provides customers with virtually “everything needed to store, organize and transport
for greater productivity and profitability.” These material handling products serve industrial and
commercial end-users through leading industrial supply catalogers and material handling distributors.
Products range from AkroBins® — the industry’s leading small parts bins — to Super-Size AkroBins,
metal panel and bin hanging systems, metal storage cabinet and bin systems, wire shelving systems,
5
plastic and metal transport carts and a wide variety of custom storage and transport products.
Capabilities used throughout the Akro-Mils product line include injection molding, metal forming,
powder-coat painting/metal finishing and wood fabrication.
Akro-Mils products deliver storage and organization solutions in a wide variety of applications,
from creating assembly line workstations to organizing medical supplies and retail displays. Emphasis
is placed on product bundling and customizing systems to create specific storage and organization
configurations for customers’ operations. For example, industrial manufacturers with specialized tool
and parts storage areas — known as “tool cribs” — use a combination of Akro-Mils bins, racking,
locking cabinets, work tables and transport carts to speed assembly times, maintain accurate
inventories and reduce loss. Metal carts and dollies are paired with custom-made containers to create
unique transport systems capable of handling parts and components both small and large. Our
powder coating/painting capability allows for high-quality, scratch-resistant finishing of metal
products in a multitude of colors and finish styles.
With the resulting benefits of reducing packaging costs, improving safety and quality, simplifying
workflows and eliminating waste, Akro-Mils products provide the perfect solution for workplace
efficiency programs, such as 5S Lean. In support of such programs, Akro-Mils has several product
lines, including the clear Insight® Bin for the healthcare industry and the unique, bi-colored Indicator®
Bin, which provides a visual cue to refill bins for efficient assembly line, supply room or distribution
center work. As a result of new product development and listening to the “voice of the customer” to
provide solutions, the Akro-Mils brand is recognized throughout the material handling industry for
continuous innovation, high quality and reliable service.
Jamco Products is well established in industrial and commercial markets with its wide selection of
welded steel service carts, platform trucks, mobile work centers, racks and cabinets for plastic bins,
safety flammable cabinets, medical cylinder carts and more. Jamco Products strong product offering,
relationships with industrial distributors and reputation for quality and service complements Myers
Industries’ existing Akro-Mils business and aligns with the Company’s material handling growth
strategy.
Manufacturers of recreational vehicles (“RV”) and watercraft rely on our design expertise and
production capabilities to provide them an assortment of products. Through our Ameri-Kart brand, we
create rotationally-molded plastic tanks for water, fuel and waste handling that are assembled to fit
the precise space constraints within RV and marine craft designs. We also utilize thermoforming and
rotational molding to manufacture plastic trim and interior parts for RVs. In addition to molding fuel
tanks, seat components, consoles and storage tanks for watercraft, Ameri-Kart manufactures its
patented Enviro-Fill® overfill prevention system (“OPS”) technology for its marine fuel tanks. AmeriKart is the industry’s only turnkey provider with an integrated, Environmental Protection Agency
(“EPA”)-compliant marine fuel tank and patented Enviro-Fill diurnal system. This OPS/tank vent and
sensor system provides venting and monitoring of the fuel level in the tank during filling and transfers
a pressure signal to the deck fitting when fuel reaches a predetermined level. Integrated with its low
permeation fuel tanks and certified by the EPA to meet the standards of evaporative emissions, this
makes Ameri-Kart unique in offering customers a “total system” for marine fuel tank solutions. This in
turn affords boat manufacturers a single source to comply with EPA and American Boat and Yacht
Council refueling and emission regulations.
Scepter is an industry leading producer of portable marine fuel containers, portable fuel tanks
and water containers and accessories, ammunition containers, storage totes, shipping containers and
beverage crates. In addition to playing a key role in converting the marine industry from traditional
metal cans to HPE outboard fuel tanks, Scepter was the first provider of Jerry Cans in North America,
which offer safe, reliable transportation and storage of fuel for the consumer market.
6
Scepter also manufactures a wide variety of molded products for military and civilian applications
from high quality containers to safely store and transport large caliber ammunition to military
specification portable fuel and water canisters and their accessories.
Scepter’s in-house product engineering and state of the art mold capabilities complements
Myers Industries’ Material Handling Segment in North America through an increased product offering
and global reach.
Cross-marketing and cross-selling are key synergies between the Material Handling Segment
brands. Equally important are cross-manufacturing capabilities that allow each brand to offer
customers a wider range of value-added design and molding benefits. In addition to standard
material handling products, we utilize the extensive design and manufacturing capabilities between
Buckhorn, Scepter and Akro-Mils for turnkey production of custom material handling products.
All of our Material Handling Segment products are designed to reduce the waste produced by
cardboard boxes and wooden pallets in supply chains. In our own manufacturing and product
innovation, we continue to seek eco-friendly alternatives for our own plastic products. For example,
our Akro-Mils EarthSaver® AkroBins and Shelf Bins are produced from 100 percent recycled plastics.
Available in earth tone colors of terra cotta, hunter green and sandstone, the EarthSaver Series offers
users an eco-friendly choice in plastic storage and organization products, while boosting productivity
in the workplace and helping companies make a positive impact on the environment. In addition, our
Buckhorn business utilized more than 30 million lbs. of recycled or reprocessed plastics in its
manufacturing processes last year. This accounted for approximately 26 percent of Buckhorn’s total
material usage, applied to products ranging from hand-held totes to bulk containers.
Sustainable, profitable growth in this segment is fueled by a strong focus on innovation with
value-added new products; concentrating sales efforts on niche markets and applications; increasing
awareness of plastic reusable material handling products to drive conversions from cardboard and
wood products; and managing the balance of product pricing and raw material costs. The potential
for strategic, bolt-on acquisitions also provides opportunities to expand the scope of our brand
leadership and the range of value-added products and services that we bring to customers.
Distribution Segment
Our Distribution Segment includes the Myers Tire Supply® and Myers Tire Supply
International™ and Patch Rubber Company® brands. Myers Tire Supply is the largest U.S.
distributor and single source for tire, wheel and undervehicle service tools, equipment and supplies.
We buy and sell approximately 12,500 different items — everything that professionals need to service
passenger, truck and off-road tires, wheels and related components. Independent tire dealers, mass
merchandisers, commercial auto and truck fleets, auto dealerships, tire retreaders and general repair
facilities rely on our broad product selection, rapid availability and personal service to be more
productive and profitably grow their business.
In 2014, we continued to enhance our business model to optimize our domestic distribution
network. We serve the domestic market through our 19 sales offices and four regional distribution
centers. Our network has improved overall customer service levels, reduced operating costs, and
simplified the supply chain. Internationally, we have three branches in Central America. Sales
personnel from our Akron, Ohio headquarters cover niche markets in the Far East, Middle East, South
Pacific and South America. In addition, we have a joint venture partnership in India, enabling our
effort to expand in emerging international markets.
We purchase products from trusted, industry-leading manufacturers to ensure quality is delivered
to our customers. Each of the brand-name products we sell is associated with superior performance
7
in its respective area. Some of these well-known brands include: Chicago Pneumatic air tools;
Hennessy tire changing, balancing and alignment equipment; Corghi tire changers and balancers;
Ingersoll-Rand air service equipment; HofmannUSA tire balancing and changing equipment; Rotary
lifts and related equipment; Alligator VentilFabrik GMBH tire pressure monitoring systems and tire
valve hardware; Perfect Equipment wheel weights; and our own Patch Rubber brand tire patches,
cements and repair supplies.
An essential element of our success in the Distribution Segment is the network of field sales
representatives, who deliver personalized service on a local level. Customers rely on Myers Tire
Supply sales representatives to introduce the latest tools and technologies and to provide training in
new product features and applications. Representatives also teach the proper use of diagnostic
equipment and present on-site workshops demonstrating industry-approved techniques for tire repair
and undervehicle service.
With a commitment to innovation for our customers, our Myers Tire Supply team continues to
introduce several new product and service offerings that make our customers’ experience with Myers
Tire Supply uniquely valuable. These include a full range of Tire Pressure Monitoring System
products, a web-based “Torque Tracker” program for commercial fleet service providers, and a
vendor managed inventory program, which is designed to help our customers manage the cost of
their consumable inventory and secure highly valuable tools.
While the needs and composition of our distribution markets constantly change, we adapt and
deliver the new products and services that are crucial to our customers’ success. The new product
pipeline is driven by a thorough understanding of the market and its customers’ needs. Myers Tire
Supply in turn works closely with its suppliers to develop innovative products and services to meet
these needs with solutions.
Our manufacturing of rubber products began more than 60 years ago with our Patch Rubber
Company® brand, initially making tire patches. Today, we manufacture one of the most
comprehensive lines of tire repair and retreading products in the United States. Service professionals
rely on our extensive product selection and quality for safe, cost-effective repairs to passenger, truck
and off-road tires. Products include the plug that fills a puncture, the cement that seals the plug, the
tire innerliner patch and the final sealing compound. Patch brand repair products maintain a strong
position in the tire service markets including sales through our Distribution Segment’s sales network.
Also within the capabilities of Patch Rubber, we apply our rubber calendering and compounding
expertise to create a diverse portfolio of products outside of the tire repair market, such as reflective
highway marking tapes. Our rubber-based tape and symbols provide the durability and brightness
that construction professionals demand to replace paint for marking road repair, intersections and
hazardous areas. Compared with traditional highway paint, the tape stock is easier to apply, more
reflective and longer lasting. It is available in both temporary and permanent grades to meet the
customers’ specific requirements.
The Distribution Segment is well positioned to continue its steady growth. The Myers Tire Supply
(U.S.) brand is positioned to expand its leadership through superior product selection, rapid delivery
and the personal service that is the hallmark of the Company’s success in the tire, wheel, and
undervehicle service marketplace. The Myers Tire Supply International brand is positioned to expand
distribution of tire supplies in select regions of the world, presenting new growth opportunities for our
diverse manufacturing businesses. All of this can be achieved through: 1) ongoing productivity
improvements in our distribution network, 2) growing within key domestic market sectors and
emerging international markets, 3) delivering a continuous flow of new products with “first-to-market”
8
speed and 4) improving efficiency and customer satisfaction through implementation of innovative
supply chain management technologies. Strategic, adjacent acquisitions or investments are also a
potential growth avenue in this segment.
Lawn and Garden Overview (Discontinued Operations)
The Company’s Lawn and Garden business includes the Dillen®, ITML™, Pro Cal™, Listo™,
Planters’ Pride® and Akro-Mils Lawn & Garden™ brands, which encompass the variety of plant
containers that growers and retailers need to serve the North American horticulture market. Through
direct sales and distribution channels, we serve customers ranging from professional growers with
greenhouse facilities or outdoor nurseries to independent garden centers and retail home centers.
For growers, our Dillen, ITML, and Pro Cal products create dense growing environments,
increase efficiency and reduce costs in their operations. Our extensive product range includes
injection-molded and thermoformed pots, hanging baskets, flats and carry trays, plug trays, nursery
containers, propagation sheets, and specialty pots. Ever-changing consumer trends have driven
demand for a variety of decorative containers that capture the consumers’ attention at retail without
hampering the operational efficiencies throughout the growing process. Our product innovation efforts
are focused on increasing the output of designs to serve this market by expanding our manufacturing
capabilities to cost-effectively produce these decorative products in North America.
In addition to working with growers on product innovation, we support their increasing needs for
branding and retail merchandising programs with services such as multi-color offset printing and
adhesive labeling. We have expanded our print capabilities to offer our customers two levels of
quality for printed pots, our GreenStar option for basic brand identification, and a premium, SilverStar
print package for more elaborate pot graphics. Once filled with plant material by the grower and
shipped to retail, these customized pots serve as packaging for plants and create vibrant point-ofsale materials.
For retailers, our Listo brand encompasses decorative resin planters that feature intricate molding
details and unique finishes in ceramic, metallic, weathered stone and natural textured styles. The
upscale look of these decorative planters captures the retailer’s attention and the consumer’s
imagination. Products include a diverse offering of planters, bowls and accent pieces for indoor and
outdoor container gardening. Consistent new product development is key to our success in the retail
garden center, ecommerce, food and drug and mass merchandiser channels. Proprietary molding
and finishing processes, along with creative designs, deliver the unique look in the decorative resin
planter category that sets our products apart from the competition in leading retail stores across North
America.
In addition to Listo, two other brands in the retail channel of the Lawn and Garden business
include Planters’ Pride and Akro-Mils Lawn & Garden products. Planters’ Pride has a diverse product
offering dedicated to the at-home gardener. Featured products include a wide range of Fiber Grow®
seed starting kits with 100 percent, USDA Certified peat-free renewable coconut coir (coconut husk)
pellets and pots that outperform the competing offerings. In addition, our exclusive offerings of
gel2root™ rooting gel, coconut coir soils, coconut coir mulches and other great gardening
accessories are all backed by customizable retail displays.
Akro-Mils Lawn & Garden provides a wide range of high quality planters, innovative vertical
gardens, dependable hanging baskets, as well as ergonomic watering cans and other related items
for the home gardener. With sizes ranging from three ounces to one thousand gallons, and more than
eight different materials available, the Akro-Mils Lawn and Garden line is sure to carry the solution for
every customer. For example, the use of price neutral alternative materials in Akro-Mils Lawn and
9
Garden planters is evident in the EcoResin™ and BioBamboo™ product lines. EcoResin planters are
made from up to 30% non-food, non-forest plant fibers and do not sacrifice quality or price. The
BioBamboo product lines are made from a blend of bamboo fibers and plant based resins which
create a bio-degradable planter that minimizes its impact on the environment.
One of Lawn and Garden’s initiatives continues to be expanding the use of reprocessed and
recycled materials in the manufacturing process, which helps to reduce the Company’s exposure to
higher costs for virgin raw material and furthers our commitment to environmentally responsible
manufacturing. In addition to sourcing sustainable eco-friendly materials, such as Coconut Coir for
Fiber Grow products, the Lawn & Garden Group reprocesses plastic scrap into new containers.
Beyond continued sourcing of recycled raw materials, Myers Lawn and Garden continues to innovate
solutions by exploring options in bio-based resins and other alternative material sources.
Weather conditions, grower consolidation and grower supply chain adjustments to meet retail
merchandising programs are some of the key external factors that influence this industry. The
horticultural market has evolved with grower consolidation creating a more direct supply chain to
serve the box stores, therefore, Lawn and Garden has realigned the manufacturing operations to
better serve its customers in the Midwest and South and we have opened a facility in Sparks, Nevada
to be closer to customers in the West.
Raw Materials & Suppliers — Manufacturing and Distribution Segments
The Company purchases substantially all of its raw materials from a wide range of third-party
suppliers. These materials are primarily polyethylene, polypropylene, and polystyrene plastic resins,
as well as synthetic and natural rubber. Most raw materials are commodity products and available
from several domestic suppliers. We believe that the loss of any one supplier or group of suppliers
would not have a material adverse effect on our business.
Our Distribution Segment purchases substantially all of its components from third-party suppliers
and has multiple sources for its products.
Competition
Competition in our Material Handling Segment is substantial and varied in form and size from
manufacturers of similar products and of other products which can be substituted for those produced
by the Company. In general, most direct competitors with the Company’s brands are private entities.
Myers Industries maintains strong brand presence and market positions in the niche sectors of the
markets it serves. The Company does not command substantial, overall market presence in the broad
market sectors.
Competition in our Distribution Segment is generally comprised of small companies, regional
players and national auto parts chains where product offerings may overlap. Within the overall tire,
wheel and undervehicle service market, Myers Industries is the largest North American distributor of
tools, equipment and supplies offered based on national coverage.
Customer Dependence
In 2014, 2013 and 2012, there were no customers that accounted for more than five percent of
total net sales. Myers Industries serves thousands of customers who demand value through product
selection, innovation, quality, delivery and responsive personal service. Our brands foster satisfied,
loyal customers who have recognized our performance through numerous supplier quality awards.
10
Employees
As of December 31, 2014, Myers Industries had a total of 3,241 full-time and part-time
employees. Of these, 1,802 were employed in the Company’s Material Handling Segment. The
Distribution Segment employed 527 personnel and the Lawn and Garden business employed 856
personnel. The Company’s corporate offices had 56 employees.
As of December 31, 2014, the Company had approximately 523 employees represented by labor
unions. Collective bargaining agreements between us and these labor unions expire March
2015, November 2015 and June 2016, representing approximately 111, 177 and 235 employees,
respectively. We consider our relationship with our employees generally to be satisfactory.
(d) Financial Information About Geographic Areas
The response to this section of Item 1 is contained in the Industry Segments footnote of the Notes
to Consolidated Financial Statements under Item 8 of this report.
(e) Available Information
Filings with the SEC. As a public company, we regularly file reports and proxy statements with
the Securities and Exchange Commission (“SEC”), such as:
* annual reports on Form 10-K;
* quarterly reports on Form 10-Q;
* current reports on Form 8-K; and
* proxy statements on Schedule 14A.
Anyone may read and copy any of the materials we file with the SEC at its Public Reference
Room at 100 F Street, N.E., Washington, DC 20549. Information regarding operations of the Public
Reference Room may also be obtained by calling the SEC at 1-800-SEC-0330. The SEC also
maintains an internet website that contains our reports, proxy and information statements, and our
other SEC filings; the address of that site is http://www.sec.gov.
Also, we make our SEC filings available free of charge on our own internet site as soon as
reasonably practicable after we have filed with the SEC. Our internet address is
http://www.myersindustries.com. The content on the Company’s website is available for informational
purposes only and is not incorporated by reference into this Form 10-K.
Corporate Governance. We have a Code of Business Conduct for our employees and members
of our Board of Directors. A copy of this Code is posted on our website in the section titled “Investor
Relations”. We will satisfy any disclosure requirement under Item 5.05 of Form 8-K regarding an
amendment to, or waiver from, any provision of this Code with respect to our executive officers or
directors by disclosing the nature of that amendment or waiver.
Our website also contains additional information about our corporate governance policies,
including the charters of our standing board committees. Any of these items are available in print to
any shareholder who requests them. Requests should be sent to Corporate Secretary, Myers
Industries, Inc., 1293 S. Main Street, Akron, Ohio 44301.
11
ITEM 1A. Risk Factors
This Form 10-K and the information we are incorporating by reference contain forward-looking
statements within the meaning of federal securities laws, including information regarding the
Company’s 2015 financial outlook, future plans, objectives, business prospects and anticipated
financial performance. You can identify these statements by the fact that they include words such as
“will,” “believe,” “anticipate,” “expect,” “estimate,” “intend,” “plan,” or variations of these words, or
similar expressions. These forward-looking statements are not statements of historical facts and
represent only our current expectations regarding such matters. These statements inherently involve a
wide range of known and unknown uncertainties. The Company’s actual actions and results could
differ materially from what is expressed or implied by these statements. Specific factors that could
cause such a difference include those set forth below and other important factors disclosed
previously and from time to time in our other filings with the Securities and Exchange Commission.
Given these factors, as well as other variables that may affect our operating results, you should not
rely on forward-looking statements, assume that past financial performance will be a reliable indicator
of future performance, nor use historical trends to anticipate results or trends in future periods. We
expressly disclaim any obligation or intention to provide updates to the forward-looking statements
and the estimates and assumptions associated with them.
Risks and uncertainties that could cause actual results to differ materially from those expressed
or implied in the applicable statements include:
Any significant increase in the cost of raw materials or disruption in the availability of raw
materials could adversely affect our performance.
Our ability to manage our cost structure can be adversely affected by movements in commodity
and other raw material prices. Our primary raw materials include plastic resins, colorants and natural
and synthetic rubbers. Plastic resins in particular are subject to substantial short term price
fluctuations, including those arising from supply shortages and changes in the price of natural gas,
crude oil and other petrochemical intermediates from which resins are produced, as well as other
factors. Over the past several years, we have at times experienced rapidly increasing resin prices.
The Company’s revenue and profitability may be materially and adversely affected by these price
fluctuations.
Market conditions may limit our ability to raise selling prices to offset increases in our raw material
input costs. If we are unsuccessful in developing ways to mitigate raw material cost increases, we
may not be able to improve productivity or realize our ongoing cost reduction programs sufficiently to
help offset the impact of these increased raw material costs. As a result, higher raw material costs
could result in declining margins and operating results.
Changes in raw material availability may also occur due to events beyond our control, including
natural disasters such as floods, tornadoes and hurricanes. Our specific molding technologies and/or
product specifications can limit our ability to locate alternative suppliers to produce certain products.
We may incur inherent risks associated with our strategic growth initiatives.
Our growth initiatives include internal growth driven by strong brands and new product
innovation; development of new, high-growth markets and expansion in existing niche markets;
strengthened customer relationships through value-added initiatives and key product partnerships;
investments in new technology and processes to reinforce market strength and capabilities in key
business groups; consolidation and rationalization activities to further reduce costs and improve
productivity within our manufacturing and distribution footprint; an opportunistic and disciplined
approach to strategic, bolt-on acquisitions to accelerate growth in our market positions; and potential
divestitures of businesses with non-strategic products or markets.
12
While this is a continuous process, all of these activities and initiatives have inherent risks and
there remain significant challenges and uncertainties, including economic and general business
conditions that could limit our ability to achieve anticipated benefits associated with announced
strategic initiatives and affect our financial results. We may not achieve any or all of these goals and
are unable to predict whether these initiatives will produce significant revenues or profits.
We may not realize the improved operating results that we anticipate from past and recent
acquisitions or from acquisitions we may make in the future and we may experience
difficulties in integrating the acquired businesses or may inherit significant liabilities related
to such businesses.
We explore opportunities to acquire businesses that we believe are related to our core
competencies from time to time, some of which may be material to us. We expect such acquisitions
will produce operating results consistent with our other operations; however, we may be unable to
achieve the benefits expected to be realized from our acquisitions. In addition, we may incur
additional costs and our management’s attention may be diverted because of unforeseen expenses,
difficulties, complications, delays and other risks inherent in acquiring businesses, including the
following:
• we may have difficulty integrating the acquired businesses as planned, which may include
integration of systems of internal controls over financial reporting and other financial and
administrative functions;
• we may have delays in realizing the benefits of our strategies for an acquired business;
• we may not be able to retain key employees necessary to continue the operations of an
acquired business;
• acquisition costs may be met with cash or debt, increasing the risk that we will be unable to
satisfy current financial obligations; and
• acquired companies may have unknown liabilities that could require us to spend significant
amounts of additional capital.
Our results of operations and financial condition could be adversely affected by a downturn
in the general markets or the general economic environment.
We operate in a wide range of geographies, primarily North America, Central America and South
America. Worldwide and regional economic, business and political conditions, including changes in
the economic conditions of the broader markets and in our individual niche markets, could have an
adverse affect on one or more of our operating segments.
We operate in a very competitive business environment.
Each of our segments participates in markets that are highly competitive. Many of our
competitors sell their products at prices lower than ours and we compete primarily on the basis of
product quality, product performance, value, and supply chain competency. Our competitive success
also depends on our ability to maintain strong brands, customer relationships and the belief that
customers will need our products and services to meet their growth requirements. The development
and maintenance of such brands requires continuous investment in brand building, marketing
initiatives and advertising. The competition that we face in all of our markets — which varies
depending on the particular business segment, product lines and customers — may prevent us from
achieving sales, product pricing and income goals, which could affect our financial condition and
results of operations.
13
Our operations depend on our ability to maintain continuous, uninterrupted production at
our manufacturing facilities, which are subject to physical and other risks that could disrupt
production.
We are subject to inherent risks in our diverse manufacturing and distribution activities, including,
but not limited to: product quality, safety, licensing requirements and other regulatory issues,
environmental events, loss or impairment of key manufacturing or distribution sites, disruptions in
logistics and transportation services, labor disputes and industrial accidents. While we maintain
insurance covering our manufacturing and production facilities, including business interruption
insurance, a catastrophic loss of the use of all or a portion of our facilities due to accident, fire,
explosion, or natural disaster, whether short or long-term, could have a material adverse effect on our
business, financial condition and results of operations.
Unexpected failures of our equipment and machinery may also result in production delays,
revenue loss and significant repair costs, as well as injuries to our employees. Any interruption in
production capability may require us to make large capital expenditures to remedy the situation,
which could have a negative impact on our profitability and cash flows. Our business interruption
insurance may not be sufficient to offset the lost revenues or increased costs that we may experience
during a disruption of our operations. A temporary or long-term business disruption could result in a
permanent loss of customers. If this were to occur, our future sales levels, and therefore our
profitability, could be materially adversely affected.
We derive a portion of our revenues from direct and indirect sales outside the United States
and are subject to the risks of doing business in foreign countries.
We currently operate manufacturing, sales and service facilities outside of the United States,
particularly in Canada and Brazil. For the year ended December 31, 2014, international net sales
accounted for approximately 15% of our total net sales from continuing operations. Accordingly, we
are subject to risks associated with operations in foreign countries, including:
• fluctuations in currency exchange rates;
• limitations on the remittance of dividends and other payments by foreign subsidiaries;
• limitations on foreign investment;
• additional costs of compliance with local regulations; and
• in certain countries, higher rates of inflation than in the United States.
In addition, our operations outside the United States are subject to the risk of new and different
legal and regulatory requirements in local jurisdictions, potential difficulties in staffing and managing
local operations and potentially adverse tax consequences. The costs related to our international
operations could adversely affect our operations and financial results in the future.
Our future performance depends in part on our ability to develop and market new products if
there are changes in technology, regulatory requirements or competitive processes.
Changes in technology, regulatory requirements and competitive processes may render certain
products obsolete or less attractive. Our performance in the future will depend in part on our ability to
develop and market new products that will gain customer acceptance and loyalty, as well as our ability
to adapt our product offerings and control our costs to meet changing market conditions. Our operating
performance would be adversely affected if we were to incur delays in developing new products or if
such products did not gain market acceptance. There can be no assurance that existing or future
products will be sufficiently successful to enable us to effectively compete in our markets or, should new
product offerings meet with significant customer acceptance, that one or more current or future
competitors will not introduce products that render our products noncompetitive.
14
We may not be successful in protecting our intellectual property rights, including our
unpatented proprietary know-how and trade secrets, or in avoiding claims that we infringed
on the intellectual property rights of others.
In addition to relying on patent and trademark rights, we rely on unpatented proprietary knowhow and trade secrets and employ various methods, including confidentiality agreements with
employees and consultants, to protect our know-how and trade secrets. However, these methods and
our patents and trademarks may not afford complete protection and there can be no assurance that
others will not independently develop the know-how and trade secrets or develop better production
methods than us. Further, we may not be able to deter current and former employees, contractors
and other parties from breaching confidentiality agreements and misappropriating proprietary
information and it is possible that third parties may copy or otherwise obtain and use our information
and proprietary technology without authorization or otherwise infringe on our intellectual property
rights. Additionally, in the future we may license patents, trademarks, trade secrets and similar
proprietary rights to third parties. While we attempt to ensure that our intellectual property and similar
proprietary rights are protected when entering into business relationships, third parties may take
actions that could materially and adversely affect our rights or the value of our intellectual property,
similar proprietary rights or reputation. In the future, we may also rely on litigation to enforce our
intellectual property rights and contractual rights and, if not successful, we may not be able to protect
the value of our intellectual property. Furthermore, no assurance can be given that we will not be
subject to claims asserting the infringement of the intellectual property rights of third parties seeking
damages, the payment of royalties or licensing fees and/or injunctions against the sale of our
products. Any litigation could be protracted and costly and could have a material adverse effect on
our business and results of operations regardless of its outcome.
If we are unable to maintain access to credit financing, our business may be adversely
affected.
The Company’s ability to make payments and to refinance our indebtedness, fund planned
capital expenditures and acquisitions and pay dividends will depend on our ability to generate cash
in the future and retain access to credit financing. This, to some extent, is subject to general
economic, financial, competitive, legislative, regulatory and other factors that are beyond our control.
We cannot provide assurance that our business will generate sufficient cash flow from operating
activities or that future borrowings will be available to us under our credit facilities in amounts
sufficient to enable us to service debt, make necessary capital expenditures or fund other liquidity
needs. We may need to refinance all or a portion of our indebtedness, on or before maturity. We
cannot be sure that we would be able to refinance any of our indebtedness on commercially
reasonable terms or at all.
The credit facilities contain restrictive covenants and cross default provisions that require us to
maintain specified financial ratios. The Company’s ability to satisfy those financial ratios can be
affected by events beyond our control, and we cannot be assured we will satisfy those ratios. A
breach of any of those financial ratio covenants or other covenants could result in a default. Upon the
occurrence of an event of default, the lenders could elect to declare the applicable outstanding
indebtedness due immediately and payable and terminate all commitments to extend further credit.
We cannot be sure that our lenders would waive a default or that we could pay the indebtedness in
full if it were accelerated.
15
If we fail to maintain an effective system of internal control over financial reporting, we may
not be able to accurately report our financial results. As a result, current and potential
shareholders could lose confidence in our financial reporting, which would harm our
business and the trading price of our common stock.
Internal control systems are intended to provide reasonable assurance regarding the preparation and
fair presentation of published financial statements. We concluded that our internal controls over financial
reporting were ineffective as of December 31, 2014 as a result of control deficiencies over our Brazilian
operations. As described in Item 9A of this Form 10-K, during 2014 we identified control deficiencies with
respect to the design and operational effectiveness of our internal control over financial reporting, which
when aggregated, represented material weaknesses in internal control over the inventory and the financial
statement close processes, including insufficient management oversight and monitoring of the controls at
our Brazilian operations. Under standards established by the Public Company Accounting Oversight
Board, a material weakness is a deficiency, or combination of deficiencies, in internal control over financial
reporting, such that there is a reasonable possibility that a material misstatement of our annual or interim
financial statements will not be prevented or detected or corrected on a timely basis. Although we plan to
complete remediation as quickly as possible in 2015, we cannot at this time estimate how long it will take,
and our initiatives may not prove to be successful in remediating these material weaknesses. As with any
material weakness, if our remedial measures are insufficient to address these material weaknesses, or if
additional material weaknesses or significant deficiencies in our internal control over financial reporting are
discovered or occur in the future, our consolidated financial statements may contain material
misstatements.
Future claims, litigation and regulatory actions could adversely affect our financial condition
and our ability to conduct our business.
While we strive to ensure that our products comply with applicable government regulatory
standards and internal requirements and that our products perform effectively and safely, customers
from time to time could claim that our products do not meet contractual requirements, and users
could be harmed by use or misuse of our products. This could give rise to breach of contract,
warranty or recall claims, or claims for negligence, product liability, strict liability, personal injury or
property damage. Product liability insurance coverage may not be available or adequate in all
circumstances. In addition, claims may arise related to patent infringement, environmental liabilities,
distributor terminations, commercial contracts, antitrust or competition law, employment law and
employee benefits issues and other regulatory matters. While we have in place processes and
policies to mitigate these risks and to investigate and address such claims as they arise, we cannot
predict the underlying costs to defend or resolve such claims.
Current and future environmental and other governmental laws and requirements could
adversely affect our financial condition and our ability to conduct our business.
Our operations are subject to federal, state, local and foreign environmental laws and regulations
that impose limitations on the discharge of pollutants into the air and water and establish standards
for the handling, use, treatment, storage and disposal of, or exposure to, hazardous wastes and other
materials and require clean up of contaminated sites. Some of these laws and regulations require us
to obtain permits, which contain terms and conditions that impose limitations on our ability to emit and
discharge hazardous materials into the environment and periodically may be subject to modification,
renewal and revocation by issuing authorities. Fines, penalties and other civil or criminal sanctions
may be imposed for non-compliance with applicable environmental laws and regulations and the
failure to have or to comply with the terms and conditions of required permits. Certain environmental
laws in the United States, such as the federal Superfund law and similar state laws, impose liability for
the cost of investigation or remediation of contaminated sites upon the current or, in some cases, the
former site owners or operators (or their predecessor entities) and upon parties who arranged for the
16
disposal of wastes or transported or sent those wastes to an off-site facility for treatment or disposal,
regardless of when the release of hazardous substances occurred or the lawfulness of the activities
giving rise to the release. Such liability can be imposed without regard to fault and, under certain
circumstances, can be joint and several, resulting in one party being held responsible for the entire
obligation.
While we have not been required historically to make significant capital expenditures in order to
comply with applicable environmental laws and regulations, we cannot predict with any certainty our
future capital expenditure requirements because of continually changing compliance standards and
environmental technology. Furthermore, violations or contaminated sites that we do not know about,
including contamination caused by prior owners and operators of such sites, or at sites formerly
owned or operated by us or our predecessors in connection with discontinued operations, could
result in additional compliance or remediation costs or other liabilities, which could be material.
In that we may be a potentially responsible party (“PRP”) of the New Idria Mercury Mine, the
Company accrued costs related to performing a remedial investigation and feasibility study. As
investigation and remediation proceed, it is likely that adjustments to the liability will be necessary to
reflect new information. Estimates of the Company’s liability are based on current facts, laws,
regulations and technology. Estimates of the Company’s environmental liabilities are further subject to
uncertainties regarding the nature and extent of site contamination, the range of remediation
alternatives available, evolving remediation standards, imprecise engineering evaluation and cost
estimates, the extent of corrective actions that may be required and the number and financial
condition of other PRPs, as well as the extent of their responsibility for the remediation, and the
availability of insurance coverage for these expenses.
We have limited insurance coverage for potential environmental liabilities associated with historic
and current operations and we do not anticipate increasing such coverage in the future. We may also
assume significant environmental liabilities in acquisitions. Such costs or liabilities could adversely
affect our financial situation and our ability to conduct our business.
Environmental regulations specific to plastic products and containers could adversely affect
our ability to conduct our business.
Federal, state, local and foreign governments could enact laws or regulations concerning
environmental matters that increase the cost of producing, or otherwise adversely affect the demand
for, plastic products. Legislation that would prohibit, tax or restrict the sale or use of certain types of
plastic and other containers, and would require diversion of solid wastes such as packaging materials
from disposal in landfills, has been or may be introduced in the U.S. Congress, in state legislatures
and other legislative bodies. While container legislation has been adopted in a few jurisdictions,
similar legislation has been defeated in public referenda in several states, local elections and many
state and local legislative sessions. There can be no assurance that future legislation or regulation
would not have a material adverse effect on us. Furthermore, a decline in consumer preference for
plastic products due to environmental considerations could have a negative effect on our business.
Our insurance coverage may be inadequate to protect against potential hazardous incidents
to our business.
We maintain property, business interruption, product liability and casualty insurance coverage,
but such insurance may not provide adequate coverage against potential claims, including losses
resulting from war risks, terrorist acts or product liability claims relating to products we manufacture.
Consistent with market conditions in the insurance industry, premiums and deductibles for some of
our insurance policies have been increasing and may continue to increase in the future. In some
instances, some types of insurance may become available only for reduced amounts of coverage, if
at all. In addition, there can be no assurance that our insurers would not challenge coverage for
17
certain claims. If we were to incur a significant liability for which we were not fully insured or that our
insurers disputed, it could have a material adverse effect on our financial position, results of
operations or cash flows.
Our business operations could be significantly disrupted if members of our senior
management team were to leave.
Our success depends to a significant degree upon the continued contributions of our senior
management team. Our senior management team has extensive manufacturing, finance and
engineering experience, and we believe that the depth of our management team is instrumental to our
continued success. The loss of any of our key executive officers in the future could significantly
impede our ability to successfully implement our business strategy, financial plans, expansion of
services, marketing and other objectives.
Unforeseen future events may negatively impact our economic condition.
Future events may occur that would adversely affect the reported value of our assets. Such
events may include, but are not limited to, strategic decisions made in response to changes in
economic and competitive conditions, the impact of the economic environment on our customer base,
or a material adverse change in our relationship with significant customers.
Equity Ownership Concentration
Based solely on the Schedule 13D filed on February 19, 2015, by Gabelli Funds, LLC, GAMCO
Asset Management Inc., MJG Associates, Inc., Gabelli Securities, Inc., Teton Advisors, Inc., GGCP,
Inc., and GAMCO Investors, Inc., (collectively, the “Gamco Group”), for which the Company disclaims
any responsibility, beneficially owned 6,607,410 shares of our common stock which represented
approximately 21% of the 31,511,839 shares outstanding as reported in our Form 10-Q for the
quarterly period ended September 30, 2014. Combined, these parties may have sufficient voting
power to influence actions requiring the approval of our shareholders.
Legal & Regulatory Actions
Changes in laws and regulations and approvals and decisions of courts, regulators, and
governmental bodies on any legal claims known or unknown, could have an adverse affect on the
Company’s financial results.
ITEM 1B. Unresolved Staff Comments
None.
18
ITEM 2.
Properties
The following table sets forth certain information with respect to properties owned by the
Company:
Distribution
Approximate
Floor Space
(Square Feet)
Location
Approximate
Land Area
(Acres)
Akron, Ohio . . . . . . . . . . . . . . . . . . . . . .
129,000
8
Akron, Ohio . . . . . . . . . . . . . . . . . . . . . .
Akron, Ohio . . . . . . . . . . . . . . . . . . . . . .
Pomona, California . . . . . . . . . . . . . . . . .
60,000
31,000
18,000
5
2
1
Use
Executive offices and
warehousing
Distribution center
Warehousing
Sales and distribution center
Manufacturing
Miami, Oklahoma . . . . . . . . . . . . . . . . . .
Sandusky, Ohio . . . . . . . . . . . . . . . . . . .
Springfield, Missouri . . . . . . . . . . . . . . .
Wadsworth, Ohio . . . . . . . . . . . . . . . . . .
Sparks, Nevada . . . . . . . . . . . . . . . . . . .
Bristol, Indiana . . . . . . . . . . . . . . . . . . . .
Bluffton, Indiana . . . . . . . . . . . . . . . . . . .
Roanoke Rapids, North Carolina . . . . .
Scarborough, Ontario . . . . . . . . . . . . . .
Sebring, Florida . . . . . . . . . . . . . . . . . . .
330,000
305,000
227,000
197,000
185,000
185,000
175,000
172,000
170,000
26,000
16
8
19
23
11
12
17
20
8
10
Manufacturing and distribution
Manufacturing and distribution
Manufacturing and distribution
Manufacturing and distribution
Held for sale
Manufacturing and distribution
Manufacturing and distribution
Manufacturing and distribution
Manufacturing and distribution
Held for sale
The following table sets forth certain information with respect to facilities leased by the Company.
Manufacturing & Distribution
Location
Middlefield, Ohio . . . . . . . . . . .
Elyria, Ohio . . . . . . . . . . . . . . . .
Cassopolis, Michigan . . . . . . . .
South Beloit, Illinois . . . . . . . . .
Springfield, Missouri . . . . . . . . .
Lauro de Freitas City, Bahia,
Brazil . . . . . . . . . . . . . . . . . . .
Ibipora, Parana, Brazil . . . . . . .
Brantford, Ontario, Canada . . .
Southaven, Mississippi . . . . . .
Jaguariuna, Brazil . . . . . . . . . .
Springfield, Missouri . . . . . . . . .
Springfield, Missouri . . . . . . . . .
Burlington, Ontario, Canada . .
Salt Lake City, Utah . . . . . . . . .
Milford, Ohio . . . . . . . . . . . . . . .
Twinsburg, Ohio . . . . . . . . . . . .
Approximate
Floor Space
(Square Feet)
Expiration Date
of Lease
632,000
451,000
198,000
160,000
120,000
September 30, 2025
September 30, 2015
October 31, 2015
September 30, 2017
August 31, 2016
Held for sale
Held for sale
Manufacturing and distribution
Manufacturing and distribution
Manufacturing and distribution
77,000
68,000
58,000
56,000
54,000
51,000
49,000
46,000
31,000
22,000
11,000
June 30, 2015
December 31, 2015
January 31, 2015
September 30, 2016
April 30, 2017
August 31, 2016
August 31, 2016
January 31, 2015
October 31, 2016
November 30, 2015
October 31, 2023
Manufacturing and distribution
Manufacturing and distribution
Held for sale
Distribution center
Manufacturing and distribution
Manufacturing and distribution
Manufacturing and distribution
Held for sale
Distribution center
Administration and sales
Held for sale
Use
The Company also leases facilities in 19 locations throughout the United States and Canada
which, in the aggregate, amount to approximately 50,000 square feet of warehouse and office space.
All of these locations are used by the Distribution Segment.
19
The Company believes that all of its properties, machinery and equipment generally are well
maintained and adequate for the purposes for which they are used.
ITEM 3.
Legal Proceedings
The Company is a defendant in various lawsuits and a party to various other legal proceedings,
in the ordinary course of business, some of which are covered in whole or in part by insurance. We
believe that the outcome of these lawsuits and other proceedings will not individually or in the
aggregate have a future material adverse effect on our consolidated financial position, results of
operations or cash flows.
New Idria Mercury Mine
Effective October 2011, the U.S. Environmental Protection Agency (“EPA”) added the New Idria
Mercury Mine site located near Hollister, California to the Superfund National Priorities List because of
alleged contaminants discharged to California waterways. The New Idria Quicksilver Mining
Company, founded in 1936, and later renamed the New Idria Mining & Chemical Company (“NIMCC”)
owned and/or operated the New Idria Mine through 1976. In 1981 NIMCC was merged into Buckhorn
Metal Products Inc. and subsequently acquired by Myers Industries in 1987. The EPA contends that
past mining operations have resulted in mercury contamination and acid mine drainage at the mine
site, in the San Carlos Creek, Silver Creek and a portion of Panoche Creek and that other downstream
locations may also be impacted.
Since Buckhorn Inc. may be a potentially responsible party (“PRP”) of the New Idria Mercury
Mine, the Company recognized an expense of $1.9 million, on an undiscounted basis, in 2011 related
to performing a remedial investigation and feasibility study to determine the extent of remediation and
the screening of alternatives. Expenses of approximately $0.8 million have been incurred and
charged against the reserve classified in Other Liabilities on the Consolidated Statements of Financial
Position as of December 31, 2014. As investigation and remediation proceed, it is likely that
adjustments to the reserved expense will be necessary to reflect new information. Estimates of the
Company’s liability are based on current facts, laws, regulations and technology. Estimates of the
Company’s environmental liabilities are further subject to uncertainties regarding the nature and
extent of site contamination, the range of remediation alternatives available, evolving remediation
standards, imprecise engineering evaluation and cost estimates, the extent of corrective actions that
may be required, the number and financial condition of other PRPs as well as the extent of their
responsibility for the remediation, and the availability of insurance coverage for these expenses. At
this time, further remediation cost estimates are not known and have not been prepared.
In November 2011, the EPA completed an interim removal project at the New Idria Mercury Mine
site. It is expected this removal action will be part of the final remediation strategy for the site.
According to informal reports, EPA’s interim removal project costs were approximately $0.5 million.
The Company and Buckhorn have received indications that the EPA intends to seek recovery of the
costs of this work and other past costs from the Company and Buckhorn and to initiate the
administrative processes whereby the Company and/or Buckhorn would perform the remedial
investigation and feasibility study described above.
Guadelupe River Watershed TMDL
A number of parties, including the Company and its subsidiary, Buckhorn, were identified in a
planning document adopted in October 2008 by the California Regional Water Quality Control Board,
San Francisco Bay Region (“RWQCB”). The planning document relates to the presence of mercury,
including amounts contained in mining wastes, in and around the Guadalupe River Watershed
(“Watershed”) region in Santa Clara County, California and specifically to the development of a “total
20
maximum daily load” (“TMDL”) for mercury deposits into the Watershed. The RWQCB has since
completed the development and adoption of the Watershed mercury TMDL. Buckhorn has previously
been alleged to be a successor in interest to NIMCC, which owned property and performed mining
operations in a portion of the Watershed area. The Company has not been contacted by the RWQCB
or by other parties who have been involved in Watershed clean-up efforts that have been initiated as
a result of the adoption of the TMDL. Although assertion of a claim by the RWQCB or another party
involved in this clean up effort is reasonably possible, it is not possible at this time to estimate the
amount of any obligation the Company may incur for these cleanup efforts within the Watershed
region, or whether such cost would be material to the Company’s consolidated financial statements.
Other
Buckhorn and Schoeller Arca Systems, Inc. (“SAS”) were plaintiffs in a patent infringement
lawsuit against Orbis Corp. and Orbis Material Handling, Inc. (“Orbis”) for alleged breach by Orbis of
an exclusive patent license agreement from SAS to Buckhorn. SAS is an affiliate of Schoeller Arca
Systems Services B.V. (“SASS B.V.”), a Dutch company. SAS manufactures and sells plastic
returnable packaging systems for material handling. In the course of the litigation, it was discovered
that SAS had given a patent license agreement to a predecessor of Orbis that pre-dated the one that
SAS sold to Buckhorn. As a result, judgment was entered in favor of Orbis, and the court awarded
attorney fees and costs to Orbis in the amount of $3.1 million, plus interest and costs. In May 2014,
Orbis made demand to SAS that SAS pay the judgment in full, and subsequently in July 2014, Orbis
made the same demand to Buckhorn. Although the range of exposure is $0 - $3.1 million, plus
interest, Buckhorn’s responsibility as a co-judgment debtor is not specified. Buckhorn believes it is
not responsible for any of the award because it is not a party to the Orbis license and will continue to
aggressively pursue any and all legal actions both with respect to appealing the award requesting
SAS be named solely responsible for payment of the judgment, as well as pursuing SAS and SASS
B.V. for fraudulently selling an exclusive patent license they could not sell. In August 2014, SASS B.V.
informed Buckhorn that SAS may not have the financial ability to pay the judgment and provided
financial statements to Buckhorn indicating SAS is in financial distress and while SASS B.V is
financially stable, the award is against SAS, not SASS B.V. Given the uncertainty of SAS’s financial
ability to meet the obligation and the judgment is joint and several, Myers has recorded an expense
during 2014 for the entire amount of the unpaid judgment of $3.0 million, despite the belief we will
ultimately be successful in the appeal and suing SAS and SASS B.V. The matter is presently under
appeal and Buckhorn is also suing SAS and SASS B.V.
When management believes that a loss arising from these matters is probable and can
reasonably be estimated, we record the amount of the estimated loss, or the minimum estimated
liability when the loss is estimated using a range, and no point within the range is more probable of
occurrence than another. As additional information becomes available, any potential liability related to
these matters will be assessed and the estimates will be revised, if necessary.
Based on current available information, management believes that the ultimate outcome of these
matters will not have a material adverse effect on our financial position, cash flows or overall trends in
our results of operations. However, these matters are subject to inherent uncertainties, and
unfavorable rulings could occur. If an unfavorable ruling were to occur, there exists the possibility of a
material adverse impact on the financial position and results of operations of the period in which the
ruling occurs, or in future periods.
21
EXECUTIVE OFFICERS OF THE REGISTRANT
Set forth below is certain information concerning the executive officers of the Registrant as of
December 31, 2014. Executive officers are appointed annually by the Board of Directors.
Name
Age
Years as
Executive Officer
John C. Orr . . . . . . . . . . . .
Greggory W. Branning . . .
64
53
12
3
Title
President and Chief Executive Officer
Senior Vice President, Chief Financial Officer and
Corporate Secretary
Mr. Orr, President and Chief Executive Officer, was appointed to his current position on May 1,
2005. Mr. Orr had been President and Chief Operating Officer since 2003. Prior to that Mr. Orr was
General Manager of Buckhorn Inc., one of the Company’s material handling subsidiaries. Before
coming to the Company, Mr. Orr had been employed by The Goodyear Tire & Rubber Company for
28 years. His last position at Goodyear was Vice President — North America.
Mr. Branning, Senior Vice President, Chief Financial Officer and Corporate Secretary, was
appointed to his current position on September 1, 2012. Prior to that he was with Danaher
Corporation, where he served as Vice President of Finance and Chief Financial Officer of Thomson
Industries, a Danaher subsidiary. Mr. Branning joined Danaher Corporation in 2003 where he served
in various leadership positions in various subsidiaries of Danaher.
Section 16(a) of the Securities Exchange Act of 1934 requires the Registrant’s Directors, certain
of its executive officers and persons who own more than ten percent of its Common Stock (“Insiders”)
to file reports of ownership and changes in ownership with the Securities and Exchange Commission
and the New York Stock Exchange, Inc., and to furnish the Company with copies of all such forms
they file. The Company understands from the information provided to it by insiders that they adhered
to all filing requirements applicable to section 16 filers in 2014.
22
PART II
ITEM 5. Market for Registrant’s Common Stock and Related Stockholder Matters and Issuer
Purchases of Equity Securities
The Company’s Common Stock is traded on the New York Stock Exchange (ticker symbol MYE).
The approximate number of shareholders of record at December 31, 2014 was 1,225. High and low
stock prices and dividends for the last two years were:
2014
Quarter Ended
Sales Price
High
Low
March 31 . . . . . . . . . . . . . . . . . . . . . . . . . . . . . . . . . . . . . . . . . . .
June 30 . . . . . . . . . . . . . . . . . . . . . . . . . . . . . . . . . . . . . . . . . . . .
September 30 . . . . . . . . . . . . . . . . . . . . . . . . . . . . . . . . . . . . . . .
December 31 . . . . . . . . . . . . . . . . . . . . . . . . . . . . . . . . . . . . . . .
2013
Quarter Ended
$21.50
24.32
20.23
17.93
Dividends
$18.87
18.67
17.63
14.33
Sales Price
High
Low
March 31 . . . . . . . . . . . . . . . . . . . . . . . . . . . . . . . . . . . . . . . . . . .
June 30 . . . . . . . . . . . . . . . . . . . . . . . . . . . . . . . . . . . . . . . . . . . .
September 30 . . . . . . . . . . . . . . . . . . . . . . . . . . . . . . . . . . . . . . .
December 31 . . . . . . . . . . . . . . . . . . . . . . . . . . . . . . . . . . . . . . .
$15.33
15.64
20.34
21.59
$0.13
0.13
0.13
0.13
Dividends
$13.47
12.85
15.73
17.46
$0.09
0.09
0.09
0.09
Purchases of equity securities by the issuer
The following table presents information regarding the Company’s stock purchase plan during
the three months ended December 31, 2014.
Total Number of
Maximum number
Shares Purchased as of Shares that may
Average Price Part of the Publicly
yet be Purchased
Total Number of
Paid
Announced Plans or Under the Plans or
Shares Purchased
per Share
Programs
Programs (1)
10/1/14 to 10/31/14 . . . .
11/1/14 to 11/30/14 . . . .
12/1/14 to 12/31/14 . . . .
80,000
190,000
140,000
$16.45
15.54
16.52
3,225,286
3,415,286
3,555,286
4,774,714
4,584,714
4,444,714
(1) On July 11, 2013, the Company authorized the repurchase of up to an additional five million
shares of its common stock. This authorization was in addition to the Board authorized
repurchase of up to five million shares that was announced on May 2, 2011. On February 20,
2014, the Company’s Board of Directors authorized $40 million of common stock repurchases to
be completed in 2014. The Company previously completed the repurchase of approximately five
hundred thirty five thousand shares in April 2013, and two million shares in 2011 pursuant to Rule
10b5-1 plans, which were adopted pursuant to the 2011 authorized share repurchase dated
June 1, 2011.
23
See Item 12 of this Form 10-K for the Equity Compensation Plan Information Table which is
incorporated herein by reference.
Comparison of 5 Year Cumulative Total Return
Assumes Initial Investment of $100
December 2014
$300
Myers Industries Inc.
S&P 500 Index - Total Return
$250
S&P 600 Index - Total Return
$200
$150
$100
$50
$0
2009
2010
2011
2012
2009
Myers Industries
Inc.
S&P 500 Index —
Total Return
S&P 600 Index —
Total Return
Annual Return %
Cum $
100.00
Annual Return %
Cum $
100.00
Annual Return %
Cum $
100.00
2013
2014
2010
2011
2012
2013
2014
10.64
110.64
15.06
115.06
26.31
126.31
30.16
144.01
2.11
117.49
1.02
127.59
25.42
180.61
16.00
136.30
14.08
145.56
42.35
257.11
32.39
180.44
41.31
205.70
(14.36)
220.18
13.69
205.14
5.76
217.53
24
ITEM 6. Selected Financial Data
Thousands of Dollars, Except Per Share Data
Operations for the Year(1)
Net sales . . . . . . . . . . . . . . . . . . . . . . .
Cost of sales . . . . . . . . . . . . . . . . . .
Selling expenses . . . . . . . . . . . . . . .
General and administrative
expenses . . . . . . . . . . . . . . . . . . .
Impairment charges(2) . . . . . . . . . .
Other income(3) . . . . . . . . . . . . . . .
Interest — net . . . . . . . . . . . . . . . . .
Total costs and expenses . . . . . . . . .
Income from continuing operations
before income taxes . . . . . . . . . . . .
Income tax expense . . . . . . . . . . . . . .
Net income from continuing
operations . . . . . . . . . . . . . . . . . . . .
Income (loss) from discontinued
operations, net of tax . . . . . . . . . . .
Net income (loss) . . . . . . . . . . . . . . . .
$
2014
2013
2012
2011
2010
623,649 $
462,370
60,261
584,733 $
415,179
55,398
545,572 $
381,673
51,227
507,947 $
361,595
46,119
481,384
359,721
41,328
78,400
—
—
8,535
609,566
69,840
—
—
4,531
544,948
66,146
—
—
4,330
503,376
66,384
997
—
4,573
479,668
53,971
—
(3,827)
7,192
458,385
14,083
5,122
39,785
13,343
42,196
15,689
28,279
6,421
22,999
3,690
$
8,961 $
26,442 $
26,507 $
21,858 $
19,309
$
$
(17,642) $
(8,681) $
(440) $
26,002 $
3,455 $
29,962 $
2,647 $
24,505 $
(62,143)
(42,834)
Net income per basic share from
continuing operations . . . . . . . . . . . $
0.28 $
0.78 $
0.79 $
0.63 $
0.55
Net income per diluted share from
continuing operations . . . . . . . . . . . $
0.27 $
0.77 $
0.78 $
0.63 $
0.55
Net income (loss) per basic share
from discontinued operations . . . . $
(0.55) $
(0.01) $
0.10 $
0.08 $
(1.76)
Net income (loss) per diluted share
from discontinued operations . . . . $
(0.54) $
(0.01) $
0.10 $
0.08 $
(1.76)
Net income (loss) per basic share . . $
(0.27) $
0.77 $
0.89 $
0.71 $
(1.21)
Net income (loss) per diluted share . . . $
(0.27) $
0.76 $
0.88 $
0.71 $
(1.21)
564,833 $
285,441
153,814
131,627
142,626
469,457 $
234,910
150,583
84,327
136,097
484,856 $
239,596
114,477
125,119
151,432
428,757 $
218,452
110,656
107,796
131,346
432,395
213,847
106,331
107,516
137,122
98,450
93,828
78,959
81,426
Financial Position — At Year End
Total assets . . . . . . . . . . . . . . . . . . .
Current assets . . . . . . . . . . . . . . . . .
Current liabilities . . . . . . . . . . . . . . .
Working capital . . . . . . . . . . . . . . . .
Other assets . . . . . . . . . . . . . . . . . . .
Property, plant and equipment —
net . . . . . . . . . . . . . . . . . . . . . . . . .
Less:
Long-term debt, less current
portion . . . . . . . . . . . . . . . . . . . .
Other long term liabilities . . . . . .
Deferred income taxes . . . . . . . .
Shareholders’ Equity . . . . . . . . . . . . . .
Common Shares Outstanding . . . . . .
Book Value Per Common Share . . . .
Other Data
Dividends paid(4) . . . . . . . . . . . . . .
Dividends declared per Common
Share . . . . . . . . . . . . . . . . . . . . . .
Average Basic Common Shares
Outstanding during the year . . . .
$
136,766
236,429
44,347
90,497
67,800
82,300
13,738
22,512
29,155
28,416
12,129
14,281
16,508
20,705
15,745
19,830
146,571
235,507
230,022
206,140
211,805
31,162,962 33,572,778 33,480,189 33,420,488 35,315,732
$
4.70 $
7.01 $
6.87 $
6.17 $
6.00
$
15,707 $
9,103 $
13,006 $
9,523 $
9,209
$
0.52 $
0.36 $
0.32 $
0.28 $
0.26
33,232,965
25
33,588,720
33,597,020
34,584,558
35,304,817
(1) Historical information has been adjusted to reflect discontinued operations presentation. See
Note 4 to the consolidated financial statements
(2) In 2011, the Company recorded $0.9 million of impairment charges for long-lived assets related
to the Material Handling Segment.
(3) In 2010, the Company recorded a non-operating gain of $3.8 million ($4.4 million, net of related
expenses) related to a favorable claims settlement.
(4) Dividends in 2012 reflect the fourth quarter dividend paid in 2012, for a total of five dividend
payments in calendar year 2012.
26
ITEM 7. Management’s Discussion and Analysis of Results of Operations and Financial
Condition
Executive Overview
The Company conducts its business activities in two distinct segments: The Material Handling
Segment and the Distribution Segment. The Lawn and Garden business is classified as discontinued
operations and all historical information has been adjusted to reflect the discontinued operations
presentation.
The Company designs, manufactures, and markets a variety of plastic and rubber products.
These products range from plastic reusable material handling containers and small parts storage bins
to plastic and rubber OEM parts, tire repair materials, custom plastic and rubber products, consumer
fuel containers, military water containers as well as ammunition packaging and shipping containers.
Our Distribution Segment is engaged in the distribution of tools, equipment and supplies used for tire,
wheel and under vehicle service on passenger, heavy truck and off-road vehicles, as well as the
manufacturing of tire repair and retreading products.
Results of Operations: 2014 versus 2013
Net Sales:
(dollars in millions)
Segment
2014
2013
Change
% Change
Material Handling . . . . . . . . . . . . . . . . . . . . . . . . . . .
Distribution . . . . . . . . . . . . . . . . . . . . . . . . . . . . . . . . .
Intra-segment elimination . . . . . . . . . . . . . . . . . . . . .
$432.1
191.9
(0.4)
$380.6
204.5
(0.4)
$ 51.5
(12.6)
—
14%
(6)%
—%
TOTAL . . . . . . . . . . . . . . . . . . . . . . . . . . . . . . . . . . . .
$623.6
$584.7
$ 38.9
7%
Net sales for 2014 were $623.6 million, an increase of $38.9 million or 7% compared to the prior
year. Net sales increased $39.4 million due to the inclusion of Scepter Corporation Group (“Scepter”)
acquired July 2, 2014. The increase in net sales also included $12.7 million of improved pricing to
mitigate higher resin prices during the year. The increase in net sales was partially offset by lower
sales volumes of $6.8 million and unfavorable foreign currency translation of $6.4 million.
Net sales in the Material Handling Segment increased $51.5 million or 14% in 2014 compared to
2013. The increase in net sales was mainly attributable to the inclusion of $39.4 million of net sales
from the date of acquisition of Scepter that was completed July 2, 2014. Also contributing to the
increase in net sales was improved pricing of $12.6 million to offset raw material costs, and higher
volume of $5.9 million, driven by strong sales in the industrial, marine and recreational vehicle end
markets. The increase in net sales was partially offset by unfavorable foreign currency translation of
$6.4 million.
Net sales in the Distribution Segment decreased $12.6 million in 2014 compared to 2013. The
decrease in net sales was attributable to a decline in custom sales and the result of the closure of our
Canadian branches in the first quarter of 2014.
Cost of Sales & Gross Profit:
(dollars in millions)
Cost of Sales and Gross Profit
2014
Cost of sales . . . . . . . . . . . . . . . . . . . . . . . . . . . . . . . . . . . . . . . . . . . . . . . . . .
Gross profit . . . . . . . . . . . . . . . . . . . . . . . . . . . . . . . . . . . . . . . . . . . . . . . . . . .
Gross profit as a percentage of sales . . . . . . . . . . . . . . . . . . . . . . . . . . . . . .
27
2013
$462.4 $415.2
$161.3 $169.6
25.9%
29.0%
Gross profit declined $8.3 million in 2014 compared to 2013 despite an increase in sales. Gross
profit margin as a percentage of sales decreased to 25.9% for 2014 compared to 29.0% in the prior
year. A weakened demand for our Material Handling Segment’s agricultural and food processing
products, along with a challenging Brazilian economy, lowered profitability versus the prior year.
Higher raw material costs during the year compared to the prior year also negatively impacted gross
profit. Raw material costs, primarily plastic resins, polypropylene and polyethylene, were on average,
approximately 9% higher in 2014 as compared to the prior year. Also contributing to the reduction in
gross margin was a $2.3 million inventory fair value adjustment resulting from our acquisition of
Scepter and approximately $1.0 million of restructuring and other unusual charges in 2014, as
compared to $0.2 million in 2013.
Selling, General and Administrative Expenses:
(dollars in millions)
SG&A Expenses
2014
SG&A expenses . . . . . . . . . . . . . . . . . . . . . . . . . . . .
SG&A expenses as a percentage of sales . . . . . . .
2013
Change
$138.7 $125.2
$13.5
22.2%
21.4%
% Change
11%
Selling, general and administrative (“SG&A”) expenses increased $13.5 million or 11% from
2013. The inclusion of the Scepter acquisition contributed $11.1 million of incremental SG&A costs in
2014 compared to the prior year. The increase in SG&A expenses in 2014 also included the
establishment of a reserve related to a patent infringement legal suit of $3.0 million and approximately
$3.6 million of transaction costs related to the acquisition of Scepter. SG&A expenses were reduced
by a decrease in employee related costs of $2.8 million, lower outside legal and professional costs of
approximately $2.0 million, and lower administrative costs related to facilities of approximately $0.9
million. Also in 2014, a favorable adjustment of $1.2 million was recorded to reduce contingent
consideration recorded in a prior period due to a change in projections used to estimate expected
payments at December 31, 2014. In addition, higher freight costs of $0.8 million were incurred during
2014 as compared to 2013. SG&A expenses for 2014 included restructuring and other unusual
charges of approximately $2.2 million compared to $0.4 million in the prior year. Shipping and
handling costs, including freight, are primarily classified as SG&A expenses.
Interest Expense:
(dollars in millions)
Net Interest Expense
2014
Net interest expense . . . . . . . . . . . . . . . . . . . . . . . . . .
Outstanding borrowings, net of deferred financing
costs . . . . . . . . . . . . . . . . . . . . . . . . . . . . . . . . . . . . .
Average borrowing rate . . . . . . . . . . . . . . . . . . . . . . .
$
8.5
2013
$ 4.5
Change
$
% Change
4.0
89%
$236.4 $44.3 $192.1
4.00% 4.92%
434%
Net interest expense was $8.5 million in 2014 compared to $4.5 million in 2013. The increase in
net interest expense is due to the higher average debt balance. The increase in outstanding
borrowings in 2014 compared to the prior year related to our senior unsecured notes and higher
balance outstanding under our credit facility as a result of our Scepter acquisition in July 2014.
Income Taxes:
(dollars in millions)
Income Taxes
2014
Income from continuing operations before income taxes . . . . . . . . . . . . . . . .
Income tax expense . . . . . . . . . . . . . . . . . . . . . . . . . . . . . . . . . . . . . . . . . . . . . .
Effective tax rate . . . . . . . . . . . . . . . . . . . . . . . . . . . . . . . . . . . . . . . . . . . . . . . . .
28
2013
$14.1 $39.8
$ 5.1 $13.3
36.4% 33.5%
The 2014 effective tax rate of 36.4% compared to 33.5% in 2013. The 2014 effective tax rate of
36.4% reflects a $1.8 million reduction in net state and local income taxes, offset by the inability to
benefit from losses in Brazil, an increase of $0.6 million in non-deductible acquisition and a $0.9
million increase in compensation costs. The 2013 effective tax rate reflects approximately $1.2 million
of tax benefits from the domestic production deduction.
Discontinued Operations:
Loss from discontinued operations, net of income taxes was $17.6 million for the year ended
December 31, 2014 compared to a loss from discontinued operations of $0.4 million in the prior
period, primarily as a result of an $18.9 million impairment charge. Discontinued operations are
comprised of the Lawn and Garden business and WEK Industries, Inc. (“WEK”). We completed the
sale of WEK in June 2014. The Lawn and Garden business was held for sale at December 31, 2014.
Net sales from discontinued operations decreased $35.8 million or 14.9% for the year ended
December 31, 2014 compared to the prior year. The decrease in net sales was due to lower sales
volume of $37.8 million attributable to the sale of WEK on June 20, 2014, poor weather conditions,
transportation issues, operational start-up issues related to our rationalization plan and the negative
impact from the effect of unfavorable currency translation of $2.3 million. The decrease in net sales
was partially offset by improved pricing of $4.3 million to help mitigate higher raw material costs.
Higher restructuring and other related charges of $11.1 million for the year ended December 31,
2014 compared to $9.3 million in the comparable prior period negatively impacted results. The asset
impairment charge of $18.9 million was recorded to reflect the excess carrying value over fair value
less cost to sell the Lawn and Garden business.
Gain on sale of discontinued operations was $4.6 million, net of tax of $1.6 million, resulting in an
after tax gain of $3.0 million related to the sale of WEK on June 20, 2014.
Results of Operations: 2013 versus 2012
Net Sales:
(dollars in millions)
Segment
2013
2012
Change
% Change
Material Handling . . . . . . . . . . . . . . . . . . . . . . . . . . .
Distribution . . . . . . . . . . . . . . . . . . . . . . . . . . . . . . . . .
Intra-segment elimination . . . . . . . . . . . . . . . . . . . . .
$380.6
204.5
(0.4)
$337.5
208.6
(0.5)
$43.1
(4.1)
0.1
13%
(2)%
20%
TOTAL . . . . . . . . . . . . . . . . . . . . . . . . . . . . . . . . . . . .
$584.7
$545.6
$39.1
7%
Net sales for 2013 were $584.7 million, an increase of $39.1 million or 7% compared to the prior
year. Net sales increased $33.1 million due to the acquisition sales of Plasticos Novel do Nordeste S.
A. (“Novel”) and Jamco Products Inc. (“Jamco”) which were acquired in 2012, along with $4.6 million
of improved pricing and approximately $5.1 million in higher sales volumes. The increase in net sales
was partially offset by unfavorable foreign currency translation of $3.7 million.
Net sales in the Material Handling Segment increased $43.1 million or 13% in 2013 compared to
2012. The net increase in sales was mainly attributable to the inclusion of $33.1 million of net sales
from the acquisition of Novel and Jamco which were completed in the second half of 2012. Also
contributing to the increase in net sales was improved pricing of approximately $4.5 million and
higher volume of approximately $9.0 million, driven by sales in the agricultural, distribution,
recreational vehicle and marine markets. The increase in net sales noted above was partially offset by
unfavorable currency translation of $3.5 million.
29
Net sales in the Distribution Segment decreased $4.1 million in 2013 compared to 2012. The
decrease in net sales was attributable to $3.9 million in lower sales volume, primarily in equipment
and from new product introductions. In addition, unfavorable currency translation of $0.2 million
negatively impacted net sales year over year.
Cost of Sales & Gross Profit:
(dollars in millions)
Cost of Sales and Gross Profit
2013
Cost of sales . . . . . . . . . . . . . . . . . . . . . . . . . . . . . . . . . . . . . . . . . . . . . . . . . .
Gross profit . . . . . . . . . . . . . . . . . . . . . . . . . . . . . . . . . . . . . . . . . . . . . . . . . . .
Gross profit as a percentage of sales . . . . . . . . . . . . . . . . . . . . . . . . . . . . . .
2012
$415.2 $381.7
$169.6 $163.9
29.0%
30.0%
Gross profit increased due to higher sales in 2013 versus 2012. Gross profit margin decreased
slightly to 29.0% for 2013 compared to 30.0% in the prior year, as productivity improvements in 2013
were offset by higher raw material costs compared to the prior year. Raw material costs, primarily for
plastic resins, were, on average, approximately 10% higher for polypropylene and polyethylene in
2013 compared to the prior year.
Selling, General and Administrative Expenses:
(dollars in millions)
SG&A Expenses
2013
SG&A expenses . . . . . . . . . . . . . . . . . . . . . . . . . . . .
SG&A expenses as a percentage of sales . . . . . . .
2012
$125.2 $117.4
21.4%
21.5%
Change
$7.8
% Change
7%
Selling, general and administrative (“SG&A”) expenses increased $7.8 million or 7% compared
with 2012. The inclusion of the Novel and Jamco acquisitions in the second half of 2012 contributed
$7.2 million of incremental SG&A costs in 2013 compared to the same period in the prior year. The
increase in SG&A expenses in 2013 also included higher consulting costs of approximately $2.4
million, primarily related to our information technology initiatives. In addition, higher bad debt expense
in 2013 as compared to 2012 was attributable to the reversal of bad debt expense in 2012 of $1.4
million from the recovery of a bad debt established in the previous year. Also, SG&A expenses for
2013 included restructuring and other related charges of $0.4 million compared to $2.8 million for
severance, consulting and lease obligation costs for 2012. Gains on the sale of property sold in 2012
were $0.8 million. Shipping and handling costs, including freight, are primarily classified as SG&A
expenses.
Interest Expense:
(dollars in millions)
Net Interest Expense
Net interest expense . . . . . . . . . . . . . . . . . . . . . . . . . . .
Outstanding borrowings, net of deferred financing
costs . . . . . . . . . . . . . . . . . . . . . . . . . . . . . . . . . . . . . .
Average borrowing rate . . . . . . . . . . . . . . . . . . . . . . . .
2013
2012
Change
$ 4.5
$ 4.3
$ 0.2
$44.3 $90.5
$(46.2)
4.92% 4.91%
% Change
5%
(51)%
Net interest expense was $4.5 million in 2013 compared to $4.3 million in 2012. The weighted
average level of outstanding borrowings was approximately $44.3 million in 2013 compared to $90.5
million in 2012. The decrease in outstanding borrowings at December 31, 2013 compared to
December 31, 2012 was primarily due to the repayment of the $35 million Senior notes and net
repayment on the credit facility during 2013.
30
Income Taxes:
(dollars in millions)
Income Taxes
2013
Income from continuing operations before taxes . . . . . . . . . . . . . . . . . . . . . . .
Income tax expense . . . . . . . . . . . . . . . . . . . . . . . . . . . . . . . . . . . . . . . . . . . . . .
Effective tax rate . . . . . . . . . . . . . . . . . . . . . . . . . . . . . . . . . . . . . . . . . . . . . . . . .
2012
$39.8 $42.2
$13.3 $15.7
33.5% 37.2%
The 2013 effective tax rate of 33.5% reflects a $0.8 million reduction in net state and local income
taxes and a $0.3 million increase in foreign tax incentives. The 2012 effective tax rate reflects
approximately $0.4 million of tax benefits from changes in unrecognized tax benefits.
Discontinued Operations:
Loss from discontinued operations, net of income taxes was $0.4 million for the year ended
December 31, 2013 compared to income from discontinued operations of $3.4 million in the prior
year. Discontinued operations are comprised of the Lawn and Garden business and WEK. WEK and
the Lawn and Garden business were both held for sale at December 31, 2013.
Net sales from discontinued operations decreased $5.1 million or 2.1% for the year ended
December 31, 2013 compared to 2012. The decrease in net sales was due to lower sales volume of
$9.9 million due to timing of customer orders for the coming season, as well as production and
distribution start-up issues, primarily in the fourth quarter of 2013 from our business rationalization
plan. Net sales were also negatively impacted from the effect of unfavorable currency translation of
$3.2 million. The decrease in net sales was partially offset by improved pricing of $8.0 million to help
mitigate higher raw material costs.
Higher restructuring and other related charges of $9.3 million for the year ended December 31,
2013 compared to $0.1 million in the prior year, which negatively impacted results.
Acquisitions
On July 2, 2014, CA Acquisition Inc., now known as Scepter Canada Inc., and a wholly-owned
subsidiary of Myers Industries, Inc., completed the purchase of substantially all of the assets and
assumption of certain liabilities of Scepter Corporation and certain real property of SHI Properties Inc.,
both located in Scarborough, Ontario, Canada. Contemporaneously with the asset acquisition, Crown
US Acquisition Company, now known as Scepter US Holding Company, and another wholly-owned
subsidiary of Myers Industries, Inc., completed the purchase of all of the issued and outstanding
membership interests of Eco One Leasing, LLC and Scepter Manufacturing, LLC, both located in
Miami, Oklahoma. Eco One Leasing, LLC was subsequently merged into Scepter Manufacturing,
LLC. The total purchase price for these acquisitions (collectively, “Scepter”) was $156.6 million in
cash, which includes a final working capital adjustment. The acquisition of Scepter was funded from
net proceeds from additional borrowings of approximately $134.1 million under the Fourth Amended
and Restated Loan Agreement and cash on hand of $22.5 million.
In October 2012, the Company acquired 100% of the stock of Jamco, an Illinois corporation for
$15.2 million. The purchase price included a cash payment of $15.1 million, net of $0.1 million in cash
acquired. Jamco is a leading designer and manufacturer of heavy-duty industrial steel carts and
safety cabinets. The Company has made preliminary estimates of the valuation of assets and
intangible assets of purchase price allocation. The business is included in the Material Handling
Segment.
31
In July 2012, the Company acquired 100% of the stock of Novel, a Brazil-based designer and
manufacturer of reusable plastic crates and containers used for closed-loop shipping and storage.
Novel also produces a diverse range of plastic industrial safety products. The total purchase price
was approximately $30.9 million, which includes a cash payment of $3.4 million, net of $0.6 million of
cash acquired, assumed debt of approximately $26.0 million and contingent consideration of $0.9
million based on an earnout. The contingent consideration, which is recorded in Other Liabilities in the
Consolidated Statements of Financial Position is dependent upon the results of Novel exceeding
predefined earnings before interest, taxes, depreciation and amortization over the next four years.
The business is included in the Material Handling Segment.
Financial Condition & Liquidity and Capital Resources
Cash provided by operating activities from continuing operations was $51.7 million for the year
ended December 31, 2014 compared to $74.9 million in 2013. The decrease of $23.2 million was
attributable to decreased earnings, higher working capital and higher non-cash charges in 2014
compared to the prior year. Net income from continuing operations was $9.0 million in 2014
compared to $26.4 million in 2013. Non-cash charges including depreciation and amortization were
$31.8 million in 2014 compared to non-cash charges of $23.2 million in 2013.
Cash provided by working capital was $12.2 million in 2014 compared to cash provided of $27.0
million in 2013. In 2014, cash provided by inventories was approximately $2.4 million compared to
$3.0 million in 2013. In 2014, the source of funds for accounts receivable was $2.7 million compared
to the use of $2.0 million in 2013. In addition, as a result of timing of payments and extending vendor
terms on accounts payable, positive cash flow was realized in both 2014 and 2013.
Capital expenditures were $24.2 million in 2014 compared to $20.7 million in 2013. Capital
spending in 2014 was higher than the preceding year as investments were made for new
manufacturing focused on growth and productivity improvements in addition to higher spending due
to Scepter. In 2014, the Company paid approximately $156.6 million in connection with the acquisition
of Scepter which is included in the Material Handling Segment. In 2013, the Company purchased an
equity interest in a non-consolidated subsidiary, included in the Distribution segment, for
approximately $0.6 million. In 2012, the Company paid a combined total of $18.5 million in connection
with the acquisitions of Novel and Jamco. The Company received approximately $0.6 million and $3.1
million in cash proceeds from the sale of certain property, plant & equipment in 2014 and 2012,
respectively.
During 2014, the Company used cash of $54.9 million to purchase 2,742,506 shares of its own
stock under a share repurchase plan compared to $8.1 million to purchase 530,983 shares of its own
stock in 2013. In addition, the Company used cash to pay dividends of $15.7 million and $9.1 million
for the years 2014 and 2013, respectively. Lower dividend payments in 2013 resulted from the
accelerated fourth quarter dividend payment made in December 2012 to reduce the tax impact for
our shareholders in 2013.
On December 13, 2013, the Company entered into a Fourth Amended and Restated Loan
Agreement (the “Loan Agreement”). The agreement provided for a $200 million senior revolving credit
facility expiring on December 13, 2018, which replaced the existing $180 million facility.
In addition, on May 30, 2014, the Company entered into a First Amendment to the Fourth
Amended and Restated Loan Agreement (the “Loan Amendment”). The Loan Amendment increased
the senior revolving credit facility from $200 million to $300 million through December 2018 and
provided for an additional subsidiary of the Company as a borrower and another subsidiary of the
Company as a guarantor of the credit facility. On July 2, 2014, the Company borrowed approximately
32
$135.3 million under the Loan Agreement to fund the acquisition of Scepter. Amounts borrowed under
the agreement are secured by pledges of stock of certain of our foreign and domestic subsidiaries.
Borrowings under the Loan Agreement bear interest at the LIBOR rate, prime rate, federal funds
effective rate, the Canadian deposit offered rate, or the eurocurrency reference rate depending on the
type of loan requested by the Company, in each case plus the applicable margin as set forth in the
Loan Agreement.
On October 22, 2013, the Company entered into a note purchase agreement for the private
placement of Senior Unsecured Notes totaling $100 million with a group of investors. The series of four
notes range in face value from $11 million to $40 million, with interest rates ranging from 4.67% to
5.45%, payable semiannually, and expiring between 2021 and 2026. At December 31, 2013, the
Company had $11 million of its 5.25% Senior Unsecured Notes due January 15, 2024 outstanding under
the note purchase agreement. Remaining proceeds of $89 million under the note purchase agreement
were subsequently received in January 2014. At December 31, 2014, $100 million was outstanding.
Total debt outstanding at December 31, 2014 was $236.4 million, net of deferred financing costs,
compared with $44.3 million at December 31, 2013. The increase in debt outstanding year-over-year
is mainly due to cash proceeds of $89.0 million from our senior unsecured notes and the net
additional borrowings under our amended Loan Agreement, primarily to fund the acquisition of
Scepter in July 2014. The Company’s Loan Agreement provides available borrowing up to $300
million, reduced for letters of credit issued. As of December 31, 2014, the Company had $4.3 million
of letters of credit issued related to insurance and other financing contracts in the ordinary course of
business. As of December 31, 2014, there was $158.6 million available under our Loan Agreement.
As of December 31, 2014, the Company was in compliance with all its debt covenants. The most
restrictive financial covenants for all of the Company’s debt are an interest coverage ratio, defined as
earnings before interest and taxes divided by interest expense, and a leverage ratio, defined as
earnings before interest, taxes, depreciation and amortization, as adjusted, compared to total debt.
The ratios as of and for the period ended December 31, 2014 are shown in the following table:
Required Level
Interest Coverage Ratio . . . . . . . . . . . . . . . . . . . . . . . .
Leverage Ratio . . . . . . . . . . . . . . . . . . . . . . . . . . . . . . .
3.00 to 1 (minimum)
3.25 to 1 (maximum)
Actual Level
10.14
2.78
The Company believes that cash flows from operations and available borrowing under its Loan
Agreement will be sufficient to meet expected business requirements including capital expenditures,
dividends, working capital, debt service and to fund the stock repurchase program into the
foreseeable future.
Contractual Obligations
The following summarizes the Company’s estimated future cash outflows from financial contracts
and commitments reflecting our current debt structure:
Less than
1 Year
2-3
4-5
Years
Years
Thereafter
(Amounts in Thousands)
Total
Principal payments on debt . . . . . . . . . . . . . . .
Interest . . . . . . . . . . . . . . . . . . . . . . . . . . . . . . . .
Lease payments . . . . . . . . . . . . . . . . . . . . . . . . .
Retirement obligations and other benefits . . . .
$
—
5,827
4,861
577
$
— $137,109 $100,000 $237,109
11,655
11,655
22,147
51,284
5,864
317
3,958
15,000
1,022
873
2,296
4,768
Total . . . . . . . . . . . . . . . . . . . . . . . . . . . . . . . . . . .
$11,265
$18,541 $149,954 $128,401 $308,161
33
Uncertain tax position liabilities are excluded from the contractual obligations table because a
reasonably reliable estimate of the period of cash settlement with the respective tax authority cannot
be made.
Item 7A. Quantitative and Qualitative Disclosures About Market Risk
Market Risk and Derivative Financial Instruments
The Company has certain financing arrangements that require interest payments based on
floating interest rates. The Company’s financial results are subject to changes in the market rate of
interest. At present, the Company has not entered into any interest rate swaps or other derivative
instruments to fix the interest rate on any portion of its financing arrangements with floating rates.
Accordingly, based on current debt levels at December 31, 2014, if market interest rates increase one
percent, the Company’s interest expense would increase approximately $1.3 million annually.
Some of the Company’s subsidiaries operate in foreign countries and their financial results are
subject to exchange rate movements. The Company has operations in Canada with foreign currency
exposure, primarily due to sales made from businesses in Canada to customers in the United States
(“U.S.”). These sales are denominated in U.S. dollars. In addition, the Company’s subsidiary in Brazil
has loans denominated in U.S. dollars. The Company has a systematic program to limit its exposure
to fluctuations in exchange rates related to certain assets and liabilities of its operations in Canada
and Brazil that are denominated in U.S. dollars. The net exposure generally ranges from $2 to $5
million. The foreign currency contracts and arrangements created under this program are not
designated as hedged items under Financial Accounting Standards Board (“FASB”) Accounting
Standard Codification (“ASC”) 815, Derivatives and Hedging, and accordingly, the changes in the fair
value of the foreign currency arrangements, which have been immaterial, are recorded in the income
statement. The Company’s foreign currency arrangements are typically three months or less and are
settled before the ending of a reporting period. At December 31, 2014, the Company had no foreign
currency arrangements or contracts in place.
The Company uses certain commodities, primarily plastic resins, in its manufacturing processes.
The cost of operations can be affected as the market for these commodities changes. The Company
currently has no derivative contracts to hedge this risk; however, the Company also has no significant
purchase obligations to purchase fixed quantities of such commodities in future periods. Significant
future increases in the cost of plastic resin or other adverse changes in the general economic
environment could have a material adverse impact on the Company’s financial position, results of
operations or cash flows.
Critical Accounting Policies
Our discussion and analysis of the Company’s financial condition and results of operations are
based on the accompanying consolidated financial statements, which are prepared in accordance
with accounting principles generally accepted in the United States of America. As indicated in the
Summary of Significant Accounting Policies included in the Notes to Consolidated Financial
Statements (included in Item 8 of this report), the amount of assets, liabilities, revenue and expenses
reported are affected by estimates and judgments that are necessary to comply with generally
accepted accounting principles. We base our estimates on prior experience and other assumptions
that we consider reasonable to our circumstances. We believe the following matters may involve a
high degree of judgment and complexity.
Bad Debts — The Company evaluates the collectability of accounts receivable based on a
combination of factors. In circumstances where the Company is aware of a specific customer’s
34
inability to meet its financial obligations, a specific allowance for doubtful accounts is recorded
against amounts due to reduce the net recognized receivable to the amount the Company reasonably
believes will be collected. Additionally, the Company also reviews historical trends for collectability in
determining an estimate for its allowance for doubtful accounts. If economic circumstances change
substantially, estimates of the recoverability of amounts due the Company could be reduced by a
material amount.
Inventory — Inventories are valued at the lower of cost or market. Cost is determined by the lastin, first-out (“LIFO”) method for approximately 30 percent of the Company’s inventories and the first-in,
first-out (“FIFO”) method for all other inventories. Where appropriate, standard cost systems are
utilized and appropriate variances are evaluated for purposes of determining cost; the standards are
adjusted as necessary to ensure they approximate actual costs. Estimates of lower of cost or market
value of inventory are determined based upon current economic conditions, historical sales quantities
and patterns and, in some cases, the specific risk of loss on specifically identified inventories.
Goodwill — Goodwill is subjected to annual impairment testing, unless significant changes in
circumstances indicate a potential impairment may have occurred sooner. We conduct our annual
impairment assessment as of October 1. We first perform a qualitative assessment to determine
whether it is more likely than not that the fair value of a reporting unit is less than its carrying value. If
we conclude that this is the case, we perform the two-step test. Otherwise, we do not perform the test.
Goodwill impairment testing requires, in part, that we estimate the fair value of our reporting units
which, in turn, requires that we make judgments concerning future cash flows and appropriate
discount rates for those reporting units. Fair values are established using comparative market
multiples in the current market conditions and discounted cash flows. The discount rates used are
based on the weighted average cost of capital determined for each of the Company’s reporting units
and ranged from 10% to 13% in 2014. In addition we would make certain judgments about the
selection of comparable companies used in determining market multiples in valuing our business
units. We also compare our book value and the estimates of fair value of the reporting units to our
market capitalization as of and at dates near the annual testing date. Management uses this
comparison as additional evidence of the fair value of the Company, as our market capitalization may
be suppressed by other factors such as the control premium associated with a controlling
shareholder, our leverage or general expectations regarding future operating results and cash flows.
In situations where the implied value of the Company under the Income or Market Approach are
significantly different than our market capitalization we re-evaluate and adjust, if necessary, the
assumptions underlying our Income and Market Approach models.
Based on procedures conducted to test impairment of goodwill of the Company’s reporting units,
Plasticos Novel do Nordeste S. A. (“Novel”) and Jamco Products, Inc. (“Jamco”) did not substantially
exceed their carrying value as of our assessment date in 2014. The estimated fair value of Novel and
Jamco exceeded their carrying values by approximately 10% and 20%, respectively. Although no
goodwill impairment charge is required for 2014, it does present a risk of future impairment for the
goodwill assigned to those reporting units. The decline in the fair values of these businesses was
driven primarily by reduced profitability as a result of lower margins due to higher costs, principally in
raw materials and a prolonged economic downturn in the Brazilian economy impacting Novel. As a
result, management decreased future projections of the operating results and cash flows in assessing
goodwill at these reporting units. During the annual review of goodwill, management proceeded
directly to the two-step test for Novel and Jamco. The Company is making necessary changes in
operations to improve profitability in these businesses. If expected future forecasted results for these
businesses are not achieved it may result in the Company recording impairment charges for these
reporting units in future periods.
35
Contingencies — In the ordinary course of business, we are involved in various legal
proceedings and contingencies. We have recorded liabilities for these matters in accordance with
FASB ASC 450, Contingencies (“ASC 450”). ASC 450 requires a liability to be recorded based on our
estimate of the probable cost of the resolution of a contingency. When management believes that a
loss arising from these matters is probable and can reasonably be estimated, we record the amount
of the estimated loss, or the minimum estimated liability when the loss is estimated using a range, and
no point within the range is more probable of occurrence than another. As additional information
becomes available, any potential liability related to these matters will be assessed and the estimates
will be revised, if necessary. The actual resolution of these contingencies may differ from our
estimates. If a contingency were settled for an amount greater than our estimate, a future charge to
income would result. Likewise, if a contingency were settled for an amount that is less than our
estimate, a future credit to income would result.
Revenue Recognition — We recognize revenues from the sale of products, net of actual and
estimated returns, at the point of passage of title and risk of loss, which is generally at time of
shipment, and collectability of the fixed or determinable sales price is reasonably assured.
Income Taxes — Deferred income taxes are provided to recognize the effect of temporary
differences between financial and tax reporting. Deferred income taxes are not provided for
undistributed earnings of foreign consolidated subsidiaries as it is our intention to reinvest such
earnings for an indefinite period of time. The Company has operations outside the U.S. and in
jurisdictions with statutory tax rates lower than in the U.S. As a result, significant tax and treasury
planning of future operations are necessary to determine the proper amounts of tax assets, liabilities
and expense to be recognized. FASB ASC 740, Income Taxes (“ASC 740”) requires that deferred tax
assets be reduced by a valuation allowance, if based on all available evidence, it is more likely than
not that the deferred tax asset will not be realized. The Company evaluates the recovery of its
deferred tax assets by assessing the adequacy of future expected taxable income from all sources,
including reversal of taxable temporary differences, forecasted operating earnings and available tax
planning strategies. These sources of income inherently rely heavily on estimates.
Also, significant judgment is required in determining the Company’s tax expense and in
evaluating its tax positions, including evaluating uncertainties under ASC 740. We review our tax
positions quarterly and adjust the balances as new information becomes available.
Recent Accounting Pronouncements Not Yet Adopted
In April 2014, the Financial Accounting Standards Board (“FASB”) issued Accounting Standards
Update (“ASU”) 2014-08, Reporting Discontinued Operations and Disclosures of Disposals of
Components of an Entity. This guidance states that the disposal of a component of an entity is to be
reported in discontinued operations only if the disposal represents a strategic shift that has (or will
have) a major effect on an entity’s operations and financial results. The pronouncement also requires
additional disclosures regarding individually significant disposals of components that do not meet the
criteria to be recognized as a discontinued operation as well as additional and expanded disclosures.
This ASU will be effective for the Company for applicable transactions occurring after January 1,
2015. We will prospectively apply the guidance to applicable transactions. The Lawn and Garden
transaction described in Note 4 of the Notes to the Consolidated Financial Statements in Item 8 is not
subject to this guidance.
In May 2014, the FASB issued ASU 2014-09, Revenue from Contracts with Customers, to clarify
the principles used to recognize revenue for all entities. Under ASU 2014-09, a company will
recognize revenue when it transfers promised goods or services to customers in an amount that
reflects the consideration to which the company expects to be entitled in exchange for those goods or
36
services. The new guidance is effective for the Company on January 1, 2017 with early adoption not
permitted. Entities can transition to the standard either retrospectively or as a cumulative effect
adjustment as of the adoption date. The Company is currently evaluating the impact the adoption of
this guidance will have on its consolidated financial statements as well as the method by which the
Company will adopt the new standard.
In August 2014, the FASB issued ASU 2014-15, Disclosure of Uncertainties About an Entity’s
Ability to Continue as a Going Concern. The new standard provides guidance on determining when
and how to disclose going-concern uncertainties in the financial statements. Under ASU 2014-15,
management will be required to perform interim and annual assessments of the Company’s ability to
continue as a going concern within one year of the date the financial statements are issued. ASU
2014-15 is effective for annual periods ending after December 15, 2016, and interim periods
thereafter, with early adoption permitted. The adoption of this standard is not expected to have an
impact on the Company’s financial statement disclosures.
37
ITEM 8. Financial Statements and Supplementary Data
Report of Independent Registered Public Accounting Firm
The Board of Directors and Shareholders
Myers Industries, Inc.
We have audited the accompanying consolidated statements of financial position of Myers
Industries, Inc. and Subsidiaries as of December 31, 2014 and 2013, and the related consolidated
statements of operations, comprehensive income (loss), shareholders’ equity and cash flows for each
of the three years in the period ended December 31, 2014. These financial statements are the
responsibility of the Company’s management. Our responsibility is to express an opinion on these
financial statements based on our audits.
We conducted our audits in accordance with the standards of the Public Company Accounting
Oversight Board (United States). Those standards require that we plan and perform the audit to
obtain reasonable assurance about whether the financial statements are free of material
misstatement. An audit includes examining, on a test basis, evidence supporting the amounts and
disclosures in the financial statements. An audit also includes assessing the accounting principles
used and significant estimates made by management, as well as evaluating the overall financial
statement presentation. We believe that our audits provide a reasonable basis for our opinion.
In our opinion, the financial statements referred to above present fairly, in all material respects,
the consolidated financial position of Myers Industries, Inc. and Subsidiaries at December 31, 2014
and 2013, and the consolidated results of their operations and their cash flows for each of the three
years in the period ended December 31, 2014, in conformity with U.S. generally accepted accounting
principles.
We also have audited, in accordance with the standards of the Public Company Accounting
Oversight Board (United States), Myers Industries, Inc. and Subsidiaries’ internal control over financial
reporting as of December 31, 2014, based on criteria established in Internal Control-Integrated
Framework issued by the Committee of Sponsoring Organizations of the Treadway Commission (1992
framework) and our report dated March 31, 2015 expressed an adverse opinion thereon.
/s/ ERNST & YOUNG LLP
Akron, Ohio
March 31, 2015
38
MYERS INDUSTRIES, INC. AND SUBSIDIARIES
Consolidated Statements of Operations
For the Years Ended December 31, 2014, 2013 and 2012
(Dollars in thousands, except share data)
2014
Net sales . . . . . . . . . . . . . . . . . . . . . . . . . . . . . . . . . . . . . . . . . . . . . . . .
Cost of sales . . . . . . . . . . . . . . . . . . . . . . . . . . . . . . . . . . . . . . . . . . . . .
Gross profit . . . . . . . . . . . . . . . . . . . . . . . . . . . . . . . . . . . . . . . . . . . . .
Selling expenses . . . . . . . . . . . . . . . . . . . . . . . . . . . . . . . . . . . . . . . . . .
General and administrative expenses . . . . . . . . . . . . . . . . . . . . . . . . .
2013
2012
$623,649 $584,733 $545,572
462,370
415,179
381,673
161,279
60,261
78,400
169,554
55,398
69,840
163,899
51,227
66,146
138,661
125,238
117,373
Operating income . . . . . . . . . . . . . . . . . . . . . . . . . . . . . . . . . . . . .
Interest
Income . . . . . . . . . . . . . . . . . . . . . . . . . . . . . . . . . . . . . . . . . . . . . . . .
Expense . . . . . . . . . . . . . . . . . . . . . . . . . . . . . . . . . . . . . . . . . . . . . . .
22,618
44,316
46,526
(127)
8,662
(213)
4,744
(164)
4,494
Interest expense, net . . . . . . . . . . . . . . . . . . . . . . . . . . . . . . . . . . . . . . .
8,535
4,531
4,330
Income from continuing operations before income taxes . . . . . . . . .
Income tax expense . . . . . . . . . . . . . . . . . . . . . . . . . . . . . . . . . . . . . . .
14,083
5,122
39,785
13,343
42,196
15,689
Net income from continuing operations . . . . . . . . . . . . . . . . . . . . . . . .
Income (loss) from discontinued operations, net of tax . . . . . . . . . . .
$ 8,961 $ 26,442 $ 26,507
$ (17,642) $
(440) $ 3,455
Net (loss) income . . . . . . . . . . . . . . . . . . . . . . . . . . . . . . . . . . . . . . . . . .
$ (8,681) $ 26,002 $ 29,962
Income per common share from continuing operations:
Basic . . . . . . . . . . . . . . . . . . . . . . . . . . . . . . . . . . . . . . . . . . . . . . . .
Diluted . . . . . . . . . . . . . . . . . . . . . . . . . . . . . . . . . . . . . . . . . . . . . . .
Income (loss) per common share from discontinued operations:
Basic . . . . . . . . . . . . . . . . . . . . . . . . . . . . . . . . . . . . . . . . . . . . . . . .
Diluted . . . . . . . . . . . . . . . . . . . . . . . . . . . . . . . . . . . . . . . . . . . . . . .
Net income (loss) per share:
Basic . . . . . . . . . . . . . . . . . . . . . . . . . . . . . . . . . . . . . . . . . . . . . . . .
Diluted . . . . . . . . . . . . . . . . . . . . . . . . . . . . . . . . . . . . . . . . . . . . . . .
Dividends declared per share . . . . . . . . . . . . . . . . . . . . . . . . . . . . . . .
$
$
0.28 $
0.27 $
0.78 $
0.77 $
0.79
0.78
$
$
(0.55) $
(0.54) $
(0.01) $
(0.01) $
0.10
0.10
$
$
$
(0.27) $
(0.27) $
0.52 $
0.77 $
0.76 $
0.36 $
0.89
0.88
0.32
The accompanying notes are an integral part of these statements.
39
MYERS INDUSTRIES, INC. AND SUBSIDIARIES
Consolidated Statements of Comprehensive Income (Loss)
For the Years Ended December 31, 2014, 2013 and 2012
(Dollars in thousands, except share data)
2014
Net income (loss) . . . . . . . . . . . . . . . . . . . . . . . . . . . . . . . . . . . . . . . . . . . .
Other comprehensive income (loss), net of tax:
Foreign currency translation adjustment . . . . . . . . . . . . . . . . . . . . . . .
Pension liability, net of tax (benefit) expense of ($448) in 2014, $605
in 2013 and $80 in 2012 . . . . . . . . . . . . . . . . . . . . . . . . . . . . . . . . . . .
Total other comprehensive income (loss), net of tax . . . . . . . . . . . . . . . .
Comprehensive income (loss) . . . . . . . . . . . . . . . . . . . . . . . . . . . . . . . . . .
2012
$ (8,681) $26,002 $29,962
(13,318)
(797)
(14,115)
(9,292)
1,076
(8,216)
2,791
558
3,349
$(22,796) $17,786 $33,311
The accompanying notes are an integral part of these statements.
40
2013
MYERS INDUSTRIES, INC. AND SUBSIDIARIES
Consolidated Statements of Financial Position
As of December 31, 2014 and 2013
(Dollars in thousands)
2014
Assets
Current Assets
Cash . . . . . . . . . . . . . . . . . . . . . . . . . . . . . . . . . . . . . . . . . . . . . . . . . . . . . . . . . . .
Accounts receivable-less allowances of $782 and $1,313, respectively . . . .
Inventories . . . . . . . . . . . . . . . . . . . . . . . . . . . . . . . . . . . . . . . . . . . . . . . . . . . . . .
Finished and in-process products . . . . . . . . . . . . . . . . . . . . . . . . . . . . . . . . .
Raw materials and supplies . . . . . . . . . . . . . . . . . . . . . . . . . . . . . . . . . . . . . .
$
2013
4,676 $ 6,539
90,664
74,932
40,122
23,216
34,337
18,786
63,338
6,591
2,397
117,775
53,123
5,492
2,064
92,760
285,441
234,910
66,639
72,235
—
3,752
51,075
14,255
67,808
2,959
142,626
136,097
8,405
57,537
335,963
3,082
48,159
294,537
Less allowances for depreciation and amortization . . . . . . . . . . . . . . . . . . . . .
401,905
(265,139)
345,778
(247,328)
Property, plant and equipment, net . . . . . . . . . . . . . . . . . . . . . . . . . . . . . . . . . .
136,766
98,450
Prepaid expenses . . . . . . . . . . . . . . . . . . . . . . . . . . . . . . . . . . . . . . . . . . . . . . . .
Deferred income taxes . . . . . . . . . . . . . . . . . . . . . . . . . . . . . . . . . . . . . . . . . . . .
Assets held for sale — current . . . . . . . . . . . . . . . . . . . . . . . . . . . . . . . . . . . . .
Total Current Assets . . . . . . . . . . . . . . . . . . . . . . . . . . . . . . . . . . . . . . . . . . . . . .
Other Assets
Goodwill . . . . . . . . . . . . . . . . . . . . . . . . . . . . . . . . . . . . . . . . . . . . . . . . . . . . . . . .
Patents and other intangible assets, net . . . . . . . . . . . . . . . . . . . . . . . . . . . . . .
Assets held for sale . . . . . . . . . . . . . . . . . . . . . . . . . . . . . . . . . . . . . . . . . . . . . .
Other . . . . . . . . . . . . . . . . . . . . . . . . . . . . . . . . . . . . . . . . . . . . . . . . . . . . . . . . . .
Property, Plant and Equipment, at Cost
Land . . . . . . . . . . . . . . . . . . . . . . . . . . . . . . . . . . . . . . . . . . . . . . . . . . . . . . . . . . .
Buildings and leasehold improvements . . . . . . . . . . . . . . . . . . . . . . . . . . . . . .
Machinery and equipment . . . . . . . . . . . . . . . . . . . . . . . . . . . . . . . . . . . . . . . . .
Total Assets . . . . . . . . . . . . . . . . . . . . . . . . . . . . . . . . . . . . . . . . . . . . . . . . . . . . .
$ 564,833 $ 469,457
The accompanying notes are an integral part of these statements.
41
MYERS INDUSTRIES, INC. AND SUBSIDIARIES
Consolidated Statements of Financial Position
As of December 31, 2014 and 2013
(Dollars in thousands, except share data)
2014
Liabilities and Shareholders’ Equity
Current Liabilities
Accounts payable . . . . . . . . . . . . . . . . . . . . . . . . . . . . . . . . . . . . . . . . . . . . . . . . .
Accrued expenses . . . . . . . . . . . . . . . . . . . . . . . . . . . . . . . . . . . . . . . . . . . . . . . .
Employee compensation . . . . . . . . . . . . . . . . . . . . . . . . . . . . . . . . . . . . . . . . .
Income taxes . . . . . . . . . . . . . . . . . . . . . . . . . . . . . . . . . . . . . . . . . . . . . . . . . . .
Taxes, other than income taxes . . . . . . . . . . . . . . . . . . . . . . . . . . . . . . . . . . . .
Accrued interest . . . . . . . . . . . . . . . . . . . . . . . . . . . . . . . . . . . . . . . . . . . . . . . .
Liabilities held for sale . . . . . . . . . . . . . . . . . . . . . . . . . . . . . . . . . . . . . . . . . . . .
Other . . . . . . . . . . . . . . . . . . . . . . . . . . . . . . . . . . . . . . . . . . . . . . . . . . . . . . . . . .
2013
$ 77,320 $ 68,897
14,967
3,086
1,940
3,207
27,122
26,172
17,413
5,519
2,173
103
40,044
16,434
Total Current Liabilities . . . . . . . . . . . . . . . . . . . . . . . . . . . . . . . . . . . . . . . . . . . . .
153,814
150,583
Long-term debt . . . . . . . . . . . . . . . . . . . . . . . . . . . . . . . . . . . . . . . . . . . . . . . . . . . . .
Liabilities held for sale . . . . . . . . . . . . . . . . . . . . . . . . . . . . . . . . . . . . . . . . . . . . . . .
Other liabilities . . . . . . . . . . . . . . . . . . . . . . . . . . . . . . . . . . . . . . . . . . . . . . . . . . . . . .
Deferred income taxes . . . . . . . . . . . . . . . . . . . . . . . . . . . . . . . . . . . . . . . . . . . . . . .
Shareholders’ Equity
Serial Preferred Shares (authorized 1,000,000 shares; none issued and
outstanding) . . . . . . . . . . . . . . . . . . . . . . . . . . . . . . . . . . . . . . . . . . . . . . . . . . . .
Common Shares, without par value (authorized 60,000,000 shares;
outstanding 31,162,962 and 33,572,778; net of treasury shares of
6,604,175 and 4,203,179, respectively) . . . . . . . . . . . . . . . . . . . . . . . . . . . . .
Additional paid-in capital . . . . . . . . . . . . . . . . . . . . . . . . . . . . . . . . . . . . . . . . . . .
Accumulated other comprehensive income (loss) . . . . . . . . . . . . . . . . . . . . . . .
Retained deficit . . . . . . . . . . . . . . . . . . . . . . . . . . . . . . . . . . . . . . . . . . . . . . . . . . .
236,429
—
13,738
14,281
44,347
7,825
14,687
16,508
—
—
18,855
218,394
(11,688)
(78,990)
20,313
266,276
2,427
(53,509)
Total Shareholders’ Equity . . . . . . . . . . . . . . . . . . . . . . . . . . . . . . . . . . . . . . . . . .
146,571
235,507
Total Liabilities and Shareholders’ Equity . . . . . . . . . . . . . . . . . . . . . . . . . . . . .
$564,833 $469,457
The accompanying notes are an integral part of these statements.
42
MYERS INDUSTRIES, INC. AND SUBSIDIARIES
Consolidated Statements of Shareholders’ Equity
For the Years Ended December 31, 2014, 2013 and 2012
(Dollars in thousands, except share and per share data)
Accumulated
Other
Total
Common Shares Additional
Paid-In Comprehensive Retained Stockholders’
Number Amount Capital
Income
Deficit
Equity
Balance at January 1, 2012 . . . . . . . . . . . . . . . . . . . 33,420,488 $20,312 $265,000
Net income . . . . . . . . . . . . . . . . . . . . . . . . . . . . . . . .
—
—
—
Sales under option plans . . . . . . . . . . . . . . . . . . . . .
278,659
145
2,870
Dividend reinvestment plan . . . . . . . . . . . . . . . . . . .
7,112
5
102
Restricted stock vested . . . . . . . . . . . . . . . . . . . . . .
40,500
24
(24)
Restricted stock and stock option grants, net . . . .
11,484
—
2,708
Cancellations and terminations of share grants . . .
—
—
(253)
Foreign currency translation adjustment . . . . . . . .
—
—
—
Purchases for treasury-net . . . . . . . . . . . . . . . . . . . .
(281,797)
(172)
(4,032)
Stock contribution . . . . . . . . . . . . . . . . . . . . . . . . . . .
3,743
2
48
Declared dividends—$.32 per share . . . . . . . . . . .
—
—
—
Pension liability, net of tax of $80 . . . . . . . . . . . . . .
—
—
—
$ 7,294
—
—
—
—
—
—
2,791
—
—
—
558
$(86,466)
29,962
—
—
—
—
—
—
—
(10,852)
—
$206,140
29,962
3,015
107
—
2,708
(253)
2,791
(4,204)
50
(10,852)
558
Balance at December 31, 2012 . . . . . . . . . . . . . . . . . 33,480,189 $20,316 $266,419
$ 10,643
$(67,356)
$230,022
Net income . . . . . . . . . . . . . . . . . . . . . . . . . . . . . . . .
Net sales under option plans . . . . . . . . . . . . . . . . . .
Dividend reinvestment plan . . . . . . . . . . . . . . . . . . .
Restricted stock vested . . . . . . . . . . . . . . . . . . . . . .
Restricted stock and stock option grants, net . . . .
Tax benefit from options . . . . . . . . . . . . . . . . . . . . . .
Cancellations and terminations of share grants . . .
Foreign currency translation adjustment . . . . . . . .
Purchases for treasury-net . . . . . . . . . . . . . . . . . . . .
Stock contributions . . . . . . . . . . . . . . . . . . . . . . . . . .
Shares withheld for employee taxes on equity
awards . . . . . . . . . . . . . . . . . . . . . . . . . . . . . . . . . .
Declared dividends—$.36 per share . . . . . . . . . . .
Pension liability, net of tax of $605 . . . . . . . . . . . . .
—
503,321
7,390
112,000
33,152
—
—
—
(530,983)
12,682
(44,973)
—
—
—
299
4
—
—
—
—
—
(314)
8
—
—
—
—
5,394
109
—
2,237
389
—
—
(7,782)
194
(684)
—
—
Balance at December 31, 2013 . . . . . . . . . . . . . . . . . 33,572,778 $20,313 $266,276
Net income (loss) . . . . . . . . . . . . . . . . . . . . . . . . . . .
—
Net sales under option plans . . . . . . . . . . . . . . . . . .
227,664
Dividend reinvestment plan . . . . . . . . . . . . . . . . . . .
7,159
Restricted stock vested . . . . . . . . . . . . . . . . . . . . . .
123,829
Restricted stock and stock option grants, net . . . .
15,055
Tax benefit from options . . . . . . . . . . . . . . . . . . . . . .
—
Foreign currency translation adjustment . . . . . . . .
—
Purchases for treasury-net . . . . . . . . . . . . . . . . . . . . (2,742,506)
Stock contributions . . . . . . . . . . . . . . . . . . . . . . . . . .
9,376
Shares withheld for employee taxes on equity
awards . . . . . . . . . . . . . . . . . . . . . . . . . . . . . . . . . .
(50,393)
Declared dividends—$.52 per share . . . . . . . . . . .
—
Pension liability, net of tax of $448 . . . . . . . . . . . . .
—
—
—
—
—
—
—
—
(9,292)
—
—
26,002
—
—
—
—
—
—
—
—
—
26,002
5,693
113
—
2,237
389
—
(9,292)
(8,096)
202
—
—
1,076
—
(12,155)
—
(684)
(12,155)
1,076
$ 2,427
$(53,509)
—
138
4
75
10
—
—
(1,660)
6
—
2,654
130
(75)
2,825
679
—
(53,237)
194
—
—
—
—
—
—
(13,318)
—
—
(8,681)
—
—
—
—
—
—
—
—
(8,681)
2,792
134
—
2,835
679
(13,318)
(54,897)
200
(31)
—
—
(1,052)
—
—
—
—
(797)
—
(16,800)
—
(1,083)
(16,800)
(797)
$(11,688)
$(78,990)
Balance at December 31, 2014 . . . . . . . . . . . . . . . . . 31,162,962 $18,855 $218,394
The accompanying notes are an integral part of these statements.
43
$235,507
$146,571
MYERS INDUSTRIES, INC. AND SUBSIDIARIES
Consolidated Statements of Cash Flows
For the Years Ended December 31, 2014, 2013 and 2012
(Dollars in thousands)
2014
2013
2012
Cash Flows From Operating Activities
Net income (loss) . . . . . . . . . . . . . . . . . . . . . . . . . . . . . . . . . . . . . . . . . . . . . . . . . . . . . . . . . . . . . . . . . . . . $ (8,681) $ 26,002 $ 29,962
(Loss) income from discontinued operations . . . . . . . . . . . . . . . . . . . . . . . . . . . . . . . . . . . . . . . . . . . . .
(17,642)
(440)
3,455
Net Income from continuing operations . . . . . . . . . . . . . . . . . . . . . . . . . . . . . . . . . . . . . . . . . . . . . . . . .
Items not affecting use of cash . . . . . . . . . . . . . . . . . . . . . . . . . . . . . . . . . . . . . . . . . . . . . . . . . . . . . . . .
Depreciation . . . . . . . . . . . . . . . . . . . . . . . . . . . . . . . . . . . . . . . . . . . . . . . . . . . . . . . . . . . . . . . . . . . . . .
Amortization . . . . . . . . . . . . . . . . . . . . . . . . . . . . . . . . . . . . . . . . . . . . . . . . . . . . . . . . . . . . . . . . . . . . . .
Non-cash stock compensation . . . . . . . . . . . . . . . . . . . . . . . . . . . . . . . . . . . . . . . . . . . . . . . . . . . . . . .
Provision for (recovery of) loss on accounts receivable . . . . . . . . . . . . . . . . . . . . . . . . . . . . . . . . . . .
Deferred taxes . . . . . . . . . . . . . . . . . . . . . . . . . . . . . . . . . . . . . . . . . . . . . . . . . . . . . . . . . . . . . . . . . . . .
Other long-term liabilities . . . . . . . . . . . . . . . . . . . . . . . . . . . . . . . . . . . . . . . . . . . . . . . . . . . . . . . . . . .
Loss (gain) from asset disposition . . . . . . . . . . . . . . . . . . . . . . . . . . . . . . . . . . . . . . . . . . . . . . . . . . . .
Tax benefit from options . . . . . . . . . . . . . . . . . . . . . . . . . . . . . . . . . . . . . . . . . . . . . . . . . . . . . . . . . . . .
Cancellations and terminations of share grants . . . . . . . . . . . . . . . . . . . . . . . . . . . . . . . . . . . . . . . . .
Other . . . . . . . . . . . . . . . . . . . . . . . . . . . . . . . . . . . . . . . . . . . . . . . . . . . . . . . . . . . . . . . . . . . . . . . . . . . .
Payments on performance based compensation . . . . . . . . . . . . . . . . . . . . . . . . . . . . . . . . . . . . . . . . . .
Cash flows provided by (used for) working capital, net of acquisitions:
Accounts receivable . . . . . . . . . . . . . . . . . . . . . . . . . . . . . . . . . . . . . . . . . . . . . . . . . . . . . . . . . . . . . . .
Inventories . . . . . . . . . . . . . . . . . . . . . . . . . . . . . . . . . . . . . . . . . . . . . . . . . . . . . . . . . . . . . . . . . . . . . . .
Prepaid expenses . . . . . . . . . . . . . . . . . . . . . . . . . . . . . . . . . . . . . . . . . . . . . . . . . . . . . . . . . . . . . . . . .
Accounts payable and accrued expenses . . . . . . . . . . . . . . . . . . . . . . . . . . . . . . . . . . . . . . . . . . . . .
8,961
26,442
26,507
24,173
6,999
3,115
406
(2,665)
341
(44)
(679)
—
200
(1,293)
20,386
3,142
2,557
457
(2,729)
(978)
598
(390)
—
202
(1,719)
17,050
2,426
2,708
(836)
603
3,939
(1,139)
—
253
(113)
(333)
2,710
2,377
(966)
8,122
(1,964)
3,011
(840)
26,758
(3,820)
(6,373)
(798)
3,772
Net cash provided by operating activities—continuing operations . . . . . . . . . . . . . . . . . . . . . . .
Net cash provided by (used for) operating activities—discontinued operations . . . . . . . . . . . . .
51,757
(13,062)
74,933
21,135
43,846
16,906
Net cash provided by operating activities . . . . . . . . . . . . . . . . . . . . . . . . . . . . . . . . . . . . . . . . . . . .
38,695
96,068
60,752
Cash Flows From Investing Activities
Capital expenditures . . . . . . . . . . . . . . . . . . . . . . . . . . . . . . . . . . . . . . . . . . . . . . . . . . . . . . . . . . . . . . . . .
Acquisition of business, net of cash acquired . . . . . . . . . . . . . . . . . . . . . . . . . . . . . . . . . . . . . . . . . . . .
Proceeds from sale of property, plant and equipment . . . . . . . . . . . . . . . . . . . . . . . . . . . . . . . . . . . . . .
Other . . . . . . . . . . . . . . . . . . . . . . . . . . . . . . . . . . . . . . . . . . . . . . . . . . . . . . . . . . . . . . . . . . . . . . . . . . . . . .
(24,170) (20,709) (19,861)
(156,620)
(600) (18,543)
566
—
3,086
—
(273)
(50)
Net cash used for investing activities—continuing operations . . . . . . . . . . . . . . . . . . . . . . . . . . .
Net cash provided by (used for) investing activities—discontinued operations . . . . . . . . . . . . .
(180,224) (21,582) (35,368)
11,626
(8,359) (7,116)
Net cash used for investing activities . . . . . . . . . . . . . . . . . . . . . . . . . . . . . . . . . . . . . . . . . . . . . . . .
(168,598) (29,941) (42,484)
Cash Flows From Financing Activities
Proceeds from long-term debt . . . . . . . . . . . . . . . . . . . . . . . . . . . . . . . . . . . . . . . . . . . . . . . . . . . . . . . . .
Repayment of long-term debt . . . . . . . . . . . . . . . . . . . . . . . . . . . . . . . . . . . . . . . . . . . . . . . . . . . . . . . . . .
Net borrowing (repayments) on credit facility . . . . . . . . . . . . . . . . . . . . . . . . . . . . . . . . . . . . . . . . . . . . .
Cash dividends paid . . . . . . . . . . . . . . . . . . . . . . . . . . . . . . . . . . . . . . . . . . . . . . . . . . . . . . . . . . . . . . . . .
Proceeds from issuance of common stock . . . . . . . . . . . . . . . . . . . . . . . . . . . . . . . . . . . . . . . . . . . . . . .
Tax benefit from options . . . . . . . . . . . . . . . . . . . . . . . . . . . . . . . . . . . . . . . . . . . . . . . . . . . . . . . . . . . . . .
Cancellations and terminations of share grants . . . . . . . . . . . . . . . . . . . . . . . . . . . . . . . . . . . . . . . . . . .
Repurchase of common stock . . . . . . . . . . . . . . . . . . . . . . . . . . . . . . . . . . . . . . . . . . . . . . . . . . . . . . . . .
Shares withheld for employee taxes on equity awards . . . . . . . . . . . . . . . . . . . . . . . . . . . . . . . . . . . . .
Deferred financing costs . . . . . . . . . . . . . . . . . . . . . . . . . . . . . . . . . . . . . . . . . . . . . . . . . . . . . . . . . . . . . .
89,000 11,000
—
— (32,683)
—
106,493 (24,492) (5,581)
(15,707) (9,103) (13,006)
2,926
5,805
3,122
679
390
—
—
—
(253)
(54,897) (8,096) (4,204)
(1,083)
(684)
—
(547)
(608)
—
Net cash provided by (used for) financing activities—continuing operations . . . . . . . . . . . . . . .
Net cash provided by (used for) financing activities—discontinued operations . . . . . . . . . . . . .
126,864
—
(58,471) (19,922)
(2,317) (3,977)
(60,788) (23,899)
Net cash used for financing activities . . . . . . . . . . . . . . . . . . . . . . . . . . . . . . . . . . . . . . . . . . . . . . .
126,864
Foreign Exchange Rate Effect on Cash . . . . . . . . . . . . . . . . . . . . . . . . . . . . . . . . . . . . . . . . . . . . . . . . . . .
1,176
(2,748)
2,778
Net increase (decrease) in cash . . . . . . . . . . . . . . . . . . . . . . . . . . . . . . . . . . . . . . . . . . . . . . . . . . . . . . . . .
Cash at January 1 . . . . . . . . . . . . . . . . . . . . . . . . . . . . . . . . . . . . . . . . . . . . . . . . . . . . . . . . . . . . . . . . . . . . .
(1,863)
6,539
2,591
3,948
(2,853)
6,801
Cash at December 31 . . . . . . . . . . . . . . . . . . . . . . . . . . . . . . . . . . . . . . . . . . . . . . . . . . . . . . . . . . . . . . . . . . $
4,676 $ 6,539 $ 3,948
Supplemental Disclosures of Cash Flow Information
Cash paid during the year for . . . . . . . . . . . . . . . . . . . . . . . . . . . . . . . . . . . . . . . . . . . . . . . . . . . . . . . . . .
Interest . . . . . . . . . . . . . . . . . . . . . . . . . . . . . . . . . . . . . . . . . . . . . . . . . . . . . . . . . . . . . . . . . . . . . . . . . . $
4,973 $ 4,196 $ 4,008
Income taxes . . . . . . . . . . . . . . . . . . . . . . . . . . . . . . . . . . . . . . . . . . . . . . . . . . . . . . . . . . . . . . . . . . . . . $ 11,355 $ 12,321 $ 21,201
The accompanying notes are an integral part of these statements.
44
MYERS INDUSTRIES, INC. AND SUBSIDIARIES.
Notes to Consolidated Financial Statements
(Dollar amounts in thousands, except where otherwise indicated)
1. Summary of Significant Accounting Policies
Basis of Presentation
The consolidated financial statements include the accounts of Myers Industries, Inc. and all
wholly owned subsidiaries (collectively, the “Company”). All intercompany accounts and transactions
have been eliminated in consolidation. All subsidiaries that are not wholly owned and are not included
in the consolidated operating results of the Company are immaterial investments which have been
accounted for under the equity and cost method. The preparation of financial statements in conformity
with U.S. generally accepted accounting principles (“GAAP”) requires management to make
estimates and assumptions that affect the reported amounts of assets and liabilities and disclosures
at the date of the financial statements and the reported amount of revenues and expenses during the
reported period. Actual results could differ from those estimates.
Segment Realignment and Discontinued Operations
During the second quarter of 2014, the Company realigned its reportable segments as a result of
organizational changes to better align its resources to support its ongoing business strategy. The
realignment is consistent with the manner in which our Chief Operating Decision Maker evaluates
performance and makes resource allocation decisions. Historical segment information has been
adjusted to reflect the effect of this change. Our segment information is more fully described in Note
14. Historical information also reflects discontinued operations presentation for businesses disposed
of or meeting the held for sale criteria during 2014 as described in Note 4. Accordingly, the
accompanying consolidated statements of operations, comprehensive income (loss), shareholders’
equity, cash flows and the related notes to the consolidated financial statements of the Company for
the years ended December 31, 2013 and 2012, as well as the consolidated balance sheet as of
December 31, 2013 have been retrospectively revised to reflect the classification of our businesses
disposed of or meeting the held for sale criteria during 2014 as assets and liabilities held-for-sale and
their operating results, net of tax, as discontinued operations.
Recent Accounting Pronouncements Not Yet Adopted
In April 2014, the Financial Accounting Standards Board (“FASB”) issued Accounting Standards
Update (“ASU”) 2014-08, Reporting Discontinued Operations and Disclosures of Disposals of
Components of an Entity. This guidance states that the disposal of a component of an entity is to be
reported in discontinued operations only if the disposal represents a strategic shift that has (or will
have) a major effect on an entity’s operations and financial results. The pronouncement also requires
additional disclosures regarding individually significant disposals of components that do not meet the
criteria to be recognized as a discontinued operation as well as additional and expanded disclosures.
This ASU will be effective for the Company for applicable transactions occurring after January 1,
2015. We will prospectively apply the guidance to applicable transactions. The Lawn and Garden
transaction described in Note 4 is not subject to this guidance.
In May 2014, the FASB issued ASU 2014-09, Revenue from Contracts with Customers, to clarify
the principles used to recognize revenue for all entities. Under ASU 2014-09, a company will
recognize revenue when it transfers promised goods or services to customers in an amount that
reflects the consideration to which the company expects to be entitled in exchange for those goods or
services. The new guidance is effective for the Company on January 1, 2017 with early adoption not
45
MYERS INDUSTRIES, INC. AND SUBSIDIARIES.
Notes to Consolidated Financial Statements — (Continued)
(Dollar amounts in thousands, except where otherwise indicated)
permitted. Entities can transition to the standard either retrospectively or as a cumulative effect
adjustment as of the adoption date. The Company is currently evaluating the impact the adoption of
this guidance will have on its consolidated financial statements as well as the method by which the
Company will adopt the new standard.
In August 2014, the FASB issued ASU 2014-15, Disclosure of Uncertainties About an Entity’s
Ability to Continue as a Going Concern. The new standard provides guidance on determining when
and how to disclose going-concern uncertainties in the financial statements. Under ASU 2014-15,
management will be required to perform interim and annual assessments of the Company’s ability to
continue as a going concern within one year of the date the financial statements are issued. ASU
2014-15 is effective for annual periods ending after December 15, 2016, and interim periods
thereafter, with early adoption permitted. The adoption of this standard is not expected to have an
impact on the Company’s financial statement disclosures.
Translation of Foreign Currencies
All asset and liability accounts of consolidated foreign subsidiaries are translated at the current
exchange rate as of the end of the accounting period and income statement items are translated
monthly at an average currency exchange rate for the period. The resulting translation adjustment is
recorded in other comprehensive income (loss) as a separate component of shareholders’ equity.
Fair Value Measurement
The Company follows guidance included in ASC 820, Fair Value Measurements and Disclosures
(“ASC 820”), for its financial assets and liabilities, as required. The guidance established a common
definition for fair value to be applied to U.S. GAAP requiring the use of fair value, established a
framework for measuring fair value, and expanded disclosure requirements about such fair value
measurements. The guidance did not require any new fair value measurements, but rather applied to
all other accounting pronouncements that require or permit fair value measurements. Under ASC 820,
the hierarchy that prioritizes the inputs to valuation techniques used to measure fair value is divided
into three levels:
Level 1: Unadjusted quoted prices in active markets for identical assets or liabilities.
Level 2: Unadjusted quoted prices in active markets for similar assets or liabilities,
unadjusted quoted prices for identical or similar assets or liabilities in markets that are not active
or inputs that are observable either directly or indirectly.
Level 3: Unobservable inputs for which there is little or no market data or which reflect the
entity’s own assumptions.
The fair value of the Company’s cash, accounts receivable, accounts payable and accrued
expenses are considered to have a fair value which approximates carrying value due to the nature
and relative short maturity of these assets and liabilities.
The fair value of debt under the Company’s Loan Agreement approximates carrying value due to
the floating rates and relative short maturity (less than 90 days) of the revolving borrowings under this
agreement. The fair value of the Company’s fixed rate senior unsecured notes was estimated using
market observable inputs for the Company’s comparable peers with public debt, including quoted
46
MYERS INDUSTRIES, INC. AND SUBSIDIARIES.
Notes to Consolidated Financial Statements — (Continued)
(Dollar amounts in thousands, except where otherwise indicated)
prices in active markets and interest rate measurements which are considered level 2 inputs. At
December 31, 2014, the aggregate fair value of the Company’s $100.0 million fixed rate senior
unsecured notes was estimated at $106.8 million.
Concentration of Credit Risk
Financial instruments that potentially subject the Company to concentration of credit risk primarily
consist of trade accounts receivable. The concentration of accounts receivable credit risk is generally
limited based on the Company’s diversified operations, with customers spread across many
industries and countries. The Company’s largest single customer in 2014 accounts for approximately
5% of total sales with only one other customer greater than 3%. Outside of the United States, only
Brazil and Canada, which account for approximately 8% and 6% of total sales, respectively, are
significant to the Company’s operations. In addition, management has established certain
requirements that customers must meet before credit is extended. The financial condition of
customers is continually monitored and collateral is usually not required. The Company evaluates the
collectability of accounts receivable based on a combination of factors. In circumstances where the
Company is aware of a specific customer’s inability to meet its financial obligations, a specific
allowance for doubtful accounts is recorded against amounts due to reduce the net recognized
receivable to the amount the Company reasonably believes will be collected. Additionally, the
Company also reviews historical trends for collectability in determining an estimate for its allowance
for doubtful accounts. If economic circumstances change substantially, estimates of the recoverability
of amounts due the Company could be reduced by a material amount. Expense (income) related to
bad debts was approximately $0.4 million, $0.5 million and $(0.8) million for the years 2014, 2013 and
2012, respectively. Deductions from the allowance for doubtful accounts, net of recoveries, were
approximately $0.9 million, $0.8 million and $0.1 million for the years 2014, 2013 and 2012,
respectively.
Factoring
During 2014, the Company’s wholly-owned subsidiary Plasticos Novel Do Nordeste S.A. and
Plasticos Novel Do Parana S.A. (“Novel”) entered into a factoring agreement to sell, without recourse,
certain of their Brazilian real-based accounts receivables to an unrelated third party financial
institution. During 2014, $9.1 million of receivables had been sold under the terms of the factoring
agreement for cash proceeds of $8.8 million. The sale of these receivables reduced the credit
exposure of the Company. Costs related to this program for the year ended December 31, 2014 were
$0.3 million and are included in interest expense in the Consolidated Statement of Operations.
Inventories
Inventories are stated at the lower of cost or market. Approximately 30 percent of our inventories
are valued using the last-in, first-out (“LIFO”) method of determining cost. All other inventories are
valued at the first-in, first-out (“FIFO”) method of determining cost.
If the FIFO method of inventory cost valuation had been used exclusively by the Company,
inventories would have been $6.8 million, $8.1 million and $8.7 million higher than reported at
December 31, 2014, 2013 and 2012, respectively. The liquidation of LIFO inventories decreased cost
of sales and increased income from continuing operations before income taxes by less than $0.4
million in 2014, and $0.1 million and $0.4 million in 2013 and 2012, respectively.
47
MYERS INDUSTRIES, INC. AND SUBSIDIARIES.
Notes to Consolidated Financial Statements — (Continued)
(Dollar amounts in thousands, except where otherwise indicated)
Property, Plant and Equipment
Property, plant and equipment are carried at cost less accumulated depreciation and
amortization. The Company provides for depreciation and amortization on the basis of the straight-line
method over the estimated useful lives of the assets as follows:
Buildings . . . . . . . . . . . . . . . . . . . . . . . . . . . . . . . . . . . . . . . . . . . . . . . .
Machinery and Equipment . . . . . . . . . . . . . . . . . . . . . . . . . . . . . . . . .
Vehicles . . . . . . . . . . . . . . . . . . . . . . . . . . . . . . . . . . . . . . . . . . . . . . . . .
Leasehold Improvements . . . . . . . . . . . . . . . . . . . . . . . . . . . . . . . . . .
20 to 40 years
3 to 10 years
1 to 3 years
5 to 10 years
At December 31, 2014 , the Company had approximately $2.1 million and $3.1 million of
capitalized software costs included in machinery and equipment on the accompanying Consolidated
Statements of Financial Position in 2014 and 2013, respectively. Amortization expense related to
capitalized software costs was approximately $0.3 million and $0.1 million in 2014 and 2013,
respectively.
Long-Lived Assets
The Company reviews its long-lived assets and identifiable intangible assets with finite lives for
impairment whenever events or changes in circumstances indicate that the carrying amount of an
asset may not be recoverable. Determination of potential impairment related to assets to be held and
used is based upon undiscounted future cash flows resulting from the use and ultimate disposition of
the asset. For assets held for disposal, the amount of potential impairment may be based upon
appraisal of the asset, estimated market value of similar assets or estimated cash flow from the
disposition of the asset. Refer to Note 4 for discussion of the Lawn and Garden business 2014
impairment charge.
Revenue Recognition
The Company recognizes revenues from the sale of products, net of actual and estimated
returns, at the point of passage of title and risk of loss, which is generally at time of shipment, and
collectability of the fixed or determinable sales price is reasonably assured.
48
MYERS INDUSTRIES, INC. AND SUBSIDIARIES.
Notes to Consolidated Financial Statements — (Continued)
(Dollar amounts in thousands, except where otherwise indicated)
Accumulated Other Comprehensive Income (Loss)
Changes in accumulated other comprehensive income (loss) and are as follows:
Defined Benefit
Foreign Currency Pension Plans
Balance at January 1, 2012 . . . . . . . . . . . . . .
Other comprehensive income (loss)
before reclassifications . . . . . . . . . . . . . .
Amounts reclassified from accumulated
other comprehensive income, net of tax
of ($36)(1) . . . . . . . . . . . . . . . . . . . . . . . . .
Net current-period other
comprehensive income (loss) . . . . . . .
Balance at December 31, 2012 . . . . . . . . . . .
Other comprehensive income (loss)
before reclassifications . . . . . . . . . . . . . .
Amounts reclassified from accumulated
other comprehensive income, net of tax
of ($40)(1) . . . . . . . . . . . . . . . . . . . . . . . . .
Net current-period other
comprehensive income (loss) . . . . . . .
Balance at December 31, 2013 . . . . . . . . . . .
Other comprehensive income (loss)
before reclassifications . . . . . . . . . . . . . .
Amounts reclassified from accumulated
other comprehensive income, net of tax
of ($16)(1) . . . . . . . . . . . . . . . . . . . . . . . . .
Net current-period other
comprehensive income (loss) . . . . . . .
Balance at December 31, 2014 . . . . . . . . . . .
$ 9,994
$(2,700)
Total
$ 7,294
2,791
493
3,284
—
65
65
2,791
$ 12,785
(9,292)
—
558
$(2,142)
1,005
71
3,349
$ 10,643
(8,287)
71
(9,292)
3,493
1,076
(1,066)
(8,216)
2,427
(13,318)
(826)
(14,144)
—
(13,318)
$ (9,825)
29
(797)
$(1,863)
29
(14,115)
$(11,688)
(1) These accumulated other comprehensive income (loss) components are included in the
computation of net periodic pension cost. (See Note 12-Retirement Plans for additional details.)
Shipping and Handling
Shipping and handling expenses are primarily classified as selling expenses in the
accompanying Consolidated Statements of Operations. The Company incurred shipping and
handling costs of approximately $19.4 million, $17.1 million and $16.6 million for the years ended
December 31, 2014, 2013 and 2012, respectively.
Stock Based Compensation
The Company has stock plans that provide for the granting of stock-based compensation to
employees and to non-employee directors. Shares are issued upon exercise from authorized,
unissued shares. The Company records the costs of the plan under the provisions of ASC 718,
Compensation — Stock Compensation. For transactions in which we obtain employee services in
49
MYERS INDUSTRIES, INC. AND SUBSIDIARIES.
Notes to Consolidated Financial Statements — (Continued)
(Dollar amounts in thousands, except where otherwise indicated)
exchange for an award of equity instruments, we measure the cost of the services based on the grant
date fair value of the award. The Company recognizes the cost over the period during which an
employee is required to provide services in exchange for the award, referred to as the requisite
service period (usually the vesting period).
Income Taxes
Income taxes are accounted for under the liability method. Deferred tax assets and liabilities are
recognized for the future tax consequences attributable to differences between the financial
statement carrying amounts of assets and liabilities and their respective tax bases and operating loss
and tax credit carryforwards. Deferred tax assets and liabilities are measured using enacted tax rates
expected to apply to taxable income in the years in which those differences are expected to be
received or settled. The effect on deferred tax assets and liabilities of a change in tax rates is
recognized in income in the period that includes the enactment date.
The Company evaluates its tax positions in accordance with ASC 740, Income Taxes (“ASC
740”). ASC 740 provides detailed guidance for the financial statement recognition, measurement and
disclosure of uncertain tax positions recognized in an enterprise’s financial statements. Income tax
positions must meet a more-likely-than-not recognition threshold at the effective date to be
recognized under ASC 740. The Company recognizes potential accrued interest and penalties
related to unrecognized tax benefits as a component of income tax expense.
Cash and Cash Equivalents
The Company considers all highly liquid instruments purchased with a maturity of three months or
less to be cash equivalents. Cash equivalents are stated at cost, which approximates market value.
The Company maintains operating cash and reserves for replacement balances in financial
institutions which, from time to time, may exceed federally insured limits. The Company periodically
assesses the financial condition of these institutions and believes that the risk of loss is minimal.
Cash flows used in investing activities excluded $0.2 million, $0.5 million and $0.1 million of
accrued capital expenditures in 2014, 2013 and 2012, respectively.
2. Acquisitions
On July 2, 2014, CA Acquisition Inc., now known as Scepter Canada Inc., and a wholly-owned
subsidiary of Myers Industries, Inc., completed the purchase of substantially all of the assets and
assumption of certain liabilities of Scepter Corporation and certain real property of SHI Properties Inc.,
both located in Scarborough, Ontario, Canada. Contemporaneously with the asset acquisition, Crown
US Acquisition Company, now known as Scepter US Holding Company, and another wholly-owned
subsidiary of Myers Industries, Inc., completed the purchase of all of the issued and outstanding
membership interests of Eco One Leasing, LLC and Scepter Manufacturing, LLC, both located in
Miami, Oklahoma. Eco One Leasing, LLC was subsequently merged into Scepter Manufacturing,
LLC. The total purchase price for these acquisitions (collectively, “Scepter”) was $156.6 million in
cash, which includes a final working capital adjustment. The acquisition of Scepter was funded from
net proceeds from additional borrowings of approximately $134.1 million under the Fourth Amended
and Restated Loan Agreement and cash on hand of $22.5 million.
50
MYERS INDUSTRIES, INC. AND SUBSIDIARIES.
Notes to Consolidated Financial Statements — (Continued)
(Dollar amounts in thousands, except where otherwise indicated)
The acquisition of Scepter strengthens and expands the Company’s position as an industry
leading producer of portable marine fuel containers, portable fuel and water containers and
accessories, ammunition containers, storage totes and environmental bins for the marine, military,
consumer and industrial markets. The acquisition of Scepter is consistent with the Company’s
business strategy and the products fit well with the Company’s overall portfolio. The operating results
of Scepter have been included within our Consolidated Statement of Operations and within the
Company’s Material Handling Segment since the date of acquisition. The Consolidated Statement of
Operations for the Company for the year ended December 31, 2014 included net sales of $39.4
million and an operating loss of $5.4 million related to Scepter. Scepter’s operating results included
$2.3 million of inventory purchase accounting fair value adjustments charged to cost of sales as the
inventory was sold. In addition, transactional costs of approximately $3.6 million for the year ended
December 31, 2014 are included in general and administrative expenses in the Consolidated
Statements of Operations.
The Company accounted for the acquisition of Scepter using the acquisition method of
accounting, which requires among other things, the assets acquired and liabilities assumed be
recognized at their respective fair values as of the acquisition date. As of December 31, 2014, the
purchase price allocation remains preliminary as the Company has not finalized its assessment of
contingent liabilities. As a result, additional adjustments may be recorded during the measurement
period.
Scepter’s assets and liabilities are recorded at fair value as of the date of acquisition using
primarily level 3 fair value inputs. The purchase consideration, related preliminary estimated
allocations, and resulting excess over fair value of net assets acquired are as follows:
Assets acquired:
Current assets . . . . . . . . . . . . . . . . . . . . . . . . . . . . . . . . . . . . . . . . . . . . . . . . . . . . . . .
Property, plant and equipment . . . . . . . . . . . . . . . . . . . . . . . . . . . . . . . . . . . . . . . . . .
Intangible assets . . . . . . . . . . . . . . . . . . . . . . . . . . . . . . . . . . . . . . . . . . . . . . . . . . . . .
$ 34,572
44,613
66,500
Assets acquired . . . . . . . . . . . . . . . . . . . . . . . . . . . . . . . . . . . . . . . . . . . . . . . . . . . . . .
$145,685
Liabilities assumed:
Current liabilities . . . . . . . . . . . . . . . . . . . . . . . . . . . . . . . . . . . . . . . . . . . . . . . . . . . . .
$
8,877
Total liabilities assumed . . . . . . . . . . . . . . . . . . . . . . . . . . . . . . . . . . . . . . . . . . . . . . .
Goodwill . . . . . . . . . . . . . . . . . . . . . . . . . . . . . . . . . . . . . . . . . . . . . . . . . . . . . . . . . . . .
8,877
19,812
Total consideration . . . . . . . . . . . . . . . . . . . . . . . . . . . . . . . . . . . . . . . . . . . . . . . . . . .
$156,620
Goodwill is calculated as the excess of the consideration transferred over the assets acquired
and liabilities assumed and represents the future economic benefits arising from other assets
acquired that could not be individually identified and separately recognized. The Company expects
that approximately $16.4 million of goodwill recognized for the acquisition will be deductible for tax
purposes.
51
MYERS INDUSTRIES, INC. AND SUBSIDIARIES.
Notes to Consolidated Financial Statements — (Continued)
(Dollar amounts in thousands, except where otherwise indicated)
Identifiable intangible assets acquired in connection with the acquisition of Scepter are as
follows:
Fair
Value
Estimated
Useful Life
Valuation Method
Intangible assets not subject to amortization:
Trademarks and trade names . . . . . . . . . . . . . . . . . . . $ 8,900 Indefinite Relief from royalty
Intangible assets subject to amortization:
Technology . . . . . . . . . . . . . . . . . . . . . . . . . . . . . . . . . .
Customer relationships . . . . . . . . . . . . . . . . . . . . . . . .
22,300 10 years Relief from royalty
35,300 6 years Multi-period excess earnings
57,600
Total . . . . . . . . . . . . . . . . . . . . . . . . . . . . . . . . . . . . . . . . $66,500
The following unaudited pro forma information presents a summary of the consolidated results of
operations for the Company as if the acquisition of Scepter had occurred on January 1, 2013.
For the Year Ended
December 31, 2014
December 31, 2013
Net sales . . . . . . . . . . . . . . . . . . . . . . . . . . . . . . . . . . . . .
$675,046
$679,567
Net income from continuing operations . . . . . . . . . . . .
$ 16,206
$ 30,271
Net income per share from continuing operations:
Basic . . . . . . . . . . . . . . . . . . . . . . . . . . . . . . . . . . . . . . . .
Diluted . . . . . . . . . . . . . . . . . . . . . . . . . . . . . . . . . . . . . . .
$
$
$
$
0.50
0.50
0.89
0.89
The unaudited pro forma consolidated results are based on the Company’s historical financial
statements and those of Scepter and do not necessarily indicate the results of operations that would
have resulted had the acquisition actually been completed at the beginning of the applicable period
presented. The pro forma financial information assumes that the companies were combined as of
January 1, 2013. The pro forma results reflect the business combination accounting effects from the
acquisition including amortization charges from the acquired intangible assets, inventory purchase
accounting adjustments charged to cost of sales as the inventory is sold and increased interest
expense associated with debt incurred to fund the acquisition. The unaudited pro forma consolidated
results do not give effect to the synergies of the acquisition and are not indicative of the results of
operations in future periods.
In October 2012, the Company acquired 100% of the stock of Jamco Products Inc. (“Jamco”), an
Illinois corporation that is a leading designer and manufacturer of heavy-duty industrial steel carts and
safety cabinets used across many markets. The total purchase price was approximately $15.1 million
in cash, net of $0.1 million of cash acquired.
Jamco’s assets and liabilities are recorded at fair value as of the date of acquisition using
primarily level 2 and level 3 fair value inputs. The Jamco acquisition resulted in goodwill of $7.4
million, which is non deductible for income tax purposes, and $5.7 million of identifiable intangible
assets.
52
MYERS INDUSTRIES, INC. AND SUBSIDIARIES.
Notes to Consolidated Financial Statements — (Continued)
(Dollar amounts in thousands, except where otherwise indicated)
In July 2012, the Company acquired 100% of the stock of Plasticos Novel do Nordeste S.A.
(“Novel”), a Brazil-based designer and manufacturer of reusable plastic crates and containers used
for closed-loop shipping and storage. Novel also produces a diverse range of plastic industrial safety
products. The total purchase price was $30.9 million, which included a cash payment of $3.4 million,
net of $0.6 million of cash acquired, assumed debt of approximately $26.0 million and contingent
consideration of $0.9 million based on an earnout. A majority of the debt was repaid shortly after
acquisition. The contingent consideration is contingent upon the results of Novel exceeding
predefined earnings before interest, taxes, depreciation and amortization over the following four
years.
Novel’s assets and liabilities are recorded at fair value as of the date of acquisition using primarily
level 3 fair value inputs. The Novel acquisition resulted in $9.8 million of goodwill, which is not
deductible for income tax purpose, and $5.8 million of identifiable intangible assets.
The operating results of Novel and Jamco acquired have been included in our Material Handling
Segment since the date of acquisition.
The Consolidated Statements of Operations for the Company for the year ended December 31,
2012 following the acquisition of Novel effective July 1, 2012 and Jamco on October 1, 2012 included
total revenues of $21.5 million and net income of $0.2 million. Transactional costs of approximately
$0.9 million were incurred during the year and are included in general and administrative expenses in
the Consolidated Statements of Operations in 2012.
3. Goodwill and Intangible Assets
The Company is required to test for impairment of goodwill and intangible assets on at least an
annual basis. The Company conducted its annual impairment assessment as of October 1 for its five
reporting units, noting no impairment in 2014, 2013 or 2012. Based on procedures conducted to test
impairment of goodwill of the Company’s reporting units, Plasticos Novel do Nordeste S. A. (“Novel”)
and Jamco Products, Inc. (“Jamco”) did not substantially exceed their carrying value as of our
assessment date in 2014. The estimated fair value of Novel and Jamco exceeded their carrying
values by approximately 10% and 20%, respectively. Although no goodwill impairment charge is
required for 2014, it does present a risk of future impairment for the goodwill assigned to those
reporting units. The decline in the fair values of these businesses was driven primarily by reduced
profitability as a result of lower margins due to higher costs, primarily in raw materials and a
prolonged economic downturn in the Brazilian economy impacting Novel. As a result, management
decreased future projections of the operating results and cash flows in assessing goodwill at these
reporting units. The Company tests for impairment whenever events or circumstances indicate that it
is more likely than not that the fair value of a reporting unit is below its carrying amount. Such events
may include, but are not limited to, significant changes in economic and competitive conditions, the
impact of the economic environment on the Company’s customer base or its businesses, or a material
negative change in its relationships with significant customers.
In accordance with ASU No. 2011-08, Intangibles — Goodwill and Other (Topic 350), the
Company first performs a qualitative assessment to determine whether it is more likely than not that
the fair value of a reporting unit is less than its carrying value. If the Company concludes that this is
the case, it must perform the two-step test. Otherwise the Company does not perform the two-step
test. During the 2014 annual review of goodwill, management proceeded directly to the two-step test
53
MYERS INDUSTRIES, INC. AND SUBSIDIARIES.
Notes to Consolidated Financial Statements — (Continued)
(Dollar amounts in thousands, except where otherwise indicated)
for Novel and Jamco. In evaluating goodwill for impairment using the two-step test, the Company
uses a combination of valuation techniques primarily using discounted cash flows to determine the
fair values of its business reporting units and market based multiples as supporting evidence. The
variables and assumptions used, all of which are level 3 fair value inputs, include the projections of
future revenues and expenses, working capital, terminal values, discount rates and long term growth
rates. The market multiples observed in sale transactions are determined separately for each
reporting unit, and are based on the weighted average cost of capital for each of the Company’s
reporting units, which ranged from 10.0% to 13.0% in 2014. In addition we make certain judgments
about the selection of comparable companies used in determining market multiples in valuing our
business units, as well as certain assumptions to allocate shared assets and liabilities to calculate
values for each of our business units. The underlying assumptions used are based on historical actual
experience and future expectations that are consistent with those used in the Company’s strategic
plan. The Company compares the fair value of each of its reporting units to their respective carrying
values, including related goodwill. We also compare our book value and the estimates of fair value of
the reporting units to our market capitalization as of and at dates near the annual testing date.
Management uses this comparison as additional evidence of the fair value of the Company, as our
market capitalization may be suppressed by other factors such as the control premium associated
with a controlling shareholder, our leverage or general expectations regarding future operating results
and cash flows. In situations where the implied value of the Company under the Income or Market
Approach are significantly different than our market capitalization we re-evaluate and adjust, if
necessary, the assumptions underlying our Income and Market Approach models. Our estimate of the
fair values of these business units, and the related goodwill, could change over time based on a
variety of factors, including the aggregate market value of the Company’s common stock, actual
operating performance of the underlying businesses or the impact of future events on the cost of
capital and the related discount rates used.
The change in the carrying amount of goodwill for the years ended December 31, 2014 and 2013
is as follows:
Distribution
January 1, 2013 . . . . . . . . . . . . . . . . . . . . . . . . . . . . . . . . . . . . . . . . . . . .
Reclassification of prepaid asset from Novel acquisition . . . . . . . . .
Foreign currency translation . . . . . . . . . . . . . . . . . . . . . . . . . . . . . . . .
$505
—
—
December 31, 2013 . . . . . . . . . . . . . . . . . . . . . . . . . . . . . . . . . . . . . . . . .
Acquisitions . . . . . . . . . . . . . . . . . . . . . . . . . . . . . . . . . . . . . . . . . . . . . .
Foreign currency translation . . . . . . . . . . . . . . . . . . . . . . . . . . . . . . . .
505
—
—
December 31, 2014 . . . . . . . . . . . . . . . . . . . . . . . . . . . . . . . . . . . . . . . . .
$505
Material
Handling
Total
$50,741 $51,246
1,028
1,028
(1,199) (1,199)
50,570
19,812
(4,248)
51,075
19,812
(4,248)
$66,134 $66,639
Intangible assets other than goodwill primarily consist of trade names, customer relationships,
patents, and technology assets established in connection with acquisitions. These intangible assets,
other than certain trade names, are amortized over their estimated useful lives. The Company
performs an annual impairment assessment for the indefinite lived trade names which had a carrying
value of $11,256 and $2,509 at December 31, 2014 and 2013, respectively. In performing this
assessment the Company uses an income approach, based primarily on level 3 inputs, to estimate
the fair value of the trade name. The Company records an impairment charge if the carrying value of
the trade name exceeds the estimated fair value at the date of assessment.
54
MYERS INDUSTRIES, INC. AND SUBSIDIARIES.
Notes to Consolidated Financial Statements — (Continued)
(Dollar amounts in thousands, except where otherwise indicated)
Intangible assets at December 31, 2014 and 2013 consisted of the following:
2014
Weighted
Average Useful
Life (years)
Gross
5.3
$11,256
280
5.1
9.0
2.2
0.0
41,332
27,642
10,888
150
Trade Names—Indefinite
Lived . . . . . . . . . . . . . . .
Trade Names . . . . . . . . . .
Customer
Relationships . . . . . . . .
Technology . . . . . . . . . . . .
Patents . . . . . . . . . . . . . . .
Non-Compete . . . . . . . . . .
$91,548
Accumulated
Amortization
$
2013
Net
Gross
— $11,256 $ 2,509
(110)
170
280
(7,964)
(2,552)
(8,538)
(149)
33,368
25,090
2,350
1
7,968
5,502
10,899
150
$(19,313) $72,235 $27,308
Accumulated
Amortization
$
Net
— $ 2,509
(78)
202
(4,515)
(918)
(7,448)
(94)
3,453
4,584
3,451
56
$(13,053) $14,255
Intangible amortization expense was $6,466, $2,769 and $2,188 in 2014, 2013 and 2012,
respectively. Estimated annual amortization expense for intangible assets with finite lives for the next
five years is: $10,449 in 2015; $10,447 in 2016; $9,539 in 2017, $9,086 in 2018 and $8,521 in 2019.
4. Discontinued Operations
On June 20, 2014, the Company completed the sale of the assets and associated liabilities of its
wholly-owned subsidiaries WEK Industries, Inc. and Whiteridge Plastics LLC (collectively “WEK”) for
approximately $20.7 million, which includes a working capital adjustment of approximately $0.8
million. Of the total proceeds from the sale of WEK, approximately $1.0 million are held in escrow to
be received in December 2015. The Company recorded a gain on the sale of WEK of approximately
$3.0 million, net of tax of $1.6 million. WEK is a premier blow molder of custom engineered plastic
components for the heavy truck, recreational vehicle, marine, appliance and consumer products
industries. WEK was previously reported as part of our former Engineered Products Segment.
During the second quarter of 2014, the Company’s Board of Directors approved the
commencement of the sale process to divest its Lawn and Garden business to allow it to focus
resources on its core growth platforms. The Lawn and Garden business serves the North American
horticulture market with plastic products such as seedling trays, nursery products, hanging baskets,
custom print containers as well as decorative resin planters. The business was sold February 17,
2015 to an entity controlled by Wingate Partners V, L.P., a private equity firm, for $110 million, subject
to a working capital adjustment. The sale of the Lawn & Garden business includes manufacturing
facilities and offices located in Twinsburg, Ohio, Middlefield, Ohio, Elyria, Ohio, Sparks, Nevada,
Sebring, Florida, Brantford, Ontario, and Burlington, Ontario. The terms of the agreement include a
$90 million cash payment and a $20 million five year note.
Since the second quarter of 2014, the Lawn and Garden business met the held-for-sale criteria
under the requirements of ASC 360. Accordingly, at December 31, 2014 and 2013, the Company has
classified and accounted for the assets and liabilities of the Lawn and Garden business and WEK, for
periods prior to the sale, as held for sale in the accompanying Consolidated Statements of Financial
Position and their operating results, net of tax, as discontinued operations in the accompanying
55
MYERS INDUSTRIES, INC. AND SUBSIDIARIES.
Notes to Consolidated Financial Statements — (Continued)
(Dollar amounts in thousands, except where otherwise indicated)
Consolidated Statements of Operations for all periods presented. In addition, the Company performed
a fair value assessment of the Lawn and Garden business. The fair value, determined as sales price
less cost to sell the business, was less than its carrying value at December 31, 2014, resulting in an
$18.9 million impairment charge reported as discontinued operations in the Consolidated Statements
of Operations.
Summarized selected financial information for the Lawn and Garden business and WEK for the
years ended December 31, 2014, 2013 and 2012 are presented in the following table:
2014*
Year Ended
December 31,
2013
2012
Net sales . . . . . . . . . . . . . . . . . . . . . . . . . . . . . . . . . . . . . .
$204,716
$240,477
$245,616
Income (loss) from discontinued operations before
income taxes . . . . . . . . . . . . . . . . . . . . . . . . . . . . . . . . .
Income tax expense (benefit) . . . . . . . . . . . . . . . . . . . . .
$ (30,038)
(9,408)
$
Income (loss) from discontinued operations . . . . . . . . .
Net gain on sale of discontinued operations, net of tax
of $1.6 million . . . . . . . . . . . . . . . . . . . . . . . . . . . . . . . .
(20,630)
Income (loss) from discontinued operations . . . . . . . . .
$ (17,642)
2,988
(394)
46
5,145
1,690
(440)
3,455
—
$
(440)
—
3,455
* Includes WEK operating results through June 20, 2014.
The assets and liabilities of discontinued operations are stated separately as of December 31,
2014 and 2013, respectively, in the Consolidated Statements of Financial Position and are comprised
of the following items:
Year Ended December 31,
2014
2013
Assets
Accounts receivable-net . . . . . . . . . . . . . . . . . . . . . . . . . . . . . . . . . .
Inventories . . . . . . . . . . . . . . . . . . . . . . . . . . . . . . . . . . . . . . . . . . . . . .
Prepaid expenses and other current assets . . . . . . . . . . . . . . . . . .
Goodwill . . . . . . . . . . . . . . . . . . . . . . . . . . . . . . . . . . . . . . . . . . . . . . .
Patents and other intangible assets, net . . . . . . . . . . . . . . . . . . . . .
Property, plant and equipment, net . . . . . . . . . . . . . . . . . . . . . . . . .
Net asset impairment . . . . . . . . . . . . . . . . . . . . . . . . . . . . . . . . . . . . .
Other . . . . . . . . . . . . . . . . . . . . . . . . . . . . . . . . . . . . . . . . . . . . . . . . . .
$ 29,794 $ 37,527
50,951
53,401
1,709
1,832
9,107
9,567
6,030
6,860
38,168
51,028
(18,858)*
—
874
353
Total Assets Held for Sale . . . . . . . . . . . . . . . . . . . . . . . . . . . . . . . . .
$117,775
$160,568
Liabilities
Accounts payable . . . . . . . . . . . . . . . . . . . . . . . . . . . . . . . . . . . . . . .
Accrued expenses and other liabilities . . . . . . . . . . . . . . . . . . . . . .
$ 22,239
4,883
$ 29,366
18,503
Total Liabilities Held for Sale . . . . . . . . . . . . . . . . . . . . . . . . . . . . . .
$ 27,122
$ 47,869
* Impairment includes $8.3 million of cumulative translation credit adjustment associated with the
Lawn and Garden group.
56
MYERS INDUSTRIES, INC. AND SUBSIDIARIES.
Notes to Consolidated Financial Statements — (Continued)
(Dollar amounts in thousands, except where otherwise indicated)
The Lawn and Garden business restructuring plan, announced in July 2013, detailed the closure
of two manufacturing plants: one in Brantford, Ontario and the second in Waco, Texas. The
restructuring actions included closure, relocation and employee related costs. Through December 31,
2014, the Lawn and Garden business has incurred approximately $14.5 million of charges under its
restructuring plan. Restructuring actions under the plan have been completed.
Restructuring charges related to discontinued operations for the year ended 2014, 2013 and
2012 are presented in the following table:
Year Ended
December 31,
2014
2013*
2012*
Severance and personnel . . . . . . . . . . . . . . . . . . . . . . . . . . . . . . . . . . . . . . . . .
Other exit costs . . . . . . . . . . . . . . . . . . . . . . . . . . . . . . . . . . . . . . . . . . . . . . . . .
$1,743 $2,614 $ 487
3,762
6,189
1,198
Total . . . . . . . . . . . . . . . . . . . . . . . . . . . . . . . . . . . . . . . . . . . . . . . . . . . . . . . . . . .
$5,505 $8,803 $1,685
* Includes WEK restructuring charges of $0.2 million and $1.2 million in 2013 and 2012, respectively.
5. Net Income (Loss) Per Common Share
Net income (loss) per common share, as shown on the Consolidated Statements of Operations, is
determined on the basis of the weighted average number of common shares outstanding during the
periods as follows:
Weighted average common shares outstanding:
Basic . . . . . . . . . . . . . . . . . . . . . . . . . . . . . . . . . . . .
Dilutive effect of stock options and restricted
stock . . . . . . . . . . . . . . . . . . . . . . . . . . . . . . . . . . .
Weighted average common shares outstanding
diluted . . . . . . . . . . . . . . . . . . . . . . . . . . . . . . . . . .
2014
2013
2012
32,232,965
33,588,720
33,597,020
471,047
454,705
512,212
32,704,012
34,043,425
34,109,232
Options to purchase 198,500, 123,900 and 212,000 shares of common stock that were
outstanding at December 31, 2014, 2013 and 2012, respectively, were not included in the
computation of diluted earnings per share as the exercise prices of these options was greater than
the average market price of common shares.
57
MYERS INDUSTRIES, INC. AND SUBSIDIARIES.
Notes to Consolidated Financial Statements — (Continued)
(Dollar amounts in thousands, except where otherwise indicated)
6. Restructuring
The charges related to various restructuring programs implemented by the Company are
included in selling, general and administrative (“SG&A”) expenses and cost of sales depending on
the type of cost incurred. The restructuring charges are presented in the following table.
Segment
2014
Selling,
Cost of general and
sales administrative
Distribution . . . . . $ —
Material
Handling . . . . .
189
Corporate . . . . . .
—
Total . . . . . . . . . . $189
Total
2013
2012
Selling,
Selling,
Cost of general and
Cost of general and
sales administrative Total sales administrative
Total
$ 764
$ 764 $ —
$194
$194
$—
$ 727
$ 727
260
—
$1,024
449
178
—
—
$1,213 $178
47
17
$258
225
17
$436
—
—
$—
—
318
$1,045
—
318
$1,045
During 2014, the Distribution Segment closed its Canadian branches operating under the name
Myers Tire Supply International. The restructuring actions included closure, lease cancellation and
employee related costs, which amounted to approximately $0.8 million. Restructuring actions under
the plan have been completed.
Also during 2014, the Material Handling Segment restructured its sales and finance organization
within several of its businesses. Restructuring costs of $0.4 million were incurred related to these
actions.
During 2013, the Distribution Segment recorded restructuring costs of $0.2 million related to
branch closure and severance costs. The Material Handling Segment incurred costs of $0.2 million
related to severance.
In 2012, restructuring costs of $0.7 million for severance and non-cancelable lease costs were
offset by a gain of $0.8 million on the sale of four facilities in the Distribution Segment. In addition, the
Corporate costs included $0.3 million of restructuring charges related to severance costs.
No accruals remain related to restructuring programs as of December 31, 2014 and 2013. The
accrued liability balance for severance costs was $0.3 million as of December 31, 2012.
7. Other Accrued Expenses
As of December 31, 2014 and 2013, the balance in other accrued expenses is comprised of the
following:
Deposits and amounts due to customers . . . . . . . . . . . . . . . . . . . . . . . . .
Dividends payable . . . . . . . . . . . . . . . . . . . . . . . . . . . . . . . . . . . . . . . . . . .
Accrued litigation and professional fees . . . . . . . . . . . . . . . . . . . . . . . . .
Other accrued expenses . . . . . . . . . . . . . . . . . . . . . . . . . . . . . . . . . . . . . .
58
2014
2013
$10,591
4,267
3,458
7,856
$ 7,474
3,174
289
5,497
$26,172
$16,434
MYERS INDUSTRIES, INC. AND SUBSIDIARIES.
Notes to Consolidated Financial Statements — (Continued)
(Dollar amounts in thousands, except where otherwise indicated)
8. Stock Compensation
The Company’s 2008 Incentive Stock Plan (the “2008 Plan”) authorizes the Compensation
Committee of the Board of Directors to issue up to 3,000,000 shares of various types of stock based
awards including stock options, restricted stock and stock appreciation rights to key employees and
directors. In general, options granted and outstanding vest over a three year period and expire ten
years from the date of grant.
The following tables summarize stock option activity in the past three years:
Options granted in 2014, 2013 and 2012:
Year
2014 . . . . . . . . . . . . . . . . . . . . . . . . . . . . . . . . . . . . . . . . . . . . . . . . . . . . . . .
2013 . . . . . . . . . . . . . . . . . . . . . . . . . . . . . . . . . . . . . . . . . . . . . . . . . . . . . . .
2012 . . . . . . . . . . . . . . . . . . . . . . . . . . . . . . . . . . . . . . . . . . . . . . . . . . . . . . .
Options
Exercise
Price
209,500
323,400
323,950
$20.93
$14.77
$12.96
Options exercised in 2014, 2013 and 2012:
Year
2014 . . . . . . . . . . . . . . . . . . . . . . . . . . . . . . . . . . . . . . . . . . . . . . . .
2013 . . . . . . . . . . . . . . . . . . . . . . . . . . . . . . . . . . . . . . . . . . . . . . . .
2012 . . . . . . . . . . . . . . . . . . . . . . . . . . . . . . . . . . . . . . . . . . . . . . . .
Options
Exercise
Price
228,064
503,321
288,794
$9.97 to $17.02
$8.00 to $18.62
$8.00 to $12.55
In addition, options totaling 43,252, 164,528 and 113,913 expired or were forfeited during the
years ended December 31, 2014, 2013 and 2012, respectively.
Options outstanding and exercisable at December 31, 2014, 2013 and 2012 were as follows:
Year
Outstanding
Range of Exercise
Prices
Exercisable
Weighted Average
Exercise Price
2014 . . . . . . . . . . . . . . . . . . .
2013 . . . . . . . . . . . . . . . . . . .
2012 . . . . . . . . . . . . . . . . . . .
1,512,756
1,574,572
1,919,021
$9.00 to $20.93
$9.00 to $18.62
$8.00 to $18.62
1,066,219
1,057,694
1,355,112
$11.58
$11.48
$11.63
Stock compensation expense reduced income before taxes approximately $3,115, $2,557 and
$2,708 for the years ended December 31, 2014, 2013, and 2012, respectively. These expenses are
included in selling, general and administrative expenses in the accompanying Consolidated
Statements of Operations. Total unrecognized compensation cost related to non-vested share based
compensation arrangements at December 31, 2014 was approximately $3,981 which will be
recognized over the next three years, as such compensation is earned.
The fair value of options granted is estimated using an option pricing model based on
assumptions set forth in the following table. The Company uses historical data to estimate employee
exercise and departure behavior. The risk free interest rate is based on the U.S. Treasury yield curve
in effect at the time of grant and through the expected term. The dividend yield is based on the
59
MYERS INDUSTRIES, INC. AND SUBSIDIARIES.
Notes to Consolidated Financial Statements — (Continued)
(Dollar amounts in thousands, except where otherwise indicated)
Company’s historical dividend yield. The expected volatility is derived from historical volatility of the
Company’s shares and those of similar companies measured against the market as a whole. In 2014,
2013 and 2012, the Company used the binomial lattice option pricing model based on assumptions
set forth in the following table.
2014
Risk free interest rate . . . . . . . . . . . . . . . . . . . . . . . . . . . . . . . .
Expected dividend yield . . . . . . . . . . . . . . . . . . . . . . . . . . . . . .
Expected life of award (years) . . . . . . . . . . . . . . . . . . . . . . . . .
Expected volatility . . . . . . . . . . . . . . . . . . . . . . . . . . . . . . . . . . .
Fair value per option share . . . . . . . . . . . . . . . . . . . . . . . . . . . .
2013
2.80%
2.50%
7.0
50.00%
$ 7.05
2012
1.86%
2.40%
7.0
50.00%
$ 5.39
2.00%
2.20%
5.4
50.00%
$ 4.93
The following table provides a summary of stock option activity for the period ended
December 31, 2014:
Shares
Average
Exercise
Price
Weighted
Average
Life
Aggregate
Intrinsic
Value
Outstanding at December 31, 2013 . . . . . .
Options Granted . . . . . . . . . . . . . . . . . . . .
Options Exercised . . . . . . . . . . . . . . . . . .
Canceled or Forfeited . . . . . . . . . . . . . . .
1,574,572
209,500
(228,064)
(43,252)
$12.14
20.93
12.20
15.74
Outstanding at December 31, 2014 . . . . . .
1,512,756
13.24
5.08 years
$6,590
Exercisable at December 31, 2014 . . . . . .
1,066,219
$11.58
4.47 years
$6,420
The intrinsic value of a stock option is the amount by which the market value of the underlying
stock exceeds the exercise price of the option. The intrinsic value of stock options exercised in 2014,
2013 and 2012 was $1,744, $2,588 and $1,502, respectively.
The following table provides a summary of restricted stock activity for the period ended
December 31, 2014:
Shares
Average
Grant-Date
Fair Value
Unvested shares at December 31, 2013 . . . . . . . . . . . . . . . . . . . . . . .
Granted . . . . . . . . . . . . . . . . . . . . . . . . . . . . . . . . . . . . . . . . . . . . . . . .
Vested . . . . . . . . . . . . . . . . . . . . . . . . . . . . . . . . . . . . . . . . . . . . . . . . .
Forfeited . . . . . . . . . . . . . . . . . . . . . . . . . . . . . . . . . . . . . . . . . . . . . . . .
275,525
104,100
(123,829)
(19,600)
$20.93
11.75
17.34
Unvested shares at December 31, 2014 . . . . . . . . . . . . . . . . . . . . . . .
236,196
$16.78
Restricted stock units are rights to receive shares of common stock, subject to forfeiture and
other restrictions, which vest over a two or three year period. Restricted shares are considered to be
non-vested shares under the accounting guidance for share-based payment and are not reflected as
issued and outstanding shares until the restrictions lapse. At that time, the shares are released to the
grantee and the Company records the issuance of the shares. Restricted stock awards are valued
60
MYERS INDUSTRIES, INC. AND SUBSIDIARIES.
Notes to Consolidated Financial Statements — (Continued)
(Dollar amounts in thousands, except where otherwise indicated)
based on the market price of the underlying shares on the grant date. Compensation expense is
recognized on a straight-line basis over the requisite service period. At December 31, 2014, restricted
stock awards had vesting periods up through March 2017.
9. Contingencies
The Company is a defendant in various lawsuits and a party to various other legal proceedings,
in the ordinary course of business, some of which are covered in whole or in part by insurance.
New Idria Mercury Mine
Effective October 2011, the U.S. Environmental Protection Agency (“EPA”) added the New Idria
Mercury Mine site located near Hollister, California to the Superfund National Priorities List because of
alleged contaminants discharged to California waterways. The New Idria Quicksilver Mining
Company, founded in 1936, and later renamed the New Idria Mining & Chemical Company (“NIMCC”)
owned and/or operated the New Idria Mine through 1976. In 1981 NIMCC, after another name
change, was merged into Buckhorn Metal Products Inc. which was subsequently acquired by Myers
Industries in 1987. The EPA contends that past mining operations have resulted in mercury
contamination and acid mine drainage at the mine site, in the San Carlos Creek, Silver Creek and a
portion of Panoche Creek, and that other downstream locations may also be impacted.
As of the date of this disclosure, no formal claim or allegation relating to the New Idria Mine Site
against the Company or its subsidiary Buckhorn Inc. (“Buckhorn”) has been received. However, since
Buckhorn may be a potentially responsible party (“PRP”) at the New Idria Mercury Mine, the Company
recognized an expense of $1.9 million, on an undiscounted basis, in 2011 related to performing a
remedial investigation and feasibility study to determine the extent of remediation and the screening
of alternatives. Payments of approximately $0.8 million have been incurred and charged against the
reserve classified in Other Liabilities on the Consolidated Statements of Financial Position as of
December 31, 2014. As investigation and remediation proceed, it is likely that adjustments to the
reserved expense will be necessary to reflect new information. Estimates of the Company’s liability
are based on current facts, laws, regulations and technology. Estimates of the Company’s
environmental liabilities are further subject to uncertainties regarding the nature and extent of site
contamination, the range of remediation alternatives available, evolving remediation standards,
imprecise engineering evaluation and cost estimates, the extent of remedial actions that may be
required, the number and financial condition of other PRPs as well as the extent of their responsibility
for the remediation, and the availability of insurance coverage for these expenses. At this time, further
remediation cost estimates are not known and have not been prepared.
In November 2011, the EPA completed an interim removal project at the New Idria Mercury Mine
site. It is expected this removal action will be part of the final remediation strategy for the site.
According to informal reports, EPA’s interim removal project costs were approximately $0.5 million.
The Company and Buckhorn have received indications that the EPA intends to seek recovery of the
costs of this work and other past costs from the Company and Buckhorn and to initiate the
administrative processes whereby the Company and/or Buckhorn would perform the remedial
investigation and feasibility study described above.
61
MYERS INDUSTRIES, INC. AND SUBSIDIARIES.
Notes to Consolidated Financial Statements — (Continued)
(Dollar amounts in thousands, except where otherwise indicated)
Guadelupe River Watershed TMDL
A number of parties, including the Company and its subsidiary, Buckhorn, were identified in a
planning document adopted in October 2008 by the California Regional Water Quality Control Board,
San Francisco Bay Region (“RWQCB”). The planning document relates to the presence of mercury,
including amounts contained in mining wastes, in and around the Guadalupe River Watershed
(“Watershed”) region in Santa Clara County, California and specifically to the development of a “total
maximum daily load” (“TMDL”) for mercury deposits into the Watershed. The RWQCB has since
completed the development and adoption of the Watershed mercury TMDL. Buckhorn has previously
been alleged to be a successor in interest to NIMCC, which owned property and performed mining
operations in a portion of the Watershed area. The Company has not been contacted by the RWQCB
or by other parties who have been involved in Watershed clean-up efforts that have been initiated as
a result of the adoption of the TMDL. Although assertion of a claim by the RWQCB or another party
involved in this clean up effort is reasonably possible, it is not possible at this time to estimate the
amount of any obligation the Company may incur for these cleanup efforts within the Watershed
region, or whether such cost would be material to the Company’s consolidated financial statements.
Other
Buckhorn and Schoeller Arca Systems, Inc. (“SAS”) were plaintiffs in a patent infringement
lawsuit against Orbis Corp. and Orbis Material Handling, Inc. (“Orbis”) for alleged breach by Orbis of
an exclusive patent license agreement from SAS to Buckhorn. SAS is an affiliate of Schoeller Arca
Systems Services B.V. (“SASS B.V.”), a Dutch company. SAS manufactures and sells plastic
returnable packaging systems for material handling. In the course of the litigation, it was discovered
that SAS had given a patent license agreement to a predecessor of Orbis that pre-dated the one that
SAS sold to Buckhorn. As a result, judgment was entered in favor of Orbis, and the court awarded
attorney fees and costs to Orbis in the amount of $3.1 million, plus interest and costs. In May 2014,
Orbis made demand to SAS that SAS pay the judgment in full, and subsequently in July 2014, Orbis
made the same demand to Buckhorn. Although the range of exposure is $0 - $3.1 million, plus
interest, Buckhorn’s responsibility as a co-judgment debtor is not specified. Buckhorn believes it is
not responsible for any of the award because it is not a party to the Orbis license and will continue to
aggressively pursue any and all legal actions both with respect to appealing the award requesting
SAS be named solely responsible for payment of the judgment, as well as pursuing SAS and SASS
B.V. for fraudulently selling an exclusive patent license they could not sell. In August 2014, SASS B.V.
informed Buckhorn that SAS may not have the financial ability to pay the judgment and provided
financial statements to Buckhorn indicating SAS is in financial distress and while SASS B.V is
financially stable, the award is against SAS, not SASS B.V. Given the uncertainty of SAS’s financial
ability to meet the obligation and the judgment is joint and several, Myers has recorded an expense of
$3.0 million during 2014 for the entire amount of the unpaid judgment, despite the belief we will
ultimately be successful in the appeal and suing SAS and SASS B.V. The matter is presently under
appeal and Buckhorn is also suing SAS and SASS B.V.
When management believes that a loss arising from these matters is probable and can
reasonably be estimated, we record the amount of the estimated loss, or the minimum estimated
liability when the loss is estimated using a range, and no point within the range is more probable of
occurrence than another. As additional information becomes available, any potential liability related to
these matters will be assessed and the estimates will be revised, if necessary.
62
MYERS INDUSTRIES, INC. AND SUBSIDIARIES.
Notes to Consolidated Financial Statements — (Continued)
(Dollar amounts in thousands, except where otherwise indicated)
Based on current available information, management believes that the ultimate outcome of these
matters will not have a material adverse effect on our financial position, cash flows or overall trends in
our results of operations. However, these matters are subject to inherent uncertainties, and
unfavorable rulings could occur. If an unfavorable ruling were to occur, there exists the possibility of a
material adverse impact on the financial position and results of operations of the period in which the
ruling occurs, or in future periods.
10. Long-Term Debt and Loan Agreements
Long-term debt at December 31, 2014 and 2013 consisted of the following:
2014
2013
Loan Agreement . . . . . . . . . . . . . . . . . . . . . . . . . . . . . . . . . . . . . . . . . . . .
4.67% Senior Unsecured Notes due 2021 . . . . . . . . . . . . . . . . . . . . . . .
5.25% Senior Unsecured Notes due 2024 . . . . . . . . . . . . . . . . . . . . . . .
5.30% Senior Unsecured Notes due 2024 . . . . . . . . . . . . . . . . . . . . . . .
5.45% Senior Unsecured Notes due 2026 . . . . . . . . . . . . . . . . . . . . . . .
$137,109
40,000
11,000
29,000
20,000
$34,200
—
11,000
—
—
Less unamortized deferred financing costs . . . . . . . . . . . . . . . . . . . . . .
237,109
680
45,200
853
$236,429
$44,347
On December 13, 2013, the Company entered into a Fourth Amended and Restated Loan
Agreement (the “Loan Agreement”). The Loan Agreement provided for a $200 million senior revolving
credit facility expiring on December 13, 2018, which replaced the then existing $180 million facility. In
addition, on May 30, 2014, the Company entered into a First Amendment to the Loan Agreement (the
“Loan Amendment”). The Loan Amendment increased the senior revolving credit facility from $200
million to $300 million through December 2018 and provided for an additional subsidiary of the
Company as a borrower and as a guarantor of the credit facility. On July 2, 2014, the Company
borrowed approximately $135.3 million under the Loan Agreement to fund the acquisition of Scepter.
Amounts borrowed under the agreement are secured by pledges of stock of certain of our foreign
and domestic subsidiaries.
Under the terms of the Loan Agreement, the Company may borrow up to $300 million, reduced
for letters of credit issued. As of December 31, 2014, the Company had $158.6 million available under
the Loan Agreement. The Company also had $4.3 million of letters of credit issued related to
insurance and other financing contracts in the ordinary course of business at December 31, 2014.
Borrowings under the Loan Agreement bear interest at the LIBOR rate, prime rate, federal funds
effective rate, the Canadian deposit offered rate, or the eurocurrency reference rate depending on the
type of loan requested by the Company, in each case plus the applicable margin as set forth in the
Loan Agreement. The average interest rate on borrowings under our loan agreements were 4.00%
percent at December 31, 2014 and 3.71% percent at December 31, 2013, which includes a quarterly
facility fee on the used and unused portion.
On October 22, 2013, the Company entered into a note purchase agreement for the private
placement of Senior Unsecured Notes totaling $100 million with a group of investors. The four series
of notes range in face value from $11 million to $40 million, with interest rates ranging from 4.67% to
63
MYERS INDUSTRIES, INC. AND SUBSIDIARIES.
Notes to Consolidated Financial Statements — (Continued)
(Dollar amounts in thousands, except where otherwise indicated)
5.45%, payable semiannually, and expiring between 2021 and 2026. At December 31, 2013, the
Company had received $11 million of its 5.25% Senior Unsecured Notes due January 15, 2024 under
the note purchase agreement. The remaining proceeds of $89 million under the note purchase
agreement were subsequently received in January 2014. At December 31, 2014, $100 million was
outstanding.
Long-term debt of $236.4 million at December 31, 2014 includes $0.7 million of unamortized
deferred financing costs, which is accounted for as a debt valuation account. Amounts outstanding at
December 31, 2014 under the Loan Agreement and note purchase agreement mature in 2018 and
2021 to 2026, respectively.
As of December 31, 2014, the Company was in compliance with all of its debt covenants
associated with its Loan Agreement and Senior Unsecured Notes. The significant financial covenants
include an interest coverage ratio, defined as earnings before interest , taxes, depreciation and
amortization divided by interest expense, and a leverage ratio, defined as earnings before interest,
taxes, depreciation, and amortization, as adjusted, compared to total debt. The ratios as of
December 31, 2014 are shown in the following table:
Required Level
Interest Coverage Ratio . . . . . . . . . . . . . . . . . . . . . . . .
Leverage Ratio . . . . . . . . . . . . . . . . . . . . . . . . . . . . . . .
Actual Level
3.00 to 1 (minimum)
3.25 to 1 (maximum)
10.14
2.78
11. Income Taxes
The effective tax rate from continuing operations was 36.4% in 2014, 33.5% in 2013 and 37.2% in
2012. A reconciliation of the Federal statutory income tax rate to the Company’s effective tax rate is as
follows:
Percent of Income before
Income Taxes
2014
2013
2012
Statutory Federal income tax rate . . . . . . . . . . . . . . . . . . . . . . . . . . . .
State income taxes — net of Federal tax benefit . . . . . . . . . . . . . . . .
Foreign tax rate differential . . . . . . . . . . . . . . . . . . . . . . . . . . . . . . . . .
Domestic production deduction . . . . . . . . . . . . . . . . . . . . . . . . . . . . .
Non-deductible expenses . . . . . . . . . . . . . . . . . . . . . . . . . . . . . . . . . .
Changes in unrecognized tax benefits . . . . . . . . . . . . . . . . . . . . . . . .
Foreign tax incentives . . . . . . . . . . . . . . . . . . . . . . . . . . . . . . . . . . . . . .
Valuation allowances . . . . . . . . . . . . . . . . . . . . . . . . . . . . . . . . . . . . . .
Other . . . . . . . . . . . . . . . . . . . . . . . . . . . . . . . . . . . . . . . . . . . . . . . . . . .
35.0%
(4.5)
1.8
(6.6)
7.0
(2.5)
(3.0)
9.0
0.2
35.0%
2.9
(0.2)
(3.1)
1.3
(0.2)
(2.2)
—
—
35.0%
4.6
0.5
(3.0)
1.0
(0.9)
(1.4)
0.8
0.6
Effective tax rate for the year . . . . . . . . . . . . . . . . . . . . . . . . . . . . . . . .
36.4%
33.5%
37.2%
Income from continuing operations before income taxes was attributable to the following sources:
2014
2013
2012
United States . . . . . . . . . . . . . . . . . . . . . . . . . . . . . . . . . . . . . .
Foreign . . . . . . . . . . . . . . . . . . . . . . . . . . . . . . . . . . . . . . . . . . .
$21,074
(6,991)
$38,089
1,696
$42,021
175
Totals . . . . . . . . . . . . . . . . . . . . . . . . . . . . . . . . . . . . . . . . . . . .
$14,083
$39,785
$42,196
64
MYERS INDUSTRIES, INC. AND SUBSIDIARIES.
Notes to Consolidated Financial Statements — (Continued)
(Dollar amounts in thousands, except where otherwise indicated)
Income tax expense (benefit) from continuing operations consisted of the following:
Current
Federal . . . . . . . . . . . . . . . .
Foreign . . . . . . . . . . . . . . . .
State and local . . . . . . . . . .
2014
Deferred
2013
2012
Current
Deferred
Current
Deferred
$8,298
(277)
(234)
$(1,208)
(710)
(747)
$13,273
629
2,170
$(1,413)
(920)
(396)
$11,871
339
2,876
$ 896
(389)
96
$7,787
$(2,665)
$16,072
$(2,729)
$15,086
$ 603
Significant components of the Company’s deferred taxes as of December 31, 2014 and 2013 are
as follows:
Deferred income tax liabilities
Property, plant and equipment . . . . . . . . . . . . . . . . . . . . . . . . . . . . . . .
Tax-deductible goodwill . . . . . . . . . . . . . . . . . . . . . . . . . . . . . . . . . . . . .
Non-deductible intangibles . . . . . . . . . . . . . . . . . . . . . . . . . . . . . . . . . .
State deferred taxes . . . . . . . . . . . . . . . . . . . . . . . . . . . . . . . . . . . . . . . .
Other . . . . . . . . . . . . . . . . . . . . . . . . . . . . . . . . . . . . . . . . . . . . . . . . . . . .
2014
2013
$11,629
7,728
1,843
687
483
$11,136
7,890
2,313
1,150
446
22,370
22,935
Deferred income tax assets
Compensation . . . . . . . . . . . . . . . . . . . . . . . . . . . . . . . . . . . . . . . . . . . . .
Inventory valuation . . . . . . . . . . . . . . . . . . . . . . . . . . . . . . . . . . . . . . . . .
Allowance for uncollectible accounts . . . . . . . . . . . . . . . . . . . . . . . . . .
Non-deductible accruals . . . . . . . . . . . . . . . . . . . . . . . . . . . . . . . . . . . .
Other . . . . . . . . . . . . . . . . . . . . . . . . . . . . . . . . . . . . . . . . . . . . . . . . . . . .
Net operating loss carryforwards . . . . . . . . . . . . . . . . . . . . . . . . . . . . .
6,716
636
260
2,631
15
5,050
5,982
602
452
1,956
108
3,655
Valuation Allowance . . . . . . . . . . . . . . . . . . . . . . . . . . . . . . . . . . . . . . . . . .
15,308
(4,326)
12,755
(4,264)
10,982
8,491
$11,388
$14,444
Net deferred income tax liability . . . . . . . . . . . . . . . . . . . . . . . . . . . . . . . .
ASC 740 Income Taxes requires that deferred tax assets be reduced by a valuation allowance, if
based on all available evidence, it is more likely than not that the deferred tax asset will not be
realized. Available evidence includes the reversal of existing taxable temporary differences, future
taxable income exclusive of temporary differences, taxable income in carryback years and tax
planning strategies. At December 31, 2014, the Company has deferred tax assets of $5.1 million
resulting from foreign net operating tax loss carryforwards, as well as $4.3 million of related valuation
allowances, primarily from Brazil of approximately $14.9 million. These net operating tax loss
carryforwards will begin to expire in 2034.
No provision has been recorded for unremitted earnings of foreign subsidiaries as it is the
Company’s intention to indefinitely reinvest the earnings of those subsidiaries. Accordingly, at
December 31, 2014, the Company had not recorded a deferred tax liability related to investments in
its foreign subsidiaries that are essentially permanent in duration. The amount of such temporary
65
MYERS INDUSTRIES, INC. AND SUBSIDIARIES.
Notes to Consolidated Financial Statements — (Continued)
(Dollar amounts in thousands, except where otherwise indicated)
differences was estimated to be approximately $15.9 million and may become taxable in the U.S.
upon a repatriation of assets or a sale or liquidation of the subsidiaries. It is not practical to estimate
the related amount of unrecognized tax liability.
The following table summarizes the activity related to the Company’s unrecognized tax benefits:
2014
2013
2012
Balance at January 1 . . . . . . . . . . . . . . . . . . . . . . . . . . . . . . . . . . . . . . . . . $ 840 $910 $1,049
Increases related to current year tax positions . . . . . . . . . . . . . . . . . .
—
—
—
Increases related to acquired businesses . . . . . . . . . . . . . . . . . . . . . .
—
—
236
Increases related to previous year tax positions . . . . . . . . . . . . . . . . .
5
—
580
Reductions due to lapse of applicable statute of limitations . . . . . . . . (362) (48)
(256)
Reduction due to settlements . . . . . . . . . . . . . . . . . . . . . . . . . . . . . . . .
—
(22)
(699)
Balance at December 31 . . . . . . . . . . . . . . . . . . . . . . . . . . . . . . . . . . . . . . $ 483 $840 $ 910
The total amount of gross unrecognized tax benefits that would reduce the Company’s effective
tax rate was $0.5 million, $0.8 million and $0.9 million at December 31, 2014, 2013 and 2012,
respectively. The amount of accrued interest expense included as a liability within the Company’s
Consolidated Statements of Financial Position was $0.1 million as of each of December 31, 2014,
2013 and 2012. The December 31, 2014 balance of unrecognized tax benefits includes
approximately $0.5 million of unrecognized tax benefits for which it is reasonably possible that they
will be recognized within the next twelve months. This amount represents a decrease in unrecognized
benefits related to state income tax audits, and expiring statutes in U.S. Federal, state, and Non-U.S.
jurisdictions.
The Company and its subsidiaries file U.S. Federal, state and local, and non-U.S. income tax
returns. As of December 31, 2014 the Company is no longer subject to U.S. Federal and state
examinations by tax authorities for tax years before 2011 and 2010, respectively. In addition, the
Company is subject to non-U.S. income tax examinations for tax years of 2009 through 2014.
12. Retirement Plans
The Company and certain of its subsidiaries have pension and profit sharing plans covering
substantially all of their employees. The Company’s frozen defined benefit pension plan (“The Pension
Agreement between Akro-Mils and United Steelworkers of America Local No. 1761-02”) provides
benefits primarily based upon a fixed amount for each year of service as defined.
Net periodic pension cost for the years ended December 31, 2014, 2013 and 2012 was as
follows:
2014
Underfunded
2013
Underfunded
2012
Underfunded
Interest cost . . . . . . . . . . . . . . . . . . . . . . . . . . . . . . .
Expected return on assets . . . . . . . . . . . . . . . . . . .
Amortization of net loss . . . . . . . . . . . . . . . . . . . . . .
$ 280
(371)
45
$ 259
(333)
111
$ 287
(236)
101
Net periodic pension cost . . . . . . . . . . . . . . . . . . . .
$ (46)
$ 37
$ 152
66
MYERS INDUSTRIES, INC. AND SUBSIDIARIES.
Notes to Consolidated Financial Statements — (Continued)
(Dollar amounts in thousands, except where otherwise indicated)
The reconciliation of changes in projected benefit obligations are as follows:
2014
2013
Accumulated benefit obligation at beginning of year . . . . . . . . . . . . . . . . .
Interest cost . . . . . . . . . . . . . . . . . . . . . . . . . . . . . . . . . . . . . . . . . . . . . . . . .
Actuarial (gain) loss . . . . . . . . . . . . . . . . . . . . . . . . . . . . . . . . . . . . . . . . . .
Expenses paid . . . . . . . . . . . . . . . . . . . . . . . . . . . . . . . . . . . . . . . . . . . . . .
Benefits paid . . . . . . . . . . . . . . . . . . . . . . . . . . . . . . . . . . . . . . . . . . . . . . . .
$6,150
280
1,235
(95)
(403)
$7,109
259
(738)
(74)
(406)
Accumulated benefit obligation at end of year . . . . . . . . . . . . . . . . . . . . . .
$7,167
$6,150
The assumptions used to determine the net periodic benefit cost and benefit obligations are as
follows:
Discount rate for net periodic pension cost . . . . . . . . . . . . . . . . . . .
Discount rate for benefit obligations . . . . . . . . . . . . . . . . . . . . . . . . .
Expected long-term return of plan assets . . . . . . . . . . . . . . . . . . . .
2014
2013
2012
4.70%
3.90%
8.00%
3.75%
4.70%
8.00%
4.50%
3.75%
8.00%
The expected long-term rate of return assumption is based on the actual historical rate of return
on assets adjusted to reflect recent market conditions and future expectations consistent with the
Company’s current asset allocation and investment policy. This policy provides for aggressive capital
growth balanced with moderate income production. The inherent risks of equity exposure exists,
however, returns generally are less volatile than maximum growth programs. The assumed discount
rates represent long-term high quality corporate bond rates commensurate with the liability duration of
its plan.
The following table reflects the change in the fair value of the plan’s assets:
2014
2013
Fair value of plan assets at beginning of year . . . . . . . . . . . . . . . . . . . . . . .
Actual return on plan assets . . . . . . . . . . . . . . . . . . . . . . . . . . . . . . . . . . .
Company contributions . . . . . . . . . . . . . . . . . . . . . . . . . . . . . . . . . . . . . . .
Expenses paid . . . . . . . . . . . . . . . . . . . . . . . . . . . . . . . . . . . . . . . . . . . . . .
Benefits paid . . . . . . . . . . . . . . . . . . . . . . . . . . . . . . . . . . . . . . . . . . . . . . . .
$5,577
316
318
(95)
(403)
$4,528
1,165
364
(74)
(406)
Fair value of plan assets at end of year . . . . . . . . . . . . . . . . . . . . . . . . . . . .
$5,713
$5,577
The fair value of plan assets are all categorized as level 1 and were determined based on period
end closing prices in active markets. The weighted average asset allocations at December 31, 2014
and 2013 are as follows:
2014
U.S. Equities securities . . . . . . . . . . . . . . . . . . . . . . . . . . . . . . . . . . . . . . . . . . . . . .
U.S. Debt securities . . . . . . . . . . . . . . . . . . . . . . . . . . . . . . . . . . . . . . . . . . . . . . . . .
Cash . . . . . . . . . . . . . . . . . . . . . . . . . . . . . . . . . . . . . . . . . . . . . . . . . . . . . . . . . . . . .
Total . . . . . . . . . . . . . . . . . . . . . . . . . . . . . . . . . . . . . . . . . . . . . . . . . . . . . . . . . . . . . .
67
82%
17%
1%
2013
82%
17%
1%
100% 100%
MYERS INDUSTRIES, INC. AND SUBSIDIARIES.
Notes to Consolidated Financial Statements — (Continued)
(Dollar amounts in thousands, except where otherwise indicated)
The following table provides a reconciliation of the funded status of the plan at December 31,
2014 and 2013:
2014
2013
Projected benefit obligation . . . . . . . . . . . . . . . . . . . . . . . . . . . . . . . . . . . . .
Plan assets at fair value . . . . . . . . . . . . . . . . . . . . . . . . . . . . . . . . . . . . . . . .
$ 7,167
5,713
$6,150
5,577
Funded status . . . . . . . . . . . . . . . . . . . . . . . . . . . . . . . . . . . . . . . . . . . . . . . .
$(1,454)
$ (573)
The funded status shown above is included in other long-term liabilities in the Company’s
Consolidated Statements of Financial Position at December 31, 2014 and 2013. The Company
expects to make a contribution of $288 to the plan in 2015.
Benefit payments projected for the plan are as follows:
2015 . . . . . . . . . . . . . . . . . . . . . . . . . . . . . . . . . . . . . . . . . . . . . . . . . .
2016 . . . . . . . . . . . . . . . . . . . . . . . . . . . . . . . . . . . . . . . . . . . . . . . . . .
2017 . . . . . . . . . . . . . . . . . . . . . . . . . . . . . . . . . . . . . . . . . . . . . . . . . .
2018 . . . . . . . . . . . . . . . . . . . . . . . . . . . . . . . . . . . . . . . . . . . . . . . . . .
2019 . . . . . . . . . . . . . . . . . . . . . . . . . . . . . . . . . . . . . . . . . . . . . . . . . .
2020-2024 . . . . . . . . . . . . . . . . . . . . . . . . . . . . . . . . . . . . . . . . . . . . .
$ 387
385
381
373
379
1,936
Effective January 1, 2012 the Company changed its profit sharing and 401(k) plan which
included an increase in the Company’s matching contributions and the frequency of the Company’s
match. The Myers Industries Profit Sharing and 401(k) Plan is maintained for the Company’s U.S.
based employees, not covered under defined benefit plans, who have met eligibility service
requirements. The Company recognized expense related to the 401(k) employer matching
contribution in the amount of $3,018, $2,802 and $2,609 in 2014, 2013 and 2012, respectively.
In addition, the Company has a Supplemental Executive Retirement Plan (“SERP”) to provide
certain participating senior executives with retirement benefits in addition to amounts payable under
the 401(k) plan. Expense (income) related to the SERP was approximately $402, $(152), and $477 for
the years ended December 2014, 2013 and 2012, respectively. The SERP liability was based on the
discounted present value of expected future benefit payments using a discount rate of 3.90% at
December 31, 2014 and 4.70% at December 31, 2013. The SERP liability was approximately $4,280
and $4,270 at December 31, 2014 and 2013, respectively, and is included in Accrued Employee
Compensation and Other Long-Term Liabilities on the accompanying Consolidated Statements of
Financial Position. The SERP is unfunded.
13. Leases
The Company and certain of its subsidiaries are committed under non-cancelable operating
leases involving certain facilities and equipment. Aggregate rental expense for all leased assets was
$4,708, $4,199 and $3,421 for the years ended December 31, 2014, 2013 and 2012, respectively.
68
MYERS INDUSTRIES, INC. AND SUBSIDIARIES.
Notes to Consolidated Financial Statements — (Continued)
(Dollar amounts in thousands, except where otherwise indicated)
Future minimum rental commitments are as follows:
Year Ended December 31,
Commitment
2015 . . . . . . . . . . . . . . . . . . . . . . . . . . . . . . . . . . . . . . . . . . . . . . .
2016 . . . . . . . . . . . . . . . . . . . . . . . . . . . . . . . . . . . . . . . . . . . . . . .
2017 . . . . . . . . . . . . . . . . . . . . . . . . . . . . . . . . . . . . . . . . . . . . . . .
2018 . . . . . . . . . . . . . . . . . . . . . . . . . . . . . . . . . . . . . . . . . . . . . . .
2019 . . . . . . . . . . . . . . . . . . . . . . . . . . . . . . . . . . . . . . . . . . . . . . .
Thereafter . . . . . . . . . . . . . . . . . . . . . . . . . . . . . . . . . . . . . . . . . .
$ 4,861
3,864
2,000
314
3
3,958
Total . . . . . . . . . . . . . . . . . . . . . . . . . . . . . . . . . . . . . . . . . . . . . . .
$15,000
14. Industry Segments
During 2014, the Company realigned its reportable segments as a result of organizational
changes to better support its ongoing business strategy. The realignment is consistent with the
manner in which our Chief Operating Decision Maker evaluates performance and makes resource
allocation decisions. Using the criteria of ASC 280 Segment Reporting, the Company currently
manages its business under two operating segments: Material Handling and Distribution. Certain
business units that formerly reported in the Engineered Products Segment are now part of the Material
Handling and Distribution Segments. Historical segment information reflects the effect of these
changes. Each of these operating segments is also a reportable segment under the ASC 280 criteria.
None of the reportable segments include operating segments that have been aggregated. Some
of these segments contain individual business components that have been combined on the basis of
common management, customers, products, production processes and other economic
characteristics. The Company accounts for intersegment sales and transfers at cost plus a specified
mark-up.
The Material Handling Segment manufactures a broad selection of plastic reusable containers,
pallets, small parts bins, bulk shipping containers, storage and organization products and rotationallymolded plastic tanks for water, fuel and waste handling. This segment conducts its primary
operations in the United States, but also operates in Brazil and Canada. Markets served encompass
various niches of industrial manufacturing, food processing, retail/wholesale products distribution,
agriculture, automotive, recreational vehicles, marine vehicles, healthcare, appliance, bakery,
electronics, textiles, consumer, and others. Products are sold both directly to end-users and through
distributors.
The Distribution Segment is engaged in the distribution of equipment, tools, and supplies used
for tire servicing and automotive undervehicle repair and the manufacture of tire repair and retreading
products. The product line includes categories such as tire valves and accessories, tire changing and
balancing equipment, lifts and alignment equipment, service equipment and tools, and tire repair/
retread supplies. The Distribution Segment operates domestically through sales offices, and four
regional distribution centers in the United States and in foreign countries through export sales. In
addition, the Distribution Segment operates directly in certain foreign markets, principally Central
America, through foreign branch operations. Markets served include retail and truck tire dealers,
commercial auto and truck fleets, auto dealers, general service and repair centers, tire retreaders,
and government agencies.
69
MYERS INDUSTRIES, INC. AND SUBSIDIARIES.
Notes to Consolidated Financial Statements — (Continued)
(Dollar amounts in thousands, except where otherwise indicated)
Total sales from foreign business units and export to countries outside the U.S. were
approximately $110.4 million, $95.1 million, and $81.0 million for the years ended December 31, 2014,
2013 and 2012, respectively. Sales made to customers in Brazil accounted for approximately 7.3% of
total net sales in 2014, 8.2% in 2013 and 5.3% in 2012. Sales made to customers in Canada
accounted for approximately 4.2% of total net sales in 2014, 3.3% in 2013 and 4.4% in 2012.There are
no other individual foreign countries for which sales are material. Long-lived assets in foreign
countries, consisting of property, plant and equipment, were approximately $44.8 million at
December 31, 2014 and $16.9 million at December 31, 2013. The increase in long-lived assets in
foreign countries is mainly the result of assets acquired with the Scepter acquisition.
2014
Net Sales
Material Handling . . . . . . . . . . . . . . . . . . . . . . . . . . . . . . . . . . . . . . . . .
Distribution . . . . . . . . . . . . . . . . . . . . . . . . . . . . . . . . . . . . . . . . . . . . . . .
Intra-segment elimination . . . . . . . . . . . . . . . . . . . . . . . . . . . . . . . . . . .
2013
2012
$432,054 $380,605 $337,474
191,873
204,460
208,567
(278)
(332)
(469)
$623,649 $584,733 $545,572
Income from Continuing Operations Before Income Taxes
Material Handling . . . . . . . . . . . . . . . . . . . . . . . . . . . . . . . . . . . . . . . . .
Distribution . . . . . . . . . . . . . . . . . . . . . . . . . . . . . . . . . . . . . . . . . . . . . . .
Corporate . . . . . . . . . . . . . . . . . . . . . . . . . . . . . . . . . . . . . . . . . . . . . . . .
Interest expense - net . . . . . . . . . . . . . . . . . . . . . . . . . . . . . . . . . . . . . .
$ 31,903 $ 47,428 $ 51,296
16,024
21,727
22,582
(25,309) (24,839) (27,352)
(8,535)
(4,531)
(4,330)
$ 14,083 $ 39,785 $ 42,196
Identifiable Assets
Material Handling . . . . . . . . . . . . . . . . . . . . . . . . . . . . . . . . . . . . . . . . .
Distribution . . . . . . . . . . . . . . . . . . . . . . . . . . . . . . . . . . . . . . . . . . . . . . .
Corporate . . . . . . . . . . . . . . . . . . . . . . . . . . . . . . . . . . . . . . . . . . . . . . . .
Discontinued Operations . . . . . . . . . . . . . . . . . . . . . . . . . . . . . . . . . . .
$370,501 $240,897 $254,165
57,523
63,340
56,674
19,034
4,652
7,796
117,775
160,568
166,221
$564,833 $469,457 $484,856
Capital Additions, Net
Material Handling . . . . . . . . . . . . . . . . . . . . . . . . . . . . . . . . . . . . . . . . .
Distribution . . . . . . . . . . . . . . . . . . . . . . . . . . . . . . . . . . . . . . . . . . . . . . .
Corporate . . . . . . . . . . . . . . . . . . . . . . . . . . . . . . . . . . . . . . . . . . . . . . . .
$ 22,197 $ 18,787 $ 18,199
1,786
915
1,086
187
1,007
576
$ 24,170 $ 20,709 $ 19,861
Depreciation and Amortization
Material Handling . . . . . . . . . . . . . . . . . . . . . . . . . . . . . . . . . . . . . . . . .
Distribution . . . . . . . . . . . . . . . . . . . . . . . . . . . . . . . . . . . . . . . . . . . . . . .
Corporate . . . . . . . . . . . . . . . . . . . . . . . . . . . . . . . . . . . . . . . . . . . . . . . .
$ 29,013 $ 21,728 $ 18,034
1,022
859
786
1,137
941
656
$ 31,172 $ 23,528 $ 19,476
70
MYERS INDUSTRIES, INC. AND SUBSIDIARIES.
Notes to Consolidated Financial Statements — (Continued)
(Dollar amounts in thousands, except where otherwise indicated)
15. Summarized Quarterly Results of Operations (Unaudited)
Thousands of Dollars, Except Per Share Data
Quarter Ended 2014
March-31
June-30
September-30 December-31
Net Sales . . . . . . . . . . . . . . . . . . . . . . . . . . . . . $150,485 $152,784
Gross Profit . . . . . . . . . . . . . . . . . . . . . . . . . . . . 42,071
42,532
Net income (loss) from continuing
operations(1) . . . . . . . . . . . . . . . . . . . . . . . . . . .
4,763
6,327
Income (loss) from discontinued operations,
net(2) . . . . . . . . . . . . . . . . . . . . . . . . . . . . . . . .
(4,083) $
(578)
Net income (loss)(1) . . . . . . . . . . . . . . . . . . . . . .
680
5,749
Income (loss) per common share from
continuing operations:
Basic* . . . . . . . . . . . . . . . . . . . . . . . . . . . . . . $
0.14 $
0.20
Diluted* . . . . . . . . . . . . . . . . . . . . . . . . . . . . . $
0.14 $
0.19
Income (loss) per common share from
discontinued operations:
Basic* . . . . . . . . . . . . . . . . . . . . . . . . . . . . . . $ (0.12) $ (0.02)
Diluted* . . . . . . . . . . . . . . . . . . . . . . . . . . . . . $ (0.12) $ (0.02)
Net income (loss) per share:
Basic* . . . . . . . . . . . . . . . . . . . . . . . . . . . . . . $
0.02 $
0.18
Diluted* . . . . . . . . . . . . . . . . . . . . . . . . . . . . . $
0.02 $
0.17
Quarter Ended 2013(3)
Net Sales . . . . . . . . . . . . . . . . . . . . . . . . . . . . .
Gross Profit . . . . . . . . . . . . . . . . . . . . . . . . . . . .
Net income from continuing operations . . . . . . .
Income (loss) from discontinued operations,
net . . . . . . . . . . . . . . . . . . . . . . . . . . . . . . . . . . .
Net income . . . . . . . . . . . . . . . . . . . . . . . . . . . . . .
Income per common share from continuing
operations:
Basic* . . . . . . . . . . . . . . . . . . . . . . . . . . . . . .
Diluted* . . . . . . . . . . . . . . . . . . . . . . . . . . . . .
Income (loss) per common share from
discontinued operations:
Basic* . . . . . . . . . . . . . . . . . . . . . . . . . . . . . .
Diluted* . . . . . . . . . . . . . . . . . . . . . . . . . . . . .
Net income (loss) per share:
Basic* . . . . . . . . . . . . . . . . . . . . . . . . . . . . . .
Diluted* . . . . . . . . . . . . . . . . . . . . . . . . . . . . .
March-31
June-30
$162,109
39,961
$
$
$
$
$
$
1,489 $
(0.11) $
(0.11) $
0.05 $
0.05 $
0.28
0.27
$
$
(0.44) $
(0.44) $
(0.55)
(0.54)
(0.09) $
(0.09) $
(0.39) $
(0.39) $
(0.27)
(0.27)
0.02
0.02
September-30 December-31
907
8,312
$
$
0.18 $
0.17 $
0.22 $
0.22 $
$
$
0.06 $
0.06 $
0.03 $
0.03 $
$
$
0.24 $
0.23 $
0.25 $
0.25 $
8,961
875
(13,856) $ (17,642)
(2,743) $ (12,367) $ (8,681)
$144,944 $153,623 $141,442
42,085
45,008
42,518
5,796
7,405
6,859
2,087
7,883
$158,271 $623,649
36,715 161,279
(3,618) $
$
Total
$144,724 $584,733
39,943 169,554
6,382
26,442
(371)
6,488
0.20
0.20
Total
(3,063)
3,319
(440)
26,002
$
$
0.19 $
0.19 $
0.78
0.77
(0.01) $
(0.01) $
(0.09) $
(0.09) $
(0.01)
(0.01)
0.10 $
0.10 $
0.77
0.76
0.19
0.19
$
$
(1) During the quarter ended December 31, 2014, the Company recorded out of period, after-tax
charges totaling approximately $3.2 million, of which approximately $1.8 million related to periods
prior to 2014 primarily as a result of adjustments identified related to inventory and fixed assets at
its Brazilian operations within the Material Handling Segment. The Company concluded such
adjustments were not material to its consolidated financial statements for any previously reported
interim period within 2014 or for any annual period impacted by such adjustments prior to 2014.
71
MYERS INDUSTRIES, INC. AND SUBSIDIARIES.
Notes to Consolidated Financial Statements — (Continued)
(Dollar amounts in thousands, except where otherwise indicated)
(2) During the quarter ended December 31, 2014, the Company recorded an $18.9 million
impairment charge attributable to assets held-for-sale at year end. Refer to Note 4 to the
Consolidated Financial Statements.
(3) Historical information has been updated to reflect discontinued operations presentation.
*
The sum of the earnings per share for the four quarters in a year does not necessarily equal the
total year earnings per share due to the computation of weighted shares outstanding during the
period.
72
ITEM 9. CHANGES IN AND DISAGREEMENTS WITH ACCOUNTANTS ON ACCOUNTING AND
FINANCIAL DISCLOSURE.
None.
ITEM 9A. CONTROLS AND PROCEDURES
Evaluation of Disclosure Controls and Procedures
The Company maintains disclosure controls and procedures, as defined under Rules 13a-15(e)
and 15d-15(e) of the Securities Exchange Act of 1934, as amended, that are designed to ensure that
information required to be disclosed in the Company’s reports under the Securities Exchange Act of
1934 is recorded, processed, summarized and reported within the time periods specified in the
Commission’s rules and forms and that such information is accumulated and communicated to the
Company’s management, including its Chief Executive Officer and Chief Financial Officer, as
appropriate, to allow for timely decisions regarding required disclosure. In designing and evaluating
the disclosure controls and procedures, management recognizes that any controls and procedures,
no matter how well designed and operated, can provide only reasonable assurance of achieving the
desired control objectives, and management is required to apply its judgment in evaluating the costbenefit relationship of possible controls and procedures.
The Company carries out a variety of on-going procedures, under the supervision and with the
participation of the Company’s management, including the Company’s Chief Executive Officer and
Chief Financial Officer, to evaluate the effectiveness of the design and operation of the Company’s
disclosure controls and procedures. Based on the foregoing, the Company’s Chief Executive Officer
and Chief Financial Officer concluded that the Company’s disclosure controls and procedures were
ineffective as of December 31, 2014 due to the material weaknesses in the Company’s internal control
over financial reporting at its Brazilian operations as described below.
Management’s report on internal control over financial reporting, and the report of the
independent registered public accounting firm on internal control over financial reporting are titled
“Management’s Annual Assessment of and Report on Internal Control Over Financial Reporting” and
“Report of Independent Registered Public Accounting Firm”, respectively, and are included herein.
Changes in Internal Control Over Financial Reporting
There have been no changes in our internal control over financial reporting during the period
covered by this report that have materially affected, or are reasonably likely to materially affect, our
internal control over financial reporting.
Management’s Annual Assessment of and Report on Internal Control Over Financial
Reporting
Management is responsible for establishing and maintaining adequate internal control over
financial reporting, as defined in Exchange Act Rule 13a-15(f). The Company’s internal control over
financial reporting is a process designed to provide reasonable assurance regarding the reliability of
financial reporting and the preparation of financial statements for external purposes in accordance
with accounting principles generally accepted in the United States of America.
Because of its inherent limitation, internal control over financial reporting may not prevent or
detect misstatements. Also, projections of any evaluation of effectiveness to future periods are subject
to the risk that controls may become inadequate because of changes in conditions, or that the degree
of compliance with the policies or procedures may deteriorate.
73
Under the supervision and with the participation of management, including the Chief Executive
Officer and Chief Financial Officer, the Company conducted an evaluation of the effectiveness of the
Company’s internal control over financial reporting based on the framework in “Internal Control —
Integrated Framework” issued by the Committee of Sponsoring Organizations of the Treadway
Commission (1992 framework). Based on this assessment, management identified deficiencies in
both the design and operating effectiveness of the Company’s internal control over financial reporting,
which when aggregated, represent two material weaknesses in internal control over (1) the inventory
process at our Brazilian operations and (2) the financial statement close process, including
insufficient management oversight and monitoring of the controls at our Brazilian operations as of
December 31, 2014. Specifically, the management review controls performed at our Brazilian
operations were not performed at an appropriate level of precision and as a result, failed to detect
errors or identify inadequate support for inventory account balances and the inventory costing
process. The financial statement close process at our Brazilian operations lacked sufficient review
controls over account reconciliations and manual journal entries to ensure that account balances and
journal entries were supported by accurate and complete information. Additionally, the financial
statement close process did not include adequately designed controls to provide for sufficient
oversight and monitoring by Segment and Corporate management to detect the errors within our
Brazilian operations resulting from the inadequate review controls over account reconciliations and
journal entries. As a result of these deficiencies, the Company was required to record adjustments to
its 2014 consolidated financial statements. A material weakness is a deficiency, or a combination of
deficiencies, in internal control over financial reporting, such that there is a reasonable possibility that
a material misstatement of our annual or interim financial statements will not be prevented or detected
on a timely basis. As a result of these material weaknesses, management concluded that the
Company did not maintain effective internal control over financial reporting as of December 31, 2014.
Management’s assessment of and conclusion on the effectiveness of internal control over
financial reporting did not include the internal controls of Scepter Corporation Group (“Scepter”),
which is included in the 2014 consolidated financial statements of Myers Industries, Inc. and
Subsidiaries and constituted 27% of total assets as of December 31, 2014 and 6% and 33% of net
sales and net income from continuing operations, respectively, for the year then ended. The Company
acquired Scepter on July 2, 2014.
The effectiveness of the Company’s internal control over financial reporting as of December 31,
2014 has been audited by Ernst & Young LLP, an independent registered public accounting firm, as
stated in their report included herein.
Management’s Remediation Activities
We have taken preliminary steps to address the underlying causes of the deficiencies at our
Brazilian operations. We plan to enhance our complement of resources at our Brazilian operations
with accounting and internal control knowledge through additional hiring and training to implement
and perform additional controls over the preparation and review of account reconciliations and
approval of manual journal entries. We will develop revised policies and procedures associated with
the preparation and retention of supporting documentation for account reconciliations as well as the
review and approval of manual journal entries prior to posting to the general ledger. As it relates to
inventory, we will also enhance current controls or implement new processes, procedures and
controls: i) to adequately complete and review monthly reconciliations of inventory perpetual records
to the general ledger; ii) to address the proper treatment of reconciling items identified related to
inventory; and iii) to ensure the accuracy of the costing of inventory. Finally, we will implement
additional controls to enhance oversight of the financial function in the Brazilian entities and reinforce
the need for open communication as issues arise. We plan to remediate all of the control deficiencies
74
underlying these material weaknesses during 2015. We will continue to monitor the effectiveness of
these and other processes, procedures and controls at our Brazilian operations and will make any
further changes management determines appropriate.
John C. Orr
President and
Chief Executive Officer
Greggory W. Branning
Senior Vice President,
Chief Financial Officer and
Corporate Secretary
75
Report of Independent Registered Public Accounting Firm
The Board of Directors and Shareholders
Myers Industries, Inc.
We have audited Myers Industries, Inc. and Subsidiaries’ internal control over financial reporting
as of December 31, 2014, based on criteria established in Internal Control-Integrated Framework
issued by the Committee of Sponsoring Organizations of the Treadway Commission (1992
Framework) (the COSO criteria). Myers Industries, Inc. and Subsidiaries’ management is responsible
for maintaining effective internal control over financial reporting, and for its assessment of the
effectiveness of internal control over financial reporting included in the accompanying Management’s
Annual Assessment of and Report on Internal Control Over Financial Reporting. Our responsibility is
to express an opinion on the Company’s internal control over financial reporting based on our audit.
We conducted our audit in accordance with the standards of the Public Company Accounting
Oversight Board (United States). Those standards require that we plan and perform the audit to
obtain reasonable assurance about whether effective internal control over financial reporting was
maintained in all material respects. Our audit included obtaining an understanding of internal control
over financial reporting, assessing the risk that a material weakness exists, testing and evaluating the
design and operating effectiveness of internal control based on the assessed risk, and performing
such other procedures as we considered necessary in the circumstances. We believe that our audit
provides a reasonable basis for our opinion.
A company’s internal control over financial reporting is a process designed to provide reasonable
assurance regarding the reliability of financial reporting and the preparation of financial statements for
external purposes in accordance with generally accepted accounting principles. A company’s
internal control over financial reporting includes those policies and procedures that (1) pertain to the
maintenance of records that, in reasonable detail, accurately and fairly reflect the transactions and
dispositions of the assets of the company; (2) provide reasonable assurance that transactions are
recorded as necessary to permit preparation of financial statements in accordance with generally
accepted accounting principles, and that receipts and expenditures of the company are being made
only in accordance with authorizations of management and directors of the company; and (3) provide
reasonable assurance regarding prevention or timely detection of unauthorized acquisition, use or
disposition of the company’s assets that could have a material effect on the financial statements.
Because of its inherent limitations, internal control over financial reporting may not prevent or
detect misstatements. Also, projections of any evaluation of effectiveness to future periods are subject
to the risk that controls may become inadequate because of changes in conditions, or that the degree
of compliance with the policies or procedures may deteriorate.
A material weakness is a deficiency, or a combination of deficiencies, in internal control over
financial reporting, such that there is a reasonable possibility that a material misstatement of the
company’s annual or interim financial statements will not be prevented or detected on a timely basis.
The following material weaknesses have been identified and included in management’s assessment.
Management has identified deficiencies in both the design and operating effectiveness of the
Company’s internal control over financial reporting, which when aggregated, represent two material
weaknesses in internal control over (1) the inventory reconciliation and costing process at its Brazilian
operations and (2) the financial statement close process related to the review of account
reconciliations and manual journal entries including Segment and Corporate management oversight
and monitoring of the controls, at its Brazilian operations as of December 31, 2014.
We also have audited, in accordance with the standards of the Public Company Accounting
Oversight Board (United States), the consolidated statements of financial position of Myers Industries,
76
Inc. and Subsidiaries as of December 31, 2014 and 2013, and the related consolidated statements of
operations, comprehensive income (loss), shareholders’ equity and cash flows for each of the three
years in the period ended December 31, 2014. These material weaknesses were considered in
determining the nature, timing and extent of audit tests applied in our audit of the 2014 consolidated
financial statements, and this report does not affect our report dated March 31, 2015, which
expressed an unqualified opinion on those financial statements.
As indicated in the accompanying Management’s Annual Assessment of and Report on Internal
Control over Financial Reporting, management’s assessment of and conclusion on the effectiveness
of internal control over financial reporting did not include the internal controls of Scepter Corporation
Group (“Scepter”), which is included in the 2014 consolidated financial statements of Myers
Industries, Inc. and Subsidiaries and constituted 27% of total assets as of December 31, 2014, and
6% and 33% of total revenues and net income from continuing operations, respectively, for the year
then ended. Our audit of internal control over financial reporting of Myers Industries, Inc. and
Subsidiaries also did not include an evaluation of the internal control over financial reporting of
Scepter.
In our opinion, because of the effect of the material weaknesses described above on the
achievement of the objectives of the control criteria, Myer Industries, Inc. and Subsidiaries has not
maintained effective internal control over financial reporting as of December 31, 2014, based on the
COSO criteria.
/s/ ERNST & YOUNG LLP
Akron, Ohio
March 31, 2015
77
ITEM 9B. Other Information.
None.
PART III
ITEM 10. Directors and Executive Officers of the Registrant
For information about the directors of the Company, see the sections titled “Nominees”, “Director
Independence”, “Committees of the Board”, Committee Charters and Policies”, Shareholder
Nominations of Director Candidates” and “Corporate Governance Policies” of the Company’s Proxy
Statement filed with the Securities and Exchange Commission for the Company’s annual meeting of
shareholders to be held on April 24, 2015 (“Proxy Statement”), which is incorporated herein by
reference.
Each member of the Company’s Audit Committee is financially literate and independent as
defined under the Company’s Independence Criteria Policy and the independence standards set by
the New York Stock Exchange. The Board has identified Robert A. Stefanko and Robert B. Heisler, Jr.
as “Audit Committee Financial Experts”.
Information about the Executive Officers of Registrant appears in Part I of this Report.
Disclosures by the Company with respect to compliance with Section 16(a) appears under the
section entitled “Section 16(a) Beneficial Ownership Reporting Compliance” in the Proxy Statement,
and is incorporated herein by reference.
For information about our Code of Ethics see the section titled “Corporate Governance Policies”
of our Proxy Statement, which is incorporated herein by reference.
ITEM 11. Executive Compensation
See the sections titled “Executive Compensation and Related Information”, “Compensation
Committee Interlocks and Insider Participation”, “Compensation Committee Report on Executive
Compensation”, “Risk Assessment of Compensation Practices” and “Board Role in Risk Oversight” of
the Proxy Statement, which are incorporated herein by reference.
ITEM 12. Security Ownership of Certain Beneficial Owners and Management
See the sections titled “Security Ownership of Certain Beneficial Owners and Management,” and
“Election of Directors” of the Proxy Statement, which are incorporated herein by reference.
Plan Category
Equity Compensation Plans
Approved by Security Holders(1)
Equity Compensation Plans Not
Approved by Security Holders
Total . . . . . . . . . . . . . . . . . . . . . . . . . . .
(A)
Number of Securities
to be Issued Upon
Exercise of
Outstanding Options,
Warrants and Rights
(B)
Weighted-average
Exercise Price of
Outstanding Options,
Warrants and Rights
(C)
Number of Securities
Remaining Available for
Future Issuance Under
Equity Compensation
Plans (Excluding
Securities Reflected in
Column (A))
1,748,952
$11.46
633,871
–0–
–0–
–0–
1,748,952
633,871
(1) This information is as of December 31, 2014 and includes the 2008 Incentive Stock Plan and
1999 Incentive Stock Plan.
78
ITEM 13. Certain Relationships and Related Transactions
See the sections titled “Policies and Procedures with Respect to Related Party Transactions” and
“Director Independence” of the Proxy Statement, which are incorporated herein by reference.
ITEM 14. Principal Accounting Fees and Services
Required information regarding fees paid to and services provided by the Company’s
independent registered public accounting firm and the pre-approval policies and procedures of the
Audit Committee of the Company’s Board of Directors is set forth under the section titled “Matters
Relating to the Independent Registered Public Accounting Firm” of the Proxy Statement, which is
incorporated herein by reference.
PART IV
ITEM 15. Exhibits, Financial Statement Schedules
The following consolidated financial statements of the Registrant appear in Part II of this Report:
15. (A)(1) Financial Statements
Consolidated Financial Statements of Myers Industries, Inc. and Subsidiaries
Report of Independent Registered Public Accounting Firm
Consolidated Statements of Financial Position As of December 31, 2014 and 2013
Consolidated Statements of Operations For The Years Ended December 31, 2014, 2013 and
2012
Consolidated Statements of Comprehensive Income (Loss) For the Years Ended December 31,
2014, 2013 and 2012
Consolidated Statements of Shareholders’ Equity For The Years Ended December 31, 2014, 2013
and 2012
Consolidated Statements of Cash Flows For The Years Ended December 31, 2014, 2013 and
2012
Notes to Consolidated Financial Statements For The Years Ended December 31, 2014, 2013 and
2012
15. (A)(2) Financial Statement Schedules
All schedules are omitted because they are inapplicable, not required, or because the
information is included in the consolidated financial statements or notes thereto which appear in Part
II of this Report.
79
15. (B) Exhibits
EXHIBIT INDEX
2(a)
Asset Purchase Agreement, dated as of May 30, 2014, among Scepter Corporation, SHI
Properties Inc., CA Acquisition Inc., and Myers Industries, Inc. Reference is made to Exhibit
2.1 to Form 8-K filed with the Commission on July 7, 2014.**
2(b)
Unit Purchase Agreement, dated as of May 30, 2014, among Eco One Holdings, Inc., Crown
US Acquisition Company, and Myers Industries, Inc. Reference is made to Exhibit 2.2 to Form
8-K filed with the Commission on July 7, 2014.**
2(c)
Indemnification Agreement, dated as of May 30, 2014 among Scepter Corporation, SHI
Properties Inc., Eco One Holdings, Inc., Crown US Acquisition Company, and CA Acquisition
Inc. Reference is made to Exhibit 2.3 to Form 8-K filed with the Commission on July 7, 2014.**
2(d)
First Amendment to the Asset Purchase Agreement, Unit Purchase Agreement and
Indemnification Agreement, dated as of July 2, 2014, among Scepter Corporation, SHI
Properties Inc., CA Acquisition Inc., Eco One Holdings, Inc., Crown US Acquisition Company,
and Myers Industries, Inc. Reference is made to Exhibit 2.4 to Form 8-K filed with the
Commission on July 7, 2014.**
3(a)
Myers Industries, Inc. Amended and Restated Articles of Incorporation. Reference is made to
Exhibit 3(a) to Form 10-K filed with the Commission on March 16, 2005.
3(b)
Myers Industries, Inc. Amended and Restated Code of Regulations. Reference is made to
Exhibit 3.1 to Form 8-K filed with the Commission on April 12, 2013.
10(a)
Myers Industries, Inc. Amended and Restated Employee Stock Purchase Plan. Reference is
made to Exhibit 10(a) to Form 10-K filed with the Commission on March 30, 2001.
10(b)
Form of Indemnification Agreement for Directors and Officers. Reference is made to Exhibit
10.1 to Form 10-Q filed with the Commission on May 1, 2009.
10(c)
Myers Industries, Inc. Amended and Restated Dividend Reinvestment and Stock Purchase
Plan. Reference is made to Exhibit 99 to Post-Effective Amendment No. 2 to Form S-3 filed
with the Commission on March 19, 2004.
10(d)
Myers Industries, Inc. Amended and Restated 1999 Incentive Stock Plan. Reference is made
to Exhibit 10(f) to Form 10-Q filed with the Commission on August 9, 2006.*
10(e)
2008 Incentive Stock Plan of Myers Industries, Inc. Reference is made to Exhibit 4.3 to Form
S-8 filed with the Commission on March 17, 2009.*
10(f)
Amendment No. 1 to the 2008 Incentive Stock Plan of Myers Industries, Inc. Reference is
made to Exhibit 10.1 to Form 8-K filed with the Commission on August 3, 2010.*
10(g)
Myers Industries, Inc. Executive Supplemental Retirement Plan. Reference is made to Exhibit
(10)(g) to Form 10-K filed with the Commission on March 26, 2003.*
10(h)
Severance Agreement between Myers Industries, Inc. and John C. Orr effective June 1, 2011.
Reference is made to Exhibit 10.1 to Form 8-K filed with the Commission on March 7, 2011.*
10(i)
Non-Disclosure and Non-Competition Agreement between Myers Industries, Inc. and
John C. Orr dated July 18, 2000. Reference is made to Exhibit 10(j) to Form 10-Q filed with
the Commission on May 6, 2003.*
10(j)
Amendment to the Myers Industries, Inc. Executive Supplemental Retirement Plan
(John C. Orr) effective June 1, 2008. Reference is made to Exhibit 10.2 to Form 8-K filed with
the Commission on June 24, 2008.*
80
EXHIBIT INDEX
10(k)
Severance Agreement between Myers Industries, Inc. and Gregg Branning dated September
1, 2012. Reference is made to Exhibit 10.1 to Form 8-K filed with the Commission on
September 4, 2012.*
10(l)
Third Amendment to the Myers Industries, Inc. Executive Supplemental Retirement Plan
(John C. Orr) effective June 1, 2011. Reference is made to Exhibit 10.2 to Form 8-K filed with
the Commission on March 7, 2011.*
10(m)
Amendment No. 2 to the 2008 Incentive Stock Plan of Myers Industries, Inc. Reference is
made to Exhibit 10(u) to Form 10-K filed with the Commission on March 4, 2013.*
10(n)
Non-Competition and Confidentiality Agreement between Myers Industries, Inc. and Gregg
Branning dated September 1, 2012. Reference is made to Exhibit 10(s) to Form 10-Q filed
with the Commission on May 1, 2013.*
10(o)
Performance Bonus Plan of Myers Industries, Inc. Reference is made to Exhibit 10.1 to Form
8-K filed with the Commission on April 30, 2013.*
10(p)
Note Purchase Agreement between Myers Industries, Inc. and the Note Purchasers, dated
October 22, 2013, regarding the issuance of $40,000,000 of 4.67% Series A Senior Notes due
January 15, 2021, $11,000,000 of 5.25% Series B Senior Notes due January 15, 2024,
$29,000,000 of 5.30% Series C Senior Notes due January 15, 2024, and $20,000,000 of
5.45% Series D Senior Notes due January 15, 2026. Reference is made to Exhibit 4.1 to Form
8-K filed with the Commission on October 24, 2013.
10(q)
Fourth Amended and Restated Loan Agreement among Myers Industries, Inc., MYE Canada
Operations, Inc., the lenders party thereto, and JPMorgan Chase Bank, National Association,
as Agent, dated December 13, 2013. Reference is made to Exhibit 10.1 to Form 8-K filed with
the Commission on December 17, 2013.
10(r)
First Amendment to Fourth Amended and Restated Loan Agreement among Myers Industries,
Inc., the foreign subsidiary borrowers, the lenders party thereto, and JPMorgan Chase Bank,
National Association, as Agent, dated May 30, 2014. Reference is made to Exhibit 10.1 to
Form 8-K filed with the Commission on June 4, 2014.
14
Myers Industries, Inc. Code of Ethics and Business Conduct. Reference is made to Exhibit 14
to Form 8-K filed with the Commission on March 11, 2014.
21
List of Direct and Indirect Subsidiaries, and Operating Divisions, of Myers Industries, Inc.
23
Consent of Independent Registered Public Accounting Firm.
31(a)
Certification of John C. Orr, President and Chief Executive Officer of Myers Industries, Inc.,
pursuant to Section 302 of the Sarbanes-Oxley Act of 2002.
31(b)
Certification of Greggory W. Branning, Senior Vice President, Chief Financial Officer and
Corporate Secretary of Myers Industries, Inc., pursuant to Section 302 of the Sarbanes-Oxley
Act of 2002.
32
Certifications of John C. Orr, President and Chief Executive Officer, and Greggory W.
Branning, Executive Vice President, Chief Financial Officer and Corporate Secretary, of Myers
Industries, Inc. pursuant to Section 906 of the Sarbanes-Oxley Act of 2002.
101
The following financial information from Myers Industries, Inc. Quarterly Report on Form 10-K
for the year ended December 31, 2014 filed with the SEC on March 31, 2015, formatted in
XBRL includes: (i) Condensed Consolidated Statements of Financial Position at December 31,
2014 and December 31, 2013, (ii) Condensed Consolidated Statements of Operations for the
81
EXHIBIT INDEX
fiscal periods ended December 31, 2014 and 2013, (iii) Condensed Consolidated Statements
of Comprehensive Income for the fiscal periods ended December 31, 2014 and 2013, (iv)
Condensed Consolidated Statements of Cash Flows for the fiscal periods ended December
31, 2014 and 2013, (v) Condensed Consolidated Statement of Shareholders’ Equity for the
fiscal period ended December 31, 2014, and (vi) the Notes to Consolidated Financial
Statements.
*
**
Indicates executive compensation plan or arrangement.
Pursuant to Item 601(b)(2) of Regulation S-K, certain exhibits and schedules have been omitted
from this filing. The registrant agrees to furnish the Commission on a supplemental basis a copy
of any omitted exhibit or schedule.
82
SIGNATURES
Pursuant to the requirements of Section 13 or 15(d) of the Securities Exchange Act of 1934, the
Registrant has duly caused this report to be signed on its behalf by the undersigned, thereunto duly
authorized.
MYERS INDUSTRIES, INC.
/s/
Greggory W. Branning
Greggory W. Branning
Senior Vice President,
Chief Financial Officer and
Corporate Secretary
Pursuant to the requirements of the Securities Exchange Act of 1934, this report has been signed
below by the following persons on behalf of the Registrant and in the capacities and on the dates
indicated.
SIGNATURE
TITLE
DATE
President, Chief Executive
Officer and Director (Principal
Executive Officer)
March 31, 2015
Senior Vice President, Chief
Financial Officer and Corporate
Secretary (Principal Financial
and Accounting Officer)
March 31, 2015
/s/ William A. Foley
WILLIAM A. FOLEY
Director
March 31, 2015
/s/ Vincent Byrd
VINCENT BYRD
Director
March 31, 2015
/s/ Robert A. Stefanko
Director
March 31, 2015
/s/ Richard P. Johnston
RICHARD P. JOHNSTON
Director
March 31, 2015
/s/ Edward W. Kissel
EDWARD W. KISSEL
Director
March 31, 2015
/s/ Sarah R. Coffin
SARAH R. COFFIN
Director
March 31, 2015
/s/ John B. Crowe
JOHN B. CROWE
Director
March 31, 2015
/s/ Robert B. Heisler, Jr.
ROBERT B. HEISLER, JR.
Director
March 31, 2015
/s/ John C. Orr
JOHN C. ORR
/s/ Greggory W. Branning
GREGGORY W. BRANNING
ROBERT A. STEFANKO
83
Shareholder Information
Annual Meeting of Shareholders
Board of Directors
April 24, 2015, at 9:00 a.m., L.S. Myers Training Center, 1554 South Main Street,
Akron, Ohio. For more information, call (330) 253-5592.
Chairman of the Board of Directors, Private Equity Investor
Company Headquarters
Vincent C. Byrd
Richard P. Johnston
President & Chief Operating Officer, The J.M. Smucker Company (NYSE: SJM)
Myers Industries, Inc.
1293 South Main Street, Akron, Ohio 44301
Tel: (330) 253-5592, Fax: (330) 761-6156
Web Site: www.myersindustries.com
Sarah R. Coffin
Former Chief Executive Officer, Aspen Growth Strategies LLC
John B. Crowe
Former Chief Executive Officer & Chairman of Buckeye Technologies Inc. (NYSE: BKI)
Common Stock
William A. Foley
Traded on the New York Stock Exchange
Non-Executive Chairman of the Board, Libbey Glass (NYSE: LBY)
Dividend Reinvestment Plan
Robert B. Heisler, Jr.
Shareholders have a convenient opportunity to automatically reinvest cash dividends
and make voluntary cash investments in the Company’s stock through the Dividend
Reinvestment and Stock Purchase Plan. For full details, please contact:
Treasurer
Myers Industries, Inc.
1293 South Main Street, Akron, Ohio 44301
Tel: (330) 253-5592, Fax: (330) 761-6156
Transfer Agent & Registrar
Edward W. Kissel
President & Managing Partner, Kissel Group Ltd.
John C. Orr
President & Chief Executive Officer, Myers Industries, Inc. (NYSE: MYE)
Robert A. Stefanko
Former Chairman of the Board & Executive Vice President of Finance
& Administration, A. Schulman, Inc. (NASDAQ: SHLM)
Corporate Officers
Wells Fargo Shareholder Services
P.O. Box 64874
St. Paul, MN 55164
John C. Orr
President & Chief Executive Officer
Gregg W. Branning
Please contact Wells Fargo directly to:
• Transfer stock
• Replace lost stock certificates
• Replace lost dividend checks
• Eliminate multiple mailings
Former Chairman & Chief Executive Officer, KeyBank NA (NYSE: KEY)
Senior Vice President, Chief Financial Officer & Corporate Secretary
• Change name or address
• Obtain Holding Statements
• Consolidate accounts
Wells Fargo Representatives may be reached at (800) 468-9716 between the
hours of 8:00 a.m. and 8:00 p.m. eastern, Monday through Friday. Outside of
the U.S., call (651) 450-4064. Shareholders may access account online at
www.shareowneronline.com.
Independent Registered Public Accounting Firm
NYSE Disclosures
In 2014, the Company submitted to the New York Stock Exchange an unqualified
Section 12(a) certification by its chief executive officer indicating that he was not
aware of any violation by the Company of the NYSE corporate governance listing
standards. In addition, the Form 10-K for the year ended December 31, 2014 filed
with the Securities and Exchange Commission contained the Section 302 and 906
certifications by the Company’s chief executive officer and chief financial officer.
Ernst & Young LLP
Forward-Looking Statements Disclosure
Form 10-K Requests
“Forward-Looking” Statements are indicated by words such as “will,” “believe,”
“anticipate,” “expect,” or any variations of these words or similar expressions.
Any statement that is not of historical fact may be deemed “forward-looking.”
These statements involve risks and uncertainties, many outside of the Company’s
control, that could cause actual results to materially differ from those expressed
or implied. Factors include: changes in the markets for the Company’s business
Free copies of the Company’s 2014 Annual Report and Form 10-K are available on
our website or upon written request to:
Myers Industries, Inc.
ATTN: Investor Relations
1293 South Main Street, Akron, OH 44301
Investor Relations Contacts
Gregg W. Branning
Senior Vice President, Chief Financial Officer & Corporate Secretary
Monica Vinay
Vice President, Investor Relations & Treasurer
Tel: (330) 253-5592, Fax: (330) 761-6156
segments, unanticipated downturn in business, competitive pressures on sales
and pricing, increases in raw material costs, regulatory issues, and deterioration
of economic and financial conditions in the United States and around the world.
Additional details are provided in the Company’s Form 10-K filed with the Securities
and Exchange Commission. Myers Industries undertakes no obligation to update
forward-looking statements contained herein.
Tire Maintenance Supplies | Distribution
|
|
|
1293 South Main Street Akron, Ohio 44301 Tel: 330.253.5592 Fax: 330.761.6156 www.myersindustries.com
© 2015 Myers Industries, Inc. Form No. 10492 – 03/15 – 6M

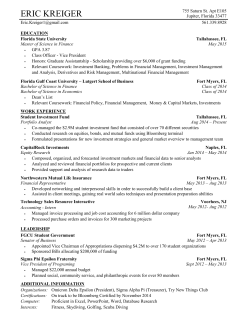


© Copyright 2026