
Simultaneous determination of eight common odors in natural water
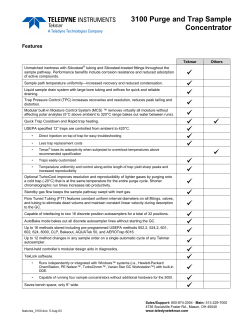
Journal of Chromatography A, 1218 (2011) 3791–3798 Contents lists available at ScienceDirect Journal of Chromatography A journal homepage: www.elsevier.com/locate/chroma Simultaneous determination of eight common odors in natural water body using automatic purge and trap coupled to gas chromatography with mass spectrometry Xuwei Deng 1 , Gaodao Liang 1 , Jun Chen, Min Qi, Ping Xie ∗ Donghu Experimental Station of Lake Ecosystems, State Key Laboratory of Freshwater Ecology and Biotechnology of China, Institute of Hydrobiology, Chinese Academy of Sciences, Donghu South Road 7, Wuhan, Hubei 430072, China a r t i c l e i n f o Article history: Received 27 December 2010 Received in revised form 2 April 2011 Accepted 18 April 2011 Available online 28 April 2011 Keywords: Taste and odor Algal blooms Purge and trap Gas chromatography mass with spectrometry Water analysis a b s t r a c t Production and fate of taste and odor (T&O) compounds in natural waters are a pressing environmental issue. Simultaneous determination of these complex compounds (covering a wide range of boiling points) has been difficult. A simple and sensitive method for the determination of eight malodors products of cyanobacterial blooms was developed using automatic purge and trap (P&T) coupled with gas chromatography–mass spectrometry (GC–MS). This extraction and concentration technique is solvent-free. Dimethylsulfide (DMS), dimethyltrisulfide (DMTS), 2-isopropyl-3-methoxypyrazine (IPMP), 2-isobutyl-3-methoxypyrazine (IBMP), 2-methylisoborneol (MIB), -cyclocitral, geosmin (GSM) and ionone were separated within 15.3 min. P&T uses trap #07 and high-purity nitrogen purge gas. The calibration curves of the eight odors show good linearity in the range of 1–500 ng/L with a correlation coefficient above 0.999 (levels = 8) and with residuals ranging from approximately 83% to 124%. The limits of detection (LOD) (S/N = 3) are all below 1.5 ng/L that of GSM is even lower at 0.08 ng/L. The relative standard deviations (RSD) are between 3.38% and 8.59% (n = 5) and recoveries of the analytes from water samples of a eutrophic lake are between 80.54% and 114.91%. This method could be widely employed for monitoring these eight odors in natural waters. © 2011 Elsevier B.V. All rights reserved. 1. Introduction Taste and odor (T&O) compounds are troublesome in natural waters because they have a terrible malodor influence on the quality of drinking water and aquatic products, causing great economic losses [1–4]. Recently, it is frequent that consumers strongly complain about the malodor of recreational waters, tap water and aquatic products, especially during the outbreak period of algae blooms [5,6]. Asides from the well-known earthy-musty offflavors MIB, GSM, IPMP and IBMP [7], attention is also drawn to DMS, DMTS, -cyclocitral and -ionone [6,8–11] which are associated with decomposition of algal blooms [6,12,13]. Because these T&O compounds often simultaneously break out in natural waters [6,7,14], the origin, biotransformation, and removal in/from aquatic environments have been gaining attention in the field of water science [5,15–18]. An effective method for the determination of these compounds would be the key step for such efforts. ∗ Corresponding author. Tel.: +86 27 68780622; fax: +86 27 68780622. E-mail address: [email protected] (P. Xie). 1 These two authors contribute equally to this work. 0021-9673/$ – see front matter © 2011 Elsevier B.V. All rights reserved. doi:10.1016/j.chroma.2011.04.041 To date, a variety of extraction and enrichment techniques have been established and developed for analyzing T&O compounds. Pre-concentration of water samples by solvent extraction (SE) can analyze MIB, GSM, -cyclocitral, and -ionone at nanogram-perliter levels [19–22], however, this technique cannot be employed for the determination of DMS because the boiling point of DMS (37 ◦ C) is lower than that of most common solvents. Closed-loop stripping analysis (CLSA) has been widely used for the extraction of trace amounts of odors from water samples. This method is considered a successful analytical technique in measuring T&O compounds such as MIB and GSM in water samples [23,24], however, it is time-consuming, labor-intensive, and involves solvent interference for DMS [25,26]. Membrane extraction (ME) can also detect MIB and GSM in water at nanogram-per-liter levels [27,28]. Although this method greatly improves the limits of detection and is less time-consuming compared to CLSA, analysis of low-boilingpoint compounds, such as sulfides is difficult [29,30]. Solid-phase extraction (SPE), as a powerful extraction technique for analysis of water odors, is time-consuming and unsuitable for the analysis of low-boiling-point odors [31–34]. As technology advances, solid-phase microextraction (SPME) and headspace solid phase microextraction (HS-SPME) have become the most popular extraction techniques in treating and neutralizing a large number of water 3792 X. Deng et al. / J. Chromatogr. A 1218 (2011) 3791–3798 Table 1 The cas number, molecular weight, boiling points and odor threshold of the eight compounds. Compounds Cas no. Molecular weight Boiling pointa (◦ C) Henry’s law constanta (atm m3 /mol) Odor threshold concentrationc (ng/L) DMS DMTS IPMP IBMP MIB -Cyclocitral GSM -Ionone 75-18-3 3658-80-8 25773-40-4 24683-00-9 2371-42-8 432-25-7 19700-21-1 14901-07-6 62 126 152 166 168 152 182 192 37b /43 177 218 236 210 214 270b /249 239b /263 7.86 × l0−4 1.87 × l0−3 3.06 × l0−6 4.07 × l0−6 8.90 × l0−6 1.89 × l0−4 1.18 × l0−5 1.74 × l0−4 2 × 10³ 10 2 1 15 1.93 × 10⁴ 10 7 a All were calculated by EPISuit v.4.10 (2011). Developed by the US EPA 2011. Boiling points were estimated by Stein and Brown method, and Henry’s law constants were adapted bond estimation method. b These boiling points cited from experimental database of EPISuit v.4.10, and -Ionone was cited from the msds in the database of Adanced Biotech. c The lowest concentration at which an odor compound is detectable by sensory analyses, and cited from [54–56]. odors [35–38]. These two techniques are simple, fast, inexpensive, portable, and solvent-free. SPME has excellent exhibition in analyzing DMTS, IPMP, IBMP, MIB, GSM, -cyclocitral, and -ionone [39–42]. However, choosing a fiber suitable for large-scale analysis of odors is difficult [25,42–45], sensitivity is very low for lowboiling-point odors such as DMS [42]. P&T, a solvent-free technique, can analyze VOCs simply and quickly, and it integrates sampling, extraction, pre-concentration and sample introduction in one step [46]. There are few reports on the P&T extraction of odor compounds from water samples, and to our knowledge no reports so far on using P&T to test DMTS, -cyclocitral and -ionone which simultaneously outbreak during the period of algal blooms. For example, Awaji, Buettner et al., Lloyd et al. and Salemi et al. reported the P&T technique for the analysis of MIB and GSM in water samples [47–50], Wardencki and Cheng et al. applied P&T for the analysis of DMS [51,52], and Salemi et al. reported the P&T technique for the analysis of IPMP and IBMP [50]. In the report of Salemi et al., 20 mL water sample was spiked with 5 g sodium chloride, and was purged for 20 min using 35 mL/min of helium. Under these optimal conditions, IPMP, IBMP, MIB and GSM could be detected at the concentration level of 2 ng/L. But there are still disadvantages that the sodium chloride could be spurge onto the upside of the purge tube, and then it was brought to the tubes and valves. This frequently led to the plug and abrasion of the tubes and valves. Also, the temperature of the sample in the purging process was out of plan. The purge efficiency could be affected by different sample temperatures. However, their study demonstrated that P&T has excellent performance in analyzing odor compounds. This study details an analytical method for the simultaneous quantitative determination of eight fetor off-flavors in water samples using P&T coupled with GC–MS. Using this methods allow accurate and rapid detection of DMS, IPMP, IBMP, MIB, GSM, and as well as DMTS, -cyclocitral and -ionone at the same time. 2. Experimental 2.1. Chemicals DMS and DMTS were purchased from Tokyo Chemical Industry (Tokyo, Japan). MIB, GSM, and -cyclocitral were purchased from Sigma–Aldrich (Shanghai, China). IPMP was purchased from J&K Chemical (Beijing, China). IBMP and -ionone were purchased from Acros Organics (Fair Lawn, USA). MIB and GSM were mixed standard solution of 100 g/mL in methanol (in a 1 mL ampoule). The details of the eight compounds are shown in Table 1. Ten milligram of these compounds (but except for MIB and GSM) for each were weighed and dissolved in methanol (MERCK, HPLC grade) to make a mixed stock solution at an approximate concentration of 100 g/mL for each. This solution and the mixed standard solution of MIB and GSM were stored at 4 ◦ C as the first stock solutions. The second stock solution was diluted and mixed by the first stock solutions with HPLC water at a concentration of 10 g/L for each compound. This second stock solution was made before daily using. Standard series which used for standard curves were diluted by the second stock solution with HPLC water. 2.2. Purge and trap (P&T) P&T was performed by Eclipse 4660 Purge and Trap Sample Concentrator, with 4551A autosampler (OI Analytical Company, USA), a #07 trap (OI Analytical Company, USA), and a 25 mL purge tube. P&T was programmed as follows: a 25 mL water sample was drawn by a sample loop of autosampler and transferred to the purge tube. Target compounds were purged from the sample and absorbed onto the trap for 12 min. Subsequently, the trap was heated, the trapped components were desorbed by helium for 4 min, and then transferred directly to the GC system. Meanwhile, the sampling needle, loop and purge tube were washed with HPLC water three times, and the trap was baked at 200 ◦ C for 12 min. These processes were enough to clean the purge system. The settings were as follows: purge gas: high-purity nitrogen, with a flow rate of 40 mL/min; sample heater: 55 ◦ C; purge tube fixture temperature: 80 ◦ C; six-way valve temperature: 250 ◦ C; water manager temperature: purge, 110 ◦ C/desorb, 0 ◦ C/bake, 240 ◦ C; trap temperature: purge, 30 ◦ C/predesorb, 170 ◦ C/desorb, 180 ◦ C/bake, 200 ◦ C; transfer line temperature: 270 ◦ C. 2.3. Gas chromatography–mass spectrometry (GC–MS) GC–MS analysis was performed with a GC–MS (QP2010Plus, Shimadzu Corporation, Japan) using an HP-5MS UI column (30 m × 0.25 mm × 0.25 m; Agilent Technologies, USA) and helium as carrier gas. GC was operated under the following settings: injection temperature: 270 ◦ C; total flow rate: 14 mL/min; column flow rate: 1 mL/min; split ratio: 10:1; oven temperature was programmed from 50 (hold for 2 min) to 150 (10 ◦ C/min), and finally to 220 ◦ C (5 ◦ C/min). MS was equipped with an electron ionization source and set as follows: ion-source temperature: 200 ◦ C; interface temperature: 250 ◦ C; solvent cut time: 1.69 min; ionization method was electron ionization; and electron energy: 70 eV. Selected ions for selected ion mode (SIM) are shown in Table 2. All other parameters were defined by automatic tuning. 2.4. Sample collection and preparation Lake water samples from ten lakes were analyzed using the proposed method. All ten lakes are shallow and eutrophic with cyanobacterial algae. Water samples were filtered through 0.45 m pore glass-fiber-filter (GF/C, Whatman, England). Filtrates were transferred into sample vials (40 mL screw-cap vials, each equipped X. Deng et al. / J. Chromatogr. A 1218 (2011) 3791–3798 3793 Table 2 The selected ions, retention time, linearity, limit of detection and relative standard deviation (n = 6). Compounds DMS DMTS IPMP IBMP MIB -Cyclocitral GSM -Ionone Selected ions a 62 ,47 126a ,79,111 137a ,152,124 124a ,94,151 95a ,108,135 137a ,152,123,109 112a ,125,149 177a ,91,135 tR (min) 1.897 6.957 8.997 10.354 10.471 11.017 13.835 15.039 Linearity (R) LODb (ng/L) Residual range (% accuracy) 0.99967 0.99971 0.99989 0.99937 0.99999 0.99993 0.99993 0.99986 87–103 83–102 99–105 98–115 99–113 99–123 99–116 98–124 0.2 1.5 0.5 0.3 1.4 0.7 0.08 1.1 Relative standard deviation (RSD%) 2 ng/L 100 ng/L 4.64 6.77 7.74 8.05 7.60 8.59 6.14 7.51 5.39 5.94 4.74 6.55 7.32 7.72 3.38 4.32 a Target ions for quantitation. Limit of detection was calculated on the basis of S/N = 3, this value is a mathematical approximation. To minimize this error, the LOD was calculated in SIM mode at a concentration as close as possible to lowest point on the calibration curve. b with a PTFE-faced silicone septum, OI Analytical Company, USA). And filtrate from Donghu Lake [53] was spiked at two concentrations (20 and 300 ng/L) with the second stock solution to evaluate the recoveries of the method. Filtrates and spiked solutions were stored at 4 ◦ C before analysis. 3. Results and discussion To definite the quantitative and qualitative ions, the eight odors were first identified simultaneously by P&T-GC–MS in the scan mode. The ions selected are listed in Table 2 and the chromatogram is shown in Fig. 1A. The eight target compounds were separated within 15.3 min. 3.1. Optimization of purge and trap (P&T) To optimize the operation parameters of P&T, parameters such as type of trap, desorption time, sample temperature and purge time were optimized in the present work. Pre-test were done before this study carried out. The results shown that: (1) predesorb is essential for DMS, so it was definite first; (2) predesorb, type of trap and desorption time were independent each other and had no impact on purge efficiency but effected sorption and desorption processions. So type of trap and desorption time could be evaluated and compared individually with common conditions; (3) one-factor-at-a-time analysis of sample temperature and purge time was suitable for choosing the best purge efficiencies of the eight odor compounds. To ensure that all the compounds were gaseous, the six-way valve and the transfer line temperatures were fixed at 250 ◦ C, while the purge tube fixture temperature was set at 80 ◦ C. 3.1.2. Selection of trap Different traps have different efficiencies of adsorption and desorption. The trapping efficiency of the eight compounds is dependent on the absorbing materials in the trap, In order to achieve the maximum efficiencies for the target compounds, different traps were compared. Eleven types of trap are available commercially for the Eclipse 4660. Traps #07, # 09, #10, and #11 were selected and tested in this study which were common used. Details of the four traps are listed in Table 3. The parameters which carried out in this section were on the basis of the pre-test (purge 12 min, sample temperature 55 ◦ C, predsorb, desorb 5 min), and then proofread after the optimization of purge time and sample temperature. Trap #07 filled completely by tenax showed superior concentration efficiency for the eight odors (Fig. 2). Trap #07 performed best for seven of the eight odors, and obtained the second-best adsorption efficiency for DMS. Traps #09, #10, #11 did not perform as well as Trap #07, especially on -ionone. Trap #11 was completely unable to trap DMS. Trap #07 was therefore selected for the simultaneous determination of the eight odors. 3.1.3. Desorb time Desorb efficiency was related to trap and desorb time (desorb temperature followed by the instruction of the trap, carry gas flow fixed by GC), to ensure that all the eight odors had the acceptable desorb efficiencies, desorb time was tested after the selection of trap. According to the instructions of the trap, Trap #07 should desorb at 180 ◦ C between 0.5 and 4 min. To desorb target compounds completely, desorption times were studied from 0.5 to 5 min. Other parameters (purge time and sample temperature) in this section were based on the pre-test (12 min, 55 ◦ C, and predesorb), and Table 3 The details of the four traps. 3.1.1. Predesorb Pre-desorption of the P&T concentrator is obligatory for DMS. There can be no chromatographic peak for DMS without predesorption. To pre-desorb is discovered in our pre-test, and so in all the optimization of parameters, predesorb was made. This may be caused by the lower boiling point and high volatility of DMS. Compounds are diffused when desorbed from the trap without predesorption, however, these could be refocused on the head of the column when the oven temperature is sufficiently low. The initial oven temperature is 50 ◦ C in this study, however, this was not sufficiently low for refocusing of DMS. Pre-desorption heats the trap to a certain temperature (170 ◦ C in this study) without desorbing gas, thus, part of the compounds (especially high volatile compounds) were desorbed during this step. Pre-desorbed compounds were sent to GC in a shortly, thereby inhibiting diffusion during desorbing on a large scale. Trap no. 07 09 10 11 a Identifying the trapa Trap contents Length (cm) Tenaxb Tenax/silica gelc 300-600/charcoald Tenax/silica gel/cmse VOCARBTM3000(Carbopack Bf /Carboxen 1000&1001g ) 24 8/8/8 8/8/8 12/12 All traps were purchased from OI Analytical Company, USA. Tenax, 2,6-diphenylene oxide polymer; specific surface area, 35 m2 /g; nonpolar; max. temp., 350 ◦ C. c Specific surface area, 800 m2 /g; polar; max. temp., 300 ◦ C. d Specific surface area, >1000 m2 /g; nonpolar; max. temp., >400 ◦ C. e Cms: carbon molecular sieve; specific surface area, 800 m2 /g; nonpolar; max. temp., 400 ◦ C. f Specific surface area, 100 m2 /g; nonpolar; max. temp., >400 ◦ C. g Specific surface area, 800 m2 /g; polar; max. temp., 400 ◦ C. b 3794 X. Deng et al. / J. Chromatogr. A 1218 (2011) 3791–3798 Fig. 1. (A) Identify all the eight odors by purge and trap, and the full scan mass spectra from 1.7 min to 15.3 min were obtained with m/z range of 47–200 u. (B) Select ion mode of the eight odors by purge and trap (Donghu lake water, 25 mL). (C) Select ion mode of the spiked solution by purge and trap (300 ng/L, Donghu lake water, 25 mL). the desorb time test also proofread after the optimization of other parameters. The effect of desorb time on sensitivity is shown in Fig. 3. All eight compounds achieved best sensitivity with desorb time of 4 min. 3.1.4. Purge time Suitable purge time is very important to the purge efficiency. The target compounds would not be purged out with a short time, and would broke through with a long time, which leads low purge X. Deng et al. / J. Chromatogr. A 1218 (2011) 3791–3798 3795 descended. This phenomenon could be explained by the fact that the purge gas removes trapped compounds when purge gas volume exceeds a certain value (i.e., the breakthrough effect). The breakthrough effect leads continuous decrease in sensitivity. In general, purge time of 12 min was suitable when the eight compounds were determined simultaneously because the maximum response for most of compounds were available and all eight odors could be determined with concentrations below the respective odor threshold on this condition. Although purge time of 15–16 min may be more suitable when -ionone is more important than the others or determined alone, longer purge time is not only time-consuming but also traps more moisture, which can affect the quality of the spectrum and shorten trap life. Fig. 2. Effect of trap contents (predesorb, desorb 4 min, purge 12 min, sample temperature 55 ◦ C). efficiencies and high limits of detection. In our pre-test and proofread test, trap #07, 4 min of desorption and 55 ◦ C of the sample temperature were proved to be acceptable. In this test, these parameters were used with pre-desorption. Purge time was tested from 5 min to 20 min. DMS, DMTS, IPMP, IBMP, MIB, -cyclocitral, GSM, and -ionone had maximum response at 11, 11, 14, 14, 14, 14, 14, and 15 min (Fig. 4), respectively. It seems to be 14 min is most suitable for the purge process, but the response of DMS at 14 min is less than the half of the response at 11 min. To balance all the response of the eight compounds, 12 min was chosen. After maximum adsorption, the sensitivities of the eight odors obviously 3.1.5. Sample temperature Sample temperature is essential to the purge efficiency. High sample temperature accelerates molecular motion and enhances purge efficiency in less time. However, exorbitant sample temperature has two problems: (1) extra water could be purged into the trap, which can affect the quality of chromatography and shorten trap life in the same way as longer purge time; and (2) breakthrough time (volume) would be shortened sharply with high sample temperature, especially that of low-boiling-point odors, such as DMS. In spite of this, it does not like the regulation of sample salinity that salt is often fatal to purge equipment. Therefore, a proper sample temperature is needed to explore. Sample temperatures were tested at 30, 40, 45, 50, 55, 60, 65, 70, 75, 80 ◦ C, other parameters which carried out in this section were trap #07, predsorb, desorb 4 min and purge 12 min. The sample was heated by an infrared heater in the Eclipse 4660. Relationship between sample temperatures and peak areas of 8 compounds was shown in Fig. 5. DMS had the maximum response at 55 ◦ C, whereas DMTS, IPMP, -cyclocitral, and GSM had the maximum responses Fig. 3. Effect of desorb time (predesorb, purge 12 min, sample temperature 55 ◦ C, and using a trap 7). 3796 X. Deng et al. / J. Chromatogr. A 1218 (2011) 3791–3798 Fig. 4. Effect of purge time (sample temperature 55 ◦ C, desorb 4 min, using a trap 7). at 70 ◦ C. MIB had the maximum response at 60 ◦ C, whereas IBMP and -ionone maintained a high response level from 45 to 80 ◦ C. Sample temperature at 55 ◦ C was acceptable for all eight odors. It should be noted, however, that as the eight target T&O compounds simultaneously determined here have quite different volatility and polarity, our efforts of optimizing experimental parameters mentioned above were to yield chromatograms with “balanced” peak areas when all eight analytes were present at a similar concentration level. 3.2.2. Application to the analysis of lake water samples The method was applied to determine the target compounds in lake water samples. To confirm the validity of this method, the study of the possible matrix effect in the water samples from the eutrophic lakes is needed. Lake water samples and the same matrix spiked with target compounds were compared. The result showed that there was no interfering peak from sample matrix (Fig. 1B and C). To evaluate the recoveries of the extraction, known amounts of the standard solution (the second stock solution) were spiked into the lake water at concentrations of 20 and 300 ng/L. The recoveries of these compounds were calculated as below: 3.2. Method validation The P&T-GC–MS method proposed has been validated in terms of linearity, accuracy, repeatability and limit of detection. And it also was applied to analysis of lake water samples, including matrix effect, robustness and recovery. 3.2.1. Calibration curves, repeatability and limits of detection Linearity was studied by purging the eight odor standard solutions at eight concentration levels, ranging from 1 to 500 ng/L. Calibration curves showed adequate coefficients of correlation (R) higher than 0.999 with residuals (accuracy) ranging from approximately 83% to 124%. And repeatability (RSDs) below 7.72% (n = 6, 100 ng/L) and 8.59% (n = 6, 2 ng/L), this shows satisfactory precision. The eight odor compounds gave outstanding responses to GC–MS detection, the limits of detection (LOD) of these compounds were calculated on the basis of S/N = 3 in SIM mode at a low concentration of the calibration curve (10 ng/L) and were between 0.08 and 1.5 ng/L (Table 2). Recovery rate = spiked sample value − sample value × 100%. the adding standard matter amount The recoveries of the eight odors are above 80.54%, and good reproducibility was achieved (RSD < 10.5, 20 ng/L; RSD < 5.5, 300 ng/L) (Table 4). Also, ten eutrophic lake water samples from different regions of China were analyzed, the result are listed in Table 5. The result shows that the method is acceptable for trace analysis of odors in eutrophic lakes. 3.2.3. Calculation of combined uncertainty The potential major sources of uncertainty are generally the preparation of calibration standards, the calibration of the instrument and the sample treatment (extraction, clean-up, etc.) [57]. Since some contributions (sample dilution, etc.) are very low, the only uncertainty sources taken into account in this study are repeatability u(F), recovery u(R) and relative residuals u(E). To evaluate the uncertainty in this method, the statistical procedure described in the Eurachem/Citac Guide was followed. The result is X. Deng et al. / J. Chromatogr. A 1218 (2011) 3791–3798 3797 Fig. 5. Effect of sample temperature (purge 12 min, predesorb, desorb 4 min, using a trap 7). Table 4 The relative standard deviations recoveries of the spiked solutions and the uncertainty of the method. Compounds DMS DMTS IPMP IBMP MIB -Cyclocitral GSM -Ionone a Recoverya (%) RSD (%) (n = 5) Uncertainty (%) 20 ng/L 300 ng/L 20 ng/L 300 ng/L 20 ng/L 300 ng/L 3.03 8.08 6.14 9.72 5.39 10.45 1.76 8.06 5.49 5.34 3.26 3.19 4.59 3.92 2.18 3.81 102.97 96.03 109.33 114.91 87.53 103.56 104.8 83.77 106.42 95.55 108.74 105.36 86.66 96.76 103.32 80.54 7.13 13.58 9.34 15.73 9.59 16.14 7.88 18.95 7.77 7.54 4.61 4.51 6.49 5.54 3.08 5.39 Relative recovery. Table 5 The concentrations of the eight odors detected in eutrophic lakes (ng/L) (all samples were test 3 times, RSD% <9.8). Lakesa DMS DMTS IPMP Poyang Lake Longgan Lake Honghu Lake Nanyi Lake Gehu Lake Chihu Lake Saicheng Lake Taibo Lake Nanyang Lake Donghu Lake – 766b 842b 7 13 458 – – 8 13 295 13 6 10 1 4 109 632b 5 1 – – – 1 – – – – 10 – a b IBMP – – – 2 65 – – – 19 – MIB -Cyclocitral GSM -Ionone 2 109 129 – – 37 7 – 4 3 – 7 16 84 42 8 4 17 35 4 3 65 32 4 – 22 8 3 4 1 – 80 – 21 1 154 252 233 122 16 All were eutrophic lakes. The samples above the upper-limit of the calibration range were diluted twice before the second test. 3798 X. Deng et al. / J. Chromatogr. A 1218 (2011) 3791–3798 shown in Table 4. And combined uncertainty was calculated from the following formula: U = (u(F)2 + u(R)2 + u(E)2 ) 1/2 × 100% u(E):u(E) = (X − Xi )/X, X is the concentration of the standard solution which was measured, and Xi is the predictive value which was calculated by calibration curves. From the above results, good linearity with high accuracy and a very good repeatability with low limit of detection are achieved. And it also has no matrix effect with good recoveries and reproducibility. This method can be applied for trace analysis of odors in lake water. 4. Conclusion The method based on solvent-free P&T followed by GC–MS analysis is simple and sensitive for the analysis of DMS, DMTS, IPMP, IBMP, MIB, -cyclocitral, GSM, and -ionone. The method has been validated with excellent results (i.e., shorter time consumed and high sensitivity/low limits of detection). Most significantly, this method is able to directly determine the eight odors, which have quite different volatility and polarity, simultaneously. This method is expected to be applicable for monitoring the dynamics of these eight odors in natural waters with cyanobacterial blooms. Acknowledgments We wish to give our heartfelt thanks to the editor and the three anonymous reviewers for their constructive suggestions and professional editing. We also thank Drs. Xu Jun, Zhang Dawen, Wu Laiyan, Ma Zhimei and Jiang Yan for providing fieldwork support. This study was jointly supported by National Basic Research Program of China (973 Program) (2008CB418101), Lake water quality, water quantity and biological resources investigation in China (2006FY110600) and State key laboratory of freshwater ecology and biotechnology (2008FBZ01). References [1] A.U. Wnorowski, Water SA 18 (1992) 203. [2] I. Freuze, S. Brosillon, D. Herman, A. Laplanche, C. Democrate, J. Cavard, Environ. Sci. Technol. 38 (2004) 4134. [3] E.D. Mackey, H. Baribeau, G.F. Crozes, I.H. Suffet, P. Piriou, Water Sci. Technol. 49 (2004) 335. [4] R. Motum, Water Sci. Technol. 55 (2007) 371. [5] J.M. Davies, M. Roxborough, A. Mazumder, Water Res. 38 (2004) 1900. [6] M. Yang, J.W. Yu, Z.L. Li, Z.H. Guo, M. Burch, T.F. Lin, Science 319 (2008) 158. [7] A. Peter, O. Koster, A. Schildknecht, G.U. von, Water Res. 43 (2009) 2191. [8] B. Ginzburg, I. Chalifa, J. Gun, I. Dor, O. Hadas, O. Lev, Environ. Sci. Technol. 32 (1998) 2130. [9] C. Hockelmann, F. Juttner, Flavour Frag. J. 20 (2005) 387. [10] A. Peter, G.U. Von, Environ. Sci. Technol. 41 (2007) 626. [11] K. Ozaki, A. Ohta, C. Iwata, A. Horikawa, K. Tsuji, E. Ito, Y. Ikai, K.I. Harada, Chemosphere 71 (2008) 1531. [12] L. Luljeta, B. Ramazan, E.A. Ing, A. Miho, S. Shumka, Epidemiology 13 (2002) 620. [13] J.L. Graham, K.A. Loftin, M.T. Meyer, A.C. Ziegler, Environ. Sci. Technol. 44 (2010) 7361. [14] J. Chen, P. Xie, Z.M. Ma, Y.A. Niu, M. Tao, X.W. Deng, Q. Wang, Sci. Total Environ. 409 (2010) 314. [15] J. Ridal, B. Brownlee, G. McKenna, N. Levac, Water Qual. Res. J. Can. 36 (2001) 43. [16] S.B. Watson, Phycologia 42 (2003) 332. [17] A.M. Paterson, B.F. Cumming, J.P. Smol, R.I. Hall, Freshwater Biol. 49 (2004) 199. [18] S.B. Watson, M. Chariton, Y.R. Rao, T. Howell, J. Ridal, B. Brownlee, C. Marvin, S. Millard, Water Sci. Technol. 55 (2007) 1. [19] P.B. Johnsen, J.C. Kuan, J. Chromatogr. 409 (1987) 337. [20] M.L. Bao, K. Barbieri, D. Burrini, O. Griffini, F. Pantani, Water Res. 31 (1997) 1719. [21] H.J. Kim, K. Kim, N.S. Kim, D.S. Lee, J. Chromatogr. A 902 (2000) 389. [22] M. Schellin, P. Popp, J. Chromatogr. A 1103 (2006) 211. [23] S.W. Krasner, C.J. Hwang, M.J. Mcguire, Abs. Pap. Am. Chem. Soc. 180 (1980), 5-ENVR. [24] M.J. Mcguire, S.W. Krasner, C.J. Hwang, G. Izaguirre, J. Am. Water Work Assoc. 73 (1981) 530. [25] B. Ginzburg, I. Chalifa, T. Zohary, O. Hadas, I. Dor, O. Lev, Water Res. 32 (1998) 1789. [26] L. Malleret, A. Bruchet, M.C. Hennion, Anal. Chem. 73 (2001) 1485. [27] M.J. Yang, S. Harms, Y.Z. Luo, J. Pawliszyn, Anal. Chem. 66 (1994) 1339. [28] A.K. Zander, P. Pingert, Water Res. 31 (1997) 301. [29] K. Hylton, S. Mitra, J. Chromatogr. A 1152 (2007) 199. [30] T. Barri, J. Jansson, J. Chromatogr. A 1186 (2008) 16. [31] E.D. Conte, S.C. Conway, D.W. Miller, P.W. Perschbacher, Water Res. 30 (1996) 2125. [32] J.P. Palmentier, V.Y. Taguchi, Analyst 126 (2001) 840. [33] R. Lopez, M. Aznar, J. Cacho, V. Ferreira, J. Chromatogr. A 966 (2002) 167. [34] A.L. Capriotti, C. Cavaliere, P. Giansanti, R. Gubbiotti, R. Samperi, A. Lagan, J. Chromatogr. A 1217 (2010) 2521. [35] F.J. Santos, M.T. Galceran, D. Fraisse, J. Chromatogr. A 742 (1996) 181. [36] A. Diaz, F. Ventura, M.T. Galceran, J. Chromatogr. A 1034 (2004) 175. [37] L.F. Zhang, R.K. Hu, Z.G. Yang, J. Chromatogr. A 1098 (2005) 7. [38] K. Demeestere, J. Dewulf, W.B. De, L.H. Van, J. Chromatogr. A 1153 (2007) 130. [39] L.S. Cai, J.A. Koziel, M. O’Neal, J. Chromatogr. A 1147 (2007) 66. [40] K. Salto, K. Karnura, H. Kataoka, J. Chromatogr. A 1186 (2008) 434. [41] D. Fujise, K. Tsuji, N. Fukushima, K. Kawai, K. Harada, J. Chromatogr. A 1217 (2010) 6122. [42] I. Kristiana, A. Heitz, C. Joll, A. Sathasivan, J. Chromatogr. A 1217 (2010) 5995. [43] B. Kolb, J. Chromatogr. A 842 (1999) 163. [44] A. Diaz, F. Ventura, T. Galceran, J. Chromatogr. A 1064 (2005) 97. [45] E. Serrano, J. Beltran, F. Hernandez, J. Chromatogr. A 1216 (2009) 127. [46] A. Lara-Gonzalo, J.E. Sanchez-Uria, E. Segovia-Garcia, A. Sanz-Medel-Garcia, Talanta 74 (2008) 1455. [47] K. Awaji, in: R. Briggs (Ed.), Instrumentation, Control and Automation of Water and Wastewater Treatment and Transport Systems, Pergamon Press Ltd., Oxford, 1990, p. 639. [48] M.W. Buettner, G.A. Schelk, Proceedings – PTS 1 AND 2 – Advances in Water Analysis And Treatment, Amer. Water Works Assoc., Denver, 1992, p. 1083. [49] S.W. Lloyd, J.M. Lea, P.V. Zimba, C.C. Grimm, Water Res. 32 (1998) 2140. [50] A. Salemi, S. Lacorte, H. Bagheri, D. Barcelo, J. Chromatogr. A 1136 (2006) 170. [51] W. Wardencki, J. Microcolumn Sep. 7 (1995) 51. [52] X.H. Cheng, E. Peterkin, Water Environ. Res. 79 (2007) 571. [53] J. Xu, P. Xie, J. Freshwater Ecol. 19 (2004) 645. [54] C.J. Tsai, M.L. Chen, A.D. Ye, M.S. Chou, S.H. Shen, I.F. Mao, Atmos. Environ. 42 (2008) 8246. [55] S.B. Watson, Alberta: Univ. of Calgary, 1999. [56] W.F Young, H. Horth, R. Crane, T. Ogden, M. Arnott, Water Res. 30 (1996) 331. [57] R. Galarini, L. Fioroni, F. Angelucci, G.R. Tovo, E. Cristofani, J. Chromatogr. A 1216 (2009) 8158.


© Copyright 2026