
Link
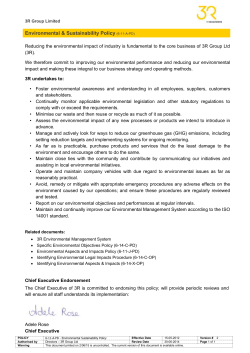
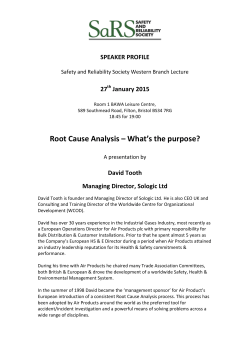
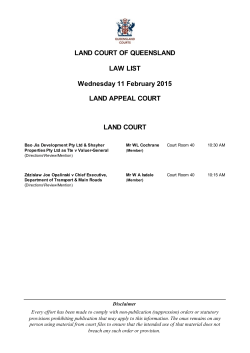
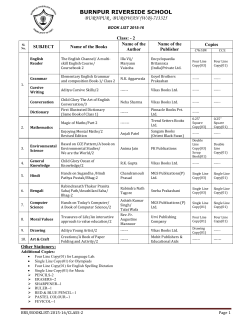
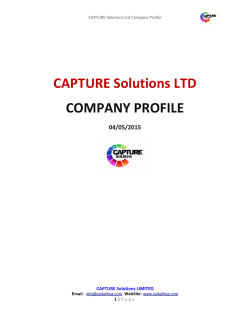
Investor Presentation Q1 2015 May 14, 2015 NEXON Co., Ltd. © 2015 NEXON Co., Ltd. All Rights Reserved. Owen Mahoney President and Chief Executive Officer © 2015 NEXON Co., Ltd. All Rights Reserved. 2 Q1: Steady Headway Against Our Strategy Strong execution in China and Korea, particularly around the Lunar New Year high-season and into March – China: Dungeon&Fighter rebounded over the course of the quarter after a slower early start of the Lunar New Year update – Korea: strong execution in a highly competitive market. Solid performance of existing games. Strengthened mobile pipeline with acquisition of Boolean Games Japan: Continued focus on improvement – Announced co-development deal with SQUARE ENIX to develop mobile game version of legendary MMORPG FINAL FANTASY XI – LINE Cross Legion (Japan service of Legion of Heroes): Completed CBT1 in Japan, commercial launch in Q2 High-quality launches on track – and many more to come – DomiNations launched in North America and Europe – achieved 6 million downloads; strong retention rate – Top of Tanker (Chinese title: 我叫MT2) launched in Korea, consistently ranked around top 10 of Korea Google Play Top Grossing – MapleStory2 completed its final CBT in Korea – Announced release of Dungeon&Fighter mobile in China through Tencent – mobile version of one of China’s largest PC titles 1 CBT (Closed Beta Test): A trial period during which the trial model (beta version) of a game is tested by a limited number of users or groups. © 2015 NEXON Co., Ltd. All Rights Reserved. 3 Shiro Uemura Chief Financial Officer © 2015 NEXON Co., Ltd. All Rights Reserved. 4 Q1 2015 Results © 2015 NEXON Co., Ltd. All Rights Reserved. 5 Q1 Highlights Revenues were ¥52.0 billion, up 9% year-over-year on an as-reported basis, down 1% on a constant currency basis; operating income was ¥22.2 billion, up 5% year-over-year Revenues and operating income exceeded the high end of our outlook – – Revenue outperformance was primarily driven by strong results from China and Korea in latter half of February and March – China: Dungeon&Fighter rebounded and built momentum from a slower early start of 2/10 Lunar New Year update, supported by strong operations – Korea: existing PC and mobile titles performed well driven by well-received content updates, promotion and item sales, especially during Lunar New Year holiday Operating income outperformance was driven primarily by – Stronger-than-expected revenues from China and Korea – Lower-than-expected marketing spending – Lower HR costs, particularly headcount and employee benefits Net income1 was ¥18.5 billion, up 15% year-over-year. Net income outperformance was primarily due to stronger-than-expected operating income 1 Net income refers to net income attributable to owners of the parent, as stated in Nexon’s consolidated financial results © 2015 NEXON Co., Ltd. All Rights Reserved. 6 Q1 Financial Results (Unit: ¥ millions, except per share data) Q1 2014 Q1 2015 Outlook Low end Revenues 1 PC Mobile Japan ex-Japan ¥47,491 40,297 7,194 ¥44,259 36,859 7,400 Q1 2015 YoY % High end ¥47,728 39,641 8,087 6,100 1,094 ¥51,972 43,602 8,370 9% 8% 16% 4,487 3,883 (26%) 255% Operating income 21,171 14,715 18,138 22,219 5% Net income2 16,144 12,793 15,669 18,539 15% 36.74 29.66 36.33 43.05 Earnings per share Cash and cash equivalents Exchange rates 100 KRW/JPY CNY/JPY USD/JPY 149,040 9.63 16.83 102.78 120,990 10.55 18.59 114.54 10.55 18.59 114.54 10.85 19.32 119.09 1 PC 2 revenue includes revenues other than PC / mobile revenues Net income refers to net income attributable to owners of the parent, as stated in Nexon’s consolidated financial results. © 2015 NEXON Co., Ltd. All Rights Reserved. 7 Regional Revenues (Unit: ¥ millions) Q1 2015 Revenue by Platform Q1 2015 Q1 2014 Revenue by Region1 China Korea Japan North America Europe and Others 2 Nexon Total (AsReported) (Constant Currency) YoY % Change (As(Constant Reported) Currency) ¥21,302 15,251 8,121 1,345 1,472 47,491 ¥22,697 20,464 5,858 1,695 1,258 51,972 ¥20,131 18,161 5,858 1,464 1,194 46,808 7% 34% (28%) 26% (15%) 9% (5%) 19% (28%) 9% (19%) (1%) 40,297 7,194 43,602 8,370 38,883 7,925 8% 16% (4%) 10% 6,100 1,094 4,487 3,883 4,487 3,438 (26%) 255% (26%) 214% Nexon Total 47,491 51,972 46,808 9% (1%) FX Rate 100 KRW/JPY CNY/JPY USD/JPY 9.63 16.83 102.78 10.85 19.32 119.09 9.63 16.83 102.78 Mobile 16% 3 PC 84% Revenue by Platform PC3 Mobile Japan ex-Japan Q1 2015 Revenue by Region1 Europe and Others 3% North America 3% Japan 11% Korea 39% China 44% 1 Based on the regions in which revenues originate; not a representation of revenues according to Nexon entities. Europe and Others includes other Asian countries and South American countries. 3 PC revenue includes revenues other than PC / mobile revenues. 4 For the KPIs (MAU, Pay Rate and ARPPU) of PC online games, please refer to appendix of this presentation. 2 © 2015 NEXON Co., Ltd. All Rights Reserved. 8 China – Highlights – YoY% change: (Unit: ¥ millions) Dungeon&Fighter As Reported: Constant Currency: Rebounded and built momentum from a slower early start of 2/10 Lunar New Year update, supported by strong operations +7% -5% 22,697 21,302 – Well-received content update and item sales in latter half of February and March – Q1 MAUs decreased quarter-over-quarter – Paying users flattish quarter-over-quarter Dungeon&Fighter “Lunar New Year Update” © 2015 NEXON Co., Ltd. All Rights Reserved. Dungeon&Fighter Game Play 15,685 16,441 13,530 Q1 2014 Q2 2014 Q3 2014 Q4 2014 Q1 2015 9 Korea – Highlights Strong performance by existing PC and mobile titles driven by well-received content updates and strong item sales in latter half of February and March, especially during Lunar New Year holiday YoY% change: (Unit: ¥ millions) Quarter-over-quarter growth from key mobile titles: – – As Reported: +34% Constant Currency: +19% 20,464 19,976 FIFA Online 3 M: Lunar New Year item sales well received Legion of Heroes: large scale 1st anniversary content update (2/12) well received 16,749 Year-over-year growth from key PC titles: – Solid performance from Dungeon&Fighter and Sudden Attack – Successful content updates, promotions and item sales 15,251 13,433 15,882 Conducted CBT for high-quality mobile titles: – Mabinogi Duel: conducted global CBT (March - April) – Super Fantasy War: completed CBT in Korea (March) 16,975 PC 13,492 14,167 10,965 4,094 2,468 3,257 3,489 Mobile 1,084 Legion of Heroes 1st Anniversary Update 1 Super Fantasy War PC revenue includes revenues other than PC / mobile revenues. © 2015 NEXON Co., Ltd. All Rights Reserved. 1 Q1 2014 Q2 2014 Q3 2014 Q4 2014 Q1 2015 10 Japan – Highlights Mobile revenue was ¥4.5 billion, down 17% quarterover-quarter primarily due to declining browser game revenues (Unit: ¥ millions) YoY% change: As Reported: -28% Constant Currency: -28% 1 PC revenue was ¥1.4 billion, down 11% quarterover-quarter 8,121 7,656 LINE Cross Legion (Japan service name of Legion of Heroes): completed CBT in Q1 7,232 6,929 2,021 1,697 1,662 1,545 Announced co-development deal with SQUARE ENIX to develop mobile game version of legendary MMORPG FINAL FANTASY XI 5,858 1 1,371 PC Remains an area of management focus 6,100 5,959 5,570 5,384 4,487 Mobile LINE Cross Legion 1 LINE Cross Legion CBT game play PC revenue includes revenues other than PC / mobile revenues. © 2015 NEXON Co., Ltd. All Rights Reserved. Q1 2014 Q2 2014 Q3 2014 Q4 2014 Q1 2015 11 North America, Europe and Others – Highlights North America – Year-over-year growth from key PC titles including Vindictus and Dragon Nest supported by improved operations and marketing – Dirty Bomb: completed CBT on STEAM1 in Q1 Europe and Others – Europe: Nexon Europe to relocate from Luxemburg to Berlin, Germany – better access to talent (Unit: ¥ millions) (Unit: ¥ millions) YoY% change: As Reported: Constant Currency: YoY% change: +26% +9% North America 1 -19% 1,472 1,420 Q2 2014 Constant Currency: 1,695 1,300 1,144 1,131 Q1 2014 -15% Europe and Others 1,623 1,345 As Reported: Q3 2014 Q4 2014 Q1 2015 Q1 2014 Q2 2014 Q3 2014 1,190 1,258 Q4 2014 Q1 2015 STEAM is an internet-based computer game distribution, digital rights management, multiplayer, and social networking platform developed / operated by Valve Corporation. © 2015 NEXON Co., Ltd. All Rights Reserved. 12 Q2 2015 Outlook © 2015 NEXON Co., Ltd. All Rights Reserved. Q2 2015 Business Outlook (Unit: ¥ millions, except per share data) Expect revenues to be up 9% to up 17% year-over-year on an as-reported basis Q2 2014 Revenues 1 PC Mobile Operating income Net income2 Earnings per share FX Rate Assumptions 100 KRW/JPY CNY/JPY USD/JPY Q2 2015 Outlook ¥36,894 28,459 8,435 9,962 4,085 ¥40,254 30,058 10,196 8,805 7,180 9.33 16.79 9.95 16.54 102.16 10.85 19.32 119.09 ~ ¥43,000 ~ 31,820 ~ 11,180 ~ 11,051 ~ 9,463 ~ YoY 9% 6% 21% (12%) 76% ~ ~ ~ ~ ~ 17% 12% 33% 11% 132% 22.13 10.85 19.32 119.09 Forex sensitivity: every one Japanese yen move against the U.S. dollar would have the following impact on our financials for the second quarter of 20153 Revenue Operating Income 0.31 billion yen 0.09 billion yen 1 PC revenue includes revenues other than PC / mobile revenues. income refers to net income attributable to owners of the parent, as stated in Nexon’s consolidated financial results. 3 In most situations, the exchange rates of both the South Korean won and the Chinese yuan are linked to the U.S. dollar. 2 Net © 2015 NEXON Co., Ltd. All Rights Reserved. 14 2015 Q2 and Full-Year Regional Outlook China Q2 Expect high single digit to high teens % YoY increase on an as-reported basis Dungeon&Fighter - Labor day update introduced on 4/23 7th year anniversary update scheduled in June Counter-Strike Online 2 (PC) launched on 4/22 from Tiancity Full-Year Preparing for new mobile title launch: - Dungeon&Fighter Mobile (publisher: Tencent) Legion of Heroes (publisher: Chukong) Korea Q2 Expect high teens to 20+% YoY increase on an as-reported basis Mobile - Top of Tanker launched on 4/14 (Chinese title: 我叫MT2) Scheduled to launch Mabinogi Duel, Tian Long Ba Bu, Gwanggaeto the Great Super Fantasy War completed global CBT in April PC: conducted 1st CBT for Ghost in the Shell Online (April); final CBT for MapleStory2 (May) Full-Year Multiple PC / mobile titles to be launched in 2015 across genres Global launch scheduled for several mobile titles Japan North America, Europe and Others Q2 Expect 30+% YoY decrease on an as-reported basis Q2 North America: expect over 3x YoY increase on an as-reported basis LINE Cross Legion (Japan service of Legion of Heroes) scheduled for launch Europe and Others: expect low teens % YoY decrease on an as-reported basis Full-Year Launched DomiNations (mobile) on 4/2 Scheduled to launch multiple high-quality mobile titles of Nexon group In North America, Dirty Bomb (PC) scheduled for OBT in June gloops to launch several browser / native mobile titles in 2015 Full-Year Multiple mobile titles scheduled for launch from strategic partner studios © 2015 NEXON Co., Ltd. All Rights Reserved. 15 Q2 2015 Operating Income Outlook (Unit: ¥ billions) YoY Operating Income Comparison Expect Q2 2015 operating income of ¥8.8 to ¥11.1 billion due to: 2.5 6.1 Increase in revenues driven by growth in PC / mobile business Increase in variable costs including: 2.0 0.5 11.1 10.0 Operating Income 2014 Q2 Revenues Variable Cost Marketing © 2015 NEXON Co., Ltd. All Rights Reserved. Others – Royalty costs associated with third-party licensed games, such as DomiNations and Top of Tanker – PG fee with growth in mobile business Increase in marketing cost associated with multiple new title launches, including DomiNations Operating Income 2015 Q2 (High-end) 16 Current Share Repurchase Program Announced share repurchase program on February 26th, 2015 Details of share buyback program: – Total number of shares: Up to 8.5 million shares (2.0% of the total number of outstanding shares) – Total amount: Up to ¥10 billion – Period: From February 27th to May 27th – Acquisition method: Purchase at market on the Tokyo Stock Exchange Aggregate amount of shares repurchased as of April 30th, 2015 – Total number of shares acquired: 6,174,900 shares – Total amount: ¥8,194,132,488 © 2015 NEXON Co., Ltd. All Rights Reserved. 17 2015 Tier 1 Content Update Schedule China Game Title Q1 2015 Q2 2015 Winter Content Update Lunar New Year Update Labor Day Update 7th Anniversary Update 2H 2015 Summer Update National Holiday Update Dungeon&Fighter Lunar New Year Update Summer Update Lunar New Year Update Summer Update Roster Update Counter-Strike Online Korea EA SPORTSTM FIFA Online 3 MapleStory Ice & Burn Update 12th Anniversary Update Summer Update Lunar New Year Update Children’s day Package 10th Anniversary Update Chuseok Package Rare Avatar & Christmas Package Winter Update (continued from Q4 2014) Summer Update 10th Anniversary Event MapleStory Dungeon&Fighter Sudden Attack 1 . The letters, graphics, symbols, logos and other marks shown in this material are trademarks or registered trademarks owned by respective right holders. © 2015 NEXON Co., Ltd. All Rights Reserved. 18 Unmatched Pipeline1(1) PC Online 1H 2015 2H 2015 and onward MapleStory2 Counter Strike Online 2 Mabinogi Duel Sudden Attack 2 Blue Streak by Boss Key Productions Rebellion by Envision Entertainment Legacy Quest by Social Spiel Final Fantasy XI Mobile Dungeon&Fighter Mobile Lego® Mobile Mobile DomiNations Ghost in the Shell Online Top of Tanker LINE Cross Legion (Japan service of Legion of Heroes) Gwanggaeto the Great Tian Long Ba Bu Super Fantasy War Durango 1 Chart is illustrative excerpt pipeline. The letters, graphics, symbols, logos and other marks shown in this material are trademarks or registered trademarks owned by respective right holders. . © 2015 NEXON Co., Ltd. All Rights Reserved. 2 19 Unmatched Pipeline (2) PC Online Game MapleStory2 (in-house, Korea / China) 1 . Ghost in the Shell Online (in-house, global) The letters, graphics, symbols, logos and other marks shown in this material are trademarks or registered trademarks owned by respective right holders. © 2015 NEXON Co., Ltd. All Rights Reserved. 20 Unmatched Pipeline (3) Mobile Games DomiNations1 (publishing, global) Top of Tanker (publishing, Korea) Durango (in-house, global) Mabinogi Duel (in-house, global) 1 Title 2 from strategic partnership studio The letters, graphics, symbols, logos and other marks shown in this material are trademarks or registered trademarks owned by respective right holders. © 2015 NEXON Co., Ltd. All Rights Reserved. 21 Appendix © 2015 NEXON Co., Ltd. All Rights Reserved. 22 Summary of Results and Key Operational Metrics (Unit: ¥ millions except per share data) Q1 2014 (By Region) China Korea Japan North America Europe and Others (By Business) Q4 2014 Q1 2015 YoY% ¥13,530 13,433 7,656 1,131 1,144 ¥15,685 19,976 7,232 1,420 1,300 ¥16,441 16,749 6,929 1,623 1,190 ¥22,697 20,464 5,858 1,695 1,258 7% 34% (28%) 26% (15%) 40,297 7,194 28,459 8,435 35,931 9,682 34,041 8,891 43,602 8,370 8% 16% Japan 6,100 5,959 5,570 5,384 4,487 (26%) ex-Japan 1,094 2,476 4,112 3,507 3,883 255% Revenue 47,491 36,894 45,613 42,932 51,972 9% Operating income/(loss) 21,171 9,962 15,124 (748) 22,219 5% Net income/(loss)2 16,144 4,085 13,585 (4,498) 18,539 15% 36.74 9.33 31.49 (10.45) 43.05 149,040 140,157 114,155 117,729 120,990 9.63 16.83 102.78 9.95 16.54 102.16 10.15 16.87 103.92 10.55 18.59 114.54 10.85 19.32 119.09 55.9 11.0% 3,639 51.9 10.2% 2,781 52.7 9.7% 3,476 50.5 9.3% 3,776 48.9 10.0% 4,805 Earnings/(loss) per share Cash and deposits FX rate 100 KRW/JPY CNY/JPY USD/JPY Key Performance (Excluding Mobile) MAU (millions) Pay Rate ARPPU (as-reported) 2 Q3 2014 ¥21,302 15,251 8,121 1,345 1,472 PC online1 Mobile 1 Q2 2014 PC revenue includes revenues other than PC / mobile revenues Net income/(loss) refers to net income / (loss) attributable to owners of the parent, as stated in Nexon’s consolidated financial results. © 2015 NEXON Co., Ltd. All Rights Reserved. 23 COGS and SG&A (Unit: ¥ millions) FY2014 Total Cost of Revenue 1 Royalty 2 HR cost (COGS) 3 Other(COGS) 4 Total SG&A 1 HR cost PG fee 5 R&D Marketing / advertising expenses Depreciation and amortization Other Other Income 6 Other Expense 7 Q1 ¥10,249 Q2 ¥9,839 FY2015 Q3 ¥12,731 Q4 ¥11,516 Q1 ¥12,602 4,055 3,461 2,733 3,317 3,580 2,942 6,606 3,372 2,753 4,448 3,811 3,257 5,621 4,022 2,959 14,855 3,602 2,661 1,120 1,382 2,802 3,288 16,788 4,758 2,649 1,533 2,069 2,792 2,987 17,401 4,025 3,645 1,645 2,051 2,914 3,121 19,556 4,202 3,542 1,533 3,468 2,958 3,853 16,776 3,695 4,631 1,963 1,630 3,026 1,831 208 1,424 209 514 180 537 613 13,221 124 499 1 Breakdown of COGS and SG&As are unaudited. costs include royalties paid to third-party developers for the right to publish their games. 3 HR cost includes salaries, bonuses and benefits for our live game developers, who support post launch servicing, updating and support for our games. 4 Other (COGS) primarily consists of depreciation and amortization of assets related to existing games, connection fees (mainly comprised of co-location and datacenter fees, Internet bandwidth and access fees), and the costs of purchasing and maintaining our servers and computer equipment. 5 PG Fees in SG&A include commissions made to external payment gateway companies when users purchase in-game items in PC Online games that we service. It also includes mobile carrier-related commissions we pay regarding our Japanese mobile browser games, commissions we pay to Apple / Google regarding our native games globally, and platform commission fees related to mobile browser games. Before 2014 Q4, platform commission fees related to mobile browser games are included in Other in SG&A. 6 Other Income includes other non-operating income, reversal of deferred revenue, gain on sale of properties, and gain on change in equity. 7 Other Expense includes other non-operating expenses, loss on sale/disposal of properties, loss on impairment of tangible fixed assets, loss on impairment of intangible assets, loss on impairment of other fixed assets, loss on change in equity, and loss on liquidation of subsidiaries. Q1 2014, Q2 2014, Q3 2014, 2014 and Q1 2015 Other Expense includes impairment of game IP and impairment of goodwill. 2 Royalty © 2015 NEXON Co., Ltd. All Rights Reserved. 24 P&L Below Operating Income (Unit: ¥ millions) FY2014 Operating Income/(Loss) Finance Income 1 Finance Costs 2 Equity income/(losses) of affiliates, equity method companies Income/(Loss) before Income Tax Tax expense Net Income/(loss) 3 Q1 ¥21,171 1,014 385 Q2 ¥9,962 1,024 3,655 FY2015 Q3 ¥15,124 5,122 360 (32) (73) (93) 21,768 (5,446) 16,144 7,258 (3,089) 4,085 19,793 (6,132) 13,585 Q4 (¥748) 5,381 781 Q1 ¥22,219 2,576 117 0 3,852 (8,583) (4,498) 4 24,682 (5,835) 18,539 1 2014 Q3 and Q4 Finance Income is primarily caused by FX conversion gain related to foreign currency deposits & A/R. 2015 Q1 Finance Income is primarily caused by dividend received from investee and FX conversion gain related to foreign currency deposits & A/R. 2 2014 Q2 Finance Costs are primarily caused by FX conversion loss related to foreign currency deposits & A/R. 3 Net income/(loss) refers to net income attributable to owners of the parent, as stated in Nexon’s consolidated financial results. © 2015 NEXON Co., Ltd. All Rights Reserved. 25 Key Cash Flow Statement (Unit: ¥ millions) 3 months ended March 31, 2014 3 months ended March 31, 2015 ¥13,460 Cash flows from operating activities ¥9,169 Cash flows from investing activities 11,005 (3,809) Cash flows from financing activities (7,276) (4,936) Net increase / (decrease) in cash and cash equivalents 12,898 4,715 Cash and cash equivalents at beginning of fiscal year Effect of exchange rate change on cash and cash equivalents Cash and cash equivalents at end of fiscal year © 2015 NEXON Co., Ltd. All Rights Reserved. 138,843 117,729 (2,701) (1,454) 149,040 120,990 26 Balance Sheet (Unit: ¥ millions) December 31, 2014 Asset Current Assets Cash and cash equivalents Other current assets Total current assets Noncurrent assets Tangible assets Goodwill Intangible assets March 31, 2015 ¥117,729 140,396 258,125 ¥120,990 149,964 270,954 24,039 35,426 16,574 23,381 35,298 13,108 102,858 178,897 437,022 102,498 174,285 445,239 Current tax liabilities, current 12,836 11,748 Current borrowings Others Total current liabilities Noncurrent liabilities Non-current borrowings Others Total noncurrent liabilities Total liabilities 13,180 31,007 57,023 14,969 28,740 55,457 23,244 11,278 34,522 91,545 20,744 9,868 30,612 86,069 52,481 40,830 92,044 155,025 5,097 345,477 437,022 52,726 41,072 (4,249) 92,844 171,423 5,354 359,170 445,239 Others Total noncurrent assets Total assets Update 5/7 Liability Current liabilities Equity Issued capital Share premium Treasury shares Other equity interest Retained earnings Non-controlling interests Total equity Total liabilities and total equity © 2015 NEXON Co., Ltd. All Rights Reserved. 27 Our Business Continues to Evolve Long-term Growth Vision and Evolution1 M&A Revenue M&A 2014 Year Existing 1 Above graph is illustrative and not to scale © 2015 NEXON Co., Ltd. All Rights Reserved. New PC / mobile West 28 Glossary of Terms Term / Abbreviation Meaning AOS AOS is a sub-genre of the real-time strategy genre, in which two teams of players compete with each other in discrete games, with each player controlling a single character through an RTS-style interface. FPS (first person shooter) A game in which the player plays from the point of view of the game character in three-dimensional graphics. RTS (real-time strategy) A game that is usually played from a third-person perspective, in which the player controls vast numbers of in-game characters in a tactical scenario. MMORPG (massively multiplayer online role playing game) An online role-playing game that has a “massive” number (usually several hundred or more) of players who play concurrently. MAU (monthly active user) Update 5/7 The total number of accounts of users who log in and play a particular game in a given month. ARPPU (average revenue per paying user) Online game net revenues for any given period divided by the average number of paying players of such games during the period. Pay Rate The number of paying users divided by monthly active users for any given period of time. MCCU (maximum concurrent users) The maximum number of users concurrently accessing a game at a particular moment. MCCU is generally used to measure the popularity of a game. Closed Beta A trial period during which a trial model (beta version) of a game is tested by a limited number of users or groups. Open Beta A trial period during which a trial model (beta version) of a game is tested without restrictions on participation. Tier One Update Large scale updates to existing PC games typically launched in Q1 or Q3 around peak season. Tier Two Update Smaller updates to existing PC games released throughout the year. Immersive Games Games that are designed to be played continuously for hours and enable thousands of concurrent users to interact with each other in real time. Our games are architected to evolve over years, in contrast to packaged goods games, which often have finite story lines and comparatively less open-ended player engagement. © 2015 NEXON Co., Ltd. All Rights Reserved. 29 Disclaimer This presentation is prepared to offer reference information about NEXON group to the investors and is intended to generally provide investors and analysts with financial and operational information about Nexon, but not to solicit or recommend any sale or purchase of stock or other securities of Nexon. NEXON Co., Ltd. (“Nexon”) has not verified and would assume no responsibility for the accuracy, appropriation, or completeness thereof. This presentation does not contain all relevant information relating to Nexon or the sale of its shares, including, without limitation, the information that would be stated under the captions “Risk Factors”, “Management’s Discussion and Analysis of Financial Condition and Results of Operations” and “Business” in an annual report. Any investment decision with respect to any shares of Nexon should be made solely upon the basis of the information contained in the disclosure documents and is qualified in its entirety by reference to the detailed information appearing in the disclosure documents. This presentation includes non-GAAP and non-IFRS financial measures, including but not limited to key performance indicators, as well as ratios calculated on the basis thereof. These non-GAAP and non-IFRS financial measures should not be considered in isolation or as a substitute for the most directly comparable financial measures included in our consolidated financial statements and presented in accordance with IFRS. This presentation includes forward-looking statements. In some cases, you can identify forward-looking statements by terms such as “anticipate”, “assume”, “believe”, “estimate”, “expect”, “forecast”, “may”, “plan”, “potential”, “predict”, “seek”, “should”, or “will”, or by other similar terminology. These statements discuss expectations, identify strategies, contain projections of Nexon’s financial condition or results of operations or state other forwardlooking information. The forward-looking statements in this presentation are subject to various risks, uncertainties and assumptions about Nexon’s business and results of operations. The expectations expressed in these forward-looking statements may not be achieved, and actual results could differ materially from and be worse than expectations. Potential risks and uncertainties that could cause actual results to differ materially from expectations include, without limitation: Continued growth and popularity of Nexon’s key titles; Nexon’s ability to maintain favorable relationships with key licensing partners; Nexon’s continued ability to offer games in China, through local partners or otherwise; Nexon’s ability to compete effectively in the online games industry; Nexon’s ability to address hacking, viruses, security breaches and other technical challenges; Fluctuations in currency exchange rates; Nexon’s ability to maintain and further develop its brand name; Effective acquisition of new companies, businesses, technologies and games from third parties and the possibility of recognizing impairment losses; Continued growth of the online games market, including the underlying infrastructure, and free-to-play/item-based revenue generation model; Nexon’s ability to adapt to new technologies; Nexon’s ability to enter into licensing arrangements for third-party titles on terms favorable to it; Effective defense of Nexon’s intellectual property; and Legislative, regulatory, accounting and taxation changes in the countries in which Nexon operates. Nexon does not intend, and disclaims any duty, to update or revise any forward-looking statements contained in this presentation to reflect new information, future events or otherwise. We caution you not to place undue reliance on the forward-looking statements contained in this presentation. © 2015 NEXON Co., Ltd. All Rights Reserved. 30


© Copyright 2026