
Amphibian and reptilian distribution patterns in the transitional zone
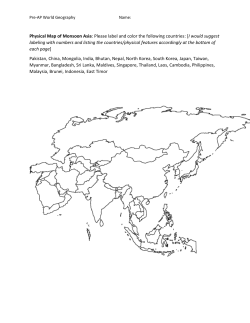
J Arid Land (2015) 7(4): 555–565 doi: 10.1007/s40333-015-0124-y jal.xjegi.com; www.springer.com/40333 Amphibian and reptilian distribution patterns in the transitional zone between the Euro-Siberian and Central Asia Subrealms ZHOU Lu, SHI Lei* College of Animal Science, Xinjiang Agricultural University, Urumqi 830052, China Abstract: There exist some controversies over the larger zoogeographic divisions of the arid areas of Central Asia, whose characteristics include complex ecological environments, complex fauna origins and unique patterns of animal distribution. The aim of this study was to determine, using quantitative analysis, the distribution patterns of amphibians and reptiles in the arid areas of Central Asia, whose various physiographical regions were divided into 17 Operative Geographical Units (OGUs). Based on the presence or absence of 52 amphibian and reptile genera in the 17 OGUs, and by making use of the Czekanowski Similarity Index, the Baroni-Urbani and Buser’s Similarity Index, and the strong and weak boundary test, we studied the biotic boundaries within these contested regions. In accordance with our results, the classification dendrogram was divided into two main branches. One branch is composed of the northern OGUs of the Altai Mountains which are a part of the Euro-Siberian Subrealm. The other branch includes all of the OGUs south of the Altai Mountains, which belong to the Central Asia Subrealm. There is a significantly weak biotic boundary (DW>0, GW>GS, P<0.01) between the Euro-Siberian Subrealm and the Central Asia Subrealm that corresponded to the transitional zones. The boundary between the two subrealms runs along the Altai Mountains, the Sayan Mountains, the Hangai Mountains and the Mongolian Dagurr Mountains. The boundaries between the main branches in the Central Asia Subrealm are weak, reflecting the widespread existence of transitional zones in the arid areas of Central Asia. The Tianshan Mountains should be elevated to form its own separate region, “the Middle Asian Mountain Region”, which, due to its special fauna and environment, would be classified at the same level as the Mongolia-Xinjiang Region. With the approach of creating a cluster analysis dendogram based upon the genera of amphibians and reptiles, the relationship of these higher level zoogeographical divisions was successfully resolved and the error of long-branch attraction was also avoided. With our clustering dendrogram as the foundation, the independence test was applied to strong and weak boundaries, and this resolved the problem of where to attribute the transition areas and revealed as well the barrier effect that physical, geographic boundaries have upon amphibians and reptiles. The approach of combining genera clustering analysis with a statistical boundary test should be applicable not only to the distribution patterns of other animal groups, but also to delineating large-scale zoogeographical divisions. Keywords: amphibian and reptile; distribution pattern; higher level zoogeographic division; similarity analysis; boundary test; arid area; Central Asia Citation: ZHOU Lu, SHI Lei. 2015. Amphibian and reptilian distribution patterns in the transitional zone between the Euro-Siberian and Central Asia Subrealms. Journal of Arid Land, 7(4): 555–565. doi: 10.1007/s40333-015-0124-y Central Asia owns one third of the world’s arid areas, and it has become a hotspot region for global climate change research (Chen et al., 2012). The distribution patterns of animals within arid zones and the factors which influence this distribution are of great signifi cance in understanding the response of animals to global climate change (Holt et al., 2013; Rueda et al., 2013; Ribeiro et al., 2014). However, there exist some controversies with regard to the higher-level zoogeographic divisions of the arid areas of Central Asia, Corresponding author: SHI Lei (E-mail: [email protected]) Received 2014-09-16; revised 2014-11-25; accepted 2015-01-26 © Xinjiang Institute of Ecology and Geography, Chinese Academy of Sciences, Science Press and Springer-Verlag Berlin Heidelberg 2015 556 JOURNAL OF ARID LAND 2015 Vol. 7 No. 4 whose characteristics include complex ecosystems, complex fauna origins, and unique patterns of animal distribution. Within China, there is a debate as to whether the Altai Mountains should be classified into the Central Asia Subrealm (Zhang, 2009) or the Euro-Siberian Subrealm (Ma et al., 1987). Outside of China, the latter classification tends to be favored (Bobrov, 2000; Krivokhatsky and Emeljanov, 2000; Ravkin et al., 2010, 2014). The Tianshan Mountains are often classified zoogeographically as a desert unit (Ma et al., 1987; Huang, 2005; Zhang, 2009; Shen et al., 2013a). However, when viewed as a global ecological zone, they are distinguished from desert areas (Schults, 2010). These differing viewpoints are largely related to its being a wide-ranging transitional area shaped by complex geology, complex geographical conditions, and complex fauna evolution (Zhang, 2009). The best method for the geographic grouping of the various species is to use quantitative analysis so as to avoid subjective errors and to produce consistent results (Márquez et al., 1997; Sans-Fuentes and Ventura, 2000). A common approach has been to utilize clustering analysis to study the large scale distribution patterns of animals (Xie et al., 2002; Huang et al., 2007; Liu et al., 2013). However, the “long-branch attraction” (Li et al., 2007) of clustering analysis often results in grouping errors (Ravkin et al., 2010; Shen et al., 2013b; Guo and Cui, 2014) because certain geographical units which are only remotely-related to the others may alter the topological structure of a geographical grouping and result in the lumping together of units which actually have large differences (Li et al., 2007). Researchers have used different methods to solve this problem (Ravkin et al., 2010; Shen et al., 2013b; Guo and Cui, 2014). The method outlined by McCoy et al. (1986), known as the strong and weak boundary test, is an extension of the probabilistic similarity techniques (Crick, 1980) used to develop a matrix-analysis method in which boundaries are placed between the biota of artificially organized areas. It is an objective method that performs well in zoogeographic boundary analysis (Sans-Fuentes and Ventura, 2000; Xiang et al., 2004). Birds and mammals, which are warm-blooded animals, are highly mobile and highly adaptative to their environments. Some birds in East Asia are able to fly over the Himalayas and into Xinjiang of China (Ma, 2011). The distribution areas of many of these animals are not consistent. On the contrary, amphibians and reptiles are cold-blooded. They are limited by temperature, humidity and geographic barriers (Burke and Ner, 2005). Their limited mobility results in stable distribution patterns. Thus it is highly advantageous to use them in biotic boundary research. By analyzing 128 species of amphibians and reptiles in 75 different geographical districts (GDs), we established a dendrogram using the clustering method. This dendrogram contains 17 main branches. The relationships among the GDs within each branch were consistent and logical, but the relationships among the 17 branches were often variable and illogical when utilizing various clustering methods (unpublished data). This suggested that species clustering is limited in its ability to solve the problems of higher-level geographic relationships. Those genera and families which exhibit wide patterns of distribution possess a high degree of intercontinental substitutability, and the differences among the higher-level zoogeographical units of division are reflected in the differences among higher-level taxonomic categories (Zhang, 2009). In addition, the dendrogram of genera-level clustering provides significant clustering information (Shen et al., 2013b). Many large scale biogeographical studies are based on genera or families, such as the snakes of Indonesia (How and Kitchener, 1997), the antlion of Palaearctic (Krivokhatsky and Emeljanov, 2000), bats of the world (Procheş, 2005), and spiders of the world (Shen et al., 2013b). Therefore, we used the genera level data and combined the strong and weak boundary test with clustering analysis to determine the interrelationships of 17 branches in an attempt to analyze the distribution patterns within the contested areas mentioned above. 1 Materials and methods 1.1 Study area The study area included Xinjiang, Alxa Plateau and Tengger Desert in Inner Mongolia, the Hexi Corridor in Gansu, Qinghai and Tibet (excluding the Hengduan Mountain Region) of China, Kazakhstan, Kyrgyzstan, Tajikistan, Turkmenistan, Uzbekistan, Sayan Mountains and Lake Baikal in Russia, and the west of Ondorhaan-Mandal in Mongolia (Fig. 1). Based on the ZHOU Lu et al.: Amphibian and reptilian distribution patterns in the transitional zone between the Euro-Siberian… distribution of 128 amphibian and reptile species in 75 GDs, we created a dendrogram using the clustering method (unpublished data). Our dendrogram consists of Fig. 1 557 17 main branches which correspond to 17 zoogeographical provinces and are referred to as Operative Geographical Units (OGUs) in this paper (Fig. 2). Location of the study area Fig. 2 Location of the 17 Operative Geographical Units (OGUs) in this study. AM=Altai Mountains, SM=Sayan Mountains, AB=Angara-Baikal, HDM=Hangai-Dagurr Mountains, MTM=Middle Tianshan Mountains, WTM=West Tianshan Mountains, JBM=Junggar boundary mountain, ETM=Eastern Tianshan Mountains, JB=Junggar Basin, TB=Tarim Basin, EXMD=Eastern Xinjiang-Mongolia deserts, TD=Turanian Desert, PP=Pamir Plateau, KTM=Kunlun-Tanggula Mountains, TP=Tibetan Plateau, QB=Qaidam Basin, QM=Qilian Mountains. 558 JOURNAL OF ARID LAND 2015 Vol. 7 No. 4 1.2 Study materials Species distribution data came from the records of the Animal Specimen Museum of Xinjiang Agricultural University of China as well as from the literatures of amphibian and reptile distribution in China (Zhang et al., 1998; Zhao et al., 1998, 1999; Fei et al., 2006, 2009a, b), Xinjiang of China (Zhou et al., 1986; Shi et al., 2005, 2006a, b, 2007; Wang et al., 2006; Shi and Zhao, 2008, 2011; Li et al., 2013), Gansu of China (Yao et al., 2012), Tibet of China (Hu et al., 1987; Li et al., 2008), Inner Mongolia of China (Xu et al., 2001; Zhao, 2002), Qinghai of China (Li, 1989; Ji et al., 2009), Mongolia (Terbish et al., 2006), Russia and its adjacent countries (Terent’ev et al., 1949; Shcherbak, 1981; Bobrov, 2000; Bobrov and Aleshchenko, 2001; Anan’eva et al., 2006; Ravkin et al., 2010). Our classification system was taken from the “Reptile Database” (http://www.reptile-database.org) and “Amphibian Species of the World 6.0” (http://research. amnh.org/vz/herpetology/amphibia). 1.3 Study methods A 0–1 (absence/presence) matrix for 52 genera in 17 Table 1 Genus OGUs was constructed (presence=1 and absence=0; Table 1). We established our dendrogram using clustering analysis, the Czekanowski Similarity Index (CI), and Ward’s minimum-variance method (Czekanowski, 1932; Magurran, 2004). In order to determine the significance of each node in the dendrogram, a probability of similarity table based on the Baroni-Urbani and Busher Similarity Index (BBI) for binary data was established. First, we used the BBI and the Unweighted Pair-Group Method with Arithmetic Mean (UPGMA) to obtain a similarity matrix. Next, the similarity values were converted into three categories, represented by the “+”, “–”, and “0” symbols, which indicate values significantly higher than expected, significantly lower than expected, and those which were not significantly different from what as expected, respectively. The converted values are to be regarded as a matrix of significant similarities (Xiang et al., 2004). The calculation for the clustering analysis was completed using DPS8.5 software. The independence test was accomplished using the G-Test Calculator (http://elem.com/~btilly/effective-ab-testing/g-test-cal culator.html). Presence (1) or absence (0) of genera considered in Xinjiang of China and its adjacent regions Operative Geographical Unit AM SM AB HDM MTM WTM JBM ETM JB TB EXMD TD PP KTM TP QB QM Hynobius 0 0 0 0 0 1 0 0 0 0 0 0 0 0 0 0 0 Salamandrella 1 1 1 1 0 0 0 0 0 0 0 0 0 0 0 0 0 Ranodon 0 0 0 0 1 0 0 0 0 0 0 0 0 0 0 0 0 Scutiger 0 0 0 0 0 0 0 0 0 0 0 0 0 0 1 0 0 bufo 1 1 0 0 0 0 0 0 0 0 0 0 0 0 0 0 0 Strauchbufo 0 1 1 1 1 1 0 1 1 1 1 0 0 0 0 1 1 Bufotes 1 1 1 0 1 1 1 1 1 1 1 1 1 1 1 0 0 Pelophylax 0 1 1 0 0 0 0 0 1 0 0 1 0 0 0 0 0 Rana 1 1 1 1 1 1 0 0 0 1 0 1 0 0 0 1 1 Nanorana 0 0 0 0 0 0 0 0 0 0 0 0 0 0 1 0 0 Testudo 0 0 0 0 0 0 0 0 0 0 0 1 0 0 0 0 0 Alsophylax 0 0 0 0 1 0 1 1 1 1 1 1 0 0 0 0 0 Cyrtopodion 0 0 0 0 0 1 0 1 0 1 1 1 0 0 1 0 0 Cyrtodactylus 0 0 0 0 0 0 0 0 0 0 0 0 0 0 1 0 0 Mediodactylus 0 0 0 0 0 0 1 0 1 0 0 1 0 0 0 0 0 Crossobamon 0 0 0 0 0 0 0 0 0 0 0 1 0 0 0 0 0 Altiphylax 0 0 0 0 0 1 0 0 0 0 0 0 0 0 0 0 0 Teratoscincus 0 0 0 0 0 0 0 0 1 1 1 1 0 0 0 0 0 Laudakia 0 0 0 0 1 1 0 1 1 1 1 1 1 0 1 0 0 ZHOU Lu et al.: Amphibian and reptilian distribution patterns in the transitional zone between the Euro-Siberian… 559 Continued Genus Operative Geographical Unit AM SM AB HDM MTM WTM JBM ETM JB TB EXMD TD PP KTM TP QB QM Phrynocephalus 0 0 0 0 1 0 0 1 1 1 1 1 0 1 1 1 1 Trapelus 0 0 0 0 0 0 0 0 0 0 0 1 0 0 0 0 0 Eremias 1 0 0 0 1 1 1 1 1 1 1 1 1 1 0 1 0 Zootoca 1 1 1 0 0 0 0 0 0 0 0 0 0 0 0 0 0 Lacerta 1 1 1 0 1 1 1 0 0 0 0 0 0 0 0 0 0 Ablepharus 0 0 0 0 0 0 0 0 0 0 0 1 0 0 0 0 0 Asymblepharus 0 0 0 0 1 1 0 0 0 0 0 0 1 0 0 0 0 Eumeces 0 0 0 0 0 0 0 0 0 0 0 1 0 0 0 0 0 Scincella 0 0 0 0 0 0 0 0 0 0 0 0 0 0 1 0 0 Pseudopus 0 0 0 0 0 0 0 0 0 0 0 1 0 0 0 0 0 Anguis 0 0 1 0 0 0 0 0 0 0 0 0 0 0 0 0 0 Varanus 0 0 0 0 0 0 0 0 0 0 0 1 0 0 0 0 0 Eryx 0 0 0 0 0 0 0 0 1 1 1 1 0 0 0 0 0 Typhlops 0 0 0 0 0 0 0 0 0 0 0 1 0 0 0 0 0 Boiga 0 0 0 0 0 0 0 0 0 0 0 1 0 0 0 0 0 Hierophis 1 1 0 1 0 0 0 0 1 0 1 0 0 0 0 0 0 Coluber 0 0 0 0 0 1 0 0 0 0 0 1 0 0 0 0 0 Spalerosophis 0 0 0 0 0 0 0 0 0 0 0 1 0 0 0 0 0 Hemorrhois 0 0 0 0 1 1 0 0 1 1 0 1 0 0 0 0 0 Natrix 1 1 1 0 1 1 1 0 1 1 0 1 0 0 0 0 0 Elaphe 1 1 1 1 1 1 1 0 1 1 1 1 0 0 0 0 0 Lycodon 0 0 0 0 0 0 0 0 0 0 0 1 0 0 0 0 0 Psammophis 0 0 0 0 0 0 0 0 1 1 1 1 0 0 0 0 0 Naja 0 0 0 0 0 0 0 0 0 0 0 1 0 0 0 0 0 Echis 0 0 0 0 0 0 0 0 0 0 0 1 0 0 0 0 0 Vipera 1 1 1 0 1 1 1 0 0 0 0 1 0 0 0 0 0 Gloydius 1 1 1 1 1 1 1 1 1 1 1 1 0 0 0 1 0 Thermophis 0 0 0 0 0 0 0 0 0 0 0 0 0 0 1 0 0 Lytorhynchus 0 0 0 0 0 0 0 0 0 0 0 1 0 0 0 0 0 Coronella 0 0 1 0 0 0 0 0 0 0 0 0 0 0 0 0 0 Eurylepis 0 0 0 0 0 0 0 0 0 0 0 1 0 0 0 0 0 Oligodon 0 0 0 0 0 0 0 0 0 0 0 1 0 0 0 0 0 Ptyas 0 0 0 0 0 0 0 0 0 0 0 1 0 0 0 0 0 Note: The meanings of the abbreviations for OGUs are the same as in Fig. 2. The Czekanowski Similarity Index Formula (Czekanowski, 1932) is as follows: 2a CI . (1) b + c + 2a The Baroni-Urbani and Busher Similarity Index Formula (Baroni-Urbani and Busher, 1976) is as follows: BBI a ad (2) . a b c ad In Eqs. 1 and 2, a is the number of species which are present in both OGUs; b is the number of species which are present only in the 1st OGU and not in the 2nd one; c is the number of species which are only present in the 2nd OGU and not in the 1st one; and d is the number 560 JOURNAL OF ARID LAND 2015 Vol. 7 No. 4 of species which are present in neither of the OGUs. Following the method outlined by McCoy et al. (1986) and Real et al. (1992), for each node in the dendrogram, we tested for the presence of strong or weak significant segregations between groups of OGUs separated at the node. First, at each node of the dendrogram, a submatrix, which only included the OGUs found in that node, was established from the matrix of significant similarities. In this submatrix, 3 zones were divided. Zone A and zone B correspond to the two groups of OGUs at a node. Zone A×B corresponds to where zone A and zone B overlap. Second, according to the number of “+”, “–” and “0” symbols in each zone, we calculated the values of DW (A×A), DW (B×B), DW and DS. DW (A×A) and DW (B×B) measure the extent to which the similarities that were higher than expected (+) tend to be in zone A and zone B, respectively. DW, which can be computed by DW (A×A) and DW (B×B), is a measure of the effectiveness of a boundary between these separate groups of OGUs. DW can also be understood as a measure of similarity between the separate groups of OGUs. DS is another measure of the effectiveness of a boundary, which measures the extent to which similarities lower than expected (–) tend to be found in zone A×B. Third, the significance of each node was examined by applying the G-Test of independence (Yates’ correction) to the distribution of “+”, “–” and “0” symbols in zones A, B and A×B. Thus we obtained two parameters: GW for the weak boundary and GS for the strong boundary (for details see McCoy et al., 1986; Sans-Fuentes and Ventura, 2000; Xiang et al., 2004). 2 Results From the “absent/present” (0–1) distribution data of 52 genera in 17 OGUs, a CI matrix and a clustering dendrogram were derived (Fig. 3). Using the method above, the BBI values were converted to form a matrix consisting of “+”, “–” and “0” symbols (Table 2). The results of a test of independence of the strong and weak boundaries are displayed in Table 3. Fig. 3 Classification dendrogram of 52 genera of reptiles and amphibians in an arid area of Central Asia. The meanings of the abbre** viations for OGUs are the same as in Fig. 2. W=weak segregation; , P<0.01. ZHOU Lu et al.: Amphibian and reptilian distribution patterns in the transitional zone between the Euro-Siberian… Table 2 AM AM 561 Matrix of significant similarities of the genera of reptiles and amphibians in Central Asia SM AB HDM + + + + MTM WTM + SM 0.120 AB 0.280 0.154 HDM 0.444 0.368 0.474 MTM 0.407 0.429 0.429 0.619 WTM 0.429 0.448 0.448 0.636 JBM ETM JB TB EXMD TD PP KTM TP QB QM + + – – – – – – – – – – + + + + – – – – – – – – – – + + + + – – – – – – – – – – – – – – – – – – – – – + + + + + + + + – – – – + – + 0 – + – – – – – – – 0.226 JBM 0.333 0.455 0.455 0.733 0.333 0.440 ETM 0.700 0.714 0.714 0.714 0.391 0.500 0.529 + + 0 0 – – – – – – + + + – + + + + 0 JB 0.571 0.517 0.586 0.636 0.355 0.500 0.440 0.417 TB 0.556 0.571 0.571 0.619 0.267 0.355 0.500 0.304 0.161 + EXMD 0.600 + – – – – – – + – – – – – – – – – – 0 – – – – – – + – – – – + + – – 0.615 0.692 0.579 0.429 0.517 0.546 0.238 0.172 0.143 TD 0.702 0.708 0.708 0.854 0.560 0.569 0.636 0.674 0.451 0.440 0.542 PP 0.750 0.882 0.882 1.000 0.579 0.600 0.692 0.500 0.700 0.684 0.647 0.846 KTM 0.733 0.875 0.875 1.000 0.667 0.790 0.667 0.455 0.684 0.667 0.625 0.842 0.429 TP 0.905 0.909 0.909 1.000 0.750 0.760 0.889 0.529 0.760 0.667 0.636 0.818 0.692 0.667 QB 0.647 0.667 0.667 0.455 0.500 0.619 0.714 0.385 0.619 0.500 0.556 0.800 0.778 0.500 0.857 QM 0.867 0.750 0.750 0.556 0.667 0.790 1.000 0.636 0.790 0.667 0.750 0.895 1.000 0.667 0.833 + 0.250 Note: The upper right section of the table is a matrix of symbols converted from the Baroni-Urbani and Busher Similarity Index. The lower left section of the table is the Czekanowski Similarities Index. +, values significantly higher than expected at random, P<0.05; –, values significantly lower than expected at random, P<0.05; 0, values not different from those expected at random. The meanings of the abbreviations for OGUs are the same as in Fig. 2. Table 3 Significant segregations between the physiographical regions on the dendrogram fork Groups separated by the dendogram node Group A Group B Dissimilarity index Weak boundary DW (A×A) DW (B×B) DW Strong boundary W P DS S P 1–4 5–17 1.743 0.511 –0.404 0.151 15.954 ** –0.095 0.000 ns 5–12 13–17 1.455 0.213 –0.076 0.128 25.569 ** –0.124 0.000 ns 5–7 8–12 0.763 0.295 –0.219 0.244 4.543 * –0.395 0.000 ns 8–11 12 0.649 0.707 0.000 0.354 43.134 ** 0.707 23.454 ** 13–15 16–17 1.227 –0.548 0.416 0.080 0.000 ns –0.334 0.000 ns Note: The denotation for Operative Geographical Unit 1 to 17 can be found in Fig. 3. W and S indicate weak segregation and strong segregation between the groups, respectively. DW (A×A) and DW (B×B) quantify the internal homogeneity of each group analyzed. DW and DS quantify the value of each boundary. *, P<0.05; **, P<0.01; ns, no significance. The dendrogram was divided into two main branches (Fig. 3). One branch is comprised of the northern OGUs of the Altai Mountains, which belong to the Euro-Siberian Subrealm. The other branch includes all of the OGUs south of the Altai Mountains and belongs to Central Asia Subrealm. There is a significant weak biotic boundary (DW>0, GW>GS, P<0.01) between the two subrealms. In the latter branch, there is a significant weak biotic boundary (DW>0, GW>0, P<0.01) between the Tianshan Mountains group (MTM, WTM, JBM) on the one hand, and the Turanian Desert group (TD) and the Mongolia-Xinjiang desert group (JB, TB, EXMD and ETM) on the other. This branch contained another significant weak biotic boundary (DW>0, GW>0, P<0.01) between the Qinghai-Tibetan Plateau group (TP, KTM, QB, QM and PP) on the one hand, and the Tianshan Mountains, the Turanian Desert, and the Mongolia-Xinjiang desert groups (Table 3) on the other. 3 Discussion 3.1 The boundary between the Euro-Siberian and Central Asia Subrealms The environment of the Euro-Siberian Subrealm is 562 JOURNAL OF ARID LAND 2015 Vol. 7 No. 4 cold and wet, and the area sees a wide distribution of species that are hygrophilous and cold-tolerant, such as Zootoca vivipara, Vipera berus and Salamandrella keyserlingii. The southern distribution boundary of these species is the southern boundary of the Euro-Siberian Subrealm (Bobrov, 2000). Their distribution within our study area is the southern boundary of the Altai Mountains, the Hangai Mountains and the Mongolia Daguur Mountains. Farther south, they are not to be found. Even though the climate wet in the western Tianshan Moutains (Hijmans et al., 2005), these species are absent there. The river basin along the upper reaches of the Irtysh River in the Altai Mountains is a unique region in Xinjiang, as the fauna found here are predominately of the “northern type” (Shi et al., 2002). In addition, 41.1% of the birds in this basin are of the “northern type”, 21.8% are of the “widespread type”, and 25% are of the “Central Asian type” (Ablimit et al., 2003). Those cold-tolerant birds which are of the forest-meadow type, such as Tereao urogallus, Lyrurus tetrix, Lagopus mutus and Nycta scandiaca, tend to predominate here (Gao et al, 2000). The “Central Asia type” birds along this drainage are distributed only in the low mountain zone (Ma, 2011). Furthermore, 52% of the mammals here are of the “northern type”, 16% are of the “northeast type” and 12% are of the “Central Asia type” (Ablimit et al., 2003). Unlike the those from the Tianshan Mountains and the Junggar Basin, the hygrophilous mammals (Martes zibellina alyaica, Gulo gulo, Mustela erminea, Lynx lynx, Ursus arctos, Capreolus capreolus, Alces alces, Lepus timidus, Microtus aeconomus altaicus and Castor fiber) predominate here (Huang et al., 2007). The environment and the fauna in the Euro-Siberian subrealm exhibit high uniformity, and the warmth-loving and drought-tolerant species common elsewhere are almost absent. Our results show that all of the OGUs (AB, AM, SM and HDM) which belong to the Euro-Siberian Subrealm convene into one branch, and the other OGUs which belong to the Central Asia Subrealm form the other branch. It is most apparent that the environment and the fauna of the two subrealms are quite distinct from each other. In our research area, the boundary between the Euro-Siberian Subrealm and the Central Asia Subrealm runs along the Altai Mountains, the Sayan Mountains, the Hangai Mountains and the Mongolian Daguur Mountains. The OGUs south of this line belong to the Central Asia Subrealm, and those OGUs to its north belong to the Euro-Siberian Subrealm. There was a significant weak boundary between the OGUs of the Euro-Siberian Subrealm and the OGUs of the Central Asia Subrealm, which indicates the existence of a transitional zone between them. At the mid and upper elevations of the Altai Mountains, the average annual precipitation is more than 500 mm. Typical vegetation there consists of taiga forest, meadow steppe, moss and lichen. From the lower elevations of the Altai Mountains to the lower Irtysh River Valley, the climate becomes drier, the average annual precipitation gradually decreases to 200 mm or less, and the vegetation type changes to alpine steppe and desert. On the southern slope of the Altai Mountains there are 12 genera of amphibians and reptiles, eight of which are of the cold-tolerant and hygrophilous type. A similar situation also exists at the species level (Shi et al., 2002). However, only drought-tolerant genera (such as Eremias, Phrynocephalus, Eryx and Psammophis) and the relatively widespread amphibian species (such as Bufotes pewzowi) can be found on the plains along the Irtysh River. The distribution of mammals and birds on the plains follows a similar pattern (Ma et al., 1987; Ablimit et al., 2003). The piedmont transition zone is an area where hygrophilous and drought-tolerant species meet each other. Such transitional zones also exist between the northern mountains of Mongolia and its southwestern desert, and between the Kazakhskiy Melkosopochnik and the western Siberian Plains (Krivokhatsky and Emeljanov, 2000). These are transitional zones of not only climate and vegetation, but also animal distribution. This is one of the reasons that the boundary between the Euro-Siberian Subrealm and the Central Asia Subrealm has been subject to controversy. The results of the test of independence when applied to boundaries between the main branches in the Central Asia Subrealm are all significantly weak (Fig. 3). Quantitative analysis confirms that the widespread existence of transitional zones, which is a salient characteristic of the arid areas within Central Asia, results in indistinct boundaries. ZHOU Lu et al.: Amphibian and reptilian distribution patterns in the transitional zone between the Euro-Siberian… 3.2 The “wet island” effect of the Tianshan Mountains The Tianshan Mountains are located in the middle of Central Asia. They experience varied environments due to their tremendous sizes. The central and western sections of the Tianshan Mountains are moist (Schults, 2010), while the eastern section is relatively dry (Yao et al., 2012). The world geographic distribution of animals is related to geological history, temperature and humidity (Procheş and Ramdhani, 2012). In the late Tertiary Period, the Tianshan Mountains had developed into a landform dominated by mountain coniferous forests, and the areas at the lower elevations evolved into deserts during the late Quaternary Period (Wang and Yan, 1987). In the modern Tianshan Mountains, the average annual precipitation ranges between 350–700 mm and up to 1,000 mm on some windward slopes of the western section, forming a “wet island” (Lan et al., 2007; Zhao et al., 2011). From bottom to top, the climate changes from warm and arid to warm and wet, and then to cold and arid, and the vegetation type changes from desert to semi-desert, mountain steppe, mountain forest, subalpine meadow steppe, and at last to alpine ice gravel desert. The vertical changes in the landscape are quite obvious (Hu, 2004). The mountains of the arid areas in Central Asia, which are partly forested due to their unique temperature and precipitation levels, are highly attractive to some dry tolerant fauna, and are a refuge for hygrophilous and cold-tolerant species too (Zhang, 2009). The discontinuity of distribution, isolated distribution and regional distribution, which are all caused by variations in altitude, is quite common (Shi et al., 2002). Warmth-loving and drought-tolerant genera are distributed in the desert and semi-desert zones of the Tianshan Mountains, examples being Laudakia, Eremias and Phrynocephalus. But hygrophilous and cold-tolerant genera are found in mountain steppes and forests, Lacerta, Natrix and Ranodon for example. The phenomenon of hygrophilous and drought-tolerant species being found in the same place also exists among the mammals and birds of the Tianshan Mountains (Ablimit et al., 2003; Huang et al., 2007), reflecting the effect of the diversity of the mountain environment on the fauna composition (Zhang, 2009). 563 Although some hygrophilous and cold-tolerant species are present in the Tianshan Mountains, the typical taiga species are absent, e.g. Zootoca vivipara, Vipera berus, Salamandrella keyserlingii, Bufo bufo and Rana altaica. This indicates the essential differences in fauna types between the Tianshan Mountains and Euro-Siberia. In the vast desert region of Central Asia, hygrophilous and cold-tolerant species are only found in the Tianshan Mountains (Zhang, 2009), setting it apart from the other units in the desert. It has been proposed that the Tianshan Mountains should be set to a separate region, i.e. “the Middle Asian Mountain Region” (Bobrov, 2000), which would be at the same level as the Mongolia-Xinjiang Region. 4 Conclusions There is a significant weak biotic boundary between the Euro-Siberian Subrealm and the Central Asia Subrealm, which is related to the widespread existence of transitional zones. The Tianshan Mountains, because of their special fauna composition and environment, should be set to a separate Middle Asian Mountain Region at the same level as the Mongolia-Xinjiang Region. The test of independence applied to strong and weak boundaries resolved the distribution patterns and high level zoogeographical divisions of amphibians and reptiles in our study area. This method should be applicable to research not only on other animal groups, but also on large-scale zoogeographical divisions, the barrier effects of physical geographic boundaries, and the attributions in transitional areas. Acknowledgements This project was supported by International Science & Technology Cooperation Program of China (2010DFA92720) and the National Natural Science Foundation of China (31260511, 30360014). Special appreciation goes to Dr. XIANG Zuofu for his guidance regarding statistical methods, and to Dr. WANG Yang for providing related literatures and for useful help at the beginning of the study. References Ablimit A, Sun M J, Shao M Q. 2003. Diversity and fauna characteristics of the birds and mammals in mountain areas of Xinjiang. Journal of Arid Land Resources and Environment, 17(3): 117122. 564 JOURNAL OF ARID LAND 2015 Vol. 7 No. 4 Anan’eva N B, Orlov N L, Khalikov R G, et al. 2006. The Reptiles of Northern Eurasia: Taxonomic Diversity, Distribution, Conservation Status. Sofia: Pensoft Publishers. Baroni-Urbani C, Busher M W. 1976. Similarity of binary data. Systematic Biology, 25: 251259. 1988: 61–68. Krivokhatsky V A, Emeljanov A F. 2000. Use of general zoogeographical subdivisions in particular zoogeographical researches for the example of the Palaearctic antlion fauna (Neuroptera, Myrmeleontidae). Entomological Review, 80(9): 1042–1056. Bobrov V V. 2000. Conservation of reptile biodiversity in biosphere Lan Y C, Wu S F, Zhong Y J, et al. 2007. Characteristics and trends of reserves of Russia. In: Final Scientific Report, UNESCO. Moscow: changes on water cycle factors in the Tianshan Mountainous area MAB Young Scientists Research Award. Bobrov V V, Aleshchenko G M. 2001. Herpetogeographical regionalization of Russia and adjacent countries. Russian Journal of Herpetology, 8: 223. Burke R L, Ner S E. 2005. Seasonal and dial activity patterns of Italian wall Lizards, Podarcis sicula campestris, in New York. Northeastern Naturalist, 12(3): 349360. Chen X, Li B L, Li Q, et al. 2012. Spatio-temporal pattern and changes of evapotranspiration in arid Central Asia and Xinjiang of China. Journal of Arid Land, 4(1): 105112. since 1960s. Journal of Mountain Science, 25(2): 177–183. Li D H. 1989. Resourceful Vertebrate Fauna of Qinghai. Xining: Qinghai People’s Publishing House, 1–35. (in Chinese) Li P P, Zhao E M, Dong B J. 2008. Amphibians and Reptiles of Tibet. Beijing: Science Press, 1–44. (in Chinese) Li W D, Zhang X, Zhang H B, et al. 2013. Comprehensive Scientific Investigation of the National Natural Conservation in Xinjiang Altai Mountain. Urumqi: Xinjiang Science and Technology Press, 12–38. (in Chinese) Li Y W, Yu L, Zhang Y P. 2007. “Long-branch Attraction” artifact in Crick R E. 1980. Integration of paleobiogeography and paleogeography: phylogenetic reconstruction. Hereditas, 29(6): 659–667. (in Chinese) evidence from Arenigian nautiloid biogeography. Journal of Pale- Liu X T, Liu X G, Shen Q, et al. 2013. Comparison of merged and ontology, 54: 1218–1236. Czekanowski J. 1932. Coefficient of species similarity and average difference. Anthropologischer Anzeiger, 9: 227–249. (in Russian) Fei L, Hu S Q, Ye C Y, et al. 2006. Fauna Sinica, Amphibia (Vol. 1): General Accounts of Amphibia, Gymnophiona and Urodela. Beijing: Science Press. (in Chinese) Fei L, Hu S Q, Ye C Y, et al. 2009a. Fauna Sinica, Amphibia (Vol. 2): Anura. Beijing: Science Press. (in Chinese) Fei L, Hu S Q, Ye C Y, et al. 2009b. Fauna Sinica, Amphibia (Vol. 3): Anura Ranidae. Beijing: Science Press. (in Chinese) non-merged similarity clustering analysis methods. Acta Ecologica Sinica, 33(11): 3480–3487. (in Chinese) Ma M. 2011. A Checklist on the Distribution of the Birds in Xinjiang. Beijing: Science Press, 1–11. (in Chinese) Ma Y, Wang F G, Jin S K, et al. 1987. Glires (Rodents and Lagomorphs) of Northern Xinjiang and their Zoogeographical Distribution. Beijing: Science Press, 34–38. (in Chinese) Magurran A E. 2004. Measuring Biological Diversity. Malden: Blackwell Science, 172–175. Márquez A L, Real R, Vargas J M, et al. 1997. On identifying common Gao X Y, Zhou Y H, Gu J H, et al. 2000. The Investigation and Study of distribution patterns and their causal factors: a probabilistic method Birds Resources in Xinjiang. Urumqi: Xinjiang Health Science and applied to pteridophytes in the Iberian Peninsula. Journal of Bioge- Technology Publishing House, 49–59. (in Chinese) Guo Z L, Cui G F. 2014. The comprehensive geographical regionalization of China supporting natural conservation. Acta Ecologica Sinica, 34(5): 1284–1294. (in Chinese) Hijmans R J, Cameron S E, Parra J L, et al. 2005. Very high resolution interpolated climate surfaces for global land areas. International Journal of Climatology, 25: 1965–1978. Holt B G, Lessard J P, Borregaard M K, et al. 2013. An update of Wallace’s zoogeographic regions of the world. Science, 339: 74–77. How R A, Kitchener D J. 1997. Biogeography of Indonesian snakes. Journal of Biogeography, 24: 725–735. Hu R J. 2004. Physical Geography of the Tianshan Mountains in China. Beijing: China Environmental Science Press. (in Chinese) Hu S Q, Zhao E M, Jiang Y M, et al. 1987. Amphibians-Reptiles of Tibet. Beijing: Science Press, 1–55. (in Chinese) Huang R X. 2005. The Fauna of the Desert Insects of Xinjiang and its Formation and Evolution. Urumqi: Xinjiang Science and Technology Publishing House, 161–182. (in Chinese) Huang W, Xia L, Feng Z J, et al. 2007. Distribution pattern and zoogeographical discussion of mammals in Xinjiang. Acta Theriologica Sinica, 27(4): 325–337. (in Chinese) Ji X, Wang Y Z, Wang Z. 2009. New species of Phrynocephalus (Squamata, Agamidae) from Qinghai, Northwest China. Zootaxa, ography, 24: 613–631. McCoy E D, Bell S S, Walters K. 1986. Identifying biotic boundaries along environmental gradients. Ecology, 67(3): 749–759. Procheş S. 2005. The world’s biogeographical regions: cluster analyses based on bat distributions. Journal of Biogeography, 32: 607–614. Procheş S, Ramdhani S. 2012. The world’s zoogeographical regions confirmed by cross-taxon analyses. Bioscience, 62(3): 260–270. Ravkin Y S, Bogomolova I N, Chesnokova S V. 2010. Amphibian and reptile biogeographic regions of northern Eurasia, mapped separately. Contemporary Problems of Ecology, 3(5): 562–571. Ravkin Y S, Bogomolova I N, Nikolaeva O N, et al. 2014. Zoning Northern Eurasia based on the fauna of terrestrial vertebrates and their classification by similarity of distribution. Contemporary Problems of Ecology, 7(2): 137–150. Real R, Guerrero J C, Ramírez J M. 1992. Identification of significant biotic boundaries for amphibians in the basin of southern Spain. Acta Vertebr, 19: 53–70. (in Spanish) Ribeiro G C, Santos C M, Olivieri L T, et al. 2014. The world’s biogeographical regions revisited: global patterns of endemism in Tipulidae (Diptera). Zootaxa, 3847(2): 241–258. Rueda M, Rodríguez M Á, Hawkins B A. 2013. Identifying global zoogeographical regions: lessons from Wallace. Journal of Biogeography, 40(12): 2215–2225. ZHOU Lu et al.: Amphibian and reptilian distribution patterns in the transitional zone between the Euro-Siberian… Sans-Fuentes M A, Ventura J. 2000. Distribution patterns of the small mammals (Insectivora and Rodentia) in the transitional zone between the Eurosiberian and the Mediterranean. Journal of Biogeography, 27: 755–764. Schults J. 2010. Ecological Zone of the Earth. 4th ed. Beijing: Higher Education Press, 115–158. (in Chinese) Shcherbak N N. 1981. “Fundamentals of Herpetogeographic Zonation of the USSR,” in Problems of Herpetology. Leningrad: Nauka Leningrad Division, 157–158. Shen X C, Liu X T, Ren Y D, et al. 2013a. The multivariate similarity clustering analysis and geographical division of insect fauna in China. Acta Entomologica Sinica, 56(8): 896–906. (in Chinese) Shen X C, Zhang B S, Zhang F, et al. 2013b. Worldwide distribution and multivariate similarity clustering analysis of spiders. Acta Ecologica Sinica, 33(21): 6795–6802. (in Chinese) Shi L, Zhou Y H, Yuan H. 2002. Reptile fauna and zoogeographic division of Xinjiang Uygur Autonomous Region. Sichuan Journal of Zoology, 21(3): 152–157. (in Chinese) Shi L, Zhou Y H, Yuan H. 2005. A new record of toad species from China—Bufo bufo Linnaeus. Acta Zootaxonomica Sinica, 30(2): 444–445. (in Chinese) Shi L, Zhou Y H, Yuan H. 2006a. A new genus and a new species record to China. Acta Zootaxonomica Sinica, 31(4): 912–915. (in Chinese) Shi L, Liu G S, Li Z H, et al. 2006b. An record of Coluber spinalis from Altai Mountain. Journal of Xinjiang Agricultural University, 29(1): 55–57. (in Chinese) Shi L, Yang J, Hou M Z. 2007. Herpetological surveys of Xinjiang Uygur Autonomous Region. Sichuan Journal of Zoology, 26(4): 812–818. (in Chinese) Shi L, Zhao E M. 2008. First record of subspecies from China. Acta Zootaxonomica Sinica, 33(1): 207–211. (in Chinese) 565 Terent’ev P V, Chernov S A. 1949. Guide to Reptiles and Amphibians. Moscow: Sovetskaya Nauka. Wang S J, Yan S. 1987. Cenozoic evolution of geographical environment in north and south sides of the Tianshan Mountains. Acta Geographica Sinica, 42: 211–220. (in Chinese) Wang X L, Ai S, Yuan L, et al. 2006. The progress in the research of Xinjiang amphibian animals. Journal of Xinjiang Normal University: Natural Sciences Edition, 25(2): 50–53. (in Chinese) Xiang Z F, Liang X C, Huo S, et al. 2004. Quantitative analysis of land mammal zoogeographical regions in China and adjacent regions. Zoological Studies, 1: 142–160. Xie Y, Li D M, John M. 2002. Preliminary researches on bio-geographical divisions of China. Acta Ecologica Sinica, 22(10): 1599–1615. (in Chinese) Xu R G, Xin L L, Yang G S, et al. 2001. Fauna Inner Mongolia (Ⅱ): Amphibian and Reptile. Hohhot: Inner Mongolia University Press. (in Chinese) Yao J Q, Yang Q, Zhao L. 2012. Research on change of surface water vapor in the Tianshan Mountains under global warming. Arid Zone Research, 29(2): 320–327. (in Chinese) Zhang M W, Zong Y, Ma J P. 1998. Fauna Sinica, Reptilia (Vol. 1): General Accounts of Reptilia, Testudoformes and Crocodiliformes. Beijing: Science Press. (in Chinese) Zhang R Z. 2009. Zoogeography of China. Beijing: Science Press, 137–179. (in Chinese) Zhao C C, Ding Y J, Ye B S, et al. 2011. Spatial distribution of precipitation in Tianshan Mountains and its estimation. Advances in Water Science, 22(3): 315–322. (in Chinese) Zhao E M, Huang M H, Zong Y. 1998. Fauna Sinica, Reptilia (Vol. 3): Squamata, Serpentes. Beijing: Science Press. (in Chinese) Zhao E M, Zhao K T, Zhou K Y. 1999. Fauna Sinica, Reptilia (Vol. 2): Squamata, Lacertilia. Beijing: Science Press. (in Chinese) Shi L, Zhao E M. 2011. A new gecko in the genus Cyrtopodion Fitz- Zhao K T. 2002. Reptile fauna and zoogeographic division of Inner inger, 1843 (Reptilia: Squamata: Gekkonidae) from western China. Mongolia Autonomous Region. Sichuan Journal of Zoology, 3: Herpetologica, 67(2): 186–193. 118–122. (in Chinese) Terbish K H, Munkhbayar K H, Clark E L, et al. 2006. Regional Red List Zhou Y H, Wang G Y, Ni Y F. 1986. A new record of Eryx tataricus Series (Vol. 5): Mongolian Red List of Reptiles and Amphibians. and a new subspecies from China. Journal of August 1st Agricultur- London: Zoological Society of London, 1–72. al College, 9(3): 42–44. (in Chinese)


© Copyright 2026