
Here - Polish Journal Of Food And Nutrition Sciences
“Honey and Honey-Based Products: Bioavailability and Functionality” 2 0 1 5, Vol. 65, No. 2 Published since 1957 as Roczniki Chemii i Technologii Żywności and Acta Alimentaria Polonica (1975–1991) EDITOR-IN-CHIEF Prof. dr hab. Henryk Zieliński, Institute of Animal Reproduction and Food Research of the Polish Academy of Sciences, Olsztyn, Poland ASSOCIATE EDITORS Food Technology Section Prof. Alberto Schiraldi, DISTAM, sez. Chimica, Università di Milano, Milano, Italy Dr hab. inż. Marek Adamczak, prof UWM, University of Warmia and Mazury, Olsztyn, Poland Food Chemistry Section Dr. Maria Dolores del Castillo, Institute of Food Science Research (CSIC-UAM), Madrid, Spain Dr hab. Magdalena Karamać, Institute of Animal Reproduction and Food Research of the Polish Academy of Sciences, Olsztyn, Poland Food Quality and Functionality Section Dr. Maria Juana Frias Arevalillo, Institute of Food Science, Technology and Nutrition (ICTAN), Madrid, Spain Dr. Zuzana Ciesarova, NPPC National Agricultural and Food Centre, VUP Food Research Institute, Bratislava, Slovak Republic Prof. dr hab. Ryszard Amarowicz, Institute of Animal Reproduction and Food Research of the Polish Academy of Sciences, Olsztyn, Poland Nutritional Research Section Prof. André Mazur, Human Nutrition Unit, INRA, Clermont, France Prof. dr hab. Anna Brzozowska, University of Life Sciences, Warsaw, Poland Prof. dr hab. Jerzy Juśkiewicz, Institute of Animal Reproduction and Food Research of the Polish Academy of Sciences, Olsztyn, Poland Language Editor Prof. Ron Pegg, University of Georgia, Athens, USA Statistical Editor Dr Tomasz Jeliński, Institute of Animal Reproduction and Food Research of the Polish Academy of Sciences, Olsztyn, Poland Executive Editor Joanna Molga,“News” Section, Institute of Animal Reproduction and Food Research of the Polish Academy of Sciences, Olsztyn, Poland SCOPE: The Journal covers fundamental and applied research in food area and nutrition sciences with a stress on interdisciplinary studies in the areas of food, nutrition and related subjects. POLICY: Editors select submitted manuscripts in relation to their relevance to the scope. Referees are selected from the Advisory Board and from Polish and international scientific centres. Identity of referees is kept confidential. AUTHORSHIP FORMS referring to Authorship Responsibility, Conflict of Interest and Financial Disclosure, Copyright Transfer and Acknowledgement, and Ethical Approval of Studies are required for all authors. FREQUENCY: Quarterly – one volume in four issues (March, June, September, December). COVERED by Web of Science, Current Contents/Agriculture, Biology & Environmental Sciences, Journal Citation Reports and Science and Science Citation Index Expanded, BIOSIS (Biological Abstracts), SCOPUS, CAB International (Food Science and Technology Abstracts), CAS (Chemical Abstracts), AGRICOLA, AGRO-LIBREX data base, EBSCO, FOODLINE, Leatherhead FOOD RA data base FROSTI, AGRIS and Index Copernicus data bases, Polish Scientific Journals Contents (PSJC) Life Science data base available at http://psjc.icm.edu.pl and any www browser; ProQuest: The Summon, Bacteriology Abstracts, Immunology Abstracts. EDITORIAL AND BUSINESS CORRESPONDENCE: Submit contributions (see Instructions to Authors) and address all communications regarding subscriptions, changes of address, etc. to: CORRESPONDENCE TO: Ms. Joanna Molga Polish Journal of Food and Nutrition Sciences Institute of Animal Reproduction and Food Research of Polish Academy of Sciences ul. Tuwima 10, 10-747 Olsztyn, Poland e-mail: [email protected]; http://journal.pan.olsztyn.pl Published by the Division of Food Sciences, Institute of Animal Reproduction and Food Research of Polish Academy of Sciences, Olsztyn “Honey and Honey-Based Products: Bioavailability and Functionality” ISSN (1230–0322) 2 0 1 5, Vol. 65, No. 2 Pol. J. Food Nutr. Sci. 2015, Vol. 65, No. 2 Advisory Board of PJFNS 2015–2018 Huda Al-Kateb University of the West of England, Bristol, UK Jennifer M. Ames University of the West of England, Bristol, UK Wilfried Andlauer University of Applied Sciences, Sion, Switzerland Sa’eed Halilu Bawa University of the West Indies, St. Augustine, The Republic of Trinidad and Tobago Bhaskar C. Behera Agharkar Research Institute, India Vural Gökmen Hacettepe University, Ankara, Turkey Adriano Gomes Da Cruz UNICAMP, Sao Paulo, Brazil Liwei Gu University of Florida, Gainesville, USA Henryk Jeleń Poznań University of Life Sciences, Poland Georgios Koutsidis Northumbria University, Newcastle-upon-Tyne, UK Theodore P. Labuza Department of Food Science and Nutrition, University of Minnesota, USA Andrzej Lenart Warsaw University of Life Sciences, Poland Johns Lodge Northumbria University, Newcastle-upon-Tyne, UK Claudine Manach INRA, Centre de Recherche de Clermont-Ferrand, Theix, France Adolfo J. Martinez-Rodriguez CSIC, Madrid, Spain Brian McKenna National University of Ireland, Dublin, Ireland Najma Memon University of Sindh, Sindh, Pakistan Francisco J. Morales CSIC, Madrid, Spain Mostafa Noroozi Qazvin University of Medical Sciences, Qazvin, I.R. Iran David W. Pascual Montana State University, Bozeman, USA Ron Pegg University of Georgia, Athens, USA Mariusz K. Piskuła Institute of Animal Reproduction and Food Research PAS, Olsztyn, Poland Edward Pospiech Poznań University of Life Sciences, Poland Mark Shamtsyan St. Petersburg State Institute of Technology, St. Petersburg, Russia Hilmer Sorensen Royal Veterinary and Agricultural University, Frederiksberg, Denmark Susanne Sorensen University of Copenhagen, Frederiksberg, Denmark Da-Wen Sun National University of Ireland, Dublin, Ireland Ludwik Theuvsen Georg-August University of Goettingen, Germany Özlem Tokuşoglu Celal Bayar University, Manisa, Turkey Lida Wądołowska Warmia and Mazury University, Olsztyn, Poland Maria Wojtatowicz Wrocław University of Life Sciences, Poland Pol. J. Food Nutr. Sci. 2015, Vol. 65, No. 2 Dear Colleagues, Polish Journal of Food and Nutrition Sciences is pleased to announce a Special Issue on “Honey and Honey-Based Products: Bioavailability and Functionality”. Honey is a natural sweet substance produced by honey bees using nectar that is collected by the bees from the nectar of plants. For centuries, honey has been used for nutrition in different cultures. The oldest evidence of honey collection by humans dates from c. 6000 BC in a cave near Valencia in Spain. Honey, the only sweetener available in the wild, has also captured the attention of people because of its complex composition, which has been associated with antiseptic, antimicrobial, anticancer, anti-inflammatory, and wound-healing properties. The composition of honey varies depending on the origin of the raw material as nectar or honeydew, the bee species, the edaphoclimatic conditions, the available floral source and the storage conditions. Honey consists mainly of glucose and fructose but also contains amino acids, phenolic compounds, organic acids, vitamins, minerals, lipids, enzymes and other phytochemicals. Among the compounds with biological activity that are present in honeys, the compounds that display antioxidant capacity, such as phenolic acids, flavonoids and the enzymes glucose oxidase and catalase, have received special attention from research groups, due to their role in the prevention of diseases associated with oxidative stress. Honey is also a natural, nontoxic, and inexpensive product for the need of novel therapies against bacterial infections. The clinical use of honey has an enormous potential, especially in the fight against antibiotic-resistant strains. However, little information is available on the composition and bioactive properties of honeys and honey-based products from floral sources in the world. In this Special Issue we have focused on trans-disciplinary aspects of honeys and honey-derived products in the areas of: • Processing and storage of honey – effect on quality and functionality • Bioactive constituents of honeys and honey-derived products • Quality and safety of honeys • Aroma volatile compounds of honeys and honey-derived products • Microbiological activity of honeys and honey-derived products • Honey as an indicator of environmental quality • Development of new analytical methods for honey’s originality assessment. The Guest Editor, Prof. Teresa Szczęsna, has compiled articles focused on honeys from various scientific disciplines. The Editors and Authors hope that this Special Issue will serve as a reference tool for honey researchers globally. This Special Issue is also a tool for all interested in concluding basic research on honey and honey-based products. Guest Editor Prof. Teresa Szczęsna Editor-in-Chief: Journal of Apicultural Science Editor Prof. Henryk Zieliński Editor-in-Chief: Polish Journal of Food and Nutrition Sciences Pol. J. Food Nutr. Sci. 2015, Vol. 65, No. 2 REVIEW Polyphenol-Protein Complexes and Their Consequences for the Redox Activity, Structure and Function of Honey. A Current View and New Hypothesis – a Review. K. Brudzynski, L. Maldonado-Alvarez ............................................................................................................................................... 71 ORIGINAL PAPERS Antioxidant Effect of Natural Honeys Affected by Their Source and Origin. M. Mellen, M. Fikselová, A. Mendelová, P. Haščík ........................................................................................................................... 81 Antioxidant Properties of Honey from Different Altitudes of Nepal Himalayas. B.P. Neupane, K.P. Malla, A. Kaundinnyayana, P. Poudel, R. Thapa, S. Shrestha ........................................................................... 87 Multi-Element Composition of Honey as a Suitable Tool for Its Authenticity Analysis. M. Oroian, S. Amariei, A. Leahu, G. Gutt ....................................................................................................................................... 93 Physico-Chemical, Enzymatic, Mineral and Colour Characterization of Three Different Varieties of Honeys from Kashmir Valley of India with a Multivariate Approach. G.A. Nayik, V. Nanda ..................................................................................................................................................................... 101 Spray Drying of Honey: The Effect of Drying Agents on Powder Properties. K. Samborska, P. Gajek, A. Kamińska-Dwórznicka ....................................................................................................................... 109 Effect of Microwave Treatment on Microbial Contamination of Honeys and on Their Physicochemical and Thermal Properties. M. de la Paz Moliné, N.J. Fernández, S.K. Medici, D. Fasce, L.B. Gende ...................................................................................... 119 Effects of Honey Addition on Antioxidative Properties of Different Herbal Teas. G. Toydemir, E. Capanoglu, S. Kamiloglu, E. Firatligil-Durmus, A.E. Sunay, T. Samanci, D. Boyacioglu .................................... 127 Influence of Sweetness and Ethanol Content on Mead Acceptability. T. Gomes, T. Dias, V. Cadavez, J. Verdial, J. Sá Morais, E. Ramalhosa, L.M. Estevinho .............................................................. 137 Origin of Synthetic Particles in Honeys. G. Liebezeit, E. Liebezeit ............................................................................................................................................................... 143 Instruction for Authors .............................................................................................................................................................149 Subscription 2015 – One volume, four issues per volume. Annual subscription rates are: Poland 140 PLN, all other countries 70 EUR. Prices are subject to exchange rate fluctuation. Subscription payments should be made by direct bank transfer to Bank Gospodarki Żywnościowej, Olsztyn, Poland, account No 17203000451110000000452110 SWIFT code: GOPZPLWOLA with corresponding banks preferably. Subscription and advertising offices at the Institute of Animal Reproduction and Food Research of Polish Academy of Sciences, ul. J. Tuwima 10, 10–747 Olsztyn, Poland, tel./fax (48 89) 5234670, fax (48 89) 5240124, e-mail: [email protected]; http://journal.pan.olsztyn.pl © Copyright by Institute of Animal Reproduction and Food Research of Polish Academy of Sciences, Olsztyn, Poland www.pan.olsztyn.pl Subscription 2015 – One volume, four issues per volume. Annual subscription rates are: Poland 140 PLN, all other countries 70 EUR. Prices are subject to exchange rate fluctuation. Subscription payments should be made by direct bank transfer to Bank Gospodarki Żywnościowej, Olsztyn, Poland, account No 17203000451110000000452110 SWIFT code: GOPZPLWOLA with corresponding banks preferably. Subscription and advertising offices at the Institute of Animal Reproduction and Food Research of Polish Academy of Sciences, ul. J. Tuwima 10, 10–747 Olsztyn, Poland, tel./fax (48 89) 5234670, fax (48 89) 5240124, e-mail: [email protected]; http://journal.pan.olsztyn.pl Zamówienia prenumeraty: Joanna Molga (e-mail: [email protected]) oraz Kolporter S.A. (http://sa.kolporter.com.pl) Wersja pierwotna (referencyjna) kwartalnika PJFNS: wersja papierowa (ISSN 1230–0322) Nakład: 100 egz.; Ark. wyd. 11,5; Ark. druk. 11,5 Skład i druk: Mercurius, www.mercurius.com.pl Pol. J. Food Nutr. Sci., 2015, Vol. 65, No. 2, pp. 71–80 DOI: 10.1515/pjfns-2015-0030 http://journal.pan.olsztyn.pl Review article Section: Food Chemistry Polyphenol-Protein Complexes and Their Consequences for the Redox Activity, Structure and Function of Honey. A Current View and New Hypothesis – a Review Katrina Brudzynski1*, Liset Maldonado-Alvarez2 Department of Drug Discovery and Development, Bee-Biomedicals Inc., A9–210 Glendale Ave., Suite 109, St. Catharines, ON, L2T 3Y6, Ontario, Canada 2 Department of Biochemistry and Biomedical Sciences, McMaster University, Hamilton, Ontario, Canada 1 Key words: honey, polyphenol-protein interactions, “protein-type” complexes, “polyphenol-type” complexes, polyphenol auto-oxidation, quinones, melanoidins, gain-and-loss of function There is increasing evidence that protein complexation by honey polyphenols is changing honey structure and function. This relatively less investigated filed of honey research is presented in a context of known mechanism of formation of the stable polyphenol-protein complexes in other foods. At a core of these interactions lies the ability of polyphenols to form non-covalent and covalent bonds with proteins leading to transient and/or irreversible complexes, respectively. Honey storage and thermal processing induces non-enzymatic oxidation of polyphenols to reactive quinones and enables them to form covalent bonds with proteins. In this short review, we present data from our laboratory on previously unrecognized types of protein-polyphenol complexes that differed in size, stoichiometry, and antioxidant capacities, and the implications they have to honey antioxidant and antibacterial activities. Our intent is to provide a current understanding of protein-polyphenol complexation in honey and also some new thoughts /hypotheses that can be useful in directing future research. INTRODUCTION NON-COVALENT BINDING Polyphenols and proteins are minor components of honeys but they can significantly influence honey antioxidant and antibacterial properties. The reason behind these effects relates to polyphenols’ ability to bind proteins via non-covalent or covalent bonds and sequestering proteins into soluble or insoluble complexes. Binding affects function of both proteins and polyphenols. Proteins modified by polyphenols undergo conformation transitions that are changing their biological activity, as in a case of honey enzymes. Binding of polyphenols to proteins on the other hand, affects antioxidant activity of polyphenols because the binding engages the same functional groups that are involved in redox cycling; electron donation, or metal chelation. These functional alterations following protein and polyphenols complexations can be transient or irreversible, depending on whether non-covalent or covalent bonds are formed between these molecules. Environmental factors such as pH, temperature, ionic strength often modulate transient interactions toward formation of stable protein-polyphenols complexes with a long half-life. Here, we review these aspects of protein-polyphenol interactions and describe functional consequences they have on honey functions. Non-covalent binding between protein and polyphenols involves hydrogen bonds that are formed between electronegative atoms of nitrogen or oxygen, especially of amino (–NH2) and hydroxyl (–OH) groups, and a positively charged hydrogen atom from neighboring hydroxyl or amino group of another polyphenol or protein molecules. Depending on polyphenol structure and degree of hydroxylation, the interaction may produce single or multiple hydrogen bonds that influence strength of the formed complexes [Haslam, 1974]. Hydrogen bonds between neighboring protein chains can create bridges that crosslink proteins into aggregates. In addition to hydrogen bonds that involve polar groups, protein and polyphenols may interact via hydrophobic, non-polar aromatic rings of polyphenols and aromatic amino acids, (proline, phenylalanine, tyrosine, tryptophan, histidine) [Charlton et al., 2002; Siebert, 1999]. Hydrophobic bonds influence the structure of the complex by stacking of aromatic rings of polyphenols against those of aromatic amino acids such as in the case of proline pyrrolidone rings in proline-rich proteins and galloyl rings of tannins [Baxter et al., 1997; Siebert et al., 1996]. Formation of protein-polyphenol complexes usually results from multiple cooperative hydrophobic and hydrogen binding and may lead to colloidal size aggregates. The non-covalent protein-polyphenol interactions are responsible for the haze formation in beers, wines and fruit * Corresponding Author: E-mail: [email protected] (K. Brudzynski) © Copyright by Institute of Animal Reproduction and Food Research of the Polish Academy of Sciences © 2015 Author(s). This is an open access article licensed under the Creative Commons Attribution-NonCommercial-NoDerivs License (http://creativecommons.org/licenses/by-nc-nd/3.0/). 72 juices [Siebert et al., 1996; Baxter et al., 1997; Siebert, 1999] and colloids in honey [Paine et al., 1934; Lothrop & Paine, 1931]. HONEY COLLOIDS - MELANOIDINS CONNECTION Honey colloids are mixture of non-crystalline particles, vastly differing in sizes that are evenly dispersed and suspended in supersaturated sugar solution. They cannot be removed from honey by traditional membrane filtration or centrifugation because of their size heterogeneity, differences in solubility, and the particle association-dissociation dynamics. The presence of colloids affects physical properties of honey such as color, flavor, clarity, crystallization and thixotropy [Paine et al., 1934; Witczak et al., 2011]. The colloidal content in honey is low and varies between 0.1 to 1.0% for light and dark honey, respectively [Lothrop & Paine, 1931; Mitchell et al., 1955]. The chemical composition of honey colloids and the mechanism of their formation remained enigmatic for a long time. According to old literature, honey colloids consisted of proteins (enzymes), pigments (polyphenols) and some waxes [White, 1957]. More than 50% of its mass was found to be comprised of proteins [Mitchell et al., 1955]. The fact that honey colloids could be precipitated upon dilution with water [Lothrop & Paine, 1931] suggested that they are hydrophobic in nature. Their isoelectric point was found to be 4.3 [White, 1957] therefore in honey, with the average pH of 3.9, colloids are positively charged. High concentration of sugars in honey may increase colloidal stability. Usually, the stability and size of colloidal particles is strongly controlled by environmental conditions such as pH, temperature, or ionic strength. Since the interactions between colloid particles are governed by Coulombic electrostatic interactions and van der Waals interactions [Israelachvili, 1992], changes in pH and salt concentration increase the tendency of particles to coalesce to large aggregates and to promote their flocculation. We cannot resist the impression that the brown, colloidal material in honey described in old literature fits the description of melanoidins. Melanoidins are high molecular weight colloidal complexes that are formed in thermally processed foods as the result of the Maillard reaction [for review see, Wang et al., 2011]. A structure of intact melanoidins has proven to be challenging to characterize at the molecular level and it remains mostly unknown. However, all food melanoidins contain proteins, polyphenols, sugars and the Maillard reaction products as the main components. Such structures have been also recently found in honey [Brudzynski & Miotto, 2011b, c]. Protein-polyphenol complexes are an integral part of both colloids and melanoidins. The colloid-melanoidin connection is supported by the following facts. Firstly, proteins, as surface active molecules are “colloidally” active and can readily assemble to high molecular weight aggregates via protein-protein interaction and/or interactions with other ligands including polyphenols [Haslam, 1996]. Secondly, the driving force in the protein-polyphenol complexation is a hydrophobic force/effect. This property is responsible for colloid formation, such as haze formation in beer as well as melanoidin formation, such as that of coffee. By making a connection Polyphenol-Protein Interactions between honey colloids and melanoidins, one could easily envision the location and milieu in which the protein-polyphenol interaction take place in honey. Despite uncertainty of the colloids-melanoidin connection, it is undoubtedly true that the protein-polyphenol complexes are highly relevant to physical, structural and functional properties of honey. There is a multitude of proteins of different functions in honey that can be target by polyphenols. HONEY PROTEINS Protein modification by polyphenols alters the biological activity of honey proteins in the way that it reduces their original function and nutritional benefits. Proteins are minor components of honey, amounting to 0.2 to 0.7% of honey mass [Bogdanov, 2008]. Together with nectar-carbohydrates they serve as the primary source of honeybee’s diet. Proteins of pollen origin are the main source of nitrogen for bees [Baroni et al., 2002; Iglesias et al., 2006]. Besides the nutritional role, proteins of pollen origin comprise of stress-inducible, pathogenesis-related proteins (PRP) [Midoro-Horiuti et al., 2001; Breiteneder, 2004] that may enhance bee’s immunity and the tolerance to pathogens. To the group of pollen disease-resistant proteins belongs also the 31 kDa dirigent-like protein recently discovered in honey [Brudzynski et al., 2013]. However, majority of honey proteins are of bee origin and consist of enzymes involved in sugar metabolism: glucose oxidase [Schepartz & Subers, 1964], alpha-glucosidase (invertase) [White & Kushnir, 1966; Bonvehi et al., 2000], beta-glucosidase [Pontoh & Low, 2002], alpha-amylase (diastase) [Oddo et al., 1995; Babacan & Rand, 2007], transglucosylase and phosphorylases. The proper functioning of these enzymes ensures an adequate supply of simple carbohydrates that are for bees a source of energy for flight and colony maintenance. The most abundant non-enzymatic honey protein originating from bees is a 55–57 kDa glycoprotein, Major Royal Jelly Protein1 (MRJP1) or apalbumin-1 [Šimúth, 2001; Šimúth et al., 2004; Won et al., 2008]. The size and a high concentration of MRJP1 in honey suggested its nutritional role [Šimúth, 2001]. This view was initially supported by a finding that the MRJP1 protein can be specifically degraded by serine proteases, generating a substantial number of MRJP1-related peptides [Rossano et al., 2012]. However, the degradation products of MRJP1 were also shown to have immune-stimulatory activities [Majtan et al., 2006; Tonks et al., 2003] and cell growth stimulatory activity [Watanabe et al., 1998; Kamakura et al., 2001; Majtan et al., 2009]. The expanding number of functions of the MRJP1 includes its significant influence on honey structure. The MRJP1 has propensity for oligomerization, and in honey, it often forms a large, 350 kDa hetero-hexamer, known as apisin [Kimura et al., 1995, 1996] with a peptide named apisimin [Bilikova et al., 2002] that serves as a linker between the MRJP1 oligomers [Tamura et al., 2009]. The MRJP1 molecule is highly glycosylated [Kimura et al., 1995, 1996]. The MRJP1 size and presence of several reactive groups can influence the attraction and repulsion forces with other ligands. Thus, these features make the MRJP1 the most suitable candidate to be involved in colloid-melanoidin formation. Honey also con- K. Brudzynski & L. Maldonado-Alvarez tains other types of MRJPs (MRPJ2 to 5) [Di Girolamo et al., 2012] thereby creating a substantial pool of non-enzymatic proteins of honeybee origin. In view of these multiple biological roles of honey proteins, it becomes instantly apparent that their interaction and complexation with polyphenols will have a significant impact on honey function and nutritional availability. STOICHIOMETRY OF PROTEIN-POLYPHENOL COMPLEXES Association and dissociation between proteins and polyphenols is initially a surface phenomenon. The stability of complexes depends on the molecular size of interacting partners, their concentrations and external conditions in which the interaction takes place [Spencer et al., 1988; Haslam, 1996]. Polyphenols of higher molecular size showed greater tendency to form stable complexes with proteins [De Freitas & Mateus, 2001]. In this respect, it has to be realized that proteins and polyphenols vastly differ in sizes. The average size of polyphenols is ~500 daltons while a typical size of protein is 30,000 daltons (in terms of their sequence size as determined by the number of amino acids). To produce stable complexes, the ratio of polyphenol to protein must be high to form multiple non-covalent bonds. Secondly, the strength of complexes is influenced by polyphenol hydrophobicity. At low polyphenol concentrations, their attachment to proteins does not change hydrophilic character of complexes and the complexes remain soluble. However, with the increased concentration of polyphenols, the protein-polyphenol complexes become more hydrophobic by encouraging interactions between non-polar residues of polyphenols and proteins. The intramolecular hydrophobic interactions between different protein-polyphenol complexes are the driving force toward aggregation and precipitation as large, insoluble aggregates [Spencer et al., 1988; Naczk et al., 2011]. Taken together, the polyphenols’ hydrophobic aromatic rings and hydrophilic hydroxyl groups contribute to multiple, non-covalent bonds with proteins and act as multidenate ligands [Spencer et al., 1988; Haslam, 1996]. The size and solubility of protein-polyphenol complexes are temperature-sensitive; elevated temperatures facilitate tendency to hydrophobic interactions by unfolding the proteins chains and exposing hydrophobic amino acids (hydrophobic effect). Thus, the size and number of protein-polyphenol complexation will increase with the raise of temperature. There are, however, other factors influencing the complexation. POLYPHENOLS AUTO-OXIDATION AND FORMATION OF QUINONE-PROTEIN COVALENT BONDS In addition to temperature, the environmental factors such as exposure to oxygen, presence of oxidizing agents (hydrogen peroxide), and the presence of transition metal ions significantly facilitates formation of covalent bonds that irreversibly link polyphenols with proteins. Such binding occurs upon polyphenol auto-oxidation in the presence of O2. The autooxidation involves one- or two-step electron transfer (as it is shown for quercetin in Figure 1). Firstly, the transfer of an electron from polyphenol to O2 leads to formation of ortho- 73 semiquinone anion radical (Q˙¯). o-Semiquinone radicals, as unstable compounds, could undergo radical-radical reaction giving o-quinone and a reconstituted parent molecule. Q˙¯ radical can also react with molecular oxygen and give rise to a superoxide anion radical (O2˙¯), initiating the redox cycle. Subsequently, the superoxide radical can be scavenged by the parent polyphenol and produce again o-semiquinone radicals and hydrogen peroxide (Figure 1). This redox cycle may continue until the system becomes depleted of oxygen. In contrast to one electron transfer, the two-step electron transfer from the parent molecule gives more thermodynamically stable o-quinones [Methodieva et al., 1999]. The formation of o-quinone is followed by a rapid isomerization to para-quinone methide intermediates. As potent electrophiles, quinones and quinone methides bind specifically and irreversibly to nucleophilic groups of amino acids such as sulfhydryl, amine, amide, indole or imidazole groups of proteins (Figure 1) [Methodieva et al., 1999; Cilliers & Singleton, 1991, Hotta et al., 2001]. The structure of polyphenols and their ability of redox cycling plays important role in formation of covalent bonds. Ability to auto-oxidize and hence to have pro-oxidant effect is directly related to the presence of (a) a catechol group on the B-ring (b) the 2, 3-double bond in conjugation with a carbonyl group at 4-position in the C-ring, and (c) the presence of hydroxyl groups at the 3 and 5 position (Figure 2) [Rice-Evans et al., 1998; Bors et al., 1990]. FIGURE 1. A simplified outline of auto-oxidation of quercetin to o-semiquinone radical and quinone by two subsequent electron transfers. O-semiquinone radical can react with molecular oxygen and give rise to a superoxide anion radical (O2˙¯), producing pro-oxidant effect. Quinones and subsequent quinone methides react with proteins. FIGURE 2. Structural determinants of flavonoids contributing to antioxidant and proxidant activities as shown in the molecule of quercetin: essential OH groups, 2, 3 –double bond and carbonyl-group at 4 position of C ring are highlighted. 74 Polyphenol-Protein Interactions gel electrophoresis, ORAC and LC-ESI-MS [Brudzynski & Miotto, 2011a, b; Brudzynski et al., 2013]. The implementation of this methodology allowed separation of honey complexes onto two groups that differed in size, stoichiom- 1.2 1.0 0.8 Intens. (x108) In addition to binding the nucleophilic amino acids groups, semiquinone radicals may undergo radical-radical reactions between themselves generating oligomers and polyphenol polymers [Cilliers & Singleton, 1991; Hotta et al., 2001; Bors et al., 2004]. Such radical-induced reactions underlie dimerization and oligomerization of caffeic acids [Bors et al., 2004]. These oligomeric forms that possess multiple catechol rings have been shown to be much more effective radical scavengers than monomeric polyphenols [Bors et al., 2004]. Thus, polyphenol auto-oxidation generates irreversible, covalent bonds with proteins and other polyphenols. The new structures acquire either increased antioxidant (scavenging free radicals) as in a case of caffeic acid oligomers or pro-oxidant capacities (generating free radicals) as in a case of quinone-protein complexes. Once the polyphenol auto-oxidation is initiated, it proceeds spontaneously with time. 0.6 0.4 0.2 “PROTEIN-TYPE” AND “POLYPHENOL-TYPE” COMPLEXES IN HONEY 0 0 In honey, the interaction between protein and polyphenols increases with time of storage and after heat treatment. The nature of protein-polyphenol complexation was studied using size-exclusion chromatography, polyacrylamide 2 4 6 8 10 12 14 16 18 Time (min) FIGURE 3. Total ion current chromatograms (TICs) in the negative ion mode for LC-ESI-MS analysis of “protein-type” (upper line) and “polyphenol-type” (bottom line) complexes isolated from honey. 1.2 1.0 0.8 0.6 0.4 Intens. (x108) 0.2 0 1.2 1.0 0.8 0.6 0.4 0.2 0 0 2 4 6 8 10 12 14 16 18 Time (min) FIGURE 4. Extracted ion mass chromatogram of “protein-type” complexes against target mass ions of p-coumaric acid m/z 163 (peak 1), ferulic acid m/z 193 (peak 2), and caffeic acid m/z 179 (peak 3) (lower panel). The position of extracted mass ions is related to the total ion current chromatogram (upper panel). 75 K. Brudzynski & L. Maldonado-Alvarez etry and antioxidant/pro-oxidant capacity. Considering data on browning indexes, characteristic UV spectra (200 nm to 400 nm), color, molecular size, and ORAC values obtained before and after heat-treatment, the complexes were identified as melanoidins [Brudzynski & Miotto, 2011a, b]. Determination of the total protein and phenolic contents in these complexes provided a general assessment of the stoichiometry of the reactants expressed as percentage of the total mass. The stoichiometry results, together with SDS-PAGE, revealed that high molecular weight complexes (230–180 kDa) were enriched in proteins (“protein-type” complexes) while lower molecular size complexes (110–85 kDa) were enriched in polyphenols (“polyphenol-type” complexes) [Brudzynski et al., 2013]. In addition to differences in size and protein to polyphenol ratio, the complexes presented different polyphenol profiles in LC-ESI-MS. The direct comparison of the total ion currents (TICs) during 20 min elution showed that “polyphenol-type” complexes were lacking hydrophilic compounds that were contributing to mass spectrum at retention times of 7 to 13 min (Figure 3) [Brudzynski & Miotto, 2011b]. Furthermore, screening of mass ion profiles against target mass ions of caffeic (m/z 179), ferulic (m/z 193) and p-coumaric (m/z 163) acids demonstrated that these simple, monophe- nolic acids were absent in “polyphenol-type” complexes but occurred in “protein-type” complexes (Figures 6 and 4, respectively). The phenolic acids, specifically caffeic acid, appeared as unknown conjugates that were eluted at longer retention time than RT=4.19 min expected for a standard caffeic acid monomer under the chromatographic conditions used (Table 1). We have noted however that caffeic acid mass ion of m/z 179 co-eluted together with m/z 253 (chrysin) at RT 13.9 min, m/z 255 (pinocembrin) at RT=14.4 and with m/z 283 (acetatin) at RT 15.2 (Figure 4). Although interesting, these very early results do not warrant any suggestion of possible association between above-mentioned flavonoids and caffeic acid in honey. The same screening method used against target mass ions of pinobanksin (m/z 271), pinocembrin (m/z 285), chrysin (m/z 253) and acacetin (m/z 283) supported the presence of these flavonoids in both types of complexes (Figures 5 and 6). These polyphenols have been chosen as typical representatives of phenolics in honey [Pyrzynska & Biesaga, 2009]. Their identification was based on a comparison with mass ions and retention times of standards under chromatographic conditions described previously (Table 1) [Brudzynski & Miotto, 2011]. The low polarity of “polyphenol-type” complexes (longer elution times) indicated their hydrophobic nature. 1.2 1.0 0.8 0.6 0.4 Intens. (x108) 0.2 0 1.2 1.0 0.8 0.6 0.4 0.2 0 0 2 4 6 8 10 12 14 16 18 Time (min) FIGURE 5. Extracted ion chromatogram of “protein-type” complexes against target mass ions of p-coumaric acid m/z 163 (peak 1), chrysin m/z 253 (peak 2), pinocembrin m/z 255 (peak 3) and acecatin m/z 283 (peak 4) (lower panel). The upper panel presents the TIC. 76 Polyphenol-Protein Interactions 1.0 0.8 0.6 0.4 Intens. (x108) 0.2 0 1.0 0.8 0.6 0.4 0.2 0 0 2 4 6 8 10 12 14 16 18 Time (min) FIGURE 6. Extracted ion chromatogram of “polyphenol-type” complexes against target mass ions of pinobanksin m/z 271 (peak 1), chrysin m/z 253 (peak 2), pinocembrin m/z 255 (peak 3) and acecatin m/z 283 (peak 4). The upper panel present the TIC of “polyphenol-type” complexes. Another feature differentiating “protein-type” from “polyphenol-type” complexes was the level of their antioxidant/pro-oxidant capacity. The radical scavenging activity of “protein-type” complexes was up to 2.5 fold higher than that of “polyphenol-type” complexes in unheated honeys and increased up to 29.5 fold after heat-treatment of honey, as indicated by ORAC values [Brudzynski & Miotto, 2011b]. Polyphenols present in “protein-type” and “polyphenoltype” complexes also showed a distinct susceptibility to autooxidation. This was determined colorimetrically using a dye, NitroBlue Tetrazolium (NBT). In the presence of redox-active quinones, the NBT was reduced producing the purple formazan [Paz et al., 1991]. The reaction proceeds under alkaline conditions in the presence of glycine as a reducing agent that reduces quinones to hydroquinones. Hydroquinones in turn, reduce the NBT to formazan. Thus, the intensity of formazan staining directly correlated with the levels of quinone-protein complexes that underwent reduction to hydroquinones. By employing this method, it occurred that “protein-type” complexes possessed a limited reducing activity toward NBT and therefore had less quinones/ hydroquinones, while “polyphenol-type” complexes strongly reduced the dye [Brudzynski et al., 2013]. The importance of these differences is implicit in the fact that in “protein-type complexes” the reduced, non-oxidized polyphenols may carry antioxidant activity, while the oxidized polyphenols of “polyphenol-type” complexes may contribute to pro-oxidant effects. These interesting preliminary observations need to be further thoroughly investigated. FUNCTIONAL CONSEQUENCE OF PROTEIN-POLYPHENOL COMPLEXATION: LOSS OR GAIN OF FUNCTION Enzyme inactivation The interactions of proteins and polyphenols influence the structural and functional properties of both molecules. The covalent interactions of proteins with polyphenols may be responsible for the inactivation of honey enzymes; alphaamylase (diastase), alpha-glucosidase, and D-fructofuranoside-fructohydrolase, invertase [White et al., 1964; Huidobro et al., 1995; Oddo et al., 1999; Semkiw et al., 2010]. Although such relationship in the case of honey enzymes has not yet been established, other studies showed a clear connection between polyphenol bindings and inhibition of variety of enzymes [Haslam, 1996; Harborne & Williams, 2000; Narayana et al., 2001; Charlton et al., 2002]. Honey has also been shown to inhibit polyphenol oxidase activity and enzymatic oxidation of polyphenols [Oszmianski & Lee, 1990]. 77 K. Brudzynski & L. Maldonado-Alvarez TABLE 1. Summary of retention times of polyphenolic standards and polyphenols in “protein-type” and polyphenol-type” complexes. Polyphenol [M-H] -m/z Chemical structure Standard Protein-type compounds Polyphenol-type compounds Retention Time (min) Retention Time (min) Retention Time (min) Caffeic acid 179 3,4-Dihydroxy-cinnamic acid 4.19 13.9; 14.5; 15.1 p-coumaric acid 163 4-hydroxycinnamic acid 8.7 8.7 Ferulic acid 193 3-methoxy-4-hydroxycinnamic acid 9.5 9.5 Pinobanksin 271 3,5,7-trihydroxyflavanone 9.1 9.1; 11.0 9.1 Pinocembrin 255 5,7-dihydroxyflavanone 14.4 14.4;13.9 14.4;10.7 Chrysin 253 5,7-dihydroxyflavone 14.0 14.0 14.0 Acacetin 283 5,7-Dihydroxy-4'-methoxyflavone Apigenin-4'-methylether 15.1 15.2 15.1; 14.6 Changes in antioxidant capacities With respect to polyphenols, their binding to proteins usually causes a decrease of their antioxidant activities [Rohn & Rawel, 2004]. Often, the antioxidant capacities of protein-polyphenol complexes were found to be lower than the sum of the antioxidant capacities of individual components [Arts et al., 2001]. However, in contrast, antioxidant and metal chelating activities were shown to be retained by melanoidins of beer [Morales & Jimenes-Perez, 2004], bread crust [Michalska et al., 2008], vinegar [Tagliazucchi et al., 2010] and wines [Lopez de Lerma et al., 2010]. In honey, the incorporation of polyphenol-protein complexes into melanoidin was responsible for both gain and loss of melanoidins’ antioxidant activity [Brudzynski & Miotto, 2011a]. In unheated honeys, the radical scavenging activity of melanoidins depended on the initial content and antioxidant activity of polyphenols. In light- and medium-colored honeys possessing low ORAC values, heat treatment caused a strong increase in antioxidant activity of melanoidins with the concomitant accelerated formation of high molecular weight melanoidins. Melanoidins of light- and medium honeys gained the antioxidant capacity. In contrast, heat treatment of dark, buckwheat honeys, that possessed a high polyphenol content and high initial antioxidant activity, resulted in an overall reduction of ORAC values and a decrease of polyphenol content in melanoidin complexes. Melanoidins of dark honey lost the antioxidant capacity. As a result, much stronger correlation was observed between phenolic content and antioxidant capacity of melanoidins in unheated honeys than in heated honeys (R=0.89, p<0.0002 and R=0.72, p<0.007, respectively) [Brudzynski & Miotto, 2011]. Evidence that thermal treatment of honey did not produce uniform effects on antioxidant capacity of honeys was also reported by other researchers [Turkmen et al., 2006; Šarić et al., 2013]. It has to be appreciated that heat-treatment of honey accelerated the global reduction-oxidation pathways, and several products of the Maillard reaction could contribute to the antioxidant capacities, in addition to polyphenols. We have also noted that heat-treatment of buckwheat honeys caused accelerated formation of very large, insoluble, brown aggregates that precipitate out of solution and these events coincided with the reduction of antioxidant capacities of soluble melanoidins [Brudzynski & Miotto, 2011b]. Our preliminary observations of two types of protein-polyphenol complexes, the “protein-type” and “polyphenol-type”, carrying antioxidant and pro-oxidant capacities in honeys requires further, thorough investigation. However, the existence of these complexes may provide a previously unrecognized link through which the polyphenol interaction with proteins could directly impact either antioxidant or prooxidant capacities of food products. Inhibition of antibacterial activity An important functional consequence of protein-polyphenol interaction is the loss of honey’s antibacterial activity during storage [Brudzynski & Kim, 2011]. Polyphenols alone have been shown to contribute to antibacterial activity by binding and inactivating proteins of crucial importance for bacterial survival [Haslam, 1996; Cushnie & Lamb, 2005]. In honey, such role has been assigned to pinocembrin [Bogdanov, 2011]. However, the highest relevance to antibacterial activity of honey might be related to polyphenol oxidation and the propensity of quinones to react with proteins. Probable targets for quinone bindings on the bacterial cell are proteins of cell envelope and cell wall, surface-exposed adhesins and membrane-bound enzymes [Cowan, 1999]. The decrease of honey’s antibacterial activity during storage could be explained by increasing complexation of quinones with honey proteins that in turn, reduced quinone availability to react with bacterial proteins. This explanation found a partial support in the observation that the decline in antibacterial activity during storage coincided with increasing formation of melanoidins as indicated by a significant browning (p<0.0025), increased concentration of UV-absorbing compounds (p<0.0001), and the appearance of polymeric structures [Brudzynski & Kim, 2011]. CONCLUDING REMARKS From these results, a picture emerges that redox properties of polyphenols are at the center of polyphenol-protein interactions in honey. The polyphenol auto-oxidation leads to formation of irreversible, covalent bonds between quinones and proteins. The increased complexation of proteins by polyphenols during honey storage correlated with a loss 78 of enzyme activities, a decrease of antibacterial activity and a change of the balance between antioxidant-pro-oxidant capacities. In relation to the latter, we presented data on previously unrecognized types of protein-polyphenol complexes that differed in size, stoichiometry, and antioxidant capacities. The possible implication of this finding is that “polyphenol-type” complexes could carry mostly pro-oxidant activity due to presence of oxidized polyphenols while “protein-type “complexes could be responsible for antioxidant activity. The differences in redox cycling between these two types of complexes could partially explain a loss or gain of antioxidant capacities observed in different honeys after heating. Another new hypothesis presented here is a potential association between honey flavonoids and polyphenols such as association of caffeic acid with flavones-, chrysin and acecatin, and flavanone-, pinocembrin. A phenomenon of co-pigmentation between anthocyanins with caffeic, coumaric, chlorogenic, sinapic, and ferulic acids is well recognized in wines [Boulton, 2001]. The importance of co-pigmentation in wines is in the protection of anthocyanins from oxidation and that it could also merit study in honey. Finally, the environmental factors are significantly implicated in honey structure and function by modulating oxidation-reduction reactions in honey. ACKNOWLEDGMENTS This work was supported in part by the grant from the Ontario Centres of Excellence # BM50849 (K.B) and the OCE graduate student stipend award (L.M-A). We are very grateful to Mr. Tim Jones for LC-ESI-MS analysis of honey fractions. REFRENCES 1. Arts M.J., Haenen G.R., Voss H.P., Bast A., Masking of antioxidant capacity by the interaction of flavonoids with protein. Food Chem. Toxicol., 2001, 39, 787–791. 2. Babacan S., Rand A.G., Characterization of honey amylase. J. Food Sci., 2007, 72, 50–55. 3. Baroni M.V., Chiabrando G.A., Costa C., Wunderlin D.A., Assessment of the floral origin of honey by SDS-page immunoblot techniques. J. Agric. Food Chem., 2002, 50, 1362–1367. 4. Baxter N.J., Williamson M.P., Lilley T.H., Haslam E., Stacking interactions between caffeine and methyl gallate. J. Chem. Soc. Faraday Trans., 1996, 92, 231–234. 5. Baxter N.J., Terence H., Lilley T.H., Haslam E., Michael P., Williamson M.P., Multiple interactions between polyphenols and a salivary proline-rich protein repeat result in complexation and precipitation. Biochemistry, 1997, 36, 5566–5577. 6. Bilikova K., Hanes J., Nordhoff E., Saenger W., Klaudiny J., Simuth J., Apisimin, a new serine-valine-rich peptide from honeybee (Apis mellifera L.) royal jelly: purification and molecular characterization. FEBS Lett., 2002, 528, 125–129. 7. Bogdanov S., Jurendic T., Sieber R., Gallmann P., Honey for nutrition and health: a review. J. Am. Coll. Nutr., 2008, 27, 677–689. 8. Bogdanov S., Determination of pinocembrin in honey using HPLC. J. Apic. Res., 2011, 28, 55–57. 9. Bonhevi J.S., Torrento M.S., Raich J.M., Invertase activity in fresh and processed honeys. J. Sci. Food Agri., 2000, 80, 507– –512. Polyphenol-Protein Interactions 10. Bors W., Heller, W., Michel C., Saran M., Flavonoids as antioxidants: determination of radical scavenging efficiencies. Methods Enzymol., 1990, 186, 343–355. 11. Bors W., Michel C, Stettmaier K., Lu Y., Foo L.Y., Antioxidant mechanism of polyphenolic caffeic acid oligomers, constituent of Salvia officinalis. Biol. Res., 2004, 37, 301–311. 12. Boulton R., The copigmentation of anthocyanins and its role in the color of red wine: a critical review. Am. J. Enol. Vitic., 2001, 52, 67–77 . 13. Breiteneder H., Thaumatin-like proteins – a new family of pollen and fruit allergens. Allergy, 2004, 479–481. 14. Brudzynski K., Miotto D., The recognition of high molecular weight melanoidins as the main components responsible for radical-scavenging capacity of unheated and heat-treated Canadian honeys. Food Chem., 2011a, 125, 570–575. 15. Brudzynski K., Miotto D., Honey melanoidins. Analysis of a composition of the high molecular weight melanoidin fractions exhibiting radical scavenging capacity. Food Chem., 2011b, 127, 1023–1030. 16. Brudzynski K., Miotto D., The relationship between the content of Maillard-reaction-like products and bioactivity of Canadian honeys. Food Chem., 2011c, 124, 867–874. 17. Brudzynski K., Kim L., Storage-induced chemical changes in active components of honey de-regulate its antibacterial activity. Food Chem., 2011, 126, 1155–1163. 18. Brudzynski K., Sjaarda C., Maldonado-Alvarez L., A new look on protein-polyphenol complexation during honey storage: Is this a random or organized event with the help of dirigent-like proteins? PLoS One, 2013, 8. e72897. 19. Cilliers J.J.L., Singleton V.L., Characterization of the products of nonenzymic autoxidative phenolic reactions in a caffeic acid model system. J. Agric. Food Chem., 1991, 39, 1298–1303. 20. Charlton A.J., Baxter N.J., Lokman Khan M., Moir A.J.G., Haslam E., Davies A.P., Williamson M.P., Polyphenol/peptide binding and precipitation. J. Agric. Food Chem., 2002, 50, 1593– –1601. 21. Cowan M.M., Plant products as antimicrobial agents. Clin. Microbiol. Rev., 1999, 12, 564–582. 22. Cushnie T.P., Lamb A.J., Antimicrobial activity of flavonoids. Int. J. Antimicrob. Agents, 2005, 26, 343–356. 23. De Freitas V., Mateus N., Structural features of procyanidin interactions with salivary proteins. J. Agric. Food Chem., 2001, 49, 940–945. 24. Di Girolamo F., D’Amato A., Righetti P.G., Assessment of the floral origin of honey via proteomic tools. J. Proteomics, 2012, 75, 3688–3693. 25. Harborne J.B., Williams C.A., Advances in flavonoid research since 1992. Phytochemistry, 2000, 55, 481–504. 26. Haslam E., Polyphenol-protein interactions. (Short Communication). Biochem. J., 1974, 139, 285–288. 27. Haslam E., Natural polyphenols (vegetable tannins) as drugs: possible modes of action. J. Nat. Prod., 1996, 39, 205–215. 28. Hotta H., Sakamoto H., Nagano S., Osakai T., Tsujino J., Unusually large number of electrons for the oxidation of polyphenolic antioxidants. Biochem. Biophys. Acta, 2001, 1526, 159–167. 29. Huidobro J.F., Santana F.J., Sanchez M.P., Sancho M.T. Muniategui J., Simal-Lozano J., Diastase, invertase and -glucosidase activities in fresh honey from northwest Spain. J. Apic. Sci., 1995, 34, 39–44. K. Brudzynski & L. Maldonado-Alvarez 30. Iglesias M.T., Martin-Alvarez P.J., Polo M.C., Lorenzo C.D., Pueyo E., Protein analysis of honey by fast protein liquid chromatography: Application to differentiate floral and honeydew honeys. J. Agric. Food Chem., 2006, 54, 8322–8327. 31. Israelachvili J.N., Intermolecular and Surface Forces, Second Edition: With Applications to Colloidal and Biological Systems (Colloid Science). 1992, 2nd ed., Academic Press, San Diego, CA, p. 450. 32. Kamakura M., Suenobu N., Fukushima M., Fifty-seven-kDa protein in royal jelly enhances proliferation of primary cultured rat hepatocytes and increases albumin production in the absence of serum. Biochem. Biophys. Res. Commun., 2001, 282, 865–874. 33. Kimura Y., Washino N., Yonekura M., N-linked sugar chains of 350-kDa royal jelly glycoprotein. Biosci. Biotechnol. Biochem., 1995, 59, 507–509. 34. Kimura Y., Kajiyama S., Kanaeda J., Izukawa T., Yonekura M., N-linked sugar chain of 55-kDa royal jelly glycoprotein. Biosci. Biotechnol. Biochem., 1996, 60, 2099–2102. 35. López de Lerma N., Peinado J., Moreno J., Peinado R.A., Antioxidant activity, browning and volatile Maillard compounds in Pedro Ximénez sweet wines under accelerated oxidative aging. LWT- Food Sci. Technol., 2010, 43, 1557–1563. 36. Lothrop R.E., Paine H.S., Some properties of honey colloids and the removal of colloids from honey with bentonite. Industr. Engng. Chem., 1931, 23, 328–332. 37. Majtan J., Kovacova E., Bilikova K., Simuth J., The immunostimulatory effect of the recombinant apalbumin 1–major honeybee royal jelly protein – on TNF- release. Int. Immunopharmacol., 2006, 6, 269–278. 38. Majtan J., Kumar P., Majtan T., Walls A.F., Klaudiny J., Effect of honey and its major royal jelly protein 1 on cytokine and MMP-9 mRNA transcripts in human keratinocytes. Exp. Dermatol., 2009, 19, e73–e79. 39. Methodieva D., Jaiswal A.K., Cenas N., Dickancaite E., SeguraAguilar J., Quercetin may act as cytotoxic pro-oxidant after its metabolic activation to semiquinone and quinoidal product. Free Rad. Biol. Med., 1999, 26, 107–116. 40. Midoro-Horiuti T., Brooks E.G., Goldblum R.M., Pathogenesis-related proteins of plants as allergens. Ann. Allergy Asthma Immunol., 2001, 87, 261–271. 41. Michalska A., Amigo-Benavent M., Zielinski H., del Castillo M.D., Effect of baking on the formation of MRPs contributing to the overall antioxidant activity of rye bread. J. Cereal Sci., 2008, 48, 123e132. 42. Morales F.J., Jimenez-Perez S., Peroxyl radical scavenging activity of melanoidins in aqueous systems. Eur. Food Res. Technol., 2004, 218, 515–520. 43. Moreira A.S.P., Nunes F.M., Domingues M., Coimbra M.A., Coffee melanoidins: structures, mechanisms of formation and potential health impacts. Food Funct., 2012, 3, 903–915. 44. Naczk M., Towsend M., Zadernowski R., Shahidi F., Protein-binding potential of phenolics of mangosteen fruit (Garcinia mangostana). Food Chem., 2011, 128, 292–298. 45. Narayana K.R., Reddy S.R., Chaluvadi M.R., Krishna D.R., Bioflavonoids classification, pharmacological, biochemical effects and therapeutic potential. Indian J. Pharmacol., 2001, 33, 2–16. 46. Oddo L.P., Piazza M.G., Sabatini A.G., Accorti M., Characterization of unifloral honeys. Apidologie, 1995, 26, 453–465. 79 47. Oddo L.P., Piazza M.G., Pulcini P., Invertase activity in honey. Apidologie, 1999, 30, 57–65. 48. Oszmianski J., Lee C.Y., Inhibition of polyphenol oxidase activity and browning by honey. J Agric. Food Chem., 1990, 38, 1892–1895 49. Paine H.S., Gertler S., Lothrop R.E., The colloidal constituents of honey. Industr. Engng. Chem., 1934, 26, 73–81. 50. Paz M.A., Flückiger R., Boak A., Kagan H.M., Gallop P.M., Specific detection of quinoproteins by redox-cycling staining. J. Biol. Chem., 1991, 266, 689–692. 51. Pontoh J., Low N.H., Purification and characterization of beta-glucosidase from honey bees (Apis mellifera). Insect Biochem. Mol. Biol., 2002, 32, 679–690. 52. Pyrzynska K., Biesaga M., Analysis of phenolic acids and flavonoids in honey. Trends Anal. Chem., 2009, 28, 893–902 53. Rohn S., Rawel H.M.J., Antioxidant activity of protein-bound quercetin J. Agric. Food Chem., 2004, 52, 4725–4729. 54. Rossano R., Larocca M., Polito T., Perna A.M., Padula M.C., et al., What are the proteolytic enzymes of honey and what they do tell us? A Fingerprint analysis by 2-D zymography of unifloral honeys. PLoS One, 2012, 7, e49164. 55. RiceEvans C.A., Miller J., Paganga G., Antioxidant properties of phenolic compounds. Trends Plant. Sci., 1997, 2, 152–159. 56. Šarić G., Marković K., Vukičevič K., Lež E., Hruškar M., Vahčič N., Changes of antioxidant activity of honey after heat treatment. Czech J. Food Sci., 2013, 31, 601–606. 57. Schepartz A.I., Subers M.H., The glucose-oxidase of honey: I. Purification and some general properties of the enzyme. Biochim. Biophys. Acta, 1964, 85, 228–237. 58. Semkiw P., Skowronek W., Skubida P., Rybak-Chmielewska H., Szczesna T., Changes occurring in honey during ripening under controlled conditions based on -amylase activity, acidity and 5-hydroxymethylfurfural content. J. Apic. Sci., 2010, 54: 55–64. 59. Siebert K.J., Troukhanova N.V., Lynn P.Y., Nature of polyphenols-protein interactions. J. Agric. Food Chem., 1996, 44, 80–85. 60. Siebert K.J., Effects of protein-polyphenol interactions on beverage haze, stabilization and analysis. J. Agric. Food Chem., 199, 47, 353–362. 61. Šimúth J., Some properties of the main protein of honeybee (Apis mellifera) royal jelly. Apidologie, 2001, 32, 69–80. 62. Šimúth J., Bilikova K., Kovacova E., Kuzmova Z., Schroder W., Immunochemical approach to detection of adulteration in honey: physiologically active royal jelly protein stimulating TNF- is a regular component of honey. J. Agric. Food Chem., 2004, 52, 2154–2158. 63. Spencer C.M., Cai Y., Martin R., Gaffney S.H., Goulding P.N., Magnolato D., Lilley T.H., Haslam E., Polyphenol complexation—some thoughts and observations. Phytochemistry, 1988, 27, 2397–2409. 64. Tagliazucchi D., Verzelloni E., Conte A., Contribution of melanoidins to the antioxidant activity of traditional balsamic vinegar during aging. J. Food Biochem., 2010, 34, 1061–1078. 65. Tamura S., Amano S., Kono T., Kondoh J., Yamaguchi K., Kobayashi S., Ayabe T., Moriyama T., Molecular characteristics and physiological functions of major royal jelly protein 1 oligomer. Proteomics, 2009, 9, 5534–5543. 66. Tonks A.J., Cooper R.A., Jones K.P., Blair S., Parton J., Tonks A., Honey stimulates inflammatory cytokine production from monocytes. Cytokine, 2003, 21, 242–247. 80 67. Turkmen N., Sari F., Poyrazoglu E.S., Velioglu Y.S., Effects of prolonged heating on antioxidant activity and color of honey. Food Chem., 2006, 95, 653–657. 68. Wang H.-Y., Qian H., Yao W.-R., Melanoidins produced by the Maillard reaction: Structure and biological activity. Food Chem., 2011,128, 573–584. 69. Watanabe K., Shinmoto H., Kobori M., Tsushida T., Shinohara K., Kanaeda J., Yonekura M., Stimulation of cell growth in the U-937 human myeloid cell line by honey royal jelly protein. Cytotechnology, 1998, 26, 23–27. 70. White J. Jr., The composition of honey. Bee World, 1957, 38, 57–66. Polyphenol-Protein Interactions 71. White J., Kushnir I., Subers M.H., Effect of storage and processing temperatures on honey quality. Food Technol., 1964. 18, 153–156. 72. White J., Kushnir I., The enzymes of honey: Examination by ion-exchange chromatography, gel filtration and starch-gel electrophoresis. J. Apic. Res., 1966, 6, 69–89. 73. Witczak M., Juszczak L., Gałkowska D., Non-Newtonian behaviour of heather honey. J. Food Eng., 2011, 104, 532–537. 74. Won S.R., Lee D.C., Ko S.H., Kim J.H., Rhee H.I., Honey major protein characterization and its application to adulteration detection. Food Res. Int., 2008, 41, 952–956. Submitted: 27 October 2014. Revised: 26 February 2015. Accepted: 2 March 2015. Published on-line: 15 April 2015. Pol. J. Food Nutr. Sci., 2015, Vol. 65, No. 2, pp. 81–85 DOI: 10.1515/pjfns-2015-0020 http://journal.pan.olsztyn.pl Original article Section: Food Quality and Functionality Antioxidant Effect of Natural Honeys Affected by Their Source and Origin Martin Mellen, Martina Fikselová*, Andrea Mendelová, Peter Haščík Faculty of Biotechnology and Food Sciences, Slovak University of Agriculture in Nitra, Tr. A. Hlinku 2, Nitra, 949 76, Slovakia Key words: antioxidants, honey, authentication, phenols, ABTS method In purpose to examine the antioxidant activity of 15 natural honeys of different origin ABTS method was used, total phenol content and dry matter content of honey samples were determined. Honeys were collected from different locations of Slovakia, Poland and Serbia and were represented as monofloral and multifloral samples (10) which originated from Poland and Slovakia, forest samples (4) originated from Serbia and honeydew honey. Average values of antioxidant activity observed in samples of honeys ranged from 0.62 to 4.63 mmol/kg. The highest antioxidant activity was detected in buckwheat honey and the lowest was shown in acacia honey. By observing the impact of individual honey samples on antioxidant activity it was found that the sample had a highly statistically significant effect. 10 homogeneous groups which varied in the antioxidant activity among each other were established by all 15 samples. Antioxidant activity of honeys could be a positive influence factor in terms of honey differentiation, especially in the case of the forest honeys collected from different places. Monofloral and multifloral honeys (10) established 5 homogenous groups, but in the case of several multifloral honeys which originated from different places of Poland and Slovakia no statistically significant differences were found. INTRODUCTION By the Codex Alimentarius honey is the natural sweet substance, produced by honeybees from the nectar of plants or from secretions of living parts of plants, or excretions of plant-sucking insects on the living parts of plants, which the bees collect, transform by combining with specific substances of their own, deposit, dehydrate, store and leave in honeycombs to ripen and mature. The colour, aroma and consistency of honey all depend upon which flowers the bees have been foraging. The consumption of honey is increasing because of its beneficial biological properties, including antioxidant and antibacterial activities [Montenegro & Mejias, 2013]. A large number of in vitro and limited clinical studies have confirmed the broad-spectrum antibacterial, antifungal, antiviral, and antimycobacterial properties of honey, to immune modulating and anti-inflammatory properties of honey [Israili, 2014]. In our previous study, we tested potential antimicrobial activity of selected honeys against four species of bacteria (Escherichia coli CCM 3988, Pseudomonas aeroginosa CCM 1960, Staphylococcus epidermis CCM 4418, Bacillus cereus CCM 2010) and two species of yeasts (Saccharomyces cerevisiae CCM 8191, Candida albicans CCM 8216). The strongest antimicrobial activity was shown in honey samples of 50% concentration against Escherichia coli, Pseudomonas aeroginosa and Staphylococcus epidermis [Fikselova et al., 2014]. * Corresponding Author: E-mail: [email protected] (M. Fikselova) Antioxidant activities were demonstrated in commercial Indian honeys, which may have therapeutic potential, though honey has a significant amount of phenols [Saxena et al., 2010]. Monofloral Malaysian honeys were analysed by Hussein et al. [2011] to determine their antioxidant activities and total phenolic and flavonoid contents, with and without gamma irradiation. Honey can scavenge free radicals and exhibit high antioxidant-reducing power, in good correlation with its phenolic content [Hussein et al., 2011]. Honey provides sugars and other nutrients, such as mineral elements, proteins, and antioxidant active compounds. The presence of several minor components and the antioxidant activity in honey is related to the botanical origins of the product [Escuredo et al., 2013]. It is a rich source of antioxidant and antiseptic compounds including Maillard reaction products, vitamins, carotenoids and polyphenols [O’Sullivan et al., 2013]. Carotenoids were the predominant floral pigments in several tested honeys, while xanthophylls and anthocyanins were the least predominant ones [Alqarni et al., 2012], total chlorophylls were also found. By the European Parliament resolution there are Calls on the Commission to respond to the requests for example by improving statistical data in relation to production forecasts, including the application of the same quality requirements for honey, Calls to consider, in the framework of the legislative proposal on agricultural quality policy, changing the rules on origin labelling of honey in order to avoid misleading information to consumers, especially in the case of a blend of honeys originating from EU and non-EU. Therefore quality parameters of honey are studied in order to confirm the au- © Copyright by Institute of Animal Reproduction and Food Research of the Polish Academy of Sciences © 2015 Author(s). This is an open access article licensed under the Creative Commons Attribution-NonCommercial-NoDerivs License (http://creativecommons.org/licenses/by-nc-nd/3.0/). 82 thenticity, the food safety and also to provide the nutritional values of regional honeys. Physicochemical properties, main mineral content and antioxidant activity were determined in Portuguese honeys, statistical analysis demonstrated that antioxidant parameter and main mineral content had a positive influence on honeys differentiation [Alves et al., 2013]. New criteria based on regional characteristics of Saudi honeys including antioxidants, micro-constituents were suggested by Alqarni et al. [2012]. Therefore the purpose of this study was to determine the antioxidant activity of 15 natural honeys in samples originated from different sources and areas, also in order to test the influence of honey origin on its antioxidant activity. Antioxidant methods were used to support the determination of the total phenolic content in the analysed honeys. MATERIALS AND METHODS Honey samples (Table 1) were collected from different locations of Slovakia (6 samples), Poland (5 samples) and Serbia (4 samples) and were obtained directly from local beekeepers. Honeys were represented as monofloral and multifloral samples (10) which originated from Poland and Slovakia (Table 1), forest samples (4) originated from Serbia and honeydew honey (1) from Slovakia. Antioxidant activity determination Samples of honey (2 g) were mixed with 10 mL of distilled water. The prepared mixture was centrifuged for 5 min at 10,000 rpm and a temperature of 20°C. Extracts prepared were stored during the experiments in a refrigerator at 4–6°C. Experiments were performed either directly, or samples were further diluted before measurement as needed. ABTS test of honeys ABTS•+ solution was prepared as described Re et al. [1999]. Before use of 1 mL of this solution, ABTS•+ was diluted with 50 mL of distilled water. Concentration of the solution prepared was around c=1×10⁻⁴ mol/L. Aqueous solution of ABTS•+ (1×10⁻⁴ mol/L) was put into a syringe (1 mL volume) and into identical second syringe there was put 1 mL of aqueous solution of honey. Both syringes were connected with a micro-mixing chamber, connected into an EPR cell (internal volume 400 μL), during the measurement permanently placed in the cavity of the EPR spectrometer (Bruker, Germany). This arrangement allowed to start the measurement at the moment of mixing the sample and ABTS•+. The time evolution of 15 spectra for 22.5 min of mixing ABTS•+ with a solution of honey was observed. Each spectrum represents the average of 30 individual scans. Distilled water was used as a reference sample. All measurements were performed in duplicates and EPR spectrometer was used for determination. EPR spectrometer parameters were as follows: Central field: 350 mT, Sweep width: 9 mT, Modulation amplitude: 0.052 mT, Receiver gain: 4.48.103 G, Source performance: 6 mW, Frequency of microwave radiation: 9.81 GHz. The measured EPR spectra were processed in programs WINEPR (Bruker ®) and ORIGIN (MicroCalc ®). Results Antioxidant Effect of Natural Honeys TABLE 1. Investigated honey samples. No Sample Origin 1 forest Serbia (Milevici), altitude 800 m 2 forest Serbia (Babine), altitude 1250 m 3 forest Serbia (Jabuka), altitude 1250 m 4 (multi)floral Poland 5 heather Poland 6 (multi)floral Poland 7 floral (rape) Slovakia (Nitra) 8 acacia Slovakia (Nitra) 9 (multi)floral Slovakia (Michalovce) 10 forest raspberry Slovakia (Bystrá) 11 forest Serbia, altitude 1000 m 12 buckwheat Poland 13 (multi)floral Poland 14 (multi)floral Slovakia (Stupava) 15 honeydew Slovakia (Relov) were expressed as Trolox equivalent values (TEACABTS • + ) as follows : whereas: c0 (ABTS•+), ct (ABTS•+) is concentration of ABTS•+ in time t=0, resp. t=10.5 min.; V(ABTS•+) is volume of ABTS•+ added; V(vzorky) is volume of sample added; is stoichiometric coefficient of the reaction ABTS and TROLOX, in this case =1/2; and Z is the dilution factor. Determination of total phenol content (TPC) in honey Total polyphenol content was determined according to the modified method using the Folin-Ciocalteau reagent [Singleton et al., 1999]. Exactly 200 mL sample of the aqueous solution of honey was mixed with 15.8 mL of distilled water and with 1 mL of Folin-Ciocalteau reagent. After 10 min, 3 mL of a 20% sodium carbonate solution was added and the mixture was stirred well. After 60 min, absorbance of each solution was measured at 765 nm. The results were expressed as gallic acid equivalent (GAE mg/kg). Calibration curve was prepared using standards of gallic acid in the range of 0–1000 mg/L. All measurements were performed in duplicate. Determination was performed with the use of UV-VIS-NIR Shimadzu spectrometer (UV - 3600 with accessories). Determination of dry matter content Dry matter content of honeys was determined refractometrically by digital refractometer [Kačániová et al., 2009]. Statistical analysis The mean values and standard deviations were calculated. Data were elaborated with the analysis of variance (ANOVA), 83 M. Mellen et al. Fisher’s least significant difference (LSD), and Pearson’s correlation coefficient were determined. Analysis of the results was performed using the statistical software Statistica 8.0 [Statsoft, Inc. 2008]. TABLE 2. Analysis of variance (ANOVA) for ABTS (mmol/kg) by sample. Source of variability Between groups RESULTS AND DISCUSSION Antioxidant effect of honeys determined by the ABTS method Mean values of the antioxidant activity in the analysed samples of honeys determined with the ABTS method ranged from 0.62 to 4.63 mmol/kg. By monitoring the impact of individual honey samples on the antioxidant activity it was found that the sample had a highly statistically significant effect (Table 2). By further testing with the use of the Fisher test there were monitored differences among groups of samples of honey in terms of the antioxidant activity. Ten homogeneous groups were established by 15 samples of honeys that varied in the antioxidant activity among each other (Table 3). Results of ABTS assay showed that the mean antioxidant activity in all multifloral honeys ranged from 0.64 to 1.47 mmol/kg, including from 0.9 to 1.42 mmol/kg in multifloral honeys originating from Poland and from 0.64 to 1.47 mmol/kg in Sloval multifloral honeys. All analysed monofloral and multifloral honeys (10) established 5 homogenous groups (Table 3). In the same homogenous groups (b,d), there were found multifloral honeys originating from Slovakia and from Poland as well, so there were no statistical differences among them regarding antioxidant activity. The lowest antioxidant activity was evaluated in a sample of acacia honey (0.62 mmol/kg). In Slovenia, with using the FRAP and the DPPH methods, results showed that the antioxidant activity varies depending on the type of honey. Similarly, the honey from Acacia belonged to the antioxidatively weakest sample [Bertoncelj et al., 2007; Fikselová et al., 2014]. Floral honeys were observed to be low at antioxidant effect by DPPH method as well as at antimicrobial activity [Fikselová et al., 2014]. Forest honeys originating from Serbia were proved to have more effective antioxidant activity ranging from 1.58 to 2.71 mmol/kg. Dark honeys were shown to be antioxidative the best samples in several studies [Bertoncelj et al., 2007; Wilczyńska 2010], they are often a rich source of vitamins and minerals, but their variation in the content of the various honeys is large [Bradbear et al., 2009]. Four forest samples monitored in our study (No. 1,2,3,11) created four homogenous groups, which shows that their origin had a significant effect on their antioxidant effect. Even forest samples (no. 2 and 3) from the same altitude (1250 m) but originating from different places of Serbia created different homogenous groups (i, fg). The ABTS assay showed good antioxidant effect of honeydew honey (2.12 mmol/kg). Honeydew and chestnut honeys produced in a European Atlantic area had the highest mineral, protein, and flavonoid contents, as well as the highest antioxidant activities [Escuredo et al., 2013]. The highest antioxidant activity in our study showed buckwheat honey (4.63 mmol/kg), which was confirmed also in our previous research by DPPH method [Fikselová et al., 2014]. High an- Sum of squares Df Mean square F-Ratio 30.03 14 2.15 678.98** Within groups 0.05 15 000 – Total 30.08 29 – – ** statistically significant at <0.01; df - degree of freedom; n=30. TABLE 3. The average values of ABTS method determined in honeys and homogeneous groups based on Fisher’s test. No. of sampleb ABTS (mmol/kg) Conf. intervals Mean a -95 % +95 % 8 0.62 a 0.54 0.71 7 0.64 a 0.56 0.73 14 0.85 b 0.77 0.94 13 0.90 b 0.81 0.98 4 1.11 c 1.03 1.20 6 1.42 d 1.33 1.50 9 1.47 de 1.38 1.55 5 1.49 de 1.40 1.57 11 1.58 e 1.49 1.66 15 2.12 f 2.04 2.21 3 2.19 fg 2.11 2.28 1 2.25 g 2.16 2.33 10 2.45 h 2.36 2.53 2 2.71 i 2.62 2.79 12 4.63 j 4.55 4.72 Values in the same column with different letters are significantly different (<0.05). b 1 forest (Serbia), 2 forest (Serbia), 3 forest (Serbia), 4 floral (Poland), 5 heather (Poland), 6 floral (Poland), 7 floral, rape (Slovakia), 8 acacia (Slovakia), 9 floral (Slovakia), 10 forest raspberry (Slovakia), 11 forest (Serbia), 12 buckwheat (Poland), 13 floral (Poland), 14 floral (Slovakia), 15 honeydew (Slovakia). a tioxidative effect is mainly due to flavonoids content, which represent a major group of natural antioxidants in buckwheat. Following our previous results [Ivanišová & Fikselová, 2010], the highest antiradical activity measured by DPPH method was shown for the sample of buckwheat extract as well. Phenolic compounds variation in samples of honeys A number of studies assumed that eating plant foods containing phenolic compounds may contribute significantly to health improvement [Naczk & Shahidi, 2004]. Honey is a rich source of phenolic acids and flavonoids [Farooqui et al., 2011], polyphenolic compounds of honey act as natural antioxidants and are becoming increasingly popular because of their 84 Antioxidant Effect of Natural Honeys TABLE 4. The average levels of polyphenols (TPC) expressed as gallic acid equivalent and homogeneous groups based on Fisher’s test. TPC (mg/kg) Mean Conf. interval -95 % +95 % 13 611.20 a 593.35 629.04 8 635.98 a 618.14 653.82 7 703.72 b 685.88 721.57 14 704.20 b 686.36 722.04 11 769.50 c 751.66 787.34 1 804.64 d 786.80 822.48 15 899.72 e 881.87 917.56 2 909.17 e 891.33 927.01 6 961.19 f 943.35 979.03 4 990.01 972.17 1007.85 3 1052.09 h 1034.25 1069.93 5 1124.73 i 1106.89 1142.57 10 1244.80 j 1226.95 1262.64 9 1257.12 j 1239.28 1274.96 12 2962.24 k 2944.40 2980.08 g Values in the same column with different letters are significantly different (<0.05). 2 1 forest (Serbia), 2 forest (Serbia), 3 forest (Serbia), 4 floral (Poland), 5 heather (Poland), 6 floral (Poland), 7 floral, rape (Slovakia), 8 acacia (Slovakia), 9 floral (Slovakia), 10 forest raspberry (Slovakia), 11 forest (Serbia), 12 buckwheat (Poland), 13 floral (Poland), 14 floral (Slovakia), 15 honeydew (Slovakia). a TABLE 5. Analysis of variance (ANOVA) for TPC (mg/kg) by sample. Source of variability Between groups Within groups Total Dry matter content variation in samples of honeys The last parameter observed was dry matter content of honeys. The mean content of the dry matter in honey samples (Figure 1) ranged from 78.2 to 83.77%. By monitor- Sum of squares Df Mean square F-Ratio 9,076,740.00 14 648,339.00 4626.15** 85 2102.20 15 140.15 – 84 9,078,840.00 29 – – 83 ** statistically significant at <0.01; df - degree of freedom; n=30. potential role in the protection of human health. These substances can also be used as an indicator of geographical origin and source of honey [Tulipani et al., 2009]. Correlation analysis related the contents of the polyphenolic compounds with the antioxidant activities of the honeys, indicated that the flavonoids had a great influence on this activity [Escuredo et al., 2013]. Thirty two samples of different types of Polish honeys were investigated by Wilczyńska [2010] in order to assess their total phenolic content and potential antioxidant activity. Results of the study showed that the total phenolic content and antioxidant activity differed widely among different honey types. Mean TPC in our samples expressed as gallic acid equivalent ranged from 611.20 to 2962.24 (mg/kg). By monitoring the impact of individual samples on TPC it was found that Dry matter (%) No. of sample the sample had a highly statistically significant effect. Samples formed 11 homogeneous groups which differed among each other in their TPC (Table 4 and 5). Four forest samples established similarly 4 homogenous groups as in the case of the antioxidant activity . TPC in multifloral honeys ranged from 611.00 to 1257.12 mg/kg, within them in honeys originating from Poland it ranged from 611 to 990 mg/kg, and Slovak multifloral honeys it ranged from 703.7 to 1257.12 mg/kg. Forest honeys originating from Serbia were found to have similar TPC, which ranged from 769 to 1052 mg/kg. Although the forest honeys were found to be more effective antioxidants in general compared to floral ones, in TPC they were similar, therefore it can be seen that not only phenolic substances are involved in the antioxidant effectiveness of forest honeys. The highest TPC (2962.24 mg/kg) was found in a sample of buckwheat honey, which is in accordance with our antioxidative results of buckwheat honey. Phenolic content of the honey samples is partially responsible for their antioxidant activity, which supports the relevance of this type of honey being an important dietary source of antioxidant compounds and its traditional use as a medicinal product [Silva et al., 2013]. Total polyphenols of honeydew honeys originating from Romania, Bulgaria, Croatia, Greece and Turkey were evaluated by Bobis et al. [2011]. Polyphenols, expressed as mg GAE/100 g, ranged from 53.91 to 196.0 mg GAE in honey from Romania; from 118.46 to 133.12 mg GAE in honey from Bulgaria; from 94.58 to 133.92 mg GAE in honey from Croatia etc. Honeydew honey from our study originating from Slovakia showed a high content of polyphenolic compounds in the amount of 899.72 mg/kg GAE. 82 81 80 79 78 77 1 2 3 4 5 6 7 8 9 10 11 12 13 14 15 Sample FIGURE 1. Variability of dry matter content (%) in honeys. Explanations: 1 forest (Serbia), 2 forest (Serbia), 3 forest (Serbia), 4 floral (Poland), 5 heather (Poland), 6 floral (Poland), 7 floral, rape (Slovakia), 8 acacia (Slovakia), 9 floral (Slovakia), 10 forest raspberry (Slovakia), 11 forest (Serbia), 12 buckwheat (Poland), 13 floral (Poland), 14 floral (Slovakia), 15 honeydew (Slovakia). M. Mellen et al. ing the impact of individual honey samples on the dry matter content of honey we confirmed that the sample has a highly statistically significant effect (not shown). Further testing by the Fisher test showed relative differences among samples of honey in dry matter content, 11 homogenous groups were formed (not shown). SUMMARY AND CONCLUSIONS Antioxidant activity of honeys could be a positive influence factor in terms of honey differentiation, especially in the case of the forest honeys collected from different places. The analysed monofloral and multifloral honeys (10) established 5 homogenous groups, but in the case of several multifloral honeys which originated from Poland and Slovakia no statistical significant differences were found. Forest honeys were proved to have more effective antioxidant effect compared to floral ones, although their phenolic content was similar to floral honeys. The ABTS assay showed good antioxidant activity of honeydew honey, the highest antioxidant activity had buckwheat honey, while the antioxidative weakest sample was the sample of acacia honey. By observing the impact of individual honey samples on the antioxidant activity it was statistically confirmed that the sample has a highly statistically significant effect and similar trend was determined in the case of total phenol and dry matter content of honeys. ACKNOWLEDGEMENTS For helping us in this research study we thank our colleagues prof. Miroslava Kačaniová from the Slovak University of Agriculture in Nitra, assoc. prof. Malgorzata Džugan from the University of Rzeszow (Poland) and Dr. Nenad Vukovič from the University of Kragujevac (Serbia) who have kindly supported us by honey samples from different places. REFERENCES 1. Alqarni A.S., Owayss A.A., Mahmoud A.A., Physicochemical characteristics, total phenols and pigments of national and international honeys in Saudi Arabia. Arab. J. Chem., 2012. Article in Press. Available at: [http://www.sciencedirect.com/science/article/pii/S1878535212002699]. 2. Alves A., Ramos A., Goncalves M.M., Bernardo M., Mendes B., Antioxidant activity, quality parameters and mineral content of Portuguese monofloral honeys. J. Food Comp. Anal., 2013, 30, 130–138. 3. Bertoncelj J., Doberšek U., Jamnik M. et al., Evaluation of the phenolic content, antioxidant activity and colour of Slovenian honey. Food Chem., 2007, 105, 822–828. 4. Bobis O., Dezmirean D. S., Stanciu G.S., Bobis O., Liviu A., Polyphenolic content and antioxidant capacity of honeydew honey: Comparison between Romanian and other south European declared honeydew honeys. Econ. Manag. Financ. Markets, 2011, 6, 1213–1218. 5. Bradbear N., Bees and their role in forest livelihoods., Rome. 2009. Available at: [http://www.fao.org/docrep/012/i0842e/ i0842e00.html]. 6. Codex Standard for Honey. CODEX STAN 12–1981. 85 7. Escuredo O., Miguez M., Fernandez-Gonzalez M., Seijo C., Nutritional value and antioxidant activity of honeys produced in a European Atlantic area. Food Chem., 2013, 138, 851–856. 8. Farooqui T., Farooqui A., Health benefits of honey: Implications for treating cardiovascular diseases. Curr. Nutr. Food Sci., 2011, 7, 232–252. 9. Fikselová M., Kačániová M., Hleba L. et al., Antimicrobial and antioxidant activity of natural honeys of different origin. Scientific Papers: Animal Science and Biotechnologies, 2014, 47, 2, 218- 224. 10. Hussein S.Z., Yusoff K.M., Makpol S., Yusof Y.A.M., Antioxidant capacities and total phenolic contents increase with gamma irradiation in two types of Malaysian honey. Molecules, 2011, 16, 6378–6395. 11. Israili Z.H., Antimicrobial properties of honey. Am. J. Therap., 2014, 21, 4, 304–23. 12. Ivanišová E., Fikselová M., Obilniny ako potenciálne zdroje antioxidačných látok. Potravinárstvo, 2010, 4, 48–51 (in Slovak). 13. Kačániová, M., Kňazovická, V., Melich, M et al., Environmental concentration of selected elements and relation to physicochemical parameters in honey. J Environ Sci Heal A, 2009, 44, 414–422. 14. Montenegro G., Mejías E., Biological applications of honeys produced by Apis mellifera. Biol. Res., 2013, 46, 341–345. 15. Naczk M., Shahidi F., Extraction and analysis of phenolics in food. J. Chromatogr. A, 2004, 1054, 95–111. 16. O’Sullivan A.M., O’Callaghan Y.C., O’Connor T.P., O’Brien N.M., Comparison of the antioxidant activity of commercial honeys, before and after in-vitro digestion. Pol. J. Food Nutr. Sci., 2013, 63, 167–171. 17. Re R., Pellegrini N., Protegente A., Pannala M. et al., Antioxidant activity applying an improved ABTS radical cation decolorization assay. Free Rad. Biol. Med., 1999, 26, 1231–1237. 18. Saxena S., Gautam S., Sharma A., Physical, biochemical and antioxidant properties of some Indian honeys. Food Chem., 2010, 118, 391–397. 19. Silva T.M.S., Santos F.P, Evangelista-Rodrigues A. et al., Phenolic compounds, melissopalynological, physicochemical analysis and antioxidant activity of jandaı’ra (Melipona subnitida) honey. J. Food Comp. Anal., 2013, 29, 10–18. 20. Singleton V.L., Orhofer R., Lamuela-Raventos R.M., Analysis of total phenols and other oxidation substrates and antioxidants by means of Folin-Ciocalteu reagent. Methods Enzymol., 1999, 299, 152–178. 21. StatSoft, Inc. 2008. STATISTICA - data analysis software system, version 8.0. 22. The situation in the beekeeping sector. European Parliament resolution of 25 November 2010 on the situation in the beekeeping sector (2012/C 99 E/13). Official Journal of the European Union. 23. Tulipani S., Romandini S., Vidal A. et al., Methodological aspects about determination of phenolic compounds and in vitro evaluation of antioxidant capacity in the honey: A Review. Curr. Anal. Chem., 2009, 5, 293–302. 24. Wilczyńska A., Phenolic content and antioxidant activity of different types of Polish honey – a short report. Pol. J. Food Nutr. Sci., 2010, 60, 309–313. Submitted: 5 August 2014. Revised: 7 October and 30 November 2014. Accepted: 26 January 2015. Published on-line: 15 April 2015. 4th International Conference and Exhibition on Food Processing & Technology August 10-12, 2015 London, UK W e feel blissful to invite you all to attend Food Technology-2015 on a theme “Food Technology: Trends and Strategies for Innovation of Sustainable Foods” Food Technology is a constantly evolving industry, where companies are often looking for ways to make the food we eat safer, tastier and cheaper. Typically, households spend nearly £5,000 a year on groceries, swelling the coffers of an industry with a £76 billion turnover. Food and drink accounts for 16 per cent of the UK’s total manufacturing sector and employs up to 400,000 people. London’s food sector is worth a massive £17bn with small and medium food businesses providing the majority of the industry’s 300,000 jobs. More market information: http://conferenceseries.com/foodtechnology-foodsecurity-packagingtechnology.php Web: http://foodtechnology.conferenceseries.com/ Call for abstracts: http://foodtechnology.conferenceseries.com/call-for-abstracts.php Invitation from Scientific Advisor Organizing Committee Members Ozlem Tokusoglu Conference Chair Celal Bayar University, Turkey Christopher Smith Conference Co-Chair Manchester Metropolitan University, UK Gabriela Riscuta Program Director National Cancer Institute, USA Venue Details Crowne Plaza London Heathrow Stockley Road, West Drayton Middlesex, UB7 9NA, United Kingdom 0DLQ2IÀFH+RWHO Email: [email protected], [email protected] Looking forward to see you @ London, UK Pol. J. Food Nutr. Sci., 2015, Vol. 65, No. 2, pp. 87–91 DOI: 10.1515/pjfns-2015-0024 http://journal.pan.olsztyn.pl Original article Section: Food Chemistry Antioxidant Properties of Honey from Different Altitudes of Nepal Himalayas Bishnu Prasad Neupane1*, Komal Prasad Malla1, Atis Kaundinnyayana1, Prakash Poudel1, Rashmi Thapa1, Sabina Shrestha2 School of Health and Allied Sciences, Pokhara University, Lekhnath-12, Kaski, PO Box No. 427, Nepal Faculty of Biotechnology, College of Applied Life Science, Jeju National University, Jeju 690–756, Republic of Korea 1 2 Key words: Nepalese honey, antioxidant activity, phenolic content, physicochemical parameters Twenty two multifloral honey samples representing central western parts of Nepal were examined spectrophotometrically for their antioxidant properties and total phenol content. The modified Folin-Ciocalteu method was used to determine total phenol content and 2,2-diphenyl-1-picrylhydrazyl radicals (DPPH•) assay for antiradical activity. In all samples, physicochemical parameters like moisture, reducing sugar, sucrose, ash, free acidity and water insoluble matter were also measured according to harmonized methods of the International Honey Commission (IHC). The results of physicochemical analysis showed that all the values, except for moisture of a small number of high altitude honey samples, are in good agreement with the current Nepalese standard. The total phenolic contents of honey, collected from high and low altitude, ranged from 154.87 to 41.90 mg gallic acid equivalent (GAE/100 g) respectively, at corresponding antiradical activity using DPPH• expressed as percent inhibition of 76.66% and 25.69%. The IC50 values of selected high altitude honey samples ranged from 56 to 72 mg/mL. The total antioxidant properties were correlated (P<0.01) between total phenol content and antiradical activity (r=0.992). The obtained results demonstrate that the Nepalese honey collected from high altitude region contained more antioxidants than honey of low altitude region. INTRODUCTION Honey is naturally sweet and viscous liquid made from the nectar of flowers collected by honey bees. It comes in numerous varieties with different colours, textures and flavours. The flavour, colour and sweetness of honey depend on climatic and environmental conditions and diverse botanical origins from which it is harvested [Gheldof & Engeseth, 2002; Küçük et al., 2007; Aljadi & Kamaruddin, 2004]. Man’s use of honey goes back tens of thousands of years for its nutritional as well as curative purpose [Kaal, 1991]. The usage has continued into present-day folk medicine and is increasingly becoming a part of modern professional medicines. The role of honey in the treatment of various ailments has received a considerable attention recently, and its therapeutic value has been partly attributed to its antioxidant properties [Gheldof & Engeseth, 2002; Aljadi & Kamaruddin, 2004]. Antioxidant molecules prevent or inhibit reactive oxygen species (ROS) produced in metabolic and physiological process, and harmful oxidative reactions occurring in organisms [Young & Woodside, 2001]. Under certain conditions, the increase in oxidants and decrease in antioxidants cannot be prevented, and the oxidative or antioxidative balance shifts towards the oxidative status. Consequently, oxidative stress can be responsible for over * Corresponding Author: Tel.: +977–9841533885; E-mail: [email protected] (Bishnu Prasad Neupane) 100 disorders [Halliwell et al., 2000]. Therefore, as food additive antioxidant potential of honey can play a positive role to overcome human health issues. Many methods for determining the antioxidative activity in honey have been used such as determination of active oxygen species, their radical scavenging ability [Gheldof & Engeseth, 2002], the 2,2-diphenyl-2-picrylhydrazil (DPPH) antioxidant content [Chen et al., 2000] and enzymatic and non-enzymatic measurements of lipid peroxidation inhibition [Chen et al., 2000; McKibben & Engeseth, 2002; Nagai et al., 2001]. The selection of honey samples with various altitude origins in this study was based on the assumption that varying total phenol content and antioxidant capacity is expected for honey produced from diverse floral sources having different geographic regions of Himalayan foothills to the plains of Terai region. The extensive exploitation of honey combs by honey hunters and traders has led to drastic decline of accessible honey combs of Himalayan rock bee (Apis laboriosa) in Himalayan region. In spite of its high medicinal values, virtually little research data are available on the phenolic antioxidants and radical scavenging activity in the context of Nepal. The aim of this study was to determine the antioxidant properties of twenty two honey samples available in central western part of Nepal, with special focus on two different altitudinal ranges of honey collection, high altitude (1500– –3500 m asl) and low altitude (800–1500 m asl). In addition, in all of the honey samples, physicochemical parameters were also measured. © Copyright by Institute of Animal Reproduction and Food Research of the Polish Academy of Sciences © 2015 Author(s). This is an open access article licensed under the Creative Commons Attribution-NonCommercial-NoDerivs License (http://creativecommons.org/licenses/by-nc-nd/3.0/). 88 MATERIALS AND METHODS Honey samples Twenty two raw honey samples of varying geographical origins (11 from low altitude, 800–1500 m asl and 11 from high altitude, 1500–3500 m asl) were used for this study. The honey samples were obtained directly from beekeepers and honey hunters of Kaski district of Nepal during AprilMay 2013. All tested honey samples were multifloral honeys as derived from at least 55% pollen contribution from more than one floral source [Von der Ohe et al., 2004]. Five grams of each honey sample was distributed into test tubes and diluted to 50 mL with distilled water using a vortex mixture. The solution was then filtered through Whatman No. 1 filter paper and analysed for physicochemical parameters, total phenol content and antioxidants. The tests of all determination were performed in triplicate and expressed as mean±SD. Chemicals Folin-Ciocalteau reagent and 2,2-diphenyl-2-picrylhydrazine (DPPH•) free radical were purchased from Sigma-Aldrich, Germany. All other chemicals and reagents used in this study were of analytical grade. Physicochemical parameters In all samples, the physicochemical parameters such as moisture, reducing sugars, sucrose, ash, free acidity, water insoluble matter and pH were determined according to the methods recommended by International Honey Commission [Bogdanov, 2009]. pH was determined using pH meter (PH500 Benchtop) by dissolving 10 g honey sample in 75 mL carbon dioxide free water. The free acidity was quantified volumetrically, titrating a honey sample with a solution of 0.05 N NaOH, up to pH 8.3, and expressing the results in milliequivalent of acids at 1000 g of honey. Moisture was determined using the refractometric method of Chataway [1932]. All measurements were taken using an Abbe refractometer, and the moisture (g /100 g honey) was obtained from the refractive index of the honey sample by consulting a standard table (Chataway table). Sugar and sucrose were determined by Fehling solution method [Lane & Eynon, 1923]. For the determination of water insoluble matter, the gravimetric method was used. Twenty grams of honey were diluted with 200 mL water, filtered through crucible and washed carefully, until free from sugars. The presence of sugars was tested by the addition of 1% phloroglucinol in ethanol to some filtrate and few drops of concentrated sulphuric acid, because sugars produce colour at the interface. The crucible was dried at 135±1oC for an hour [Lord et al., 1988]. The gravimetric methodology was used for the determination of ash content. Ten grams of the sample were transferred to the crucible and two drops of olive oils were added. Afterwards, the sample was heated in a hot plate until carbonized. The sample was kept in the preheated furnace at 600±25oC for at least one hour. The crucible was cooled in desiccator and weighed. The ashing procedure was continued until constant weight has been reached. Antioxidant Properties of Honey from Different Altitudes of Nepal Himalayas Total phenolic content The determination of the total phenol (TP) content of honey samples was performed according to the Folin-Ciocalteau method with slight modifications [Singleton et al., 1999]. A 0.5 mL of aliquot of the freshly prepared honey solution was added to 2.5 mL of 0.2 N Folin-Ciocaleau reagents and mixed for 5 min, followed by the addition of 2 mL of 75 gm/L sodium carbonate. After incubation at room temperature for 2 h, the absorbance of the reaction mixture was measured at 760 nm. The TP content was expressed as mg gallic acid equivalents GAE/100 g of honey, using the calibration curve of gallic acid (0–200 mg/L) standards [Meda et al., 2005]. Antiradical activity Antiradical activity of honey samples were determined by using the 2, 2-diphenyl-1-picrylhydrazyl radicals (DPPH.) assay. It was measured according to the method previously described by Zhang & Hamauzu [2004]. Each honey sample was precisely diluted to 4o BX (Refractrometer, ERMA, Tokyo) with distilled water. A 1.5 mL aliquot of 0.1 mmol/L DPPH• solution in methanol was mixed on a vortex and left to stand at 25oC in the dark for 60 min. Then, the decrease in absorbance was measured at 517 nm on spectrophotometer against a methanol blank. The radical scavenging activity (A %) was calculated from the following equation: A % = A0 – AA A0 ×100 where AA - absorbance of the studied sample and A0 - absorbance of the control sample. The parameter IC50 was also determined for those samples having high radical scavenging activity. IC50 parameter was calculated from linear fitting of the radical scavenging activity to the DPPH radical as a function of antioxidants concentration (20–100 mg/mL). Absorption measurements were performed using a UV-VIS Shimadzu 1601spectrophotometer. Statistical analysis The results of all experiments were expressed as mean ± SD values and are representative of three independent experiments. Statistical analysis was carried out by t-test (2 tailed) one using PRISM version 5.0 statistical analysis software (GraphPad Software, Inc., San Diego). Values of P<0.01 were considered significant. RESULTS AND DISCUSSION Physicochemical parameters The seven different physicochemical parameters namely; moisture, reducing sugar, sucrose, ash, free acidity, pH and water insoluble matter were summarised in Table 1. The moisture of four high altitude honey samples (2, 5, 6 and 7) was found in between 29.1–25.0%. These values are higher than the maximum permissive content for honey described by Nepalese standard. The permissible standard value of moisture for the honey in Nepal is not more than 23% [FNCCI/AEC, 2006]. Moreover, the results of physicochemical studies showed that all the average values of different 89 B.P. Neupane et al. TABLE 1. Physicochemical parameters of the Nepalese honey samples (n = 22). Sample No. Moisture (%) (Mean±SD) Reducing sugars (%) (Mean±SD) Sucrose (%) (Mean±SD) Ash (%) (Mean±SD) Free acidity (mmol/kg) Water insoluble matter (Mean±SD) (%) (Mean±SD) pH High altitude sample 1. 22.0±0.34 62.55±0.70 4.4±0.06 0.05±0.00 14.0±0.15 0.3±0.14 4.76 2. 25.3±0.70 64.03±2.33 2.55±0.99 0.04±0.00 13.0±0.13 0.25±0.13 4.80 3. 20.6±0.70 66.57±0.84 5.57±0.49 0.04±0.00 27.7±0.16 0.22±0.12 4.56 4. 21.3±0.30 64.77±0.80 5.84±0.85 0.44±0.07 31.3±0.14 0.12±0.11 4.38 5. 29.1±0.20 61.71±2.03 4.83±0.90 0.14±0.05 43.3±0.10 0.11±0.13 4.89 6. 25.5±0.50 62.51±1.05 2.87±0.81 0.45±0.06 44.7±0.11 0.15±0.10 5.09 7. 26.13±0.23 67.85±0.78 5.65±1.58 0.37±0.12 34.7±0.15 0.14±0.14 4.44 8. 20.13±0.23 63.15±1.81 6.51±0.42 0.34±0.92 33.7±0.17 0.16±0.16 4.51 9. 21.13±0.30 71.44±6.43 5.16±0.05 0.20±0.00 17.3±0.12 0.19±0.15 4.68 10. 22.60±0.20 64.87±2.62 3.16±0.58 0.32±0.04 17.3±2.54 0.10±0.14 4.70 11. 23.20±0.20 68.25±0.43 4.13±0.01 0.24±0.00 12.7±3.67 0.18±0.13 4.85 Low altitude sample 12. 22.01±0.10 62.15±0.10 6.35±0.02 0.35±0.81 14.0±0.18 0.13±0.12 4.79 13. 20.12±2.01 65.13±1.00 3.39±0.01 0.25±0.25 13.3±0.11 0.15±0.11 4.71 14. 20.25±2.10 63.71±2.00 2.38±0.05 0.31±0.12 11.3±0.14 0.11±0.8 4.72 15. 27.05±1.05 62.12±1.50 8.55±0.20 0.45±0.12 52.3±0.13 0.12±0.6 4.84 16. 25.02±1.01 56.02±2.15 5.25±0.91 0.31±1.50 53.3±0.16 0.14±0.9 4.84 17. 22.66±1.50 59.13±1.25 7.58±0.30 0.48±1.60 15.0±0.18 0.11±0.10 4.68 18. 21.1±0.20 55.23±1.65 4.34±0.49 0.37±0.05 20.7±0.12 0.16±0.11 4.48 19. 22.46±0.15 57.21±0.056 3.01±0.45 0.47±0.01 22.0±0.13 0.14±0.13 4.52 20. 22.23±0.22 68.32±0.55 6.75±0.75 0.48±0.20 54.7±0.13 0.16±0.13 4.84 21. 22.01±0.24 62.12±0.34 4.02±0.15 0.35±0.15 51.3±1.50 0.10±0.16 4.88 22. 21.1±0.20 55.23±1.65 3.45±0.15 0.47±0.01 34.0±0.13 0.15±0.14 4.13 parameters were within the limits set by Nepalese standard indicating the use of good practices by bee farmers in central western part of Nepal. The noted higher moisture content in high altitude honey samples might be due tendency of bees to build hives near water source and dependence on water for cooling as well as thinning honey to be fed to larva and the immediate collection of raw honey from the natural habitat along with some waxes. Antioxidant properties Since phenolic substances have been shown to be responsible for the honey antioxidant activity, total phenol content of the honey samples was investigated. The results of antioxidant activity and total phenolic content (TP) of the samples determined by DPPH assay and Folin-Ciocalteu method are presented in Table 2. Significant TP content differences were recorded among the honey types. The total phenolic contents were found to vary from 41.90 to 72.14 mg GAE/100 g in low altitude and 65.23 to 154.87 mg GAE/100 g in high altitude honey samples respectively. Similar phenolic contents (78.96– –114.75 mg GAE/100 g) of several honeys from variuos floral sources were reported in literature, among which the highest TP contenet was found in strawberry tree (Fragaria ananassa) honey and honeydew honey samples [Gheldof & Engeseth, 2002; Beretta et al., 2005; Bertoncelj et al., 2007]. Several investigations have found a significant level of phenolic compounds in the honey samples of different floral origins [Meda et al., 2005; Bertoncelj et al., 2007; Ferreres et al., 1991; Gil et al., 1995; Martos et al., 2000; Blasa et al., 2006]. There is a significant difference (P<0.01) between the mean TP content of low altitude honeys 61.77 mg GAE/100 g and high altitude honeys 118.65 mg GAE/100 g. The antiradical activity of tested honeys was evaluated and found significantly potential in the DPPH• radical reaction system. The radical scavenging potential, expressed as % inhibition, of honey collected from high and low altitude with respect to DPPH radical was in between 76.66– –38.23% and 37.27–25.59% respectively (Table 2). The average percent inhibition determined in the high altitude honey (59.53%) was found to be significantly higher than 90 Antioxidant Properties of Honey from Different Altitudes of Nepal Himalayas TABLE 2. Total phenol (TP) content with respect to gallic acid equivalents (GAE) and antiradical activity by DPPH• assay of the analysed honey samples. TP (mg GAE/100 g±SD) DPPH assay (~% inhibition±SD) High altitude samples 1. 150.60±3.69 74.553±6.096 2. 154.87±3.41 76.667±2.814 3. 115.87±3.20 58.354±6.61 4. 114.52±2.65 59.167±8.04 5. 104.65±3.44 51.809±2.16 6. 98.45±3.34 50.224±2.70 7 139.18±4.23 68.902±0.38 8 135.04±3.66 66.850±1.07 9. 144.85±1.34 71.707±1.25 10. 65.23±3.45 38.232±3.22 11. 77.60±3.55 38.415±2.63 Mean 118.65 59.53 Low altitude samples 12. 41.90±3.42 25.69±3.694 13. 61.91±5.35 30.65±8.676 14. 61.32±3.50 35.30±2.076 15. 59.45±625 29.43±2.928 16. 69.55±3.78 34.43±2.144 17. 65.22±7.49 37.24±1.890 18. 66.02±3.25 32.68±10.020 19. 55.41±5.25 34.86±2.542 20. 59.25±3.30 29.33±5.770 21. 67.41±1.28 36.34±1.582 22. 72.14±3.56 35.71±2.782 Mean 61.77 32.87 that of the low altitude honey (32.87%). It is difficult to compare the obtained values with data obtained by other authors that investigated Polish honeys due to different modes of presentation such as results expressed as mmol TEAC/kg [Rodríguez et al., 2012; Kuś et al., 2014]. However, the results are similar to those obtained by Socha et al. [2011]. A significant correlation was found between antioxidant activity determined by DPPH assay and phenolic content (r=0.992). Similar to our findings, some literature also reported strong correlation between the antioxidant capacity and total phenol content (r=0.873) [Beretta et al., 2005; Bertoncelj et al., 2007]. Among all honeys tested for their antioxidant capacity, the high altitude honey samples (Sample 1, 2 & 9) with the highest percentage inhibition in DPPH• assay were subjected for IC50 determination. 80 Scavenging the DDPPH radical (%) Sample no. 100 60 40 Sample 2 Sample 1 20 Sample 9 0 0 20 40 60 80 100 Concentration of honey (mg/mL) FIGURE 1. The capability of selected high altitude honey samples to scavenge the DPPH radical as a function of honey concentration for the determination of IC50 values. From the results obtained it follows that sample 2 had big capability to scavenge the DPPH radicals with IC50 equal to 56 mg/mL. Samples 1 and 9 also had considerable capacity to scavenge DPPH radicals than low altitude honey samples and their IC50 equalled 68 mg/mL and 72 mg/mL, respectively. One can conclude that the values of IC50 parameter determined in this paper are comparable to those determined by other authors [Meda et al., 2005; Krpan et al., 2009; Kuś et al., 2014]. Figure 1 shows concentration dependence of the DPPH reduction for selected antioxidant high altitude honey samples. CONCLUSION The results of antiradical activity with respect to DPPH• radical and total phenol content revealed that the high altitude honey contained a higher level of antioxidants than low altitude honey, justifying that there would be the chance of synthesis of highly potent antioxidative secondary metabolites by the plants grown at high altitude Himalayan regions to cope with the harsh and extreme climatic conditions. The findings of present research demonstrated that the honey made from high altitude nectar by honeybees from plants grown at high altitude regions possessed high antioxidant capacity. ACKNOWLEDGEMENTS This research was funded by Research Division, University Grants Commission, Nepal, under the title Faculty Reserch Grants-2013. We are grateful to all local bee farmers and honey hunters of Kaski district, Nepal, for their coopertions during the field visits. 91 B.P. Neupane et al. REFERENCES 1. Aljadi A.M., Kamaruddin M.Y., Evaluation of the phenolic contents and antioxidant capacities of two Malaysian floral honeys. Food Chem., 2004, 85, 513–518. 2. Beretta G., Granata P., Ferrero M., Orioli M., Maffei F.R., Standardization of antioxidant properties of honey by a combination of spectrophotometric/fluorimetric assays and chemometrics. Anal. Chim. Acta., 2005, 533,185–191. 3. Bertoncelj J., Dobersek U., Jamnik M., Golob, T., Evaluation of phenolic content, antioxidant activity and colour of Solvenian honey. Food Chem., 2007, 105, 822–828. 4. Blasa M., Candiracci M., Accorsi A., Piacentini M.P., Albertini M.C., Piatti E., Raw Millefiori honey is packed full of antioxidants. Food Chem., 2006, 97, 217–222. 5. Bogdanov S., Harmonized methods of the international honey commission. International Honey Commission., 2009. Retrieved from [http://www.ihc-platform.net/ihcmethods2009.pdf]. 6. Chataway H.D., Determination of moisture in honey. Can. J. Res., 1932, 6, 532–547. 7. Chen L., Mehta A., Berenbaum M., Zangerl A.R., Engeseth N.J., Honeys from different floral sources as inhibitors of enzymatic browning in fruit and vegetable homogenates. J. Agri. Food Chem., 2000, 48, 4997–5000. 8. Ferreres F., Tomas-Barberan F.A., Gil M.I., Tomas- Lorente F., An HPLC technique for flavonoid analysis in honey. J. Sci. Food Agri., 1991, 56, 49–56. 9. FNCCI/AEC., Mandatory quality standard of honey in Nepal. 2006, in: The study report on trade competitiveness of Nepalese honey. Federation of Nepalese Chambers of Commerce and Industry /Agro Enterprise Center, p. 3. 10. Gheldof N., Engeseth N.J., Antioxidant capacity of honeys from various floral sources based on the determination of oxygen radical absorbance capacity and inhibition of in vitro lipoprotein oxidation in human serum samples. J. Agri. Food Chem., 2002, 50, 3050–3055. 11. Gil M.I., Ferreres F., Ortiz A., Subra E., Tomas-Barberan F.A., Plant phenolic metabolites and floral origin of rosemary honey. J. Agri. Food Chem., 1995, 43, 2833–2838. 12. Halliwell B., Gutteridge J.M.C., (eds.) Free Radicals in Biology and Medicine. 2000, Oxford Science Publications, pp. 617 – 624. 13. Kaal J., Natural medicine from honey bees.1991, in: Apitherapy. Kaal’s Printing House, pp. 7–8. 14. Krpan M., Markovic K., Saric G., Skoko B., Haruskar M., Vahcic N., Antioxidant activities and total phenolics of acacia honey. Czech J. Food Sci., 2009, 27, 245–247. 15. Küçük M., Kolayli S., Karaoğlu Ş., Ulusoy E., Baltacı, C., Candan F., Biological activities and chemical composition of three 16. 17. 18. 19. 20. 21. 22. 23. 24. 25. 26. 27. 28. honeys of different types from Anatolia. Food Chem., 2007, 100, 526–534. Lane J.H., Eynon L., Determination of reducing sugars by means of Fehling’s solution with methylene blue as internal indicator. J. Soc. Chem. Ind. Trans., 1923, 42, 32–36. Lord D.W., Scotter M.J., Whittaker A.D., Wood R., The determination of acidity, apparent reducing sugar and sucrose, hydroxymethylfurfural, mineral, moisture, water-insoluble solids contents in honey; collaborative study. J. Assoc. Publ. Anal., 1988, 26, 51–76. Martos I., Ferreres F., Yao L.D., Arcy B., Caffin N., Tomas-Barberan F.A., Flavonoids in monospecific Eucalyptus honeys from Australia. J. Agri. Food Chem., 2000, 48, 4744–4748. McKibben J., Engeseth N.J., Honey as a protective agent against lipid oxidation in ground turkey. J. Agri. Food Chem., 2002, 50, 592–595. Meda A., Lamien C.E., Romito M., Millogo J., Nacoulma O.G., Determination of the total phenolic, flavonoid and proline contents in Burkina Fasan honey, as well as their radical scavenging activity. Food Chem., 2005, 91, 571–577. Nagai T., Sakai M., Inoue R., Inoue H., Suzuki N., Antioxidative activities of some commercially honeys, royal jelly, and propolis. Food Chem., 2001, 75, 237–240. Kuś P.M., Congiu F., Teper D., Sroka Z., Jerković I., Tuberoso C.I.G., Antioxidant activity, color characteristics, total phenol content and general HPLC fingerprints of six Polish unifloral honey types. LWT-Food Sci Technol., 2014, 55, 124–130. Rodríguez B.A., Mendoza S., Iturriga M.H., Castaño-Tostado E., Quality parameters and antioxidant and antibacterial properties of some Mexican honeys. J. Food Sci., 2012 71, 121–127. Singleton V.L., Orthofer R., Lamuela-Raventos R.M., Analysis of total phenols and other oxidation substrates and antioxidants by means of Folin–Ciocalteu reagent. Meth. Enzymol., 1999, 299, 152–178. Socha R., Juszczak L., Pietrzyk S., Gałkowska D., Fortuna T., Witczak T., Phenolic profile and antioxidant properties of polish honeys. Int. J. Food Sci. Technol., 2011, 46, 528–534. Von Der Ohe W., Persano Oddo L., Piana M.L., Morlot M., Martin P., Harmonized methods of melissopalynology. Apidologie, 2004, 35, 18–23 Young, I.S., Woodside J.V., Antioxidants in health and disease. J. Clin. Pathol., 2001, 54, 176 – 86. Zhang D., Hamauzu Y., Phenolics, ascorbic acids, carotenoids and antioxidant activity of broccoli and their changes during conventional and microwave cooking. Food Chem., 2004, 88, 503–509. Submitted: 29 September 2014. Revised: 18 February 2015. Accepted: 23 February 2015. Published on-line: 15 April 2015. Pol. J. Food Nutr. Sci., 2015, Vol. 65, No. 2, pp. 93–100 DOI: 10.1515/pjfns-2015-0018 http://journal.pan.olsztyn.pl Original article Section: Food Chemistry Multi-Element Composition of Honey as a Suitable Tool for Its Authenticity Analysis Mircea Oroian*, Sonia Amariei, Ana Leahu, Gheorghe Gutt Faculty of Food Engineering, Stefan cel Mare University of Suceava, University Street, no. 13, Suceava, Romania Key words: honey, elements, ICP-MS, PCA, SDA The aim of this study was to evaluate the composition of 36 honey samples of 4 different botanical origins (acacia, sun flower, tilia and honeydew) from the North East region of Romania. An inductively coupled plasma-mass spectrometry (ICP-MS) method was used to determine 27 elements in honey (Ag, Al, As, Ba, Be, Ca, Cd, Co, Cr, Cs, Cu, Fe, Ga, K, Li, Mg, Mn, Na, Ni, Pb, Rb, Se, Sr, Tl, U, V and Zn). We would like to achieve the following goal: to demonstrate that the qualitative and quantitative multi-element composition determination of honey can be used as a suitable tool to classify honey according to its botanical origin. The principal component analysis allowed the reduction of the 27 variables to 2 principal components which explained 74% of the total variance. The dominant elements which were strongly associated with the principal component were K, Mg and Ca. Discriminant models obtained for each kind of botanical honey confirmed that the differentiation of honeys according to their botanical origin was mainly based on multi-element composition. A correct classification of all samples was achieved with the exception of 11.1% of honeydew honeys. INTRODUCTION Honey, according to the Council Directive 2001/110/EC, is the natural sweet substance produced by Apismelifera bees from the nectar of plants or from secretions of living parts of plants or excretions of plant-sucking insects on the living parts of plants, which the bees collect, transform by combining with specific substances of their own, deposit, dehydrate, store and leave in honeycombs to ripen and mature. Romania has an ancient tradition of beekeeping. The honey production of Romania, according to the National Institute of Statistics, is about 18,000 tons/year, 85% of the production being exported. The most common unifloral honeys produced in Romania are acacia (Robiniapsedudoacacia), tilia (Tiliaeuropea), sunflower (Helianthus annuus) and honeydew. The North-East region of Romania produces around 2,700 tons honey/year. Honey authenticity is an important issue for honey consumers; therefore it should comply with its declared botanical and geographical origin. Unifloral honeys have always higher commercial value than the polyfloral ones; therefore, finding reliable chemical markers to ascertain the floral origin of honey is a priority research objective in the apiculture industry. Melissopalynological analysis, based on the identification and quantification of the percentage of pollen by microscopic examination, has traditionally been accepted to authenticate the botanical origin of honey and therefore, it is considered to be a reference method [Ohe, 2005]. Physicochemical parameters have also been suggested as complementary informa* Corresponding Author: E-mail: [email protected] (Mircea Oroian) tion to characterise honey [Anklam, 1998]. Additionally, such parameters as sugars, amino acids, proteins and flavours are among markers which are able to characterise various types of honey in conjunction with a number of techniques [Arvanitoyannis et al., 2005]. Gas chromatography coupled to mass spectrometry (GC–MS) combines high sensitivity and efficacy required by the analysis of the very complex mixtures of volatiles present in honey at low concentrations and provides structural information (mass spectrum) for their qualitative analysis [Soria et al., 2008]. The aroma profile can be considered to be a “chemical marker” of monofloral honey due to the fact that it is directly related to the plant nectar extracted by bees [Amtmann, 2010; Overton & Manura, 1994]. For this reason, volatile fraction assessment could be a useful tool to characterise geographical or botanical origins [Castro-Vazquez et al., 2010; Cuevas-Glory et al., 2007]. Honey authenticity was studied by analysing trace elements presented in honeys. There are many studies that use the multi-elements to classify honeys. Chudzinska & Baralkiewicz [2011] have used Al, B, Ba, Ca, Cd, Cu, K, Mg, Mn, Na, Ni, Pb and Zn to classify honeydew, buckwheat and rape honeys from Poland. They observed that K, Al, Ni and Cd were the parameters that best predicted the authenticity of honey. Also Pisani et al. [2008] studied the elemental composition (23 elements) of 51 Italian honey samples using ANOVA and PCA. The results confirmed the highly significant influence of the botanical origin of honey on their chemical composition. The element composition of honey is influenced by: the environment and soil type where the nectar plants grow, and by anthropogenic factors (e.g. pollu- © Copyright by Institute of Animal Reproduction and Food Research of the Polish Academy of Sciences © 2015 Author(s). This is an open access article licensed under the Creative Commons Attribution-NonCommercial-NoDerivs License (http://creativecommons.org/licenses/by-nc-nd/3.0/). 94 tion). In other study, the characterisation of Hatay honeys was made according to their multi-element composition (Al, B, Ba, Ca, Cd, Co, Cr, Cu, Fe, K, Mg, Mn, Na, Ni, Pb, Sr and Zn) by Yucel & Sultanoglu [2013]. The study revealed that cluster analysis and principal component analysis were useful tools to differentiate the authenticity of honey samples using the profile of mineral content, highlighting the relationship between the elements’ distribution and honey type. Fernandez-Torres et al. [2005] applied the multi-element analysis to classify honey according to its botanical origin. They analysed eleven elements (Zn, P, B, Mn, Mg, Cu, Ca, Ba, Sr, Na and K) and made a classification into four different botanical origins: eucalyptus, heather, orange and rosemary. They observed a good prediction of the botanical origins of honey using the multi-element analysis (greater than 97%). The Northwest Morocco honeys (multifloral honey, Apiaceae, eucalyptus, citrus, Lythrum and honeydew) have been classified using the K, Mg, Mn, Cu, Fe and Zn according to their botanical origin by Terrabet al.[2003]. The classification of eucalyptus and honeydew honeys using the multi-element content has been higher than 97%. All the multi-element classifications of honeys could not be made without the chemometrics approach. These authors have used different approaches in honey classification: Principal Component Analysis, Cluster Analysis, Linear Discriminant Analysis and Multilayer Perceptrons [Terrab et al., 2003; Fernandez-Torres et al., 2005; Yucel & Sultanoglu, 2013]. To the authors’ knowledge no other study related to the multi-element composition of Romanian honeys has been reported so far. The aim of this study was to evaluate, from a qualitative and quantitative point of view, the multi-element composition of four honey types from the North-East region of Romania using an ICP-MS technique to determine simultaneously elements and get the possibility to classify honey samples according to their multi-element composition using chemometric analysis. MATERIAL AND METHODS Honey samples To carry out this study, 36 honey samples of different origins: acacia (9 samples), tilia (9 samples), sunflower (9 samples) and honeydew (9 samples) were purchased from local beekeepers of North East region of Romania. All the samples were placed and stored in glass bottles and kept at 4–5ºC in dark prior to analysis. Melissopalynological analysis The pollen analysis was made according to the method of Louveaux et al. [1970], using a non-acetolytic method. Ten grams of honey were mixed with about 40 mL of distilled water; then centrifuged at 4500 rpm (3383×g) for 15 min, the supernatant being carefully removed. The residue was re-dissolved again and centrifuged for other 15 min. The full sediment was used to prepare the slide. The pollen spectrum of each honey sample was determined by a light microscopy (Motic ×40) by counting at least 800 pollen grains. For all pollen types the individual occurrence was expressed as percentage. Honey Authenticity Electrical conductivity Electrical conductivity was determined in accordance with the harmonised methods of the International Honey Commission [Bogdanov, 2002]. Sample preparation Approximately 1 g of each honey sample was weighed into PTFE vessels and dissolved in 9 mL 65% HNO3 and 1 mL 30% H2O2. The digestion procedures were carried out in a micro-wave oven (Speed wave MWS-2, Berghof Products + Instrument Gmbh, Germany) according to instrumental parameters and settings reported previously (in a part Apparatus). Blank solutions were prepared in the same way. Reagents and solutions All reagents were of analytical grade. Double deionised water (18 M cm resistivity) produced by a water purification system (Thermofisher, Germany) was used in all solutions. The element standard solutions were prepared by diluting a stock solution of 1000 mg/L of Ag, Al, As, Ba, Be, Ca, Cd, Co, Cr, Cs, Cu, Fe, Ga, K, Li, Mg, Mn, Na, Ni, Pb, Rb, Se, Sr, Tl, U, V and Zn. Honey samples were digested with concentrated nitric acid (65% HNO3, Sigma Aldrich, Germany) and hydrogen peroxide (30% H2O2 pure p.a, Sigma Aldrich, Germany). Apparatus The mineral elements analysis was performed using an Agilent Technologies 7500 Series (Agilent, USA) system coupled plasma-mass spectrometer. The ICP-MS parameters were: nebulizer 0.9 mL/min, RF power 1500 W, carrier gas 0.92 L/min, makeup gas 0.17 L/min, mass range 7–205 uma, integration time 0.1 s, acquisition 22.76 s. Detector parameters were: discriminator 8 mV, analogue HV 1770 V and pulse HV 1070 V. Statistical analysis Statistical analysis was performed using the version 5.1 of the Statgraphics Plus software system. The data corresponding to each variable were analysed by one-way analysis of variance (ANOVA). Multiple comparisons were performed using the least significant difference test (LSD) and Fisher ratio (F), and statistical significance was set at =0.05. The Principal Component Analysis (PCA) was performed using Unscrambler X 10.1 (CAMO Process AS, Oslo, Norway), all the multi-elements were weighed and normalised to perform the cluster analysis. The Principal Components Analysis (PCA) was applied to describe the relations among the multi-element composition. The discriminant analysis was made using SPSS trial version (USA). RESULTS AND DISCUSSION Melissopalynological analysis The pollen content of the three types of honey ranged between 620 and 6598 pollen grains. According to the classification made by Maurizio [1939], the honey samples analysed can be classified in the 1st (less than 2000 pollen grains per gram) and 2nd class (between 2000–10,000 pollen grains per 95 M. Oroian et al. gram). According to the number of pollen grains, it seems that the acacia honey had the smallest number (the number of pollen grains per gram ranged between 620 and 5389). In the case of tilia honey, the number of pollen grains per gram ranged between 825 and 5231, while in the case of sunflower ranged between 784 and 6598 pollen grains per gram. The honey samples have been classified, acorrding to the melissopalynological analysis, into four main classes as follows: acacia (Robinia pseudoacacia), sun flower (Helianthus annuus), tilia (Tilia europea) and honeydew. The pollen grains found in the acacia honeys were: Robinia pseudoacacia, Brassica napus, Plantago, Prunus, Trifoloium and Rubus. The Brassica napus pollen was the main pollen. The pollen grains of Robinia pseudoacacia were placed in the 2nd place as frequency; the percentage of this type of pollen ranged between 7% and 37%. The following types of pollen grains were found in sunflower honeys: Helianthus annuus, Taraxacum officinale, Trifolium, Fragaria, Tilia, Brassica napus and Robinia pseudoacacia. The major type of pollen was Helianthus annuus, ranging between 52.5% and 67.2%. In the case of tilia honey, the following were observed: Tiliaeuropea, Brassica napus, Helianthus annuus, Galium and Trifolium pollen grains. The major pollen was Tilia europea (31.2–87.4%). Honeydew honey is a poor pollen honey type, having an average concentration of pollen grains of 2241 grains. The major pollen grains present in honeydew honeys were: Castanea sativa and Quercus, followed by Brassica napus, Helianthus annuus and Trifolium repens. The electrical conductivity of acacia, sunflower and tilia honeys ranged between 0.122–0.198, 0.420–0.520 and respectively 0.608–0.730 mS/cm. Honeydew electrical conductivity ranged between 0.92 and1.26 mS/cm. A higher value than 0.80 mS/cm is not an acceptable one for floral honeys, being specific to honeydew honeys, therefore this parameter can be used as a quality parameter to distinguish honeydew and floral honeys [Bogdanov et al., 2004]. The electrical conductivity values for each honey type are in agreement with those presented in the literature [Kadar et al., 2010; Oroian, 2012; Escriche et al., 2009]. METHOD OF VALIDATION The 27 elements were simultaneously determined using ICP-MS after acid mineralization. The capability of the method as a routine analysis method was estimated through the determination of the detection limits of each element studied. The limits of detection (LOD) and limits of quantification (LOQ), were calculated with three and ten timed the standard deviation of the blank divided by the slope of the analytical curve, respectively [Thompson et al., 2002; Khan et al., 2014]. The values of LOD were in the range of 0.251–18.321 μg/kg as it is presented in Table 1. The LOQs ranged between 0.761 and 385.513 μg/kg. Precision is described as the degree of variability given by the expression of results, not taking into account the influence of the sample (sample variability). The precision was evaluated as the relative standard deviation of 10 repeated determinations for one TABLE. 1. Limit of detection (LOD), limit of quantification (LOQ), precision, recovery for the 27 elements analysed using ICP-MS. Analyte LOD (μg/L) LOQ (μg/L) Precision (CV %) Recovery (%) Ag 19.512 59.121 1.29 99 Al 3.812 11.55 3.21 97 As 0.751 2.276 2.75 98 Ba 0.915 2.772 1.21 94 Be 0.351 1.064 2.54 96 Ca 3.156 9.563 4.87 96 Cd 62.624 189.751 1.95 104 Co 86.254 261.35 4.09 103 Cr 0.592 1.794 2.93 97 Cs 0.51 1.545 1.29 105 Cu 0.346 1.048 4.21 98 Fe 0.829 2.512 4.87 99 Ga 0.325 0.985 2.41 99 In 36.214 109.728 2.21 105 K 118.321 358.513 4.89 101 Li 0.271 0.821 4.21 98 Mg 1.212 3.672 4.05 99 Mn 0.456 1.382 4.21 99 Na 115.125 348.829 3.89 98 Ni 0.261 0.791 3.26 95 Pb 1.598 4.842 1.35 103 Rb 0.251 0.761 2.65 97 Se 1.61 4.878 1.92 104 Sr 87.916 266.385 2.98 101 Tl 5.104 15.465 1.89 102 U 0.924 2.8 1.98 102 V 0.271 0.821 1.51 99 Zn 22.659 68.657 2.98 98 sample [Chudzinska & Baralkiewicz, 2011]. Table 1 shows the coefficient of variation for each element. The coefficient of variation for the 27 elements analysed ranged between 1.21 and 4.89%, complying with the required criteria of 5%. Analytical quality control was also verified by the recovery experiments for the 27 selected elements, spiking at two selected concentration levels, 10 and 100 mg/kg. The recoveries, depicted in Table 1, were in the range of 94–105%. Multi-element content in honey samples Table 2 shows the elemental composition of the honey samples analysed. The values of elements were not homogeneous. The highest total element content was observed 96 Honey Authenticity TABLE. 2. Elemental composition of acacia, honeydew, sun flower and tilia honeys. Honey type Acacia Honeydew Sun flower Tilia Element (mg/kg) Ag 0.037a 0.017b 0.015b 0.019ab 2.10ns Al 11.045b 27.038a 13.561b 11.155b 9.82*** As 0.009a 0.007ab 0.005bc 0.003c 6.26** Ba 0.228 0.506 a 0.349 0.174 4.73* Be 0.001 0.002 a 0.001 0.001 16.42*** Ca 52.914c 101.518b 163.878a 137.854ab 13.49*** Cd 0.001b 0.004a 0.003ab 0.001b 3.62* Co 0.008 0.017 a 0.010 0.009 3.63* Cr 0.051 0.049 a 0.037 0.029 7.38*** Cs 0.003b 0.013a 0.007b 0.004b 12.21*** Cu 1.822b 3.354a 2.390b 1.563b 7.36*** Fe b 19.387 28.285 24.009 19.156 2.76ns Ga 0.015bc 0.030a 0.021b 0.012c 7.03*** K 553.867b 1648.16a 849.36b 955.289a 23.85*** Li 11.157b 19.693a 13.677b 12.055b 4.07* Mg 51.212 75.415 63.772 50.549 3.64* Mn 1.715 2.529 1.001 0.868 2.04ns Na 171.149ab 229.333a 154.068b 123.754b 4.64** Ni 0.191b 0.325a 0.183b 0.122b 9.48*** Pb 0.062 0.078 a 0.040 0.026 c 8.23*** Rb 0.442 2.246 a 1.097 bc 11.78*** Se 0.009c 0.013a 0.014a 0.011b 14.47*** Sr 0.264b 0.414a 0.351ab 0.304ab 2.58ns Tl 0.001b 0.003a 0.002b 0.002ab 4.19* U 0.002 0.002 0.001 0.001 b 3.77* V 0.006b 0.023b 0.798a 0.004b 3.32* Zn 2.421a 3.871a 3.241a 2.655a 1.20ns b b b a b ab ab c b a a a a F-value ab b b b ab ab ab bc b b b b b b b b b 0.895 ns – not significant (P>0.05), * P<0.05, ** P<0.01, *** P<0.001; a, b, c,d – statistical groups. in the case of the honeydew sample (2805.08 mg/kg) and the lowest one was observed in the case of the sunflower sample (663.65 mg/kg). The high content of total element in the case of honeydew is mainly due to the presence of potassium in high concentration (2108.21 mg/kg); the same observation was made by others scientists [Lachman et al., 2007; Chua et al., 2012]. Golob et al. [2005] and Vanhanen et al. [2011] observed higher total element contents in the case of honeydew honeys from New Zealand (4060 mg/kg) and Slovenia (3680 mg/kg), respectively. The first group of elements had higher concentrations than 30 mg/kg, such as: K, Na, Ca and Mg. The major concentration was observed in the case of potassium, which ranged between 380.91 and 2108.21 mg/kg. The potassium content covered the elemental composition between 56.16 and 80.56% and was in agreement with the previous studies [Pisani et al., 2008; Terrab et al., 2003; Chua et al., 2012; Vanhanen et al., 2011]. The potassium content ranged between 57.39 and 68.64% in the case of sunflower with a medium concentration of 64.82%, between 70.84 and 75.61% in the case of tilia honey with a medium concentration of 72.59%, between 56.16 and 67.71% in the case of acacia honey with a medium concentration of 63.07%, and between 72.45 and 80.56% in the case of honeydew honey with a medium concentration of 77.06%, respectively. The potassium content decreased as follows: honeydew honey (77.06%) >tilia honey (72.59 %) > sunflower honey (64.82 %) > acacia honey (63.06%). Sodium and calcium were the second and the third predominant minerals in honey samples with a total content ranging between 7.23 to 25.66% and 2.98 to 15.32%, respectively. The next element was Mg with a total content ranging between 2.88% and 9.40%, followed by iron which ranged between 0.95% and 4.57%. The content of Ca was in agreement with the data reported by Lachman et al. [2007]. The second group of elements included Li, Al, Mn, Fe, Cu and Zn, all of them having higher concentrations than 1 mg/kg and lower than 30 mg/kg. Honeydew samples had the highest concentration of elements from the second group. Lithium effects include leukocytosis, polyuria, dry mouth, confusion, nausea, vomiting, muscle twitch, however it is recommended in bipolar disorder treatment. Aluminium is an unwanted element for humans, due to its neurological, lungs, fertility and cancer effects. The copper content was three times higher in honeydew than in the other three honey types, as it was observed by Chua et al. [2012] and Chudzinska & Baralkiewicz [2011], ranging between 0.644 and 5.491 mg/kg. Still trace amount of copper is essential for the formation of haemoglobin, namely oxygen carrying blood component. Furthermore, it helps in the production of melanin which is responsible for pigmentation of eyes, hair and skin. Out of a total of 27 elements, 16 elements were trace elements: Be, V, Cr, Co, Ni, Ga, As, Se, Rb, Sr, Ag, Cd, Cs, Ba, Tl, Pb and U, having lower concentrations than 1 mg/kg in honeys; they belonged to the third group of elements. Selenium was found in all the four honey types, it is a micronutrient which is very important in proper functioning of the immune system, especially thyroid function in humans. Honeydew samples were richer than the other samples not only in the case of elements from the 1st and 2nd groups. It can be observed that Al content was much higher than 2, Mn was much higher than 1.5, Fe much higher than 1.2, Ni much higher than 1.6, Cu much higher than 1.4, Zn much higher than 1.2, Rb much higher than 2, Cs much higher than 1.6, Ba much higher than 1.4 and Pb much higher than 1.2 times in the case of honeydew samples than in the case of acacia, sunflower and tilia honeys, respectively. Heavy metals (Cr, Zn, As, Cd and Pb) in the composition of the honeys under study were registered as well. Cr con- 97 M. Oroian et al. tent ranged between 0.013 and 0.074 pm, Zn content ranged between 0.741 and 8.011 mg/kg, As content from 0.002 to 0.015 mg/kg, Cd content from 0.001 to 0.011 mg/kg and Pb content from 0.020 to 0.142 mg/kg, respectively. Contents of heavy metals were in the same range with those reported by Chua et al. [2012] in the case of honey samples from Malaysia. Lead and arsenic are the most sever environment contaminants. Mostly, these contaminant elements come from industrial activities or automobile exhaust gas emission. Contact with stainless steel surfaces during harvesting, processing and/or preparation of honey for the market, can generate high Cr content, due to corrosive effect of honey acidity [Przybylowski & Wilczynska, 2001]. The analysis of variance was applied to all the elements found in the honey samples (Table 2). In the case of five elements (Mn, Fe, Zn, Sr and Ag), no statistically significant difference was found among honey samples (P>0.05). For twelve elements (Be, Al, K, Ca, Cr, Ni, Cu, Ga, Se, Rb, Cs and Pb), there has been noticed a highly statistically significant difference between honey samples (P<0.001). Considering the Fisher ratio, K content is the most influential element depending on honey type (F=23.85). Chemometric analysis The chemometric analysis is commonly used in science today, so variance analysis (ANOVA), principal component Rotated Scores PC-2 (17%) 0.1 0 - 0.1 - 0.2 - 0.1 0 PC-1 (57%) 0.1 0.2 FIGURE. 1. Principal component analysis of the multi-elements scores of acacia, sunflower, tilia and honeydew honeys. Correlation Loadings (X) 1 0.9 0.8 0.7 0.6 0.5 0.4 0.3 PC-2 (17%) 0.2 0.1 0 - 0.1 - 0.2 - 0.3 - 0.4 - 0.5 - 0.6 - 0.7 - 0.8 - 0.9 -1 -1 - 0.9 - 0.8 - 0.7 - 0.6 - 0.5 - 0.4 - 0.3 - 0.2 - 0.1 0 0.1 PC-1 (57%) 0.2 0.3 0.4 0.5 0.6 0.7 FIGURE 2. Principal component analysis of the multi-element composition of acacia, sunflower, tilia and honeydew honeys. 0.8 0.9 1 98 Honey Authenticity 15 10 Function 2 5 - 30 - 20 - 10 0 10 20 30 -5 - 10 - 15 - 20 Function 1 FIGURE 3. Linear discriminant score plot: rhombus– acacia honeys, triangle – tilia honeys, square – sunflower honeys, cross – honeydew samples. TABLE. 3. Results obtained from the discriminant analysis applied to elemental composition in order to differentiate acacia, tilia, sunflower and honeydew honeys. Count Original Cross validated % % Predicted group membership Acacia Sunflower Tilia Honeydew Total (%) Acacia 100 – – – 100 Sunflower – 100 – – 100 Tilia – – 100 – 100 Honeydew – – – 100 100 Acacia 100 – – – 100 Sunflower – 100 – – 100 Tilia – – 100 – 100 Honeydew – – 11.1 88.9 100 Type analysis (PCA) and stepwise discriminant analysis (SDA) were used to check the similarities between samples according to botanical origin. Principal component analysis The principal component analysis was conducted to evaluate the global effect of elemental composition on honey type, from a descriptive point of view. Figures 1 and 2 present the scores and compound loadings of PCA analysis performed. It was found that the two principal components (PCs) explained 74% of the variations in the data set. The PC1 explained 57% of the variability and the PC2 explained 17%. It can be observed that the honey samples are divided into 4 groups by the two principal components. Magnesium influences the projection of acacia honeys; potassium influences the projection of honeydew honeys, while calcium influences the projection of sunflower honeys. The elements placed in the outer ellipse of the correlation loadings have a higher influence on the projection than those placed in the inner ellipse. Stepwise discriminant analysis A stepwise discriminant analysis was applied, out of which six classification models were constructed. All the elemental components analysed were used for this purpose, and the discriminant functions were constructed using all the variables (Table 3). In order to evaluate the model classification capacity, the percentage of samples classified correctly was considered: original grouped (using all samples to estimate the classification model) and cross-validated grouped (leaving one out) to estimate its robustness. This procedure calculates the model with all samples minus one, after which the prediction is performed. This data processing was repeated as many times as the number of samples was. In this way, it was possible to evaluate the capacity of predicting correctly the group that unknown samples belong to. In all the cases, the same classification of groups was observed. Irrespective of the parameters chosen the percentage of cases correctly classified were 100% in the case of the original classification while in the case of the cross-validation classification the samples were 97.2% correctly classified (Table 3). Acacia, sunflower M. Oroian et al. and honeydew samples were correctly classified, while a honeydew sample was classified as tilia. This fact can be due to the low content of potassium found in that honeydew sample. The linear discriminant analysis applied to all the physicochemical parameters resulted into two canonical functions with the Eigen values of 237.126 and 125.682 and the Wilks’s lambda values of 0.001 and 0.003, respectively. The linear discriminant analysis is shown in Figure 3. Function 1 explains 65.1%, while function 2 explains 34.44%of the total variance. The bi-dimensional plot (Figure 3) of the first two functions shows four groups for the four honey types. The SDA allows visualisation of data in botanical origin representations, simplifying the observation and interpretation of information. The highest absolute value which dominated the first discriminant function is represented by Be content (F1=16.91, F2=7.57), followed closely by the Ca content (F1=14.74, F2=4.73). These two parameters dominated and the second discriminant function did, too. The V content (F1=-0.36, F2=- 2.24) had the lowest influence on the first discriminant function, while Fe content (F1=4.41, F2=0.88) had the lowest influence on the second discriminant function. CONCLUSIONS The multi-element composition of honey provided us with useful information on the differentiation of acacia, honeydew, sunflower and tilia. Therefore, the honey type has a great influence on the multi-element composition. Potassium is the element with the highest concentration in all the honeys irrespective of their botanical origin. The multivariate analysis allowed the discrimination of honey types according to their botanical origin using the multi-element composition. The cross validation of honey samples was correct for the 97.2% of the honey samples (11.1% of the honeydew samples were classified as tilia honeys). Having in view the chemometric approach, we can consider that the multielement composition of honeys is a suitable tool in predicting their botanical origin. ACKNOWLEDGEMENTS The study was financed from resources of the Stefan cel Mare University of Suceava. REFERENCES 1. Amtmann M., The chemical relationship between the scent features of goldenrod (Solidago canadensis L.) flower and its unifloral honey. J. Food Comp. Anal., 2010, 23, 122–129. 2. Anklam E., A review of the analytical methods to determine the geographical and botanical origin of honey. Food Chem., 1998, 63, 549–562 3. Arvanitoyannis S., Chalhoub C., Gotsiou P., Lydakis-Simanitris N., Kefalas P., Novel quality control methods in conjunction with chemometrics (multivariate analysis) for detecting honey authenticity. Crit. Rev. Food Sci. Nutr., 2005, 45, 193–203. 4. Bogdanov S., Harmonised methods of the international honey commission, Swiss Bee Research Centre, FAM, Liebefeld, CH3003 Bern, Switzerland, 2002. 99 5. Bogdanov S., Ruoff K., PersanoOddo L., Physico-chemical methods for the characterisation of unifloral honeys: A review. Apidologie, 2004, 35, 4–17. 6. Castro-Vazquez L., Diaz-Maroto M.C., deTorres C., Pérez-Coello M.S., Effect of geographical origin on the chemical and sensory characteristics of chestnut honeys. Food Res. Int., 2010, 43, 2335–2340. 7. Chua L.S., Abdul-Rahaman N.-L., Sarmidi M.R., Aziz R., Multielemental composition and physical properties of honey samples from Malaysia. Food Chem., 2012, 135, 880–887. 8. Chudzinska M., Baralkiewicz D., Application of ICP-MS method of determination of 15 elements in honey with chemometric approach for the verification of their authenticity. Food Chem. Toxicol., 2011, 49, 2741–2749. 9. Council Directive 2001/110/EC of the 20 December 2001 relating to honey, 2002. Official Journal of the European 334 Communities. L10, 47–52. 10. Cuevas-Glory L.F., Pino J.A., Santiago L.S., Sauri-Duch E., A review of volatile analytical methods for determining the botanical origin of honey. Food Chem., 2007, 103, 1032–1043. 11. Escriche I., Visquert M., Juan-Borras M., Fito P., Influence of simulated industrial thermal treatments on the volatile fractions of different varieties of honey. Food Chem., 2009, 112, 329–338. 12. Fernandez-Torres R., Perez-Bernal J.L., Bello-Lopez M.A., Callejon-Mochon M., Jimenez-Sanchez J.C., Guiraum-Perez A., Mineral content and botanical origin of Spanish honeys. Talanta, 2005, 65, 686–691. 13. Golob T., Dobersek U., Kump P., Necemer M., Determination of trace and minor elements in Slovenian honey by total reflection X-ray fluorescence spectroscopy. Food Chem., 2005, 91, 593–600. 14. Kadar M., Juan-Borrás M., Hellebrandova M., Doménech E., Escriche I., Differentiation of acacia, sunflower and tilia honeys from different countries based on sugar composition, physicochemical and colorparameters. Bull. USAMV Agric., 2010, 67, 252–258. 15. Khan N., Jeong I.S., Hwang I.M., Kim J.S., Choi S.H., Nho E.Y., Choi J.Y., Park K.S., Kim K.S., Analysis of minor and trace elements in milk and yogurts by inductively coupled plasma-mass spectrometry (ICP-MS). Food Chem., 2014, 147, 220–224. 16. Lachman L., Kolihova D., Miholova D., Kosata J., Titera D., Kult K., Analysis of minority honey components: Possible use for the evaluation of honey quality. Food Chem., 2007, 101, 973–979. 17. Louveaux J., Maurizio A., Vorwohl G., Commision Internationale de Botanique Apicole de L’U.I.S.B. Les Methodes of melisso-palynologie. Apidologie, 1970, 1, 211–227. 18. Maurizio A., Untersuchungen zur quantitative Pollenanalyse des Honigs. Mitteilungen aus dem Gebiete der Lebensmittel-Untersuchung und -Hygiene, 1939, 30, 27–72. 19. Ohe W., Persano-Oddo L., Piana M.L., Morlot M., Martin P., Harmonized methods of melissopalynology. Apidologie, 2005, 35, 18–25. 20. Oroian M., Physicochemical and rheological properties of Romanian honeys. Food Bioph., 2012,7, 296–307. 21. Overton S., Manura J., Flavor and aroma in commercial bee honey: A purge-and-trap thermal desorption technique for the identification and quantification of volatiles and semivolatiles in honey. Am. Lab., 1994, 26, 45–53. 100 22. Pisani A., Protano G., Riccobono F., Minor and trace elements in different honey types produced in Siena County (Italy). Food Chem., 2008, 107, 1553–1560. 23. Przybylowski P., Wilczynska A., Honey as an environmental marker. Food Chem., 2001, 74, 289–291. 24. Soria A. C., Sanz J., Martínez-Castro I., SPME followed by GC–MS: a powerful technique for qualitative analysis of honey volatiles. Eur. Food Res. Tech., 2008, 228, 579–590. 25. Terrab A., Gonzalez A.G., Diez M.J., Heredia F.J., Mineral content and electrical conductivity of the honeys produced in Northwest Morocco and their contribution to the characterisation of unifloral honeys. J. Sci. Food Agri., 2003, 83, 637–643. Honey Authenticity 26. Thompson M., Ellison S.L.R., Wood R., Harmonized guidelines for single-laboratory validation of methods of analysis (IUPAC Technical Report). Pure App. Chem., 2002, 74, 835–855. 27. Vanhanen L.P., Emmertz A., Savage G.P. Mineral analysis of mono-floral New Zealand honey. Food Chem., 2011, 128, 236–240. 28. Yucel Y., Sultanoglu P., Characterization of Hatay honeys according to their multi-element analysis using ICP-OES combined with chemometrics. Food Chem., 2013, 140, 231–237. Submitted: 18 July 2014. Revised 30 September and 22 November 2014. Accepted: 26 January 2015. Published on-line: 15 April 2015. Pol. J. Food Nutr. Sci., 2015, Vol. 65, No. 2, pp. 101–108 DOI: 10.1515/pjfns-2015-0022 http://journal.pan.olsztyn.pl Original article Section: Food Quality and Functionality Physico-Chemical, Enzymatic, Mineral and Colour Characterization of Three Different Varieties of Honeys from Kashmir Valley of India with a Multivariate Approach Gulzar Ahmad Nayik*, Vikas Nanda Department of Food Engineering and Technology, Sant Longowal Institute of Engineering and Technology, Longowal 148106 (Punjab) India Key words: Kashmir, honey, acacia, enzymatic, pine honeydew, multifloral The present study was undertaken to determine the physico-chemical properties (moisture content, reducing sugars, proline content, electrical conductivity, ash content, pH, titrable acidity, HMF, water activity, total soluble solids and total solids), enzymatic activity (diastase and invertase), colour characteristics (mmpfund, ABS450 and CIE L*a* b*) and mineral content (Cu, Mn, Fe, Zn, Pb and Cd) of three different varieties of honeys from Kashmir valley of India (acacia honey, pine honeydew and multifloral honey). Of the honey samples analysed, only pine honeydew were grouped in dark category of honey (L*<50) while acacia honey and multifloral honey were confirmed as light coloured honeys (L*>50) and possessed both red and yellow components. The concentrations of mineral content were found highest in pine honeydew followed by multi floral and least in acacia honey. All the physico-chemical properties and enzymatic activity indicated that all the three analysed varieties of honey met the criteria set by the International Honey Commission and revised codex standards for honey. The source of honey had a significant effect (p<0.05) on physico-chemical characteristics, enzymatic activity, mineral content and colour properties. Strong and positive correlations exhibited among minerals, colour (mmpfund) and L* value indicated that dark coloured honey contained high mineral content. Multivariate analysis proved to be an effective tool in classifying the three varieties of honey based on physico-chemical characteristics, enzymatic activity, mineral content and colour properties. INTRODUCTION Honey, the wonderfully rich golden liquid is the miraculous product of honey bees and a naturally delicious alternative to sugar. Chemically, honey is mostly dominated by sugars in the form of fructose and glucose (70–80%), water (10–20%) and other minor constituents such as organic acids (gluconic acid, acetic acid), mineral salts (potassium, calcium, sodium, phosphorus etc.), vitamins (ascorbic acid, niacin), proteins, enzymes (invertase, glucose oxidase, catalase, phosphatases), volatile chemicals, phenolic acids and flavonoids [Bouseta et al., 1996; Terrab et al., 2001; Gheldof et al.,2002; Blasa et al., 2006; Ouchemoukh et al., 2007; Nayik & Nanda, 2015]. The composition and physico-chemical properties of honey are wholly dependent on the plant species visited by the honeybees as well as the processing, storage, regional, and climatic conditions [Saxena et al., 2010]. The colour, which serves as an indicator of floral origin ranges from light to dark often reddish or yellowish [Soria et al., 2004; Terrab et al., 2004]. It is well known fact that there is a strong correlation among colour, antioxidant activity, electrical conductivity and ash content [Marghitas et al., 2009]. Generally dark coloured honey has higher phenolic content and consequently * Corresponding Author: Cell: +91–9478153553; Fax: 01672–280057; E-mail: [email protected] (Gulzar Ahmad Nayik) higher antioxidant activity as compared to honey with light colour [Berreta et al., 2005]. Multivariate analysis viz. principal component analysis (PCA) and linear discriminate analysis (LDA) have been extensively used to classify honey based on physico-chemical data, mineral analysis and colour characteristics. Conti et al. [2007] classified three Italian honey samples (acacia, multifloral, honeydew) on the basis of their physico-chemical data and mineral content by applying multivariate statistical analysis. Chudzinska & Baralkiewicz, [2010] analysed fifty-five Polish honey samples to rationalize and interrupt the analytical data for the determination of thirteen metallic and nonmetallic elements by using PCA tool. Similar study was reported by Devillers et al. [2002] who examined French honeys. Rearing of honey bees for production of honey (apiculture) is one of the prevalent agricultural activities done in India. As per the data published by Press Information Bureau [2012–2013], there are more than 1600 honey producing units in Jammu and Kashmir where honey production is near about 2000 metric tons. The physicochemical characterisation of different honeys from different parts of the world has been carried out extensively [Azeredo et al., 2003; Finola et al., 2007; Ouchemoukh et al., 2007]. Honeys produced in India from various unifloral sources as well as from commercial honeys were already studied by various authors [Ahmed et al., 2007; Nanda et al., 2009; Saxena et al., 2010]. After successful studies of characterisation of quality parameters of Eucalyp- © Copyright by Institute of Animal Reproduction and Food Research of the Polish Academy of Sciences © 2015 Author(s). This is an open access article licensed under the Creative Commons Attribution-NonCommercial-NoDerivs License (http://creativecommons.org/licenses/by-nc-nd/3.0/). 102 tus, Brassica, Helianthus, L. chinensis, Z. mauritiana, C. sinensis and P. persica [Nanda et al., 2003, 2006, 2009], the present study was undertaken, not only to study the physico-chemical parameters, mineral content, enzymatic analysis and colour characteristics from three different varieties from Kashmir valley of India viz. acacia honey, pine honeydew and multifloral honey but also to perform pattern recognition methods by using PCA and LDA to classify honey varieties which has never been performed till now. MATERIALS AND METHODS Honey sample The present study was carried out using 30 samples (10 samples from each variety) of three different raw and fresh honey samples (acacia honey, pine honeydew and multifloral honey) collected from bee keepers during September 2012 to May 2014 from different regions (Pulwama, Srinagar, and Budgam) packed and sealed in glass bottles of Kashmir valley of India and stored at 4oC. The honey samples were kept at ambient temperature 25±1oC overnight before the analyses were performed. The origins of each honey sample were confirmed by microscopic pollen analysis (Melissopalynology). Honey samples were classified according to their botanical origin using the method described by Louveaux et al. [1978]. The following terms were used for frequency classes: predominant pollen (>45% of pollen grains counted), secondary pollen (16–45%), important minor pollen (3–15%) and minor pollen (<3%). Physico-chemical analysis The samples of honey were analysed according to the methods established by AOAC [2012] and International Honey Commission [2009] for moisture content, ash content, electrical conductivity, diastase and invertase activity, reducing sugars, proline content, titrable acidity, pH, total solids and total soluble solids, hydroxymethylfurfural content and water activity. The colour characteristics of the honeys were assessed according to the CIE L*a*b* method described by Saxena et al. [2010]. Colour (mmpfund) was determined by the method described by White [1984] while colour intensity (ABS450) was done by the method adopted by Beretta et al. [2005]. Mineral elements Cu, Mn, Fe, Zn, Pb and Cd were determined by using air acetylene flame atomic absorption spectrometer (AAS4141). The response from the equipment was periodically checked with known standards. Hollow cathode pump and air-acetylene flame were used for all the samples from three varieties. Calibration curves were constructed for each element by using appropriated standard solutions. Statistical analysis The results were expressed in triplicates, mean, standard deviation and correlation was obtained by using Microsoft Excel 2007. The significant differences were obtained by a one-way analysis of variance (ANOVA) followed by Duncan’s multiple range test (DMRT) (p<0.05). Principal component analysis and linear discriminate analysis were performed to classify honey samples from different botanical sources by using XLSTAT. Quality Characterization of Honey from Kashmir RESULTS AND DISCUSSION The pollen spectra of honey samples studied have been briefly described and the percentages are related to pollen of nectar producing plants. Acacia honey contained 54–60% pollen of R. pseudoacacia sp. The honeydew element/pollen grain (HDE/P) ratio was in a range of 2.79–3.01 in pine honeydew (Pinus wallichiana), which was in good agreement with Louveaux et al. [1978]. The microscopic analysis revealed some fungal spores in pine honeydew which is in good agreement with those found in Greek pine honeys [Karabagias et al., 2014]. Multifloral honey contained 2–5% pollens of Plectranthus rugosus, other pollens found were those from Prunus sp., Brassica sp., Thyme sp. and Ailanthus sp. The mean (±S.D) results obtained from the physico-chemical, enzymatic and colour characteristics of honey samples are presented in Table 1 while mineral content is shown in Table 2. Moisture content was reported as an important parameter and honey with lower moisture content showed longer shelf life [Fredes & Montenegro, 2006]. In this study all the samples from three varieties showed the level of moisture content (18.2 to 19.11) which was lower than the limit prescribed by Codex standard for honey [Codex Almentarius, 2001] and International Honey Commission [2009] and the results were significantly different (p<0.05) for each honey obtained from different sources. Our results were in agreement with previous studies [Yilmaz & Kufrevioglu, 2000; Pan & Ji, 1998; Duman et al., 2008]. The moisture content of honey was affected by various factors such as harvesting time, climatic factors and maturity period [Nanda et al., 2003; Finola et al., 2007]. The oBrix values ranged from 79.16 to 80.03 while the refractive index of the samples ranged from 1.4889 to 1.4908. With the increase in the solid content, there was increase in refractive index. The total solid content of the samples was in a range of 80.89% to 81.8% which were quite similar to the results (77.8–80.4%) reported by Saxena et al. [2010]. The pH values of all the honey varieties ranged from 3.52 to 3.78 which confirmed that all the honey varieties were acidic in nature. The pH values were consistent with the results reported by various authors [Azeredo et al., 2003; Ouchemoukh et al., 2007; Saxena et al., 2010; Kamboj et al., 2013]. Results indicated maximum acidity in the form of formic acid in pine honeydew variety (0.39%) followed by acacia honey and multifloral floral varieties in decreasing order with 0.17% and 0.14%, respectively. The titrable acidity and pH of all the samples analysed was found within the corresponding limits as described by Codex Almentarious Commission [2001]. A high strong positive correlation was found between pH and titrable acidity (r=0.99).The percentage ash content is an indicator of the mineral content present in a given sample. The maximum ash content was found in pine honeydew (0.39%) followed by acacia honey (0.06%) whereas ash content on multifloral floral honey was at 0.05%. Similar results were reported by Kamboj et al. [2013] (0.140–0.211%) and Nanda et al. [2009] (0.13 to 0.35%). As per previous studies, electrical conductivity (EC) was used to distinguish honeydew honeys from blossom honey [Mateo & Bosch-Reig, 1998]. The electrical conductivity of all analysed honey samples ranged from 0.25 to 0.79 mS/cm. As per 103 G.A. Nayik & V. Nanda TABLE 1. Physico-chemical parameters of honey samples with Duncan’s multiple range test results. Parameter Acacia honey (n=10) Pine honeydew (n=10) Multifloral honey (n=10) Ash (%) 0.06±0.03 a 0.35±0.02 0.05±0.01b Electrical Conductivity (mS/cm) 0.26±0.05b 0.79±0.06a 0.25±0.04b Titrable acidity (%) 0.17±0.02a 0.39±0.02b 0.14±0.02a pH 3.55±0.0.0ab 3.78±0.11a 3.52±0.02b Moisture (%) 18.6±0.08b 18.2±0.12b 19.11±0.20a Total soluble solids (°B) 79.7±0.10a 80.03±0.15a 79.16±0.25b Total solids (%) 81.40±0.08a 81.8±0.12a 80.89±0.55a HMF(mg/kg) 5.49±0.07b 6.79±0.10b 22.64±0.30a Water activity 0.507±0.00c 0.523±0.00b 0.566±0.00a ABS450 (mAU) 188.05±2.30b 525.39±2.98a 148.31±3.07c Color (mmpfund) 43.32±1.36b 143.04±3.10a 39.16±1.45b L* 61.43±1.60a 15.49±0.3c 54.64±0.81b a* 4.94±0.08a 2.25±0.08c 3.49±0.29b b* 12.32±0.07a 5.28±0.10c 9.39±0.30b Diastase Number (DN) 15.51±1.40b 25.99±2.79a 14.93±2.10b Invertase Number (IN) 9.40±1.27b 15.83±2.82a 12.58±1.94b Proline (mg/kg) 292.02±2.65b 570.95±2.15a 168.05±3.66b Reducing Sugars (%) 66.24±3.05b 60.6±3.94a 72.81±2.97c b Results are expressed as mean values±standard deviations. Means in a row with same superscripts are not significantly different (P<0.05), n=number of samples. Codex Alimentarius [2001] electrical conductivity value for the nectar honey must be less than 0.80 mS/cm while according to the EU, minimum electrical conductivity for pine honey should be near 0.80 mS/cm. The results of electrical conductivity were consistent with reported results of Escuredo et al. [2012] in blossom and honeydew honeys. Positive and strong correlation (r=0.90) between ash content and electrical conductivity (Table 3) indicated that higher ash content resulted in higher electrical conductivity. Tosi et al. [2002] reported that hydroxymethylfurfural (HMF) as a quality parameter to check the honey freshness and high temperature processing. All the three honey varieties showed an HMF level lower than the limit (40 mg/kg), recommended by the Codex Alimentarius [Codex Alimentarius, 2001] and statistical analysis revealed a significant difference (p<0.05) among the varieties. The maximum content of HMF was found in multifloral source (22.64 mg/kg) followed by pine honeydew (6.79 mg/kg) and minimum in acacia honey (5.49 mg/kg) as shown in Table 1. These results suggested that all the samples from three varieties of honey were raw and unprocessed. The HMF values of the analysed samples were consistent with the values reported by Yilmaz & Kufrevioglu [2000] and Duman et al. [2008]. The water activity is an important factor for stability of food by preventing microbial growth. The water activity of the honey samples was in the range of 0.507 to 0.566 and these values were statistically different from each other (p<0.05) (Table 1). Our results were quite similar to those of Greek honeys and Indian honeys [Lazaridou et al., 2004; Saxena et al., 2010]. The acceptability of honey by the consumer and its market price mainly depends on colour of honey. According to the classification of honey based on Pfund mm values set by USDA [1985] colour of honey ranges from water white (<8 mm) to dark amber (>114 mm). Based on this classification, the pine honeydew variety (143.04 mm) was classified as dark amber while multifloral honey (39.16 mm) and acacia honey (43.32 mm) as extra light amber. It was reported that colour of honey was affected by chemical composition, primarily due to the presence of pigments such as chlorophylls, carotenoids, flavonoids and polyphenols [Lazaridou et al., 2004; Finola et al., 2007; Juszczak et al., 2009]. The honeys with light colour usually contained low ash content and low antioxidant activity while those with dark colour showed reverse of these values [Gheldof et al., 2002; Marghitas et al., 2009]. There was high positive correlation found between colour and ash content (r=0.98) and colour values of all samples from different sources were significantly different (p<0.05). Colour intensity (ABS450) is an index for confirming the presence of pigments such as carotenoids and some flavonoids. ABS450 values of the tested samples ranged from 148.31 to 525.39 mAU and were statistically different (P<0.05) (Table 1). All obtained values were in the range as reported by Beretta et al. [2005] in different commercial honey varieties of Italy. 104 Quality Characterization of Honey from Kashmir TABLE 2. Statistical analysis of mineral content (mg/kg) of honey from different sources. Sources Cu Mn Fe Pine honeydew 0.12±0.01 1.08±0.01 Acacia honey 0.12±0.01b Multifloral honey 0.38±0.02a b Zn Pb Cd 2.11±0.01 1.04±0.02 0.21±0.02 0.19±0.02a 0.95±0.01b 1.42±0.03b 0.06±0.03b 0.04±0.04b 0.07±0.02b 1.01±0.02a 1.26±0.03b 0.07±0.03b 0.09±0.02b 0.08±0.03b a a a a Results are expressed as mean values±standard deviations. Means in a column with same superscripts are not significantly different (P<0.05). TABLE 3. Correlation among some physicochemical parameters and minerals (Pearson correlation coefficients, p<0.05). pH Ash Color L* a* b* Cu Mn Fe Zn Pb Cd pH 1.00 – – – – – – – – – – – – Ash 0.99 1.00 – – – – – – – – – – Color 0.66 0.90 1.00 – – – – – – – – – – L* -0.65 -0.89 -0.98 1.00 – – – – – – – – a a EC -0.51 -0.76 -0.81 0.87 1.00 – – – – – – – – * -0.54 -0.81 -0.87 0.92 0.95 1.00 – – – – – – – Cu 0.66 0.78 0.51 -0.80 -0.04 0.08 1.00 – – – – – – Mn 0.59 0.77 0.77 -0.82 -0.89 -0.84 -0.08 1.00 – – – – – Fe 0.64 0.90 0.99 -0.95 -0.72 -0.81 -0.62 0.69 1.00 – – – – Zn 0.64 0.91 1.00 -0.99 -0.83 -0.90 -0.47 0.80 0.98 1.00 – – – Pb 0.64 0.74 0.89 -0.91 -0.85 -0.90 -0.25 0.70 0.84 0.89 1.00 – – Cd 0.66 0.70 0.87 -0.87 -0.75 -0.82 -0.32 0.58 0.85 0.86 0.92 1.00 – EC 0.66 0.90 0.98 -0.97 -0.81 -0.88 0.88 0.79 0.96 0.98 0.88 0.85 1.00 * b a EC= Electrical Conductivity a The L*, a*, b* values obtained for three different varieties of honeys are shown in Table 1. According to L* values, Gonzalez-Miret et al. [2005] classified honey into two groups: light honey with L*>50 and the dark honey with L*<50. On the basis of this classification, the pine honeydew was placed in group of dark category while acacia and multifloral honey in light category. It is evident from the Table 1 that acacia honey (61.43) and multifloral floral (54.64) honeys showed higher L* values than pine honeydew (15.49). It established that acacia honey and multifloral floral were of light colour while pine honeydew was of dark colour. In all the honey samples from three varieties of honey, a* values were ranged from 2.25 to 4.94 while b* values from 5.28 to 12.37. These values were helpful in concluding that all the honey samples possessed both red and yellow components. Similar results were reported for Slovak honeys [Kasperova et al., 2012]. The diastase activity, indicator of high temperature exposure of the analysed samples ranged from 14.93 DN (multifloral honey) to 25.99 DN (pine honeydew) (Table 1). All the honey samples showed the values within the Codex Standard i.e. more than 8 DN. Similar results were published by Meda et al. [2005] for Burkina Fasan honey, and by Saric et al. [2008] for Croatian honeys. The presence of high diastase number in the analysed samples might be due to moderate climate of Kashmir valley. According to the Codex standard, invertase number, indicator of honey freshness, should be more than 4. The invertase number ranged from 9.40 IN (acacia honey) to 15.83 IN (pine honeydew). Thus both IN were >4 and DN>8 which determined that all honey samples were fresh and unprocessed. Our results were consistent with reported results of Hasan et al. [2013] for Iraqi honeys and Dinkov et al. [2014] for acacia, sunflower and tilia honeys. All the honey samples had a high proline content ranging from 268.05 to 570.95 mg/kg (Table 1) thus could be considered as ripened and unadulterated ones. Similar results were published for Algerian honeys, Malaysian honeys and Indian honeys [Ouchemoukh et al., 2007; Saxena et al., 2010]. The total reducing sugars value in the analysed samples ranged from 60.6 to 72.81% (Table 1), which is in agreement with the standards proposed by EU Directive 2001/110, which should be more than 60% for blossom honeys and at least 45% for honeydew honey. Similar results were reported by Khalil et al. [2012] for Algerian blossom honeys. Mineral analysis The minerals found in the analysed honey samples are expressed in Table 2. Statistically significant differences (p<0.05) were observed among all analysed samples. Copper (Cu) content was found highest in multifloral honey (0.38 mg/kg) and lowest in both acacia honey and pine hon- 105 G.A. Nayik & V. Nanda eydew (0.12 mg/kg). The analysed honey varieties showed low concentration of Cu as compared to honey studied by Conti et al. [2007], Nanda et al. [2009] and Kamboj et al. [2013], but similar concentration of copper was found in Brazilian honey [Liberato et al., [2013]. The manganese (Mn) concentration of all analysed samples ranged from 0.95 mg/kg to 1.08 mg/kg with highest concentration in pine honeydew (1.08 mg/kg). Similar findings were reported by Nanda et al. [2009]. Among the other minerals, iron (Fe) content was found in higher concentration in all samples with highest value in pine honeydew (2.11 mg/kg) and lowest in multifloral honey (1.26 mg/kg). The concentrations of zinc (Zn), lead (Pb) and cadmium (Cd) were found very low (<1mg/kg) except zinc in pine honeydew (1.04 mg/kg) (Table 2). The results for Mn, Fe, Zn, Pb and Cd were in agreement with those reported by Liberato et al. [2013] for Brazilian honey of Apis mellifera from different floral origins. The mineral content of the honey depends on geographical area, climatic conditions and soil type of the floral source. It was reported that soil in Kashmir valley of India did not contain high amount of minerals like Cu, Fe, Zn and Co [Bhat et al., 2011; Yatoo et al., 2011] which might be the reason of low level of mineral content in the studied samples of honey varieties. Strong and positive correlations were found between all minerals and colour (pfund) while strong negative correlations with L* value, which indicated that honey with dark colour contained high amount of ions (Table 3). All minerals also showed strong positive correlation with electrical conductivity and ash, which demonstrated that higher mineral content, resulted in higher ash content and electrical conductivity. A positive correlation was also found among all minerals, electrical conductivity and pH (Table 3), which showed that both pH and conductivity were dependent on the amount of ions in honey. Similar correlations were observed by Acquarone et al. [2006] between total mineral content and electrical conductivity. Multivariate analysis In our study, the PCA was applied to achieve a reduction of original data matrix while retaining the maximum amount of variability present in data. The factor loading obtained for the first three components (PCs) and the percentage of variance along with cumulative variance is shown in Table 4. The first three principal components accounted for 86.92% of the variance in the honey samples analysed. The first, second and third principal components (PC1, PC2, and PC3) explained 65.72%, 16.26% and 4.93% of the variance, respectively (Table 4). According to loading matrix (Table 5), it was observed that 65.72% variability explained by PC1 was positively correlated with variables viz. colour intensity, colour (mmpfund), iron, zinc, proline, electrical conductivity and negatively with colour L*, a* and b* values (Figure 1) which could be specified as indicators of colour and minerals. Thus such variables could be used to distinguish pine honeydew from acacia honey. Figure 1 also illustrated that all acacia samples located on the left side of PC1 were linked to L*, a* and b* values while all pine honeydew samples positioned on its upright were linked to minerals and electrical conductivity. The second component (PC2=16.26%) was positively corre- TABLE 4. Principal component analysis Total variance explained PC Initial Eigen values % of variance Cumulative % 1 15.77 65.72 65.72 2 3.90 16.26 81.98 3 1.18 4.93 86.92 TABLE 5. Principal component analysis. Loading of the first three components. Principal components Factor loading 1 2 3 pH 0.660 -0.014 0.424 Moisture -0.657 0.481 -0.163 Total solids 0.657 -0.481 0.163 Color Intensity 0.994 -0.027 -0.048 Total soluble solids 0.333 -0.317 0.700 HMF -0.479 0.840 0.111 Ash 0.903 0.042 -0.137 Titrable acidity 0.923 -0.082 0.092 Color (mmpfund) 0.993 0.034 -0.043 Water activity -0.279 0.912 0.192 Color (L*) -0.978 -0.159 0.025 Color (a*) -0.746 -0.577 0.026 Color (b ) -0.872 -0.440 -0.008 Cu -0.524 0.782 0.104 Mn 0.746 0.490 -0.245 Fe 0.985 -0.102 -0.063 Zn 0.990 0.078 -0.075 Pb 0.901 0.258 0.208 Cd 0.880 0.130 0.250 Diastase number 0.934 0.000 -0.080 Invertase number 0.674 0.435 -0.069 Proline 0.994 -0.002 -0.053 Reducing sugar 0.658 -0.307 -0.420 Electrical conductivity 0.978 0.072 -0.036 * lated with water activity and HMF, which could be interpreted as an indicator of the maturity of honey. Such variables could be used to distinguish multifloral honey from acacia honey and pine honeydew. The third component with less contribution (PC3=4.93%) was positively correlated with TSS and pH but negatively with reducing sugar. Similar results were reported by Kadar et al. [2010] for colour (mmpfund), CIE L* a* b* and conductivity, while Saric et al. [2008] published simi- 106 Quality Characterization of Honey from Kashmir 0.0 0.5 4 0.6 0.4 2 PC 2: 16.26% 0.2 0 0.0 - 0.2 -2 - 0.4 - 0.6 -4 0 5 PC 1: 65.72% FIGURE 1. Projections of the variables on the factor plane for the three honeys (Botanical origins: A: Acacia, PH: Pine Honeydew, MF: Multifloral). TABLE 6. Classification result of LDA of variables in three types of honeys. From/to Acacia honey Pine honeydew Multifloral honey Total % Correct Acacia honey 10 0 0 10 100.00 Pine honeydew 0 10 0 10 100.00 Multifloral honey 0 0 10 10 100.00 Total 10 10 10 30 100.00 lar results on Croatian honey varieties from three harvesting seasons in which he concluded that in all seasons PC1 was mainly dominated by conductivity, proline and diastase number. Similar results for HMF were obtained by Isopescu et al. [2014] for Romanian honeys. As shown in Figure 1, a natural separation between honeys of different botanical origin was obtained. All the three analysed honey samples from different botanical origins were correctly classified (100%) by using LDA (Table 6). CONCLUSION The analysed three honey varieties from Kashmir valley of India revealed that floral origin significantly affects all the physico-chemical parameters, enzymatic properties, mineral content and colour characteristics except total solids. The concentration of minerals found in all three honey varieties was low as compared to other varieties of honey of Indian origin. Application of multivariate techniques confirmed the validity of physico-chemical analysis as a tool for classifi- cation and characterization of honey obtained from different botanical sources. PCA revealed 86.92% of the variance with the first three principal components with minerals, colour and electrical conductivity dominating variables. LDA proved to be an effective tool which classified the all honey samples 100% correctly. ACKNOWLEDGEMENTS The first author is very much thankful UGC New Delhi India for providing financial assistance in the form of MANF2013–14 and also to local beekeepers of Kashmir valley of India for providing raw honey samples. REFERENCES 1. Acquarone C., Buera P., Elizalde B., Pattern of pH and electrical conductivity upon honey dilution as a complementary tool for discriminating geographical origin of honeys. Food Chem., 2006, 101, 695–703. G.A. Nayik & V. Nanda 2. Ahmed J., Prabhu S.T., Raghavan G.S.V., Ngadi M., Physicochemical, rheological, calometric and dielectric behavior of selected Indian honey. J. Food. Eng., 2007, 79, 1207–1213. 3. AOAC., Official Method of Analysis of the Association of the Analytical Chemists. 2012. 4. Azeredo L.C., Azeredo M.A.A., Souza S.R., Dutra V.M.L., Protein contents and physicochemical properties in honey samples of Apis mellifera of different floral origins. Food Chem., 2003, 80, 249–254. 5. Beretta G., Granata P., Ferrero M., Orioli M., Facino R.M., Standardization of antioxidant properties of honey by a combination of spectrophotometric/ fluorimetric assays and chemometrics. Anal. Chim. Acta., 2005, 533, 185–191. 6. Bhat M.S., Shaheen M., Zaman R., Muhee A., Mineral Inter-Relationship among soil, forage and dairy cattle in Kashmir India. Vet. World., 2011, 4, 550–553. 7. Blasa M., Candiracci M., Accorsi A., Piacentini M.P., Albertini M.C., Piatti E., Raw Millefiori honey is packed full of antioxidants. Food Chem., 2006, 97, 217–222. 8. Bouseta A., Scheirman V., Collin S., Flavor and free amino acid composition of lavender and eucalyptus honeys. J. Food Sci., 1996, 61, 683–694. 9. Chudzinska M., Baralkiewicz D., Estimation of honey authenticity by multielements characteristics using inductively coupled plasma-mass spectrometry (ICP-MS) combined with chemometrics. Food Chem. Toxicol., 2010, 48, 284–290. 10. Codex Alimentarius Commission., Revised standards for honey. Codex Standard 12–1981. Rev 1 (1987), Rev 2 (2001), Rome: FAO. 11. Conti M.E., Stripekis J., Campanella L., Cucina D., Tudino M.B., Characterization of Italian honeys (Marche Region) on the basis of their mineral content and some typical quality parameters. Chem. Cent. J., 2007, 1, 1–14. 12. Devillers J., Dore J.C., Marenco M., Poirier-Duchene F., Galand N., Viel C., Chemometrical analysis of 18 metallic and non metallic elements found in honeys sold in France. J. Sci. Food. Agric., 2002, 50, 5998–6007. 13. Dinkov D.H., Quality parameters of Bulgarian kinds of bee honey. Mac. Vet. Rev., 2014, 37, 35–41. 14. Duman A., Sezer C., Oral N.B., Kars’ta Satis a Sunulan Suzme Ballarin Kalite Niteliklerinin Aras tirilmasi. Kafkas Universitesi Veteriner Fakultesi Dergisi. 2008, 14, 89–94. 15. Escuredo O., Fernandez-Gonzalez M., Carmen S.M., Differentiation of blossom honey and honeydew honey from Northwest Spain. Agriculture., 2012, 2, 25–37. 16. Finola M.S., Lasagno M.C., Marioli J.M., Microbiological and chemical characterization of honeys from central Argentina. Food Chem., 2007, 100, 1649–1653. 17. Fredes C., Montenegro G., Heavy metal and other trace elements contents in honey bee in Chile. Ciencia e investigacion agrarian., 2006, 33, 50–58. 18. Gheldof N., Wang X.H., Engeseth N.J., Identification and quantification of antioxidant components of honeys from various floral sources. J. Agric. Food Chem., 2002, 50, 5870–5877. 19. Gonzalez-Miret M.L., Terrab A., Hernanz D., Fernandez-Recamales M.A., Heredia F.J., Multivariate correlation between colour and mineral composition of honeys and by their botanical origin. J. Agric. Food Chem., 2005, 53, 2575–2580. 107 20. Hasan S.H., Effect of storage and processing temperature on honey quality. J. Babylon Univ. Pure Appl. Sci., 2013, 21, 2244– –2253. 21. International Honey Commission., Harmonized methods of the International Honey Commission. 2009. URL: http:// www.bee-hexagon.net/en/network.htm. Accessed 14–02–2013. 22. Isopescu R.D., Josceanu A.M., Minca I., Colta T., Postelnicescu P., Mateescu C., Characterization of Romanian honey based on physicochemical properties and multivariate analysis. Revista de Chimie –Bucharest., 2014, 65, 381–385. 23. Juszczak L., Socha R., Roznowski J., Fortuna T., Nalepka K., Physicochemical properties and quality parameters of herbhoneys. Food Chem., 2009, 113, 538–542. 24. Kadar M., Juan-Borras M., Hellebrandova M., Domenech E., Escriche I., Differentiation of Acacia, Sunflower and Tilia honeys from different countries based on sugar composition, physicochemical and colour parameters. Bulletin USAMV Agriculture., 2010, 67, 252–258. 25. Kamboj R., Bera B.M., Nanda V., Evaluation of physico-chemical properties, trace metal content and antioxidant activity of Indian honeys. Inter. J. Food Sci. Technol., 2013, 48, 578–587. 26. Karabagias I.K., Badeka A., Kontakos S., Karabournioti S., Kontominas M.G., Characterization and classification of Greek pine honeys according to their geographical origin based on volatiles, physicochemical parameters and chemometrics. Food Chem., 2014, 146, 548–557. 27. Kasperova J., Nagy J., Popelka P., Dicakova Z., Nagyova, A., Mala P., Physico-chemical indicators and identification of selected Slovak honeys based on colour measurement. Acta. Vet. Scand., 2012, 81, 57–61. 28. Khalil M.I., Moniruzzaman M., Boukraa L., Benhanifia M., Islam M.A., Islam M.N., Sulaiman S.A., Gan S.H., Physicochemical and antioxidant properties of Algerian honey. Molecules, 2012, 17, 11199–11215. 29. Lazaridou A., Biliaderis C.G., Bacandritsos N., Sabatini A.G., Composition, thermal and rheological behaviour of selected Greek honeys. J. Food Eng., 2004, 64, 9–21. 30. Liberato M.T.C., Morais S.M., Magalhaes C.E.C., Magalhaes I.L., Cavalcanti D.B., Silva M.M.O., Physico-chemical properties, mineral, and protein content of honey samples from Ceara state, Northeastern Brazil. Food Sci. Technol. (Campas), 2013, 33, 38–46. 31. Louveaux J., Maurizio A., Vorwohl G., Methods of melissopalynology. Bee World, 1978, 59, 139–157. 32. Marghitas L.A., Dezmirean D., Adela M., Otilia B., Laura L., Stefan B., Physicochemical and bioactive properties of different floral origin honeys from Romania. Food Chem., 2009, 112, 863–867. 33. Mateo R., Bosch-Reig F., Classification of Spanish unifloral honeys by discriminant analysis of electrical conductivity, colour, water content, sugars, and pH. J. Agric. Food Chem., 1998, 46, 393–400. 34. Meda A., Lamien C.E., Romito M., Millogo J., Nacoulma O.G., Determination of the total phenolic, flavonoid and proline contents in Burkina Fasan honey, as well as their radical scavenging activity. Food Chem., 2005, 91, 571–577. 35. Nanda V., Bera M.B., Bakhshi A.K., Optimization of process parameters to establish the quality attributes of hydroxymethylfurfural content and diastatic activity of sunflower (Helianthus 108 36. 37. 38. 39. 40. 41. 42. 43. annus) honey using response surface methodology. Eur. Food Res. Technol., 2006, 222, 64–70. Nanda V., Sarkar B., Sharma H., Bawa A., Physico-chemical properties and estimation of mineral content in honey produced from different plants in Northern India. J. Food Comp. Anal., 2003, 16, 613–619. Nanda V., Singh B., Kukerja V.K., Bawa A.S., Characterization of honey produced from different fruit plants of northern India. Inter. J. Food Sci. Technol., 2009, 44, 2629–2636. Nayik G.A., Nanda V., Characterization of the volatile profile of unifloral honey from Kashmir valley of India by using solidphase microextraction and gas chromatography–mass spectrometry. Eur. Food Res. Technol., 2015, In Press, Accepted Manuscript, DOI: 10.1007/s00217–015–2413–2. Ouchemoukh S., Louaileche H., Schweitzer P., Physico-chemical characteristics and pollen spectrum of some Algerian honeys. Food Contr., 2007, 18, 52–58. Pan J.Z., Ji C.Y., General rheological model for natural honeys in China. J. Food Eng., 1998, 36, 165–168. Press Information Bureau, Government of India. URL: http://pib. nic.in/newsite/erelease.aspx?relid=96239. Accessed 23–12–2013. Saric G., Matkovic D., Hruskar M., Vahcic N., Characterization and classification of Croatian honey by physicochemical parameters. Food Technol. Biotechnol., 2008, 46, 355–367. Saxena S., Gautam S., Sharma A., Physical, biochemical and antioxidant properties of some Indian honeys. Food Chem., 2010, 118, 391–397. Quality Characterization of Honey from Kashmir 44. Soria A.C., Gonzalez M., De Lorenzo C., Martinez-Castro I., Sanz J., Characterization of artisanal honeys from Madrid (Central Spain) on the basis of their melissopalynological, physicochemical and volatile composition data. Food Chem., 2004, 85, 121–130. 45. Terrab A., Escudero M.L., Gonzalez-Miret M.L., Heredia F.J., Colour characteristics of honeys as induced by pollen grain content: A multivariate study. J. Sci. Food Agric., 2004, 84, 380–396 46. Terrab A., Valdes B., Diez D.M.J., Pollen analysis of honey from the Gharb region (NW Morocco). Grana., 2001, 40, 210–216. 47. Tosi E., Ciappini M., Re E., Lucero H., Honey thermal treatment effects on hydroxymethylfurfural content. Food Chem., 2002, 77, 71–74. 48. USDA: United States Standards for Grades of Extracted Honey., USDA. Washington DC Agricultural Marketing Service, 1985. 49. White J.W., Instrumental colour classification of honey: Collaborative study. J. AOAC, 1984, 67, 1129–1131. 50. Yatoo M.I., Devi S., Kumar P., Tiwari R., Sharma M.C., Soil plant- animal micro mineral status and their interrelation in Kashmir valley. Indian J. Anim. Sci., 2011, 81, 628–630. 51. Yilmaz H., Kufrevioglu I., Composition of honeys from eastern and southern Anatolia and effect of storage on hydroxymethylfurfural content and diastase activity. Turk. J. Agric. For., 2000, 25, 347–349. Submitted: 29 September 2014. Revised: 3 February 2015. Accepted: 13 February 2015. Published on-line: 15 April 2015. Pol. J. Food Nutr. Sci., 2015, Vol. 65, No. 2, pp. 109–118 DOI: 10.2478/pjfns-2013-0012 http://journal.pan.olsztyn.pl Original article Section: Food Technology Spray Drying of Honey: The Effect of Drying Agents on Powder Properties Katarzyna Samborska*, Paulina Gajek, Anna Kamińska-Dwórznicka Department of Food Engineering and Process Management, Warsaw University of Life Sciences (WULS-SGGW), Faculty of Food Sciences, Nowoursynowska 159c, 02–776 Warsaw, Poland Key words: maltodextrin, gum Arabic, hygroscopicity, bulk density, apparent density, wettability The aim of this study was to investigate the possibility of honey spray drying with addition of maltodextrin and gum Arabic as drying agents. The influence of the concentration of the solution subjected to drying, the type and content of the drying agents upon the physical properties of obtained powders was examined. An attempt was undertaken to obtain powder with a honey content of more than 50% d.b. Spray drying of multifloral honey with the addition of maltodextrin and gum Arabic was carried out at inlet air temperature of 180°C, feed rate of 1 mL/s and rotational speed of a disc atomizer of 39,000 rpm. The properties of obtained powders were quantified in terms of moisture content, bulk density, Hausner ratio, apparent density, hygroscopicity and wettability. Using gum Arabic it was possible to obtain a product with a higher content of honey (67% solids) than in the case of maltodextrin (50% d.b.). However, the powders obtained with gum Arabic were characterised by worse physical properties: higher hygroscopicity and cohesion, and longer wetting time. INTRODUCTION Honey is consumed because of its unique taste and aroma as well as its numerous health-promoting properties. The treatment involving bee products constitutes a science-based branch of medicine referred to as Apitherapy [Alvarez-Suarez et al., 2010]. However, honey in its natural form has several disadvantages as a result of high viscosity and density which cause difficulties in transportation and dosage [Cui et al., 2008; Hebbar et al., 2008]. It can also change its properties as a result of crystallization, which may contribute to the development of osmophile yeast and fermentation [Bhandari et al., 1999; Hebbar et al., 2008]. The use of powdered honey significantly reduces these problems. Honey powder, like powders formed after drying of fruit juices, may be intended for direct consumption, used as an additive to a range of food products such as yoghurts, drinks, sauces, edible coatings, as well as dietary supplements and therapysupporting preparations [Rodriguez-Hernandez et al., 2005; Gabas et al., 2007; Shrestha et al., 2007; Hebbar et al., 2008]. Production of honey dry powder is, however, difficult mainly due to the high content of sugars and organic acids [Truong et al., 2005; Rodriguez-Hernandez et al., 2005; Zareifard et al., 2012; Murugesan & Orsat, 2012]. These substances are characterised by low glass transition temperature Tg. At Tg the form of the components changes from the hard, brittle “glass” material of a very high viscosity (about 1012 Pa×s) * Corresponding Author: Tel. +48 22 59 37 569; Fax: +48 22 59 37 576 E-mail: [email protected] (Katarzyna Samborska) into the soft visco-elastic “rubbery” material with viscosity of about 106–108 Pa×s [Williams et al., 1955; Bhanardi & Howes, 1999; Shrestha et al., 2007]. The temperature at which this transformation occurs is characteristic for each substance and, for substances from the same group, increases with the molecular weight. In honey, particularly important is the high content of fructose and glucose because of low Tg values: 10°C (fructose) and 36ºC (glucose) [Papadakis et al., 2006; Sahu, 2008]. Juszczak & Fortuna [2006] report the Tg value of multifloral Polish honey at -50.7ºC (moisture content 17.7 % d.b.). According to other researchers [Lazaridou et al., 2004], this value is -37.2°C in the case of the Greek multifloral honey (moisture content 14.1 % d.b.), and between -33.6 and -51.1°C in the Indian nectar honey from different plant species (total solids from 76 to 88% d.b.) [Ahmed et al., 2007]. The form in which the material occurs during spray drying results from the relationship between product temperature Tp and the temperature of glass transition Tg. [Noel et al., 1990]. The amorphous material has to appear in a glassy form in order to obtain a free-flowing powder. These relationships are shown in Figure 1 [Samborska et al., 2011]. During spray drying of the material with a high content of sugars, material temperature in the drying chamber Tp1 is usually higher than the glass transition temperature Tg1. As a result, the material exists in the visco-elastic rubbery state, namely in the form of syrup or sticky particles adhering to the walls of the chamber. Drying such a material into a powder form is not possible [Bhanardi & Howes, 1999; Adhikari et al., 2003; Hebbar et al., 2008]. To enable the drying of this kind of material it is necessary to modify the pa- © Copyright by Institute of Animal Reproduction and Food Research of the Polish Academy of Sciences © 2015 Author(s). This is an open access article licensed under the Creative Commons Attribution-NonCommercial-NoDerivs License (http://creativecommons.org/licenses/by-nc-nd/3.0/). 110 Honey Spray Drying GUM GUM Tg2 Tp1 GLASS Tp2 GLASS Tg1 FIGURE. 1. The influence of product temperature (Tp) and glass transition temperature (Tg) on the state of material during spray drying (descriptions in the text) [Samborska et al., 2011]. rameters of drying or to prepare the material in such a way that Tg>Tp. At the glass transition temperature Tg1 the material will occur in the glassy state during drying if its temperature does not exceed the Tp2. In practice this is difficult to achieve due to a low value of Tg1. The second option is to modify the composition of the material in a way to retain the temperature Tp1 and achieve a higher value of glass transition temperature Tg2 (where Tg2>Tp1). The way to increase the glass transition temperature of a material subjected to drying is to add substances such as starch, maltodextrin or gum Arabic [Truong et al., 2004; Gabas et al., 2007; Sahu, 2008; Jittanit et al., 2010]. The available literature contains a few examples regarding the drying of honey and usually authors do not present the physical properties of honey powders, so in a current paper the results are compared and discussed also with the results regarding spray dried fruit juices. In most cases, the produced dried honey preparations contain up to 50% of honey in solid material. Cui et al. [2008] suggested a method of a microwave-vacuum drying of honey. The authors found that the best parameters for drying, resulting in the material with a water content of 3%, was the pressure of 30 mbar and film thickness below 8 mm. The content of sugars and aromatic substances remained unchanged after the drying process. Unfortunately, the authors did not specify the physical properties of the resultant product. Because of layer drying, it can be hypothesised that the final form of the material resembled hard solidified blocks rather than powder, which is not a beneficial form for further trade and use. Sahu [2008] vacuum dried liquid honey with three additives (maltodextrin, glycerol monostreate, tricalcium phosphate at different concentrations), spreading the mixes to a thickness of 3 mm. Vacuum (710–750 mm Hg) and temperature of 70°C were applied. Powder form was obtained by grounding in a hammer mill. Powders hygroscopicity (values between 4.32 and 12.3%) increased by decreasing the amount of maltodextrin and increased by increasing glycerol monostearate and tricalcium phosphate. There was a decrease in degree of caking with an increase in the amount of all the three ingredients. A beneficial form of dried honey may be obtained after spray drying with the addition of suitable drying agents [Hebbar et al., 2008; Sahu, 2008; Samborska & Czelejewska, 2014; Samborska & Bieńkowska, 2013]. Spray drying is a method which, in addition to removing water (its primary objective), also allows the micro-encapsulation of substances vulnerable to external conditions, and there are many such biologically-active compounds present in honey. However, it is necessary to minimise the addition of drying agents so that the product is as close to natural honey as possible. Yoshihide & Hideaki [1993] spray dried honey with the addition of antioxidants, carriers, partial dispersants, and dispersants, adjusting feed pH between 6.5–7.5 in order to reduce the thermoplasticity of sugary material during drying. Inlet and outlet air temperatures were between 120 and 200°C and between 70 and 120°C, respectively. The powder with the honey content of about 50% d.b. had good physical properties, pleasant flavour and taste. Samborska & Czelejewska [2014] used Arabic gum as a drying agent (honey solids: carrier solids, 1:1) and obtained powders of good physical properties: low water content and medium or good flowability. Samborska & Bieńkowska [2013] characterised the properties of spray dried honey preparations produced with the use of maltodextrin and dextrin as drying additives – those obtained with dextrin had higher hygroscopicity and worse solubility than those produced with maltodextrin. Takashi [1984] spray dried honey with the use of waxy starch as a carrier material at inlet temperature between 140 and 150°C (outlet 90–95°C). The resultant powder of final honey content less than 50% had a tendency to melt when exposed to air, hence the use of high barrier packaging materials was suggested. Hebbar et al. [2002] developed an improved method for the production of spray dried honey powder of honey content <52% solids, characteristic honey flavour, acceptable colour and of a free-flowing properties. Additives such as dextrin, maltose, and anticaking agent were used. Inlet and outlet temperatures (115–125°C and 80–85°C respectively) were lower than the conditions employed in the studies described above. The aim of this study was to investigate the possibility of honey spray drying with the addition of maltodextrin and gum Arabic as processing agents. The impact of the concentration of the solution subjected to drying, the kind and content of the drying agent material upon the physical properties of resultant powders was examined. An attempt was also made to produce honey powder with a honey content of more than 50% d.b. MATERIALS AND METHODS Materials and preparation Multifloral honey obtained directly from a local bee-keeper with a total solid mass concentration of 79.0±0.1% d.b. (water content 19.6±0.1% w/w) was used in the study. Maltodextrin 10 DE (MD, Peppees, Poland) and gum Arabic (GA, Hortimex, Poland) were used as drying agents. Experimental plan for spray drying of honey with maltodextrin, gum Arabic and the mixture of both drying agents is presented in Table 1. 111 K. Samborska et al. Taking into account the solids content of honey and drying agents powders, 500 mL of solutions with the desired total solids concentration and the desired ratio of honey solids/ drying agent solids were prepared. To obtain desired values it was necessary to dilute honey with water. The total concentration of solids in the solutions was 20 and 30% d.b.. The ratio of honey solids/MD solids was 1:2 and 1:1 (honey content 33 and 50% d.b.), while with the use of GA the ratio of honey solids/drying agent solids was 1:1 and 2:1 (honey content 50 and 66% d.b.). These values were selected in a preliminary study as the ratios at which it is possible to dry honey/drying agent/water solution, different for each additive substance. Additional experiments were also performed with the mixture of both drying agents MD+GA (1:1): total concentration of solids in the solutions was 20 and 30% d.b, ratio of honey solids/drying agent solids 1:1. Two runs were performed for each sample. Viscosity analysis Measurements were carried out on 16 mL samples using BROOKFIELD digital rheometer model DV-III (Brookfield Engineering Laboratories Inc., USA) in a range of shear stress corresponding to shear rates from 0 to 200 s-1. The rheometer was equipped with a spindle type ULA that rotated in the sample-containing chamber at 25°C. All viscosity measurements, expressed in mPa×s, were performed in duplicate and averaged. Spray drying The drying was performed in a laboratory spray dryer Lab S1 (Anhydro, Denmark) with 1 m internal diameter, equipped with a rotating disc, using the following process parameters: inlet air temperature 180°C, raw material feed rate 1 mL/s, the rotational speed of a disc atomizer 39,000 rpm. During drying, the inlet and outlet air temperature was controlled and both values remained constant. Powder analysis Moisture content Duplicate powder samples (approximately 1 g each) were dried at 105°C for 4 h [Chegini & Ghobadian, 2005]. The change in weight after treatment caused by water loss was expressed in percent by weight. The average of duplicate samples was calculated. Bulk density The powder loose (dl) and tapped (dt) bulk densities were measured using an automatic tapper STAV 2003 (Engelsmann AG, Germany) by determining the volume occupied by 100 g of powder (tapped density after 100 taps). Cohesiveness Cohesiveness of the powders was evaluated based on Hausner ratio (HR), calculated from the loose (db) and tapped (dt) densities of the powder: HR = dt/dl. Apparent particle density Apparent density of the spray dried powders was analysed using helium pycnometer Stereopycnometer (Quantachrome Instruments, USA). The pycnometric particle den- sity was determined by measuring the volume occupied by a known mass of powder which is equivalent to the volume of displaced helium gas. Hygroscopicity Approximately 1 g samples of powder were placed in a desiccator under the following conditions: 25°C and 75% relative humidity (saturated NaCl solution) [Greenspan, 1977]. The gain in weight of the samples was measured during 2 h in 30 min intervals. Hygroscopicity has been expressed as the amount of water adsorbed by 100 grams of powder [Goula & Adamopoulos, 2010]. Wettability Wettability was determined according to Jinapong et al. [2008] with some modifications. 100 mL of distilled water was poured into 800 mL beaker. A glass funnel was placed inside the beaker, with the height between the bottom of the funnel and the water surface of 100 mm. The lower opening of the funnel with the diameter of 40 mm was blocked by a test tube. The powder sample (10 g) was placed around the test tube and then the tube was lifted while the stop watch was started at the same time. The time necessary to wet all powder particles was recorded (visually assessed as when all the powder particles penetrated the surface of the water). All analyses were performed in duplicate immediately after drying and the averages of these measurements were recorded. Statistical methods Analysis of variance was performed in order to determine whether the differences between obtained values were statistically significant. If the P-value of the F-test was less than 0.05, there was a statistically significant difference between the means at the 95.0% confidence level. To determine which means are significantly different from others the Multiple Range Tests were performed. RESULTS AND DISCUSSION Viscosity Viscosity measurements showed that all the feed solutions followed a Newtonian behaviour, no shear-thickening or shear-thinning effects were observed under the applied measurement conditions (25°C, spindle type ULA, range of shear stress corresponding to shear rates from 0 to 200 s-1). The estimated viscosity values ranged from 1.9 to 50.4 mPa×s, and were higher for GA mixtures than MD at the same concentration (Table 1). Solutions of lower solid concentration and higher honey content had lower viscosity. In most of the published papers, honeys are reported to be Newtonian fluids [Bhanardi et al., 1999]. Popek [2002] presented the dynamic viscosity of aqueous 20% solutions of honeys belonging to the variety types: the values varied between 1.525 and 1.755 mPa×s. It is also generally recognized that dispersions of maltodextrin and gum Arabic are Newtonian in nature at concentrations of >10% [Meer, 1980; Dokic et al., 1998; Mothe & Rao, 1999]. In the work presented by Shi et al. [2013], an increase in MD total solid ratio in the feed solution (water/MD/Capilano Natural Australian 112 Honey Spray Drying honey solution) from 0 to 39.5% led to a negligible increase in viscosity from 6.00 to 8.00 mPa×s. Production of honey powder As described in the theoretical part, due to very low glass transition temperature of natural honey, the spray drying of honey without any additives is impossible. The first drying agent used in order to facilitate the drying of honey through increasing Tg was 10 DE maltodextrin (MD). Based on literature data the experiments began with drying of an aqueous solution of honey and MD in which the ratio of solids derived from honey to the solids originating from the drying agent was 1:2 and the overall dry matter concentration was 30 and 20 % d.b. These dryings proceeded smoothly and once they had been completed a significant amount of powder was obtained directly in the cyclone. It was also possible to recover the remaining powder from the walls of the drying chamber. Next, the MD addition in relation to honey solids was reduced so that the honey/drying agent solids ratio was 1:1. After these dryings, the quantity of powder in the cyclone was much smaller, the main bulk was recovered after cleaning the walls of the chamber. Also much greater sticking of chamber walls occurred and this level of MD was considered minimal to obtain powdered honey. Similar observations were presented by Papadakis et al. [2006] who spray dried raisin juice concentrate with the addition of MD 21 DE, 12 DE and 6 DE. Decreasing the content of MD in relation to the honey solids led to the reduction in the recovery of feed solids in the produced powder. In case of maltodextrin 12 DE the minimum content of the drying agent was 50% d.b., like in the current study. Shrestha et al. [2007] presented a relationship between Tg and product recovery after spray drying of orange juice with MD 6 DE. An increase in MD level from 50 to 60 parts resulted in a significant increase in product recovery (from 22 up to 78%), which was also accompanied by a huge jump in Tg from 66.4 to 7.0-8.0 6.0-7.0 5.0-6.0 4.0-5.0 3.0-4.0 2.0-3.0 8.0 8.0 MD 7.0 Water content (%) 86.4ºC. The authors suggested that the maximum concentration of orange juice that can be dried in conjunction with MD (6 DE) is 40%. In the following experiments the drying tests were carried out with solutions of honey with GA. Tonon et al. [2009] and Telis & Martinez-Navarrete [2009] have presented the Tg of spray dried açai juice and grapefruit juice powder obtained with MD and GA. Values obtained with the use of GA were higher than with MD. Based on these data, suggesting better GA properties as an anti-sticky agent, it was decided to start experiments with the GA from 1:1 level of drying agent content in relation to honey solids. Observations of the drying process, the quantities of powder in the cyclone and the material remaining on the walls of the chamber confirmed these assumptions, because it looked similar to drying with the MD at the honey/drying agent ratio of 1:2. Subsequently, the honey content was increased in relation to GA content to the honey/drying agent ratio of 2:1. As in the case of MD, it resulted in a reduction of the obtained powder quantity and an increase of the material remaining on the chamber walls. However, in all cases the amount of powder was sufficient to carry out further analysis of their physical properties. To sum up, using GA it was possible to obtain a honey preparation with a higher content of honey (67% d.b.) than using MD (50% d.b.). Since the GA is more expensive than the MD, it was decided to carry out an experiment designed to replace part of the GA in a solution of MD, drying the samples containing honey, at MD and GA in the ratio of 2:1:1. Overall, the ratio of honey to the drying agent in these solutions was 1:1 and the overall concentration of dry substance was 30 and 20 g/100 g like before. The course of drying and the amount of powders obtained did not deviate from the samples dried using the GA in a 1:1 ratio to honey, which showed the feasibility of replacing parts of GA with MD without reducing the efficiency of the process. 6.0 6.0 5.0 5.0 4.0 4.0 3.0 3.0 2.0 30 1:2 Honey:MD 1:1 20 GA 7.0 lids ion So ntrat e nc (%) co 2.0 30 1:1 Honey:GA 2:1 20 lids ion So ntrat e nc (%) co FIGURE 2. Surface plot showing the effect of honey content and solids concentration on water content of powders obtained after spray drying of honey solution with maltodextrin (MD) and gum Arabic (GA). K. Samborska et al. Physical properties of produced powders Moisture content of powders Water content of the obtained powders ranged from 2.7 to 8.6% (Figure 2). The differences between the obtained values were statistically significant (Table 2). The derived values were typical for powders obtained by spray drying of materials such as: multifloral honey (3.8 to 5.5% of water) [Ram, 2011], multifloral and rape honey spray dried with GA (7.1 and 7.3% of water) [Samborska & Czelejewska, 2014], juice from passion fruit with the addition of a mixture of MD (10 DE) and lactose (2.4 to 9.4% of water) [RuizCabrera et al., 2009]. Vacuum dried honey powders obtained without the use of any additives had moisture contents values of 2.5% or less [Cui et al., 2008]. Powders obtained using the MD usually contained less water than those containing GA. For example, the water content in experiment 4 with the use of MD was 2.7% and after the change of drying agent into GA (experiment 6) it increased to 7.2%. This relationship was also confirmed in the case of the pairs of experiments 3 and 5, which also had the same quantitative composition of the dried solutions but a different drying agent. The difference in the water content between these variants was statistically significant. A similar relationship was shown by Telis & Martinez-Navarrete [2009] who examined the properties of freeze-dried grapefruit juice. The same authors and Gabas et al. [2007] who studied the sorption properties of vacuum dried pineapple pulp found that the water content in monolayer was higher in case of dried material without additives, and after adding GA it was higher than in case of MD. Gabas et al. [2007] found that the presence of additives in pineapple pulp probably modified the balance of hydrophilic/hydrophobic sites, promoting a smaller amount of sorbed water. In the current work, this phenomenon was also observed, because the amount of water in powders obtained with MD was lower than in case of GA. This relationship can be connected with the viscosity of feed solutions, which affects the size of droplets produced during atomization, and thus the drying rate: the higher the liquid viscosity the larger the droplets and powder particles [Masters, 1991; Tonon et al., 2008]. MD/honey solutions had usually lower viscosity than GA/honey solutions, so it can be assumed that the droplets were smaller, which could result in a higher drying rate leading to lower water contents in MD/honey powders. However, the correlation between the feed viscosity and water content was not always so clear, because the reduction of viscosity after decreasing of solid concentration from 30 to 20 g/100 g did not lead to the reduction of water content in the powders. Powders obtained using the same drying agent with the same weight ratio of honey to the drying agent had a very similar water content regardless of the concentration of dry substance in the solution. Most of the results were laid in pairs, which is also clearly seen in Figure 2 This dependence has also been confirmed by the statistical analysis – in most cases there was no statistically significant difference between the water content of powders obtained from solutions of the same weight ratio of honey to the drying agent but with different concentrations of dry substance in a solution designed for drying. 113 The water content of the powders depended on the ratio of drying agent to the honey solids and thus on the content of the drying agent in a dried solution. The higher the content of the drying agent in the solution the higher the final water content of the obtained powders (compare e.g. experiments 1 with 3 and 5 with 7) what can be connected with increased viscosity of feed solutions at increased drying agent content. Similar results were achieved by Tonon et al. [2008] who studied the spray dried açai (Euterpe oleracea Mart.) juice and by Papadakis et al. [2006] who spray dried raisin juice concentrate with the addition of MD. Goula & Adamopulus [2010] also found that the water content in the resulting powder increased along with an increasing MD content in the solution. This relationship was explained by the fact that for small water molecules it is difficult to diffuse through the larger maltodextrin molecules in the solution. Papadakis et al. [2006] spray dried a concentrated raisin juice at inlet air temperature of 110°C using the MD of varying dextrose equivalent (6 DE, 12 DE and 21 DE) and claimed that the maximum ratio of the content of the concentrated raisin juice to the added MD 6 DE was 67/33. Under these conditions, it was possible to obtain a stable powder with satisfactory physical properties. Powders obtained after drying with mixed drying agents were characterised by water content at a level equal to or higher than recorded in powders with GA at the content of 1:1 in relation to the honey. The water content of powder derived from a solution of 30% d.b. was significantly higher than that of a 20 % d.b. solution. Powders loose and tapped bulk density Loose bulk density of powders obtained with MD ranged from 0.33 to 0.55 g/cm3, with GA – from 0.31 to 0.47 g/cm3, and with MD+GA – from 0.47 to 0.58 g/cm3. Samborska & Bieńkowska [2013] after spray drying of multifloral honey with MD and dextrin reported loose bulk density of powders between 0.41 and 0.56 g/cm3, while in a study by Goula & Adamopoulos [2010] the bulk density of powders obtained after spray drying of orange juice with the addition of MD ranged from 0.14 to 0.41 g/cm3. The type of the drying agent had a significant impact on the bulk density of powders. Comparison of the samples with the same quantitative composition but different drying agent type (e.g. in the following pairs of experiments: 3,5 and 4,6) reveals that a lower bulk density was observed in those samples which were dried using GA in comparison to those dried with MD. As shown in the Table 1, GA/honey mixtures had higher viscosity than MD/honey, which could lead to the production of larger droplets and particles, and this parameter is known to be negatively correlated with the bulk density: as typically, bulk density increases upon particle size decrease [Goula & Adamopoulos, 2005; Grabowski et al., 2006]. In the case of powders dried using the same drying agent these results were correlated with water content, i.e. powders with lower water content had higher bulk density. Janiszewska et al. [2008] argued that the higher water content in powders causes their gathering into larger aggregations, which causes more empty voids between particles. This, in turn, results in a reduction of bulk density. 114 Differences in the loose density of powders with the same ratio of honey to the drying agent content but different initial concentrations of the solutions were not statistically significant. The relationship of honey to the drying agent had the greatest impact on the value of loose bulk density – the lesser drying agent (in terms of weight) to honey ratio in the dried solution, the higher the bulk density of powders. This relationship can be seen by comparing samples 1, 2 with samples 3, 4 (MD) or samples 5, 6 with 7, 8 (GA). According to Goula & Adamopoulos [2010], the more sticky nature of a powder is associated with a high bulk density, thus the powders of smaller drying agent content, being more sticky, are characterised by a higher bulk density. In addition, increasing the amount of a drying agent may cause increasing amounts of air trapped between the particles, which is associated with skin-forming properties of MD. Kwapinska & Zbicinski [2005] found that particles of material with skin-forming properties often contain air bubbles from raw materials or adsorbed during spraying. Therefore, the greater the content of the drying agent with air bubbles the lower the bulk density of powders. Results reported by Shrestha et al. [2007] also confirm this relationship – the powder obtained by spray drying of orange juice was characterised by increasing bulk density along with decreasing amount of drying agent. Goula & Adamopoulos [2010] observed that a loose bulk density is strongly linked to the water content of the powder. The higher the water content of the powder the more particles are combined into larger clusters resulting in voids occurring between them, which in turn results in a loose bulk density reduction. Results obtained in our study support this conclusion. Bulk density of powders obtained after drying using a mixture of drying agents was in homogenous group b (20% d.b.) and group c (30% d.b.), i.e. it remained at medium and high level. These values were similar to those obtained after drying with individual drying agents with their lower content in relation to honey – 1:1 ratio in the case of MD and 2:1 ratio in the case of GA. Cohesiveness Hausner ratio (HR) values of the produced powders ranged from 1.05 to 1.29 (Table 2). According to the classification given by Geldart et al. [1984], powders with HR values below 1.25 are referred to as free flowing with low cohesiveness, while powders with HR values within the range of 1.25– –1.4 are of average cohesiveness, and powders with HR higher than 1.4 are highly cohesive. Cohesiveness of powders determines their consistency and flow properties – the lower the cohesiveness the better the flowability of powders [Domian & Poszytek, 2005]. These results agree with previous studies on honey spray drying: Samborska et al. [2011] (multifloral honey with MD, HR value 1.26), and Samborska & Czelejewska [2014] (multifloral and rape honey with GA, HR values 1.29 and 1.24). The Hausner ratio depended significantly on the type of drying agent content and the weight ratio of honey to the drying agent in the dried solution. By comparing 1:1 samples obtained from MD with those 1:1 from GA both with 30 and 20% d.b., it can be concluded that the powders with MD were characterised by a Hausner ratio lower than that Honey Spray Drying TABLE. 1. Experimental plan for spray drying of honey with maltodextrin, gum Arabic and the mixture of both drying agents. Experiment 1 Honey/ Solids Drying agent: drying agent concentration MD, GA ratio (% d.b.) MD 1:2 30 Viscosity (mPa×s) 8.7±0.2d1 2 MD 1:2 20 2.2±0.3ab 3 MD 1:1 30 4.5±0.4bc 4 MD 1:1 20 1.9±0.4a 5 GA 1:1 30 50.4±0.9h 6 GA 1:1 20 13.2±0.5e 7 GA 2:1 30 23.8±0.3g 8 GA 2:1 20 5.0±0.3c 9 MD+GA (1:1) 1:1 30 19.1±1.7f 10 MD+GA (1:1) 1:1 20 4.1±0.1bc MD – maltodextrin, GA – gum Arabic with GA, which indicates their better flowability. Reduction of the drying agent content in dried solutions affected the HR reduction of powders obtained from both MD and GA, i.e. powders with a higher content of honey had better flowability. Two powders of the worst flowability were those obtained with the use of GA – honey/ drying agent ratio 1:1 (experiments 5 and 6) – HR value higher than 1.25 The concentration of solids in dried solutions had no significant effect on the Hausner ratio because most samples dried using the same drying agent (at the same weight ratio) were in the same homogeneous group regardless of the concentration of solids in the initial solution. On the basis of these results, it can be concluded that in terms of flowability the best powders were those obtained with the use of MD – honey/MD ratio 1:1 (experiments 3 and 4), followed by those obtained with the use of GA – honey/GA ratio 2:1 (experiments 7 and 8). Those were samples with a higher content of honey in dried solutions. The comparison of Hausner ratio values of the obtained powders with their other physical properties reveals a clear relationship between HR and water content in the powders. The comparison of powders with the same drying agent showed clearly that the greater the water content in the powders the higher was the Hausner ratio. The Hausner ratio was also correlated with loose bulk density of the powders. Higher loose bulk density of powder corresponded with a lower Hausner ratio. This indicates that the powders with higher loose bulk density were the ones with lower cohesiveness and better flowability. Powders obtained after drying using a mixture of drying agents in comparison to other powders were characterised by the average level of cohesiveness. However, the HR value below 1.25 indicated a low level of cohesiveness and good flowability of these powders. Hygroscopicity Hygroscopicity of the analysed powders was high and ranged from 65 to 145 g/100 g powder. Statistical analysis showed a division of values into three homogeneous groups. In the first group, with the lowest values of hygroscopicity, 115 K. Samborska et al. Experiment1 Outlet air temperature (°C) Water content (%) Loose bulk density dl (g/cm3) Tapped bulk density dt (g/cm3) Hausner Ratio HR Apparent density (g/cm3) Hygroscopicity (g/100 g) Wetting time (s) TABLE. 2. Outlet air temperature during drying and physical properties of dry product. 1 66.0±0.5 5.4±0.2c 0.33±0.01a 0.41±0.03a 1.24±0.03c 1.53±0.01de 85±4a 54±3b 2 67.0±0.7 5.4±0.1c 0.33±0.01a 0.38±0.02a 1.18±0.01b 1.45±0.01b 72±3a 57±2b 3 69.0±0.5 3.7±0.4 0.55±0.01 0.57±0.02 1.06±0.02 1.48±0.01 65±4 6±0a 4 71.0±0.5 2.7±0.2a 0.55±0.02c 0.57±0.04c 1.05±0.01a 1.41±0.02a 75±16a 4±0a 5 70.0±0.7 7.2±0.1 0.34±0.02 0.39±0.04 1.26±0.09 1.61±0.01 c 145±7 120±1c 6 72.0±0.7 7.2±0.3d 0.32±0.01a 0.43±0.04ab 1.29±0.04c 1.58±0.02fg 120±8b 120±1c 7 69.0±0.7 4.7±0.3 0.45±0.02 0.49±0.04 1.11±0.01 1.57±0.01 b 115±23 9±0a 8 69.0±0.7 5.0±0.1c 0.47±0.03b 0.54±0.04b 1.15±0.06b 1.55±0.01ef 122±13b 9±0a 9 70.0±1.4 8.6±0.4 0.58±0.01 0.70±0.01 1.20±0.04 1.50±0.01 130±7 5±0a 10 71.0±1.4 6.9±0.2d 0.56±0.05b 1.21±0.01b 1.50±0.01bc 132±14bc 17±0a b d c e c a b c 0.47±0.02b c a b c a c ab b bc g f cd a bc Experiments descriptions as presented in Table 1. a-g Means with the same superscript within same column are not significantly different (P<0.05). 1 were the powders obtained using MD. The powders produced with the addition of GA and GA + MD were enrolled into two consecutive groups characterised by significantly higher values of hygroscopicity. Hygroscopicity values obtained are much higher than in other studies regarding fruit powders. For example, Rodriguez-Hernandes et al. [2005], who spray dried cactus pear juice with the addition of 18 or 23% MD obtained the hygroscopicity of powders varying from 36.3 to 48.9% d.b. Goula & Adamopoulos [2010] analysed the powder obtained after spray drying of orange juice with the addition of MD 12 DE in a ratio of 1:1 and 1:4 (orange juice: MD) and obtained the hygroscopicity of 4.2–5.3 g/100 g of solids depending on the drying temperature. Values in the current study regarding powders obtained with the use of MD (65–85 g/100 g powder) are higher than those presented above, which may indicate much higher hygroscopicity of other ingredients of the powders derived from honey. Tonon et al. [2008] found that MD concentration was the variable which affected the hygroscopicity of açai powders produced by spray drying. The lowest hygroscopicity values were obtained when the highest MD concentrations were used and this correlated with the fact that MD is a material of low hygroscopicity. Rodriguez-Hernandes et al. [2005] observed the same relationship working with spray dried cactus pear juice. However, Papadakis et al. [2006] did not observe a clear pattern for the differences between the powders of spray dried raisin juice concentrate and different juice:MD ratios. In the current study, these differences were also statistically insignificant. Gabas et al. [2007] have investigated the water sorption properties of pineapple powder obtained by vacuum drying with the addition of MD and GA. The monolayer water content was of particular interest, since it could be taken as an indicator of the volume of water that can be strongly adsorbed to specific sites at the food surface. Samples containing MD resulted in the value of the monolayer moisture content Xm between 5.8 and 6.9% (dry basis), whereas samples with gum Arabic showed Xm between 6.7 and 7.9% (dry basis). Lower values of monolayer moisture content reported in the case of the powder containing MD indicate that this material was characterised by lower hygroscopicity than GA, which corresponds to the results shown in the present paper. Telis & Martinez-Navarrete [2009] studying the sorption properties of grapefruit juice powder also found that for samples with additives the Xm values were lower than for pure grapefruit juice, being also lower for samples with MD than with GA. According to Perez-Alonso et al. [2006], this phenomenon is attributed to a combination of factors such as the conformation and topology of molecule and the hydrophilic/hydrophobic sites adsorbed at the interface. Hygroscopicity of powders obtained through drying with MD+GA was at the same level as for the powders obtained with GA. Apparent (absolute) density Apparent (absolute) density of the obtained powders ranged from 1.41 to 1.61 g/cm3 (Figure 3). Both the drying agent type and the ratio of honey to the drying agent in the dried solution had a significant effect on the apparent density of powders and, in the case of MD, also the initial concentration of the dried solution (Table 2). The value of apparent density shows the internal porosity of particles – the more “compact” a particle is the higher the apparent density. Janiszewska & Witrowa-Rajchert [2007] found that the higher the initial concentration of the dried solution the greater the values of apparent density of powders (lower internal porosity). Powders discussed in this paper show such a relationship but the differences were statistically significant only in the case of powders obtained with MD. For both drying agents, the apparent density was correlated with the viscosity of feed solutions. 116 Honey Spray Drying 1.40-1.43 1.43-1.46 1.52-1.55 1.55-1.58 1.58-1.61 1.64 Apparent density (g/cm3) 1.49-1.52 1.46-1.49 1.64 MD 1.61 1.58 1.58 1.55 1.55 1.52 1.52 1.49 1.49 1.46 1.46 1.43 1.43 1.40 1:2 Honey:GA 1:1 20 30 s on d i l i So ntrat e ) c n (% co GA 1.61 1.40 30 1:1 Honey:GA 2:1 20 FIGURE 3. Surface plot showing the effect of honey content and solids concentration on apparent density (g/cm3) of powders obtained after spray drying of honey solution with maltodextrin (MD) and gum Arabic (GA). Abadio et al. [2004] obtained very similar values of apparent density of pineapple juice spray dried with MD (from 1.47 to 1.58 g/cm3). However, they found that the increasing content of MD leads to a reduction in apparent density of powders, which has not been confirmed in the present study. Tonon et al. [2010] determined the absolute density of açai juice powdered by spray drying with addition of MD (10 DE and 20 DE), GA and tapioca starch, yielding values ranging from 1.49 to 1.53 g/cm3. In contrast to the current research, the samples produced with GA showed absolute density lower than these produced with MD 10 DE. The powders dried with MD were characterised by significantly lower apparent density than those dried with GA. This conclusion can be reached by comparing samples 3 with 5 and 4 with 6. Janiszewska & Witrowa-Rajchert [2009] observed a similar relationship after microencapsulation of rosemary aroma by spray drying method. This indicates that the powders dried with MD were characterised by higher internal porosity. Samples dried using MD + GA were characterised by an apparent density close to the apparent density of samples dried using MD. Powders with a higher content of honey had a lower apparent density. Wettability Wettability of the obtained powders ranged from 4.5 to 120 s (Table 2). Both the drying agent type and the honey content in the dried solution had a significant effect on this parameter. MD powders had better wettability than those with GA. In general, it can be also seen that wettability increased significantly (it means the wetting time was shorter) with an increase of honey content in the powder. It may be due to the higher sugar content in the powder, which causes that the moisture was adsorbed more rapidly [Jinapong et al., 2008]. Wettability of the powders dried with mixed drying agents did not differ significantly from that recorded in powders with MD:honey content ratio of 1:1. CONCLUSIONS Spray drying of honey and production of powders using MD and GA as drying agents was conducted. It was found that the behaviour of GA as a drying agent was more beneficial because it allowed obtaining powders of higher honey content (67% of honey in powder solids) than MD (50% of honey in powder solids.). However, it was found that the powders dried with GA were characterised by less favourable physical properties: higher water content, higher hygroscopicity and wetting time, higher cohesiveness indicating poorer flowability. Replacing half of the GA with MD helped to maintain high drying efficiency and thus obtaining powders with better flowability and wettability than those with GA. However, their hygroscopicity remained at equally high level. The aim of further research will be to produce honey powder with a higher content of honey and also more favourable physical properties. ACKNOWLEDGEMENTS This research was funded by The National Science Centre (Poland) under Grant No. N 312 267 140. REFERENCES 1. Abadio F.D.B., Domingues A.M., Borges S.V., Oliveira V.M., Physical properties of powdered pineapple (Ananas comosus) juice – Effect of maltodextrin concentration and atomization speed. J. Food Eng., 2004, 64, 285–287. 2. Adhikari B., Howes T., Bhandari B.R., Truong V., Characterization of the surface stickiness of fructose-maltodextrin solutions during drying. Drying Technol., 2003, 21, 17–34. 3. Ahmed J., Prabhu S.T., Raghavan G.S.V., Ngadi M., Physicochemical, rheological, calorimetric and dielectric behavior of selected Indian honey. J. Food Eng., 2007, 79, 1207–1213. K. Samborska et al. 4. Alvarez-Suarez J.M., Tulipani S., Romandini S., Bertoli E., Battino M., Contribution of honey in nutrition and human health: A review. Med. J. Nutr. Metab., 2010, 3, 15–23. 5. Bhandari B., D’Arcy B., Chow S., Rheology of selected Australian honeys. J. Food Eng., 1999, 41, 65–68. 6. Bhandari B.R., Howes T., Implication of glass transition for the drying and stability of dried foods. J. Food Eng., 1999, 40, 71–79. 7. Chegini G.R., Ghobadian B., Effect of spray drying conditions on physical properties of orange juice powder. Drying Technol., 2005, 23, 657–668. 8. Cui Z.W., Sun L.J., Chen W., Sun D.W., Preparation of dry honey by microwave–vacuum drying. J. Food Eng., 2008, 84, 582–590. 9. Dokic P., Jakovljevic J. Dokic-Baucal, L., Molecular characteristics of maltodextrins and rheological behaviour of diluted and concentrated solutions. Colloids and Surfaces A: Physicochem. Eng. Aspects, 1998, 141, 435–440. 10. Domian E., Poszytek K., Wheat flour flowability as affected by water activity, storage time and consolidation. Int. Agrophys., 2005, 19, 119–124. 11. Gabas A.L., Telis V.R.N., Sobral P.J.A., Telis-Romero J., Effect of maltodextrin and arabic gum in water vapor sorption thermodynamic properties of vacuum dried pineapple pulp powder. J. Food Eng., 2007, 82, 246–252. 12. Geldart D., Harnby N., Wong A.C., Fluidization of cohesive powders. Powder Technol., 1984, 37, 25–37. 13. Goula A.M., Adamopoulos K.G., A new technique for spray drying orange juice concentrate. Innov. Food Sci. Emerg. Technol., 2010, 11, 342–351. 14. Goula A.M., Adamopoulos K.G., Spray drying of tomato pulp in dehumidified air: II. The effect on powder properties. J. Food Eng., 2005, 66, 35–42. 15. Grabowski J.A., Truong V., Daubert C.R., Spray drying of amylase hydrolyzed sweet potato puree and physicochemical properties of powder. J. Food Sci., 2006, 71, E209-E217. 16. Greenspan L., Humidity fixed points of binary saturated aqueous solutions. J. Res. Nat. Bureau Stand., 1977, 81A(1), 89–96. 17. Hebbar H.U., Rastogi N.K., Subramanian R., Properties of dried and intermediate moisture honey products: A review. Int. J. Food Prop., 2008, 11, 804–819. 18. Hebbar U., Subramanian R., Jayaprakash N., Rastogi N.K., An improved process for the preparation of spray dried honey powder. 2002, Indian Patent No 1562/DEL/02. 19. Janiszewska E., Cupial D., Witrowa-Rajchert D., Impact of spray drying parameters on the quality of protein hydrolysate. Żywność. Nauka. Technologia. Jakość, 2008, 15, 206–216 (In Polish). 20. Janiszewska E., Witrowa–Rajchert D., Effect of spray drying parameters on rosemary aroma microencapsulation. Pol. J. Food Nutr. Sci., 2007, 57, 41–43. 21. Janiszewska E., Witrowa–Rajchert D., The influence of powder morphology on the effect of rosemary aroma microencapsulation during spray drying. Int. J. Food Sci. Technol., 2009, 44, 2438–2444. 22. Jinapong N., Suphantharika M., Jamnong P., Production of instant soymilk powders by ultrafiltration, spray drying and fluidized bed agglomeration. J. Food Eng., 2008, 84, 194–205. 23. Jittanit W., Niti-Att S., Techanuntachaikul O., Study of spray drying of pineapple juice using maltodextrin as an adjunct. Chiang Mai J. Sci., 2010, 37, 498–506. 117 24. Juszczak L., Fortuna T., Rheology of selected Polish honeys. J. Food Eng., 2006, 75, 43–49. 25. Kwapinska M., Zbicinski I., Prediction of final product properties after cocurrent spray drying. Drying Technol., 2005, 23, 1653–1665. 26. Lazaridou A., Biliaderis C.G., Bacandritsos N., Sabatini A.G., Composition, thermal and rheological behaviour of selected Greek honeys. J. Food Eng., 2004, 64, 9–21. 27. Masters K., Spray Drying Handbook, 1991, 5th Edn., Longman Scientific and Technical, London, pp. 21–55. 28. Meer W., Gum Arabic. 1980, in: Handbook of Water Soluble Gums and Resins (ed. R.L. Davidson). 1st Edn., McGraw-Hill, New York, pp. 8.1–8.24. 29. Mothe C.G., Rao M.A., Rheological behavior of aqueous dispersions of cashew gum and gum arabic: effect of concentration and blending. Food Hydrocoll., 1999, 13 501–506. 30. Murugesan R., Orsat V., Spray drying for the production of nutraceutical ingredients – a review. Food Bioproc. Technol., 2012, 5, 3–14. 31. Noel T.R., Ring S.G., Whittam P.A., Glass transition in low moisture food. Trends Food Sci. Technol., 1990, 1, 62–67. 32. Papadakis S.E., Gardeli C., Tzia C., Spray drying of raisin juice concentrate. Drying Technol., 2006, 24, 173–180. 33. Pérez-Alonso C., Beristain C.I., Lobato-Calleros C., RodriguezHuezo M.E., Vernon-Carter E.J., Thermodynamic analysis of the sorption isotherms of pure and blended carbohydrate polymers. J. Food Eng., 2006, 77, 753–760. 34. Popek S., A procedure to identify a honey type. Food Chem., 2002, 79, 401–406. 35. Ram A.K., Production of spray-dried honey powder and its application in bread. 2011, Louisiana State University MSc thesis, [http://etd.lsu.edu/docs/available/etd-07052011–085925/unrestricted/KosalRam_Thesis.pdf]. 36. Rodriguez-Hernandez G.R., Gonzalez-Garcia R., Grajales-Lagunes A., Ruiz-Cabrera M.A., Spray drying of cactus pear juice (Opuntia streptacantha): Effect on the physicochemical properties of powder and reconstituted product. Drying Technol., 2005, 23, 955–973. 37. Ruiz-Cabrera M.A., Espinosa-Munoz L.C., Aviles-Aviles C., Gonzalez-Garcia R., Moscosa-Santillan M., Grajales-Lagunes A., Abud-Archila M., Spray drying of passion fruit juice using lactose-maltodextrin blends as the support material. Braz. Archiv. Biol. Technol., 2009, 52, 1011–1018. 38. Sahu J.K., The effect of additives on vacuum dried honey powder properties. Int. J. Food Eng., 2008, 4(8), DOI: 10.2202/1556– 3758.1356. 39. Samborska K., Bieńkowska B., Physicochemical properties of spray dried honey preparations, Zesz. Probl. Postęp. Nauk Roln., 2013, 575, 91–105. 40. Samborska K., Choromańska A., Witrowa-Rajchert D., Bakier S., Spray drying of bee honey with maltodextrin. Post. Techn. Przetw. Spoż., 2011, 1, 19–23 (in Polish). 41. Samborska K., Czelejewska M., The influence of thermal treatment and spray drying on the physico-chemical properties of Polish honeys. J. Food Proc. Preserv., 2014, 38, 413–419. 42. Shi Q., Fang Z., Bhandari B., Effect of addition of whey protein isolate on spray-drying behavior of honey with maltodextrin as a carrier material. Drying Technol., 2013, 31, SI, 1681–1692. 43. Shrestha A.K., Ua-arak T., Adhikari B.P., Howes T., Bhandari B.R., Glass transition behavior of spray dried orange juice 118 44. 45. 46. 47. 48. powder measured by differential scanning calorimetry (DSC) and thermal mechanical compression test (TMCT). Int. J. Food Prop., 2007, 10, 661–673. Takashi I., Preparation of powder of honey or honey containing liquid food. 1984, Japanese Patent No JP59085262. Telis V.R.N., Martínez-Navarrete N., Collapse and color changes in grapefruit juice powder as affected by water activity, glass transition, and addition of carbohydrate polymers. Food Biophys., 2009, 4, 83–93. Tonon R.V., Baroni A.F., Brabet C., Gibert O., Pallet D., Hubinger M.D., Water sorption and glass transition temperature of spray dried açai (Euterpe oleracea Mart.) juice. J. Food Eng., 2009, 94, 215–221. Tonon R.V., Brabet C., Hubinger M.D., Anthocyanin stability and antioxidant activity of spray-dried açai (Euterpe oleracea Mart.) juice produced with different carrier agents. Food Res. Int., 2010, 43, 907–914. Tonon R.V., Brabet C., Hubinger M.D., Influence of process conditions on the physicochemical properties of acai (Euterpe Honey Spray Drying 49. 50. 51. 52. oleraceae Mart.) powder produced by spray drying. J. Food Eng., 2008, 88, 411–418. Truong V., Bhandari B.R., Howes T., Optimization of co-current spray drying process of sugar-rich foods. Part I – moisture and glass transition temperature profile during drying. J. Food Eng., 2005, 71, 55–65. Williams M.L., Landel R.F., Ferry J.D., The temperature dependence of relaxation mechanisms in amorphous polymers and other glass-forming liquids. J. Am. Chem. Soc., 1955, 77, 3701–3707. Yoshihide H., Hideaki H., Production of honey powder. 1993, Japanese Patent No JP5049417. Zareifard M.R., Niakousari M., Shokrollahi Z., Javadian S., A feasibility study on the drying of lime juice: the relationship between the key operating parameters of a small laboratory spray dryer and product quality. Food Bioproc. Technol., 2012, 5, 1896–1906. Submitted: 4 February 2014. Revised: 25 April 2014. Accepted: 12 May 2014. Published on-line: 15 December 2014. Pol. J. Food Nutr. Sci., 2015, Vol. 65, No. 2, pp. 119–126 DOI: 10.1515/pjfns-2015-0031 http://journal.pan.olsztyn.pl Original article Section: Food Quality and Functionality Effect of Microwave Treatment on Microbial Contamination of Honeys and on Their Physicochemical and Thermal Properties María de la Paz Moliné1,2,5*, Natalia Jorgelina Fernández1,4, Sandra Karina Medici1,6, Diana Fasce3, Liesel Brenda Gende1,2,4 Centro de Investigación en Abejas Sociales, Departamento de Biología, Facultad de Ciencias Exactas y Naturales, Universidad Nacional de Mar del Plata, Mar del Plata, Argentina 2 Departamento de Química, Facultad de Ciencias Exactas y Naturales, Universidad Nacional de Mar del Plata, Mar del Plata, Argentina 3 INTEMA, Instituto de Investigaciones en Ciencia y Tecnología de Materiales, UNMDP-CONICET, Mar del Plata, Argentina 4 CONICET, Ciudad Autónoma de Buenos Aires, Buenos Aires, Argentina 5 CIC, La Plata, Buenos Aires, Argentina 6 Laboratorio Fares Taie, Mar del Plata, Argentina 1 Key words: honeys, microwave, microbial count, physicochemical and thermal properties, Paenibacillus larvae In recent years, microwave heating has become a common method for pasteurization and sterilization of food. Honey is a sweet substance produced by worker honeybees from nectar of flowers. The major microbial contaminants include moulds and yeasts, as well as the spore-forming bacteria, being their counts indicative of honeys’ commercial quality and safety. Paenibacillus larvae is also of interest since it causes American foulbrood (AFB) in honeybee larvae. The main quality factors that are used in the honey international trade are moisture, hydroxymethylfurfural content (HMF), and enzymatic indices. Moreover, honey exhibits several thermal events, the most important being the glass transition temperature (Tg). The aim of this work was to evaluate microwave effect (800 watts during 45 and 90 seconds) on microbial content in particular over P. larvae spores retained in honey, and on physicochemical and thermal properties. Microwave promoted a decrease of microbial count with time of exposure, including P. larvae. Moisture content diminished after treatment, while Tg increased linearly, and acidity decremented in the majority of cases. Honeys darkened and HMF exceeded the permissible value. Diastase and glucose-oxidase enzymes were totally inactivated by microwave treatment. INTRODUCTION In industrial food processing, microwave energy has been considered a faster process of pasteurization and sterilization of food than conventional methods. Consequently, microwave radiation is regarded as an alternative method for killing bacteria because of its effectiveness, commercial availability, and lower cost compared with other technologies [Celandroni et al., 2004]. However, the effect of microwave on bacteria depends on food composition and type of microorganism [Castro et al., 1997]. Honey is a sweet product elaborated by worker honeybees from nectar and secretion of flowers. It is collected and transformed by combining with specific substances, then stored in honeycombs until maturation. Chemical composition involves a complex mixture of fructose (average 38.4 g/100 g), glucose (average 30.3 g/100 g), sucrose (average 1.3 g/100 g), * Corresponding Author: Tel: +549223 5468496; E-mail: [email protected] other carbohydrates (around 12 g/100 g), minerals (average 0.169 g/100 g) and proteins (enzymes and amino acids) (average 169 mg/100 g), with a moisture content of 17.2 g/100 g [White et al., 1963]. It also contains organic acids such as gluconic (0.43 g/100 g), and in a minor amount, acetic, citric, lactic, succinic and formic acids, aromatic substances, pigments, wax and pollen grains [Desalegn, 2013]. Honey has own flavor and aroma, and its color varies from colorless to dark amber. Color has been frequently attributed to presence of polyphenols, tannins, among others [Acquarone, 2004]. Due to its natural properties the number and variety of microorganisms present in honey is expected to be low. Low water activity (aw: 0.56 – 0.62), low pH (3.5 – 4.5), high organic acids content, presence of hydrogen peroxide, phytochemicals and/or antioxidants [Estrada et al., 2005; Coll Cardenas et al., 2008] inhibit microorganisms growing. Handling and manipulation post harvest are the main sources of contamination, usually by yeasts (e.g. Saccharomyces, Schizosac-charomyces and Torula) and spore-forming bacteria (e.g. Aerobic Bacillus and anaerobic Clostridium spores). Spores and small © Copyright by Institute of Animal Reproduction and Food Research of the Polish Academy of Sciences © 2015 Author(s). This is an open access article licensed under the Creative Commons Attribution-NonCommercial-NoDerivs License (http://creativecommons.org/licenses/by-nc-nd/3.0/). 120 fragments of moulds may appear [Frazier & Westhoff, 1978; Kedzia et al., 1996]. Among these, microorganisms that cause honeybee diseases are of special interest. Paenibacillus larvae, a spore-forming bacterium, is one of the major pathogens of Apis mellifera responsible for an infection known as American foulbrood (AFB) [Alippi et al., 2002; Lauro et al., 2003]. Also, the species Paenibacillus alvei and Melisococcus pluton in association may cause European foulbrood disease (EFB), which is less important [Coll Cardenas et al., 2008]. The Argentine Food Code (AFC) requires total absence of coliforms and Salmonella-Shigella, and less of 10 CFU/g of moulds and yeasts. Other countries include a limit of 103 CFU/g for aerobic mesophilic bacteria [Peréz et al., 2009]. According to AFC [1969], honey must meet the following requirements: maximum moisture of 18 g/100 g, an acidity of 40 meq/kg, a minimum of 8 diastase units (Gothe scale) and a maximum of 40 mg/kg of hydroxymethylfurfural (HMF). Moisture is the major factor that influences the keeping quality or storability of honey especially concerning the risk of spoilage due to fermentation [White, 1975]. The control of moisture is relevant to prevent microbial growth. Acidity is due to the presence of organic acids that contribute not only to honey flavour, but also to stability against microbial spoilage [Coll Cardenas et al., 2008]. Several enzymes are present in honey, such as invertase, diastase, glucose-oxidase, catalase and acid phosphatase. Invertase, glucose-oxidase and catalase are derived mostly from the honeybees. Their activities depend on the intensity of the nectar flow and the amount of nectar processed by the honeybees [Bachmann, 2007]. Enzyme activities are usually measured to evaluate heating or storage effects. The activity of diastase enzyme decreases with time of storage and heating [Kowalski et al., 2012]. Glucose-oxidase is more sensitive to temperature than diastase, so that its determination constitutes a good complement in thermally-treated honey’s studies [Montenegro et al., 2006]. HMF is formed through the acid catalyzed dehydration of hexoses (glucose and fructose) as well as from the decomposition of 3-deoxyosone in Maillard reaction [Belitz et al., 2004]. Its content in fresh honey is very low, and it depends on the floral origin and the chemical properties of honey [Singh & Bath, 1998; Fallico et al., 2004; Zappala et al., 2005]. Its concentration increases during storage in relation to pH and time [Bath & Singh, 1999], but also due to honey heating [Bath & Singh, 1999; Bartakova et al., 2011]. The level of HMF in food depends on the equilibrium between formation from precursors and destruction by oxidation [Morales et al., 1997]. Honey is a supersaturated solution composed mainly of sugars and water and can be thermally characterized by its glass transition temperature (Tg). This is the temperature at which an amorphous material changes from rubbery to glassy state upon cooling. As Tg is very sensitive to water content as well as to chemical composition [Bhandari & Howes, 1999], it is a very useful tool to detect adulteration [Cordella et al., 2003]. The consequences of microwave treatment over honey properties, such as moisture content, acidity [Dranca Effect of Microwave Treatment on Honeys & Oroian, 2013], HMF and enzyme activities [Kowalski et al., 2012], as well as over mould and yeasts [Hebbar et al., 2003] and bacteria spores have already been reported. Microwave radiation cannot be thought as simple heating from the inside; the E-field would produce effects on the biological molecules affecting spore structure, different from those attributable only to heat [Celandroni et al., 2004]. Gamma radiation method was used to control this disease, in order to inactivate P. larvae, although significant effect on chemical parameters and enzyme activities of honey were observed [Baggio et al., 2005]. At present, the effect of microwave radiation on P. larvae has not been studied yet. So, the aim of this study was to evaluate the microwave impact on microbial content, in particular over P. larvae spores, and on physicochemical and thermal properties. MATERIALS AND METHODS Samples Eight honeys were obtained from different geographic sites of Argentina. Five from Corrientes province (27°816 S; 58°5025 W), one from Entre Rios province (32°251.72 S; 60°1651.6 W) and the other two from Buenos Aires province (37°5259 S; 57°3609 W). They were kept in hermetic containers and stored at 20–27ºC and 50% relative humidity [AOAC, 2000a]. Superficial layer was removed and honey was homogenized with sterile scoop. Microbial content and physicochemical and thermal properties of honeys were determined. Microwave thermal treatment Microwave heating studies were conducted in a microconvective oven with turntable attachment (Sharp R-3A55, maximum power of 800 watts; Thailand). Experiments were carried out at high microwave power of 800 watts, and for heating periods of 45 and 90 seconds [Kohn’s, 1998]. Microbial content and physicochemical and thermal properties of honeys were anew determined. The samples temperature was measured at the end of the each heating period (Mean temperature at 45 seconds: 83°C; mean temperature at 90 seconds: 108°C). Analysis of microbial content Aerobic mesophilic bacteria, moulds and yeast and sulphite-reductive Clostridium were counted. Also, P. larvae was determined. Untreated honeys were used as a control. In microbial counts of aerobic mesophilic bacteria and moulds and yeast, ten grams of each sample were homogenized into 90 mL of sterile phosphate-buffered dilution water (0.25 mol/L KH2PO4 adjusted to pH 7.2 with NaOH). Decimal dilutions were made into the buffer. Aerobic mesophilic bacteria were counted onto standard plate count agar (PCA) incubated at 37°C for 24–48 h [ICMSF, 1983]. Moulds and yeasts were counted onto standard yeast extract–glucose–chloramphenicol (YGC) agar incubated at 22–25°C for 3–5 days [ICMSF, 1983]. Microbial counts were expressed as colony-forming units per gram of honey (CFU/g). Sulphite-reductive Clostridium count was determined with horizontal method in anaerobes on Agar Sulphite Iron (TSC) 121 M. de la Paz Moliné et al. with virgin cape to avoid contact between oxygen and microorganism. Plates were incubated in anaerobe jar at 37°C for 24–48 h [ISO 15213, 2003]. In order to quantify viable spore abundance of P. larvae, five grams of honey were homogenized with 5 mL of sterile water [Alippi, 1995]. Serial dilutions (1:2 and 1:10) of the honey solution were prepared and their aliquots (100 μL) were plated on MYPGP agar [Dingman & Stahly, 1983], supplemented with 9 μg/L nalidixic acid to inhibit Paenibacillus alvei growth, and incubated at 37ºC in microaerophilia (5–10 g/100 g CO2). The plates were checked after 2 and 4 days to count the number of P. larvae-like colony forming units (CFU) for each dilution, which permitted to calculate the number of viable spores per honey gram. Colonies were identified by catalase test [Heyndrickx et al., 1996], Gram staining [Beveridge, 2001] and phenotypic characterization [Alippi, 1992]. All microbial tests were performed in triplicate. Analysis of physicochemical properties Moisture content, acidity, color, diastase, glucose-oxidase and HMF were determined for all the samples. Untreated honeys were used as a control. Determination of moisture content was based on the refractometric method [AOAC, 2000b]. The refractive index of samples was measured with a refractometer (Abbe; Science Instrumentation, Argentina) and results were converted with the Chataway Table. Free acidity was determined by titrimetric method with a pH-meter (HANNA Instruments, HI 2211 pH, pH/ORP meter; Rumania, Europe) according to AOAC [2000c] technical, readings were corrected to meq of acid/kg of honey. Measurements of color are based on a visual comparison with a colored glass reference. It was measured in the Pfund colorimeter (HANNA Instruments, C22f digital, The United States) [Tabera et al., 2002]. Diastase catalyzes the transformation of starch to maltose. It was determined quantitatively by official method in AOAC [2003] and qualitatively according to Bianchi [1990]; both methods are based in diastase action on starch solution, using iodine-iodized solution to visualize the hydrolysis. In qualitative determination diastase was analysed together with glucose-oxidase. Glucose-oxidase activity determination is based in action of glucose-oxidize on glucose, to produce gluconic acid and hydroxide peroxides [Bianchi, 1990]. The HMF was measured by spectrophotometric method suggested by White [1979] using Carrez solutions. The absorbance of the solutions at 284 and 336 nm was determined using a spectrophotometer (Helios Unicam Gamma, England). The quantitative value of HMF was determined using the proposed formula for the method reported by IHC [1999]. Analysis of thermal properties Glass transition temperature (Tg) was determined for all the samples. Untreated honeys were used as a control. Tg was analyzed by differential scanning calorimetry (DSC) using a Pyris 1, Perkin Elmer (Massachusetts, USA). Samples were previously homogenized with a mechanical device (IEC CC31R Multispeed Centrifuge Thermo Scientific, United States) for 20 min, then placed in aluminum pans and heated at a rate of 10ºC/min from -65ºC to 25ºC under N2 atmosphere. Tg was determined as the onset of the step decrease in heat flow plot [Cordella et al., 2003]. Statistical analysis It was performed with RStudio software, and data were considered as binomial distribution and inflated zero. Widespread Linear Model was used for analyzed differences between microbial content and treatment time. Pearson’s correlation was used to analyze chemical data. Pearson’s linear correlation coefficient (r) was calculated to the relationship between moisture content and Tg, and between HMF and color. For all analyses, =0.05 was the level of statistical significance. RESULTS AND DISCUSSION Microbial content Honey may be expected to contain a small number and a limited variety of microorganisms. Treated honeys presented a lower count of aerobic mesophilic bacteria, moulds and yeast and P. larvae than virgin honeys (Table 1). Sulphite-reductive Clostridium was not observed. In this study, aerobic mesophilic bacterial count was lower than those obtained by Iurlina & Fritz [2005]. Microwave reduced significantly (p<2 × 10–16) count in response to the exposure time. Untreated honeys presented higher microbial variety in relation to treated ones. White colonies with radial or spiral forms and yellow colonies were observed. All presented positive-Gram coloration with basilar or coco-basilar structure. Wakita et al. [2001] and Iurlina & Fritz [2005] reported colonies of Bacillus with concentric ring and irregular border. Mould and yeast counts ranged between 0 to 766 UFC/g in virgin honeys, whereas, Iurlina & Fritz [2005] observed a lower values within a narrower range (164–191 UFC/g) for honeys of southeast region of Buenos Aires province, Argentina. Microwave treatment resulted in a total reduction of these counts after 90 seconds of exposure (p=0.015). Similar results were achieved by Hebbar et al. [2003]. P. larvae has the ability to generate extremely resilient and long-lived spores [Shimanuki, 1997]. They can be transmitted by beekeepers unwittingly, shifting honeycombs between colonies, or by the honeybees themselves through robbing of colonies weakened by AFB [Fries & Camazine, 2001; de Graaf et al., 2001]. It is widely recognized that honey will retain spores of P. larvae [Sturtevant, 1936; Hansen & Rasmussen, 1986], and that inter-colony transmission of spores in contaminated honey does occur [Fries & Camazine, 2001; de Graaf et al., 2001]. In this study, P. larvae count was on average 37 CFU/g, data according to Iurlina & Fritz [2005]. The microwave treatment reduced the count of P. larvae, but this decrease was not statistically significant, a different result from gamma radiation method was observed [Baggio et al., 2005]. Physicochemical and thermal properties The moisture content in honeys depends on several factors, such as harvesting season, degree of maturity and climatic factors. The values determined for virgin honeys are 122 Effect of Microwave Treatment on Honeys TABLE 1. Counts of aerobic mesophilic bacteria, moulds and yeasts and P. larvae in the analysed honeys. Sample Aerobic mesophilic bacteria (CFU / g of honey) Moulds and yeasts (CFU / g of honey) P. larvae (CFU / g of honey) Unt. 45’’ 90’’ Unt. 45’’ 90’’ Unt. 45’’ 90’’ 1 87 23 15 19 ZC ZC 133 5 ZC 2 45 40 20 766 10 ZC 5 ZC ZC 3 140 62 25 269 ZC ZC ZC ZC ZC 4 188 115 63 293 ZC ZC 59 5 ZC 5 124 59 5 35 10 ZC ZC ZC ZC 6 85 28 10 45 ZC ZC 50 ZC ZC 7 24 5 ZC ZC ZC ZC 49 ZC ZC 8 30 19 4 ZC ZC ZC ZC ZC ZC 2.5 ± 4.6b 0b 37 ± 46.5a 1.3 ± 2.3a 0a Mean ± SD 90.3 ± 57.7a p 43.8 ± 34.7b 17.8 ± 20.1b 178.4 ± 265.7a < 2 x 10–16 0.015 0.97 Unt. (untreated), 45’’ (treated honey 45 seconds at 800 watts). 90’’ (treated honey 90 seconds at 800 watts). ZC. Zero Count. p significance value (widespread lineal model with binomial distribution and inflated zero). The same letter indicates no significant difference at the 95% confidence level. TABLE 2. Moisture content, glass transition temperature (Tg) and acidity of the analysed honeys. Sample Moisture (g/100 g) Tg (°C) Acidity (meq/kg) Unt. 45’’ 90’’ Unt. 45’’ 90’’ Unt. 45’’ 90’’ 1 19.6 19 18.8 -52.9 -51.7 -47.8 29 33 44 2 19.6 17.6 16.6 -50.4 -46.3 -44.2 42 35 35 3 21.4 19.8 16.2 -55.3 -53.3 -46.3 46 34 43 4 20.2 18.6 17.6 -53.4 -52.2 -47.3 36 41 30 5 19 17.2 16.6 -52.5 -48.8 -47.9 39 30 35 6 19.4 18.4 17.6 -51.1 -48.5 -44.9 36 31 32 7 21.8 20.8 18.4 -56.9 -56.2 -53.3 36 27 27 8 17.6 17.4 16.8 -47.1 -47.9 -45.3 32 29 32 19.8 ± 1.3 18.6 ± 1.2 17.3 ± 0.9 -52.5 ± 3 -50.6 ± 3.3 -47.1 ± 2.8 – – – -0.9 -0.9 -0.6 – – – – – – Mean ± SD r Unt. (untreated), 45’’ (treated honey 45 seconds at 800 watts). 90’’ (treated honey 90 seconds at 800 watts). Pearson correlation coefficient (r) between moisture and Tg. higher than others reported for Argentine honeys [Acquarone, 2004; Iurlina & Fritz, 2005; Silvano et al., 2014] and Spanish ones [Bentabol et al., 2014]. But, these values were similar to those reported by Karabagias et al. [2014] for unifloral Greek honeys. Meanwhile, the values were close to or even higher than those permitted by international food codes as Codex Alimentarius standard for honey 12–1981 (20 g/100 g) and the AFC (18 g/100 g). After microwave treatment, moisture content diminished (Table 2), as it was expectable because of the sample temperature rise during the exposure to microwave radiation. Glass transition temperatures (Tg) of honeys from different botanical and geographic origins have already been reported [Cordella et al., 2003; Lazaridou et al., 2004; Costa et al., 2011] but there is no available information about Argentine honeys. From the results it can be seen that Tg shifted to higher values after treatment, which is consistent with the reduction in moisture content. It is well known that water acts as a plasticizer lowering the Tg [Bhandari & Howes, 1999; Ahmed et al., 2007]. Moreover, a linear relationship between Tg and moisture content was found (r=-0.94), which is in agreement with other authors [Cordella et al., 2003]. Acidity is produced in honey, principally, by the action of the enzyme glucose-oxidase on glucose. The values of most virgin honeys analyzed were below the limit permitted by the Argentine Food Code (40 meq/Kg) and were similar to these described by Aqcuarone [2004]. Bentabol et al. [2014] reported similar results for this parameter, these values did 123 M. de la Paz Moliné et al. TABLE 3. Color changes and hydroxymethylfurfural content in the analysed honeys. Color (mm pfund) Sample HMF (mg / kg) Unt. 45’’ 90’’ Unt. 45’’ 90’’ 1 55 73 73 25 55 101 2 66 89 86 0 42 51 3 68 125 90 0 8 49 4 71 117 90 5 13 80 5 70 90 92 4 21 67 6 51 68 66 0 37 84 7 53 68 63 30 19 50 8 73 81 107 108 87 110 63.4 ± 9 88.9 ± 21.6 83.4 ± 14.9 22 ± 36.9 35.3 ± 26.2 74 ± 23.7 0.25 0.1 0.26 – – – Mean ± SD r Unt. (untreated), 45’’ (treated honey 45 seconds at 800 watts). 90’’ (treated honey 90 seconds at 800 watts). Pearson correlation coefficient (r) between color and HMF. TABLE 4. Diastase index, diastase activity and glucose-oxidase activity in the analysed honeys. Samples Diastase index (DU) Diastase activity Glucose-oxidase activity Unt. 45’’ 90’’ Unt. 45’’ 90’’ Unt. 45’’ 90’’ 1 22 0 UM* + – – + – – 2 11 0 UM* + – – + – – 3 31 0 UM* + – – + – – 4 18 2 UM* + – – + – – 5 15 2 UM* + – – + – – 6 5 0 UM* + – – + – – 7 9 0 UM* + – – + – – 8 7 0 UM* + – – + – – Unt. (untreated), 45’’ (treated honey 45 seconds at 800 watts), 90’’ (treated honey 90 seconds at 800 watts), UM*: unmeasured, + (activity present), – (activity absent). not exceed the maximum established in the European Legislation for free acidity (50 meq/Kg). Microwave caused, in most cases, reduced acidity probably due to volatile acids evaporation. This was in disagreeing with Dranca & Oroian [2013]. The color of honey has not been legislated, but can be considered as another quality criterion. In this study a little range of color was observed. It is recognized that the color varied according to the melliferous areas, our results agreed with data previously obtained by Aloise [2010] for the same geographic zone. Similar range was observed in Greek unifloral honey [Karabagias et al., 2014]. One of the effects of thermal treatments of honey is the acceleration of Maillard reaction [Ibarz et al., 2000; Wong & Stanton, 1989]. These reactions would be associated to the non-enzymatic chemical changes of browning, leading to the formation of a variety of brown pigments, and formation of intermediate products as the HMF. In honey, Maillard reac- tions are the sugars condense with free amino acids producing a variety of brown pigments. The difference in browning rate of honey could be explained by differences in its amino acid and reducing sugar contents. Other factors that would influence the kinetics of Maillard browning could be the type and thermal stability of amino acids and reducing sugars which participate in the reaction [Turkmen et al., 2006]. In this study, a darkening of honeys was observed and HMF amount incremented rapidly (r=0.3) (Table 3). The trends in the variation of HMF content of the samples clearly depicted the sensitivity of honey to the period of heating and temperature. The same was observed by Kowalski et al. [2012], the increase caused by microwaves of the HMF is not gradual and its formation did not take place in the individual honeys in the same way, depending on floral origin. On the other hand, sample eight showed high concentration of HMF before treatment, associated to, probably, adultera- 124 tion or previous overheating. Excessive amount of HMF has been observed as evidence of overheating. Also, HMF is toxic and cancerogenic [Michail et al., 2007]. Diastase index values of virgin honeys were in agreement with reported values of Argentine honeys [Aquarone, 2004]. In Greek unifloral honeys, the range of diastase index values was a little more wide [Karabagias et al., 2014]. It this thought that the amount of enzyme activity is influenced by nectar thickness and sugar content and by the fact how many times it is transferred from honeybee to honeybee before nectar is turned into honey [Bonvehi et al., 2000]. The parameter of diastase activity is regulated by international codes, while there are no requirements for the activity of glucose-oxidase. Diastase index dropped below the acceptable value (Table 4), meanwhile, Hebbar et al. [2003] obtained similar results. Kowalski et al. [2012] showed that a short microwave treatment (0–2 min) with a low power level (63 watts) did not influence the honey quality estimated by means of diastase number. In qualitative determination of both enzymes it was not observed activity neither of diastase (blue color) nor glucose-oxidase (colorless) in treated honeys (Table 4). Glucose-oxidase data were in agreement with the study by Kretavictus et al. [2010], where the authors observed a decrease of its activity after exposure to a conventional thermal treatment. CONCLUSIONS Microwave treatment was found very effective in reducing aerobic mesophilic bacteria, moulds, yeasts and P. larvae too. This was the first register about the effect of microwave on P. larvae. Concerning to physicochemical and thermal properties variation, the treatment led to several undesirable consequences such as darkening, increase of HMF content and enzymes inactivation. Despite this, from this study it can be concluded that microwave treatment could be successfully applied by properly selecting power and exposure time to control benefits and disadvantages. ACKNOWLEDGEMENTS To Laboratorios Fares Taie (Mar del Plata). This work was financed for El Concejo Interuniversitario Nacional (CIN) and for PICT 1625 for LB. REFERENCES 1. Acquarone C.A., Parámetros fisicoquímicos de mieles, relación entre los mismos y su aplicación potencial para la determinación del origen botánico y/o geográfico de mieles argentinas. 2004, in: Las Tesinas de Belgrano, Tesinas de Ciencias Exactas y Naturales, n° 19 (ed. Universidad de Belgrano). Publicaciones, Departamento de Investigación, Facultad de Ciencias Exactas y Naturales, Universidad de Belgrano, Buenos Aires, Argentina, pp. 1–56 (in Spanish). 2. AFC. 1969, Código Alimentario Argentino, Alimentos azucarados, Capitulo X, Artículo 782. Ministerio de Agricultura, Ganadería y Pesca, Ciudad de Buenos Aires. Argentina (in Spanish). Effect of Microwave Treatment on Honeys 3. Ahmed J., Prabhu S.T., Raghavan G.S.V., Ngadi M., Physicochemical, rheological, calorimetric and dielectric behaviour of selected Indian honeys. J. Food Eng., 2007, 79, 1207–1213. 4. Alippi A.M., Characterization of Bacillus larvae White, the causative agent of American foulbrood of honeybees. First record of its occurrence in Argentina. Rev. Argent. Microbiol., 1992, 24, 67–72. 5. Alippi A.M., Detection of Bacillus larvae spores in Argentinian honeys by using a semi-selective medium. Microbiology, 1995, 11, 343–350. 6. Alippi A.M., López C.A., Aguilar M.O., Differentiation of Paenibacillus larvae subsp. larvae, the cause of American foulbrood of honey bees, by using PCR and restriction fragment analysis of genes encoding 16S rRNA. Appl. Environ. Microbiol., 2002, 68, 3655– 3660. 7. Aloise V., Determination of quality chemical parameters of honey from Chubut (Argentinean Patagonia). Chil. J. Agr. Res., 2010, 70, 640–645. 8. AOAC. 2000a, Official method 920.180 Honey (Liquid, Strained or Comb) preparation of test samples, Official Methods of Analysis of AOAC International, 17th ed. Washington, DC. 9. AOAC. 2000b, Official method 969.38 Moisture in honey, Official Methods of Analysis of AOAC International, 17th ed. Washington, DC. 10. AOAC. 2000c, Official method 962.19 Acidity (Free, Lactone, and Total) of Honey, Official Methods of Analysis of AOAC International, 17th ed. Washington, DC. 11. AOAC. 2003, Official method 958.09, Diastatic Activity of Honey, Official Methods of Analysis of AOAC International, 17th ed. Washington, DC. 12. Bachmann L.H.E., Estudios preliminares de caracterización miel de abeja: determinación de carbohidratos por GC/MS y análisis enzimático. 2007, in: Tesis de grado, n° 4, 6, 8 (ed. Sistema de Bibliotecas UACh). Facultad de Ciencias, Universidad Austral de Chile., Valdivia, Chile, pp. 23–27 (in Spanish). 13. Baggio A., Gallina A., Dainese N., Manzinello C., Mutinelli F., Serra G., Colombo R., Carpana E., Sabatini A.G., Wallner K., Piro R., Sangiorgi E., Gamma radiation: A sanitating treatment of AFB-contaminated beekeeping equipment gamma radiation sanitation in beekeeping management. Apiacta, 2005, 40, 22–27. 14. Bartakova K., Drackova M., Borcovcova I., Vorlova L., Impact of microwave heating on hydroximethylfurfural content in Czech honeys. Czech J. Food Sci., 2011, 29, 328–336. 15. Bath P.K., Singh N., A comparison between Helianthus annuus & Eucalyptus lanceolatus honey. Food Chem., 1999, 67, 389–397. 16. Belitz H.D., Grosch W., Schieberle P., Food Chemistry. 2004, 3rded., Springer Verlag, Germany, pp. 260–263. 17. Bentabol Manzanares A., Hernández García Z., Rodríguez Galdón B., Rodríguez Rodríguez E., Díaz Romero C., Physicochemical characteristics of minor monofloral honeys from Tenerife, Spain. Food Sc. Tech., 2013, 5, 572–578. 18. Beveridge T.J., Use of the Gram stain in microbiology. Biotech. Histochem., 2001, 76, 111–118. 19. Bhandari T.R., Howes T., Implication of glass transition for the drying and stability of dried foods. J. Food Eng., 1999, 40, 71–79. 20. Bianchi E.M., Control de calidad de la miel y la cera. 1990, in: Boletín de los Servicios Agrícolas, n° 68/3 (ed. FAO), (in Spanish). M. de la Paz Moliné et al. 21. Bonvehi J.S., Torrento M.S., Raich J.M., Invertase, activity in fresh and processed honeys. J. Sci. Food. Agric., 2000, 80, 507–512. 22. Castro V., Arias M.L., Antillon F., Jimenez M., Efectos de las microondas sobre la sobrevivencia de algunas bacterias patógenas en comidas populares costarricenses. Rev. Costarric. Cienc. Méd., 1997, 18, 19–27 (in Spanish). 23. Celandroni F., Longo I., Tosoratti N., Giannessi F., Ghelardi E., Salvetti S., Baggiani A., Senesi S., Effect of microwave radiation on Bacillus subtilis spores. J. Appl. Microbiol., 2004, 97, 1220–1227. 24. Coll Cardenas F., Villat C., Laporte G., Noia M., Mestorino M., Características microbiológicas de la miel. Revisión bibliográfica. J. Veterinaria Cuyana., 2008, n° 3, 1 y 2, 29–34. (in Spanish). 25. Cordella C., Faucon J. P., Cabrol Bass D., Sbirrazuolli N., Application of DSC as a tool for honey floral species characterization and adulteration detection. J. Therm. Anal. Cal., 2003, 71, 279–290. 26. Costa P.A., Moraes I.C.F., Bittante A.M.Q.B., Sobral P.J.A., Gomide C.A., Carrer C.C., Thermal and Rheological Properties of Brazilian Honeys. 2011, in: International Congress on Engineering and Food 11th, Engineering Properties of Foods, vol. 2 (eds. S.P. Taoukis, N.G. Stoforos, V.T. Karathanos, G.D. Saravacos). School of Chemical Engineering, National Technical University of Athens, Athens, Greece, pp. 1329–1330. 27. de Graaf D.C.d., Vandekerchove D., Dobbelaere W., Peeters J.E., Jacobs F.J., Influence of the proximity of American foulbrood cases and apicultural management on the prevalence of Paenibacillus larvae spores in Belgian honey. Apidologie, 2001, 32, 587–599. 28. Desalegn A., The antibacterial activity of honey. Int. J. Curr. Res. Aca. Rev., 2013, 1, 102–116. 29. Dingman D.W., Stahly D.P., Medium promoting sporulation of Bacillus larvae and metabolism of médium components. Appl. Environ. Microbiol., 1983, 46, 860–869. 30. Dranca F., Oroian M., Impact of microwave heating on chemical properties of Romanian honeys. J. Agroaliment. Proc. Technol., 2013, 19, 464–469. 31. Estrada H., Gamboa M.M., Chavez C., Arias M.L., Evaluación de la actividad antimicrobiana de la miel de abeja contra Staphylococcus aeureus, Staphylococcus epidermis, Pseudomona aeuroginosa, Escherichia coli, Salomnella enteritidis, Listeria monocytogenes y Aspergillus niger. Evaluación de su carga microbiológica. 2005, in: Archivos Latinoamericanos de Nutrición, Vol. 55 (ed. Capítulo Venezolano). Publicación Oficial de la Sociedad Latinoamericana de Nutrición, pp. 167–171 (in Spanish). 32. Fallico B., Zappala M., Arena E., Verzera A., Effects of conditioning on HMF content in unifloral honeys. Food Chem., 2004, 85, 305–313. 33. Frazier W.C., Westhoff D.C., Food Microbiology. 1978, 3rded., Tata McGraw-Hill Publishing Company, NewYork, pp. 185–193. 34. Fries I., Camazine S., Implications of horizontal and vertical pathogen transmissions for honey bee epidemiology. Apidologie, 2001, 32, 199–214. 35. Hansen H., Rasmussen B., The investigation of honey from bee colonies for Bacillus larvae. Dan. J. Plant Soil Sci., 1986, 90, 81–86. 36. Hebbar H.U., Nandini K.E., Lakshmi M.C., Subramanian R., Microwave and infrared heat processing of honey and its quality. Food. Sci. Technol. Res., 2003, 9, 49–53. 125 37. Heyndrickx M., Vandemeulebroecke K., Hoste B., Janssen P., Kersters K., De Vos P., Logan N.A., Ali N., Berkeley R., Reclassification of Paenibacillus (formerly Bacillus) pulvifaciens (Nakamura 1984) Ash et al. 1994, a later subjective synonym of Paenibacillus (formerly Bacillus) larvae (White 1906) Ash et al. 1994, as a subspecies of P. larvae, with emended descriptions of P. larvae as P. larvae subsp. larvae and P. larvae subsp. pulvifaciens. Int. J. Syst. Bacteriol., 1996, 46, 270- 279. 38. Ibarz A., Pagán J., Garza S., Kinetic models of non- enzymatic browning in apple puree. J. Sci. Food Agric., 2000, 80, 1162– –1168. 39. International Commission on Microbiological Specifications for Foods (ICMSF). Microorganismos de los alimentos. Su significado y métodos de enumeración. 2000., vol 1 (ed. Acribia S.A.). Zaragoza, pp. 165–179. 40. IHC. 1999, Harmonised methods of the international honey commission. International Honey Commission, pp. 1–54. 41. ISO. 15213. 2003, Microbiology of food and animal feeding stuffs — Horizontal method for the enumeration of sulfite-reducing bacteria growing under anaerobic conditions. International Organization for Standarization. 42. Iurlina M.O., Fritz R., Characterization of microorganisms in Argentinian honeys from different sources. Int. J. Food Microbiol., 2005, 105, 297–304. 43. Karabagias I.K., Badeka A.V., Kontakos S., Karabournioti S., Kontominas M.G., Botanical discrimination of Greek unifloral honeys with physico-chemical and chemometric analyses. Food Chem., 2014, 165, 181–190. 44. Kedzia B., Kedzia A., Hołderna-Kedzia E., Studies on the occurrence of clostridia spores in honey. Bacillus and Clostridium. Wyd. Pszczel., 1996, 37–39 (in Polish). 45. Kohn´s B.J., Técnicas de quirófano. 1998, 8thed., Harcourt Brace, Madrid, pp. 207–224 (in Spanish). 46. Kowalski S., Lukasiewicz M., Bednarz S., Panus M., Diastase number changes during thermal and microwave processing of honey. Czech J. Food Sci., 2012, 30, 21–26. 47. Kretavictus J., Kurtinaitiene B., Racys J., Ceksteryte V., Inactivation of glucose oxidase during heat-treatment de-crhistallization of honey. Agriculture., 2010, 97, 115–122. 48. Lauro F.M., Favaretto M., Covolo L., Rassu M., Bertoloni G., Rapid detection of Paenibacillus larvae from honey and hive samples with a novel nested PCR protocol. Int. J. Food Microbiol., 2003, 81, 195–201. 49. Lazaridou A., Biliaderis C.G., Bacabdritsos N., Sabattini A.G., Composition, thermal and rehological behaviour of selected Greek honeys. J. Food Eng., 2004, 64, 9–21. 50. Michail K., Matzi V., Maier A., Herwig R., Greilberger J., Juan H., Kunert O., Wintersteiger R., Hydroxymethylfurfural: an enemy or a friendly xenobiotic? A bioanalytical approach. Anal. Bioanal. Chem., 2007, 387, 2801–2814. 51. Montenegro S.B., Avallone C.M., Aztarbe M., Osuna M., Actividad enzimática en miel de Apis mellifera. Comunicaciones científicas y tecnológicas., 2006, T095, 1–3. 52. Morales F.J., Romero C., Jimenez-Perez S., A kinetic study on 5-hydroxymethylfurfural formation in Spanish UHT milk stored at different temperatures. J. Food Sci. Tech. Mys., 1997, 34, 28–32. 53. Peréz A., Alexander H., Matos Chamorro A., Análisis comparativo de la calidad fisicoquímica, microbiológica y organoléptica 126 54. 55. 56. 57. 58. 59. de la miel de abeja (Apis mellifera) producida en diferentes regiones de Perú. Rev. Invest. Univ., 2009, 1, 5–11 (in Spanish). Shimanuki H., Bacteria. 1997, in: Honey Bee Pests, Predators, and Diseases (eds. R.A. Morse, K. Flottum). A.I. Root Company., Medina, Ohio, pp. 35–54. Silvano M.F., Varela M.S., Palacio M.A., Ruffinengo S., Yamul D.K., Physicochemical parameters and sensory properties of honeys from Buenos Aires region. Food Chem., 2014, 152, 500–507. Singh N., Bath P.K., Relationship between heating and hydroxymethylfurfural formation in different honey types. J. Food Sci. Tech., 1998, 35, 154–156. Sturtevant A.P., Quantitative demonstration of the presence of spores of Bacillus larvae in honey contaminated by contact with American foulbrood. J. Agricult. Res., 1936, 52, 697–704. Tabera A.E., Libonatti C.C., Díaz M.D., Relevamiento de muestras de mieles procedentes de la zona de Tandil. 2002, in: Boletín Apícola n° 20 (ed. Dirección de Industria Alimentaria). SAGPyA, Argentina, pp. 13–17 (in Spanish). Turkmen N., Sari F., Poyrazoglu E.S., Velioglu Y.S., Effects of prolonged heating on antioxidant activity and colour of honey. Food Chem., 2006, 95, 653–657. Effect of Microwave Treatment on Honeys 60. Wakita J., Shimada H., Itoh H., Matsuyama T., Matsushita M., Periodic colony formation by bacterial species Bacillus subtilis. J. Phys. Soc. Japan., 2001, 70, 911–919. 61. White J.W., Subers M.H., Schepartz A.I., The identification of inhibine, the antibacterial factor in honey, as hydrogen peroxide and its origin in a honey glucose-oxidase system. Biochim. Biophys., 1963, 73, 57– 70. 62. White Jr., Physical characteristics of honey. 1975, in: Honey, a comprehensive survey (ed. E. Crane). Heinemann, London, pp. 509–514. 63. White J.W., Spectrophotometric method for hydroxymethylfurfural in honey. J. Assoc. Off. Anal. Chem., 1979, 62, 509. 64. Wong M., Stanton D.W., Nonenzymic browning in kiwifruit juice concentrate systems during storage. J. Food Sci., 1989, 54, 669–673. 65. Zappala M., Fallico B., Arena E., Verzera A., Methods for the determination of HMF in honey: a comparison. Food Contr., 2005, 16, 273–277. Submitted: 30 October 2014. Revised: 12 March 2015. Accepted: 13 March 2015. Published on-line: 15 April 2015. Pol. J. Food Nutr. Sci., 2015, Vol. 65, No. 2, pp. 127–135 DOI: 10.1515/pjfns-2015-0019 http://journal.pan.olsztyn.pl Original article Section: Food Chemistry Effects of Honey Addition on Antioxidative Properties of Different Herbal Teas Gamze Toydemir1, Esra Capanoglu2*, Senem Kamiloglu2, Ebru Firatligil-Durmus2, Asli E. Sunay3, Taylan Samanci3, Dilek Boyacioglu2,3 Department of Food Engineering, Faculty of Engineering & Architecture, Okan University, Akfirat-Tuzla, 34959, Istanbul, Turkey 2 Department of Food Engineering, Faculty of Chemical and Metallurgical Engineering, Istanbul Technical University, 34469 Maslak, Istanbul, Turkey 3 Scientific Bio Solutions LLC., Maslak, Istanbul, Turkey 1 Key words: herbal tea, honey, temperature, phenolics, flavonoids, antioxidant capacity Tea and herbal infusions are among the major contributors of phenolic compounds, specifically flavonoids, in our daily diet. Honey is another antioxidant-rich food that is widely used as a natural sweetener. In this work, the effects of honey addition on antioxidant properties of different herbal teas were investigated. For this purpose, 2 different types of honey (flower and pine honey) were added into 9 different herbal teas (melissa, green tea, rosehip, sage, echinacea, fennel, linden, daisy, and ginger) at 4 different temperatures (55˚C, 65˚C, 75˚C, and 85˚C), and the changes in the content of total pheolics, total flavonoids, and total antioxidant capacity were determined. The total phenolic content and the total antioxidant capacity of the honey-added-tea samples were found to be increased (up to 57% for both), especially with pine honey and at higher temperatures of honey addition. The findings of this study supported the use of honey as a natural sweetener in tea in order to be able to benefit from the health-enhancing antioxidative properties of these two promising food products. INTRODUCTION Tea and herbal infusions, which are popular, socially accepted, and economical, drinks [Trevisanato & Young-In Kim, 2000], can be prepared from any part of various plants, i.e. roots, flowers, seeds, berries, or bark, depending on the solubility of the active constituents included [Apak et al., 2006]. It is well-documented that these infusions, prepared from valuable parts of herbs, are among the major contributors of phenolics in our diet [Shahidi, 2000]. Flavonoids, as the leading polyphenol group present in herbs, have been indicated to provide protection against several forms of cancer and cardiovascular diseases, as well as enhance the function of the immune system [Craig, 1999]. Brewing tea leaves in hot water has been reported to release 69–85% of the bioactive flavonoids within 3–5 minutes [Keli et al., 1996] which contributes to the intake of 80 mg flavonoids per 100 mL of tea consumption [van Dokkum et al., 2008]. The majority of the plant materials, that include phytochemicals possessing health-promoting antioxidant activity, are also used by the bees to collect honey nectar, leading to the transfer of these bioactive components into honey [The National Honey Board, 2002]. Honey is a natural sweet* Corresponding Author: Tel: +90 212 2857340; Fax: +90 212 2857333 E-mail: [email protected] (E. Capanoglu) ener produced by honeybees from the nectar of blossoms (floral (nectar) honey) and from secretions of living parts of plants or excretions of plant-sucking insects on the living part of plants (honeydew honey) [Persano Oddo et al., 2004]. Honey is reported to be an important source of antioxidants, including flavonoids, phenolic acids, carotenoid derivatives, organic acids, Maillard reaction products, etc. [Gheldof & Engeseth, 2002; Aljadi & Kamaruddin, 2004]. Various literature studies pointed out the antimicrobial [Alvarez-Suarez et al., 2013; Al-Waili et al., 2011; Alzahrani et al., 2012; Chang et al., 2011; Israili, 2014], antioxidant [Alvarez-Suarez et al., 2012a, b; Alzahrani et al., 2012], antiinflammatory, and antitumoral properties [Alvarez-Suarez et al., 2013] of honey, as well as its potential use in combination with conventional therapy as a novel antioxidant in the management of chronic diseases that are mostly related to the oxidative stress [Erejuwa et al., 2012]. The use of honey can be suggested to sweeten tea as a healthier way of tea consumption with the preferred sweet taste. However, based on our current literature search, there is no data on how the antioxidant potential of herbal infusions is affected by the addition of honey. Therefore, the aim of the present work was to determine and compare the influences of flower honey (nectar honey) and pine honey (honeydew honey) addition on the total phenolic and total flavonoid contents, as well as total antioxidant capacities of different © Copyright by Institute of Animal Reproduction and Food Research of the Polish Academy of Sciences © 2015 Author(s). This is an open access article licensed under the Creative Commons Attribution-NonCommercial-NoDerivs License (http://creativecommons.org/licenses/by-nc-nd/3.0/). 128 Antioxidative Properties of Honey-Added Herbal Teas herbal tea samples. In addition, the effect of the infusion temperature, at which honey was added, was also investigated. MATERIALS AND METHODS Honey and herbal tea samples Flower honey (from Marmaris, Mugla region of Turkey) and pine honey (from Eastern Anatolia region of Turkey) samples were collected, in duplicates in 2013, directly from beekeepers in Turkey, and tested for their total phenolic contents and total antioxidant activities before use. In order to establish the botanical origins of honey (floral, pine) samples, microscopic analysis, pollen and spore determination, conductivity, acidity, humidity, diastase and sugar profile analysis were performed along with sensory testing. Nectar honey samples were multifloral. Herbal tea samples, including melissa, green tea, rosehip, sage, echinacea, fennel, linden, daisy, and ginger teas, were supplied from a tea manufacturer in Turkey in the form of tea bags. Sample/extract preparation Herbal tea infusions were prepared by adding 200 mL of freshly boiled deionised water on a tea bag (2 g), and brewing for 3 min (taking the instructions on the package into consideration) without additional heating. Tea bags were removed and subsequently, flower honey or pine honey samples were added to these herbal tea infusions at 85˚C, 75˚C, 65˚C, and 55˚C of infusion temperatures, measured using a thermometer (ISOLAB Laborgerate GmbH, Germany), and at a concentration of 7.5 g honey/100 mL tea. Infusions without any honey addition were used as controls. For both the honey-added extracts and the controls, the analyses of total phenolics, flavonoids and antioxidant capacity were conducted after cooling the samples to room temperature. All honey-added and control infusions were prepared in triplicates. Analytical protocols Hydroxymethylfurfural (HMF) content of honey samples was determined using the spectrophotometric method described in Turkish Honey Standard [TS 3036, 2002]. The method was based on the colorimetric reaction among p-toluidine, barbituric acid and HMF forming a red colored complex. The absorbance was measured at 550 nm and the HMF was quantified using the following formula: HMF(mg/kg) = A550 × 192 where A550 is the absorbance measured at 550 nm and 192 is a theoretical value linked to the molar extinction coefficient of HMF. Total phenolic (TP) content was determined according to the Folin-Ciocalteau method described previously by Velioglu et al. [1998]. In brief, 0.1 mL of sample was added to 0.75 mL of Folin-Ciocalteau reagent. The mixture was allowed to stand for 5 min and then 0.75 mL of 6% sodium carbonate solution was added to the mixture. After 2 h of incubation at room temperature, absorbance was read at 725 nm. The results were expressed as mg gallic acid equivalent (GAE)/L tea. Total flavonoid (TF) content was measured using the colorimetric assay developed by Zhishen et al. [1999]. At time zero, 1 mL of sample was mixed with 0.3 mL of 5% NaNO2 solution. After 5 min, 0.3 mL of 10% AlCl3 was added. At the 6th min, 2 mL of 1 mol/L NaOH was added to the mixture. Immediately, 2.4 mL of distilled water was added and the absorbance was read at 510 nm. The results were given as mg catechin equivalent (CE)/ L tea. Total antioxidant capacity (TAC) was estimated using two in vitro tests in parallel. The DPPH (1,1-diphenyl-2-picrylhydrazyl) method was performed as described by Kumaran & Karunakaran [2006]. 0.1 mL of each sample extract was mixed with 2 mL of 0.1 mmol/L DPPH in methanol. After 30 min of incubation at room temperature, the absorbance of the mixture was measured at 517 nm. The CUPRAC (Cupric Reducing Antioxidant Capacity) method was applied using the protocol reported by Apak et al. [2004]. 0.1 mL of extract was mixed with 1 mL of 10 mmol/L CuCl2, 7.5 mmol/L neocuproine and 1 mol/L NH4Ac (pH:7). Immediately, 1 mL of distilled water was added to the mixture to make the final volume of 4.1 mL. After 60 min of incubation at room temperature, absorbance was read at 450 nm. The results were given as Trolox (6-hydroxy- 2,5,7,8-tetramethylchroman2-carboxylic acid) equivalent (TE)/ L tea. Statistical analysis Statistical analysis was applied to the data obtained from the samples that were subjected to each assay in triplicates. Minitab software (version 16.1.0) was used for the one-way ANOVA and pairwise comparisons between the treatments (honey varieties and temperatures) were done using Tukey test with a 95% confidence level. The correlation coefficients (R2) for results of the two spectrophotometric assays were calculated using Microsoft Office Excel 2011 software (Microsoft Corporation, Redmond, WA, US). RESULTS Hydroxymethylfurfural (HMF) content of honey samples The HMF contents of the flower and pine honey samples were determined to check for an acceptable quality of the honey samples that were subjected to high temperatures. The maximum value for HMF content of honey after processing and/or blending, is fixed as 40 mg/kg by the Codex standard [Codex Stan 12–1981, Rev 2 2001]. The concentrations found in the current study were very low (below the Codex limit) both in flower and pine honey samples, ranging between 4.6–8.1 mg/kg. Changes in total phenolic and total flavonoid contents of tea samples added-with-honey The results obtained for TP and TF contents were represented in Table 1. Melissa, green tea, and rosehip were the first three teas determined to have the highest TP contents (549, 465, and 397 mg GAE/L tea, respectively) than their controls, followed by sage, echinacea, fennel, linden, daisy, and ginger, respectively (71–268 mg GAE/L tea). The flower honey led to significant increases (p<0.05) in TP content of sage tea at all 129 G. Toydemir et al. TABLE 1. The changes in total phenolic and total flavonoid contents of 9 different herbal teas with flower honey and pine honey addition at 4 different tea temperatures* Honey–temperature Total phenolic content (mg GAE/L) Melissa Green tea Rosehip Sage Echinacea Fennel Linden Daisy Ginger Control 549±70a 465±42b 397±63b 268±28b 266±61c 123±21b 86±7b 73±17b 71±9cd Flower-55˚C 596±41a 533±78ab 493±43ab 343±26a 389±85ab 163±27ab 134±29ab 55±13b 58±2d Flower-65˚C 584±96a 543±36ab 521±54a 327±23a 449±101a 152±38ab 116±10ab 58±17b 60±2d Flower-75˚C 601±53a 547±68ab 525±61a 343±19a 361±64abc 174±28a 107±27ab 60±25b 57±4d Flower-85˚C 600±65a 563±63a 436±77ab 333±23a 378±63ab 166±33ab 144±16a 73±25b 93±10bc Pine-55˚C 659±101a 544±61ab 530±59a 336±8a 291±61bc 155±18ab 135±15a 134±33a 127±25a Pine-65˚C 680±111a 544±37ab 476±108ab 336±17a 279±51bc 145±38ab 140±16a 132±28a 128±11a Pine-75˚C 640±57a 552±21a 460±56ab 313±23a 293±65bc 134±22ab 136±32a 141±28a 111±16ab Pine-85˚C 584±72a 553±32a 417±68ab 340±12a 308±53bc 160±34ab 152±33a 138±22a 132±11a Honey–temperature Total flavonoid content (mg CE/L) Melissa Green tea Rosehip Sage Echinacea Fennel Linden Daisy Ginger Control 3705±170c 726±40a 962±88a 1421±121b 799±87a 219±35b 179±29c 145±7de 323±43a Flower-55˚C 4104±135ab 550±40de 743±74cd 1675±122ab 627±75bcd 157±9c 181±23bc 131±11e 249±10bcd Flower-65˚C 4018±72abc 541±63e 702±51d 1583±74ab 644±66bcd 162±9c 200±31abc 145±7cde 258±16bcd Flower-75˚C 3876±156bc 571±51cde 803±97bcd 1703±53a 575±103d 166±17c 216±34abc 146±8cde 244±7cd Flower-85˚C 3858±447bc 563±64cde 686±76d 1650±279ab 623±99cd 164±6c 181±20bc 154±11bcd 223±17d Pine-55˚C 4128±107ab 629±28bcd 846±48abc 1768±161a 780±79ab 240±25ab 220±32abc 175±12a 293±23abc Pine-65˚C 4271±262a 637±22bc 900±58ab 1851±203a 762±84abc 262±12a 262±49a 170±13ab 290±46abc Pine-75˚C 4171±129ab 682±29ab 880±87abc 1564±197ab 759±81abc 245±22ab 262±44a 162±9abc 308±34ab Pine-85˚C 3977±211abc 658±22ab 786±36bcd 1756±141a 777±46abc 235±22ab 243±44ab 162±8abc 304±48abc * Data represent average values ± standard deviation of three independent samples. Different letters in the columns represent statistically significant differences (p<0.05). Control samples were tea samples with no added-honey. GAE: gallic acid equivalent; CE: catechin equivalent. infusion temperatures of honey addition. On the other hand, flower honey-added green tea and linden tea gave significantly higher (p<0.05) values at 85˚C, rosehip tea at 65˚C and 75˚C, echinacea tea at 55˚C, 65˚C, and 85˚C, and fennel tea at 75˚C of honey addition temperatures. Flower honey did not result in any significant changes (p>0.05) in TP content of melissa, daisy, and ginger tea samples. The pine honey addition into sage, linden, daisy, and ginger tea resulted in significantly higher (p<0.05) TP contents, in comparison to their controls, at all temperatures. While significant increases were obtained in TP contents of green tea at 75˚C and 85˚C and rosehip tea at 55˚C, pine honey addition did not make a significant change in TP contents of melissa, echinacea, and fennel tea samples, at any temperature. The TF contents of melissa, sage, and rosehip tea were found to be the highest among the analysed tea samples (3705, 1421, and 962 mg CE/L tea, respectively), followed by echinacea, green tea, ginger, fennel, linden, and daisy teas, respectively (145–799 mg CE/L tea). The TF content results obtained for the flower honey addition indicated significant increases (p<0.05) in TF content of melissa tea at 55˚C and sage tea at 75˚C, only. On the other hand, flower honey-added green tea, rosehip, echinacea, fennel, and ginger tea samples were determined to have significantly reduced (p<0.05) TF contents at any temperature of honey addition. TF contents of daisy and linden tea did not change significantly with flower honey. The TF content measurements for pine honey-added tea samples revealed that pine honey addition resulted in significant increases (p<0.05) in TF contents of melissa tea at 55˚C, 65˚C, and 75˚C, sage tea at 55˚C, 65˚C, and 85˚C, fennel tea at 65˚C, linden tea at 65˚C, 75˚C, and 85˚C, and daisy tea at all 4 infusion temperatures of honey addition. On the other hand, significant reductions were obtained, with pine honey addition, in green tea at 65˚C and in rosehip tea at 85˚C. TF contents of echinacea and ginger tea were not affected significantly with the addition of pine honey. Changes in total antioxidant capacity of tea samples added-with-honey The changes in total antioxidant capacity (TAC) values of different tea samples, with flower honey and pine honey ad- 130 Antioxidative Properties of Honey-Added Herbal Teas TABLE 2. The changes in total antioxidant capacity of 9 different herbal teas with flower honey and pine honey addition at 4 different tea temperatures. Honey–temperature Total antioxidant capacity, DPPH Method (mg TE/L) Melissa Green tea Rosehip Sage Echinacea Fennel Linden Daisy Ginger Control 1111±179ab 962±162b 684±113a 441±29b 273±51abc 78±22b 64±13c 43±12c 100±15b Flower-55˚C 989±114ab 1069±207ab 613±137a 522±67ab 261±28abc 82±8ab 105±14ab 23±9c 133±32ab Flower-65˚C 975±123ab 1106±121ab 629±135a 541±21ab 220±13c 87±14ab 97±12ab 33±9c 125±19ab Flower-75˚C 940±126b 1100±68ab 637±140a 545±59ab 220±13bc 97±13ab 89±14abc 44±10bc 157±17a Flower-85˚C 937±94b 1181±181a 586±119a 642±72a 231±24bc 77±8b 76±9bc 37±9c 124±16ab Pine-55˚C 1058±157ab 1131±43ab 594±32a 544±51ab 316±28ab 107±9a 85±20abc 60±5ab 98±15b Pine-65˚C 1102±132ab 1079±30ab 584±65a 575±46a 348±80a 98±13ab 102±11ab 61±4ab 100±17b Pine-75˚C 1179±130ab 1114±81ab 604±47a 527±48ab 313±54ab 107±11a 110±34a 70±6a 106±19b Pine-85˚C 1221±124a 1055±76ab 519±56a 544±58ab 287±73abc 104±16a 89±21abc 63±7ab 102±17b Honey–temperature Total antioxidant capacity, CUPRAC Method (mg TE/L) Melissa Green tea Rosehip Sage Echinacea Fennel Linden Daisy Ginger Control 2212±84 1813±277 1424±182 911±126 610±48 238±34 215±21 219±40 256±47b Flower-55˚C 2300±105a 1859±176ab 1484±82ab 1202±84a 660±35ab 299±24a 283±41ab 265±57abc 276±26ab Flower-65˚C 2390±78a 1895±281ab 1428±96ab 1119±100a 667±57ab 294±41ab 281±27ab 267±49abc 280±29ab Flower-75˚C 2262±106a 1852±104ab 1611±107a 1217±67a 661±67ab 358±23a 252±24bc 266±80abc 276±49ab Flower-85˚C 2329±28a 1810±314ab 1326±100ab 1155±112a 674±39ab 308±34a 272±26abc 251±53bc 271±27ab Pine-55˚C 2161±285ab 1929±188ab 1382±124ab 1167±78a 730±29a 339±39a 322±51a 339±18a 314±45ab Pine-65˚C 2145±171ab 1892±166ab 1428±260ab 1142±111a 706±67a 345±41a 339±54a 309±25ab 297±42ab Pine-75˚C 2155±202ab 2067±70ab 1389±176ab 1103±123a 702±38a 333±49a 337±49a 301±26ab 339±44a Pine-85˚C 1956±224b 2199±103a 1214±242b 1128±85a 729±29a 303±30a 302±34ab 278±21abc 296±62ab a b ab b b b c c * Data represent average values ± standard deviation of three independent samples. Different letters in the columns represent statistically significant differences (p<0.05). Control samples were tea samples with no added-honey. DPPH: 1,1-diphenyl-2-picrylhydrazyl; Cupric Reducing Antioxidant Capacity; TE: Trolox (6-hydroxy- 2,5,7,8-tetramethylchroman-2-carboxylic acid) equivalent. dition at 4 different infusion temperatures (55˚C, 65˚C, 75˚C, and 85˚C), were determined using 2 in vitro tests in parallel, which were DPPH and CUPRAC methods (Table 2). The highest TAC values, determined with DPPH method, were measured for melissa, green tea, and rosehip tea samples (1111, 962, and 684 mg TE/L, respectively), followed by sage, echinacea, ginger, fennel, linden, and daisy tea samples, respectively (43–441 mg TE/L) (Table 2). The results of DPPH method indicated that flower honey led to a significant increase (p<0.05) in TAC of green tea and sage tea at 85˚C, linden tea at 55˚C and 65˚C, and ginger tea at 75˚C. There was no change observed in TAC of flower honey-added melissa, rosehip, echinacea, fennel, and daisy tea samples, in comparison to their control infusions. The differences in TAC of pine-honey added tea infusions, measured using DPPH method, indicated significantly higher values (p<0.05) in pine honey-added sage tea at 65˚C, fennel tea at 55˚C, 75˚C, and 85˚C, linden tea at 65˚C and 75˚C, and daisy tea at all four temperatures of honey addition, in comparison to their control samples. Whereas, the TAC of melissa, green tea, rosehip, echinacea, and ginger tea did not show any significant change with the inclusion of pine honey. The highest TAC values, determined using CUPRAC method, were again in melissa, green tea, and rosehip tea (2212, 1813, and 1424 mg TE/L), followed by sage, echinacea, ginger, fennel, daisy, and linden, respectively (215– 911 mg TE/L). Flower honey increased the TAC of sage tea significantly (p<0.05) at all infusion temperatures. In addition, substantial increases were also obtained for flower honey-added fennel tea at 55˚C, 75˚C, and 85˚C, and linden tea at 55˚C and 65˚C. The TAC values of the remaining 6 tea samples, analysed with CUPRAC method, were not found to be affected significantly with flower honey addition at different temperatures. Pine honey-added sage, echinacea, fennel, and linden tea samples, analysed using CUPRAC method, were found to have significantly higher (p<0.05) TAC values at all temperatures of honey addition, compared to their control samples. Moreover, pine honey also provided significant increases in TAC of green tea at 85˚C, daisy tea at 55˚C, 65˚C, and 75˚C, and ginger tea at 75˚C. The TAC of rosehip tea did not change significantly with the inclusion of pine honey at 4 different infusion temperatures, whereas melissa tea was G. Toydemir et al. measured to have reduced TAC values when pine honey was added at 85˚C. The correlations between spectrophotometric assay results The linear correlation coefficients (R2) were calculated for plots of TP versus TF, TP versus DPPH, TP versus CUPRAC, TF versus DPPH, TF versus CUPRAC, and DPPH versus CUPRAC assay results. The lowest correlation was observed between TP and TF content values (R2=0.30118), while a highly linear relationship was determined between the results of DPPH and CUPRAC methods (R2=0.90073) (Figure 2A). Additionally, the linear curves obtained for CUPRAC versus TP (R2=0.73632) (Figure 2B) and CUPRAC versus TF (R2=0.54313) (Figure 2C) results had higher correlation coefficients than those observed for DPPH versus TP (R2=0.70238) and DPPH versus TF (R2=0.44324) results. DISCUSSION The effect of different types of honey Flower honey and pine honey addition either led to significant increases (p<0.05) or did not significantly change the TP contents of the honey-added tea samples compared to their controls. Flower honey provided a significantly higher (p<0.05) TP content value in echinacea tea at 65˚C in comparison to the value obtained with pine honey addition at the same temperature. On the other hand, pine honey-added daisy and ginger teas were measured to be significantly higher in their TP contents, at all temperatures of honey addition, compared to their flower-honey added counterparts (Table 1). It could be linked to the fact that honeys with darker color, as in the case of pine honey, have been reported to possess higher amounts of total phenolic compounds in recent research studies [Alvarez-Suarez et al., 2010; Escuredo et al., 2013; Kus et al., 2014 Wilczynska, 2010]. Kus et al. [2014] determined the TP contents of lighter honeys investigated in their study (black locust, goldenrod, rapeseed, and lime) to range in between 142.8–192.5 mg GAE/ kg; while this range for darker honeys (heather and buckwheat) was found to be from 306.2 to 1113.0 mg GAE/kg. In another study, the highest TP contents were again measured for darker colored honeys, including chestnut honey (1313 mg GAE/kg) and heather honey (1789 mg GAE/kg) [Escuredo et al., 2013]. The TP contents of the flower and pine honeys that we used in our work were 510 and 680 mg GAE/kg, respectively. The reason for not obtaining the same effect of pine honey for all the analysed tea samples could be related with the different phenolic profiles of the herbal tea samples or the lack of the specificity of the Folin-Ciocalteau method for phenolic compounds [Capanoglu et al., 2008]. The Folin-Ciocalteau method was reported to be suffering from a number of interfering substances, including specifically sugars, aromatic amines, ascorbic acid [Box, 1983], and amino acids and proteins [Meda et al., 2005] that can also react with Folin-Ciocalteau reagent. Thus, it was strongly suggested that corrections for those interfering substances should be made in order to establish a uniformly acceptable method of TP to compare the obtained results rationally [Prior et al., 2005]. The addition of pine and flower honey, at 4 infusion temperatures, was determined to affect the TF contents of differ- 131 ent tea samples in different ways, including the effects of all significant increases/decreases or not any significant changes (p<0.05). It was remarkable that flower honey addition led to significant decreases (p<0.05) in TF contents of five (out of nine) tea samples, including green tea, rosehip, echinacea, fennel, and ginger, at all temperatures of honey addition. On the other hand, pine honey addition did not significantly change or even increased the TF contents of tea samples (except for green tea at 55˚C and 65˚C, and rosehip tea at 85˚C) (Table 1). Silici et al. [2013] reported catechin and epicatechin as the only compounds that were determined as the kind of flavonoids in honeydew honey samples, which were also determined to constitute the largest content (53% of detected total phenolics) of total phenolics in the analysed honeydew honey samples. On the other hand, the contribution of catechin and epicatechin components to the TP content of nectar honeys was found to be 33% of the detected phenolics [Silici et al., 2013]. This could have an influence on these higher TF contents of pine honey-added-tea samples in our study, since the results for TF content analysis have been expressed as catechin equivalents (Table 1). The results obtained by DPPH method, for the changes in TAC of different tea samples added-with-flower honey revealed significant increases (p<0.05) in TAC of green tea (at 85˚C), sage tea (at 85˚C), linden tea (at 55˚C and 65˚C), and ginger tea (at 75˚C). On the other hand, again with the same method pine honey was observed to lead to significant increases (p<0.05) in TAC of sage tea (at 65˚C), fennel tea (at 55˚C, 75˚C, and 85˚C), linden tea (at 65˚C and 75˚C) and daisy tea (at all temperatures). When the flower honey and pine honey were compared for their influences on TAC, at the same temperature of honey addition, pine honey was found to differ from flower honey with its significantly higher (p<0.05) contribution to the TAC of echinacea tea (at 65˚C), fennel tea (at 85˚C), and daisy tea (at all 4 temperatures). For the other tea samples, pine honey and flower honey did not significantly differ (p>0.05) (Table 2). The TAC values measured with CUPRAC method indicated significantly increased (p<0.05) TAC by the effect of pine honey addition in five (out of nine) tea samples, including sage, echinacea, fennel, linden, and daisy, independent from the infusion temperatures tested (except for the daisy tea at 85˚C). Flower honey was found to contribute significantly to the TAC of sage tea (at all temperatures), fennel tea (at 55˚C, 75˚C, and 85˚C), and linden tea (at 55˚C and 65˚C). In addition, the comparison of the flower honey-added and pine honey-added tea samples, at the same temperature of honey addition, revealed no significant differences regarding their TAC measured by CUPRAC method (except for melissa tea at 85˚C and linden tea at 75˚C). On the other hand, pine honey had a greater contribution to the TAC values of tea samples in comparison to their respective control tea samples (Table 2). These relatively higher TAC values provided by pine honey could be explained based on the findings of other studies, which have pointed out that honey samples that are darker in their color have higher antioxidant capacities in general [Alvarez-Suarez et al., 2010; Kus et al., 2014; Wilczynska, 2010] since honey color depends on the potential alkalinity and ash content, as well as on the antioxidatively 132 The effect of different infusion temperatures of honey addition The results obtained for TP contents of honey-added-tea samples pointed out that the highest values, although not all were statistically different from control samples, were generally obtained with the addition of flower/pine honey at infusion temperatures of 75˚C and 85˚C (except for echinacea tea for flower honey addition, and melissa and rosehip teas for pine honey addition). The TF contents of flower honey-added-tea samples were again mainly higher at 75˚C and 85˚C of honey addition temperatures compared to the other infusion temperatures of honey addition. However, it should be emphasized that these relatively higher values obtained at 75˚C/85˚C, in comparison to the other infusion temperatures, of flower honey addition were mostly significantly lower or were not significantly different from the respective control tea samples (Table 1). On the other hand, when pine honey was added into tea samples at 65˚C and 75˚C of infusion temperatures, it provided relatively higher TF contents in comparison to the other infusion temperatures of honey addition. Whereas some of these TF content values, obtained for 65˚C/75˚C of pine honey addition temperatures, were still lower than the values obtained for respective control tea samples (including green tea, rosehip, and ginger tea samples) (Table 1). The TAC of flower/pine honey added-tea samples, determined using DPPH method, were again found to be higher at 75˚C and 85˚C of honey addition temperatures compared to the other infusion temperatures of honey addition. On the other hand, the measurement of TAC values with CUPRAC method gave higher values at 65˚C and 75˚C of infusion temperatures for flower honey addition, and at 55˚C and 65˚C of infusion temperatures for pine honey addition (Table 2). When all the results were evaluated in general, it could be concluded that the addition of flower/pine honey into different tea samples at 75˚C and (to a lesser extent) at 85˚C gave relatively high values of TP and TF contents, as well as TAC, in comparison to the other tested temperatures. The percent changes in TP content (Figure 1A) and TAC values, determined using CUPRAC method (Figure 1B), obtained with flower/pine honey addition at 75˚C are given in Figure 1 as the representative graphs. The flower and pine honey additions into tea samples at 75˚C were determined to lead up to 41% and 57% increases in TP contents (Figure 1A), and up to 50% and 57% increases in TAC values, determined using CUPRAC method (Figure 1B), respectively. These higher values at higher temperatures may depend on the formation of Maillard reaction products, melanoidins, which have been reported to act as antioxidants [Brudzynski 160 % change, TP 100 ab a a a ab a ab bc a a b b ab a abc a 120 a a A 140 b c ab b b b cd b d daisy ginger 80 60 40 20 0 melissa 160 greentea roschip sage echinasea fennel linden a B a a 140 ab a ab a 120 ab a abc a a ab ab % change, CUPRAC active pigments, such as carotenoids and flavonoids [Frankel et al., 1998]. Alvarez-Suarez et al. [2010] reported the TAC values of honeys tested in their study to range in between 1035 and 2945 μmol TE/kg which was linearly correlated with the color range of the honeys changing from light to amber. Accordingly, the TAC of the darker-colored pine honey (4075 mg TE/kg), used in this work, was higher in comparison to the TAC of the lighter flower honey (3545 mg TE/kg). Antioxidative Properties of Honey-Added Herbal Teas 100 a a ab b ab melissa greentea ab ab b b b b c b 80 60 40 20 0 control roschip sage echinasea fennel flower honey-added linden daisy ginger pine honey-added FIGURE 1. The percent changes in (A) Total phenolic (TP) contents and (B) Total antioxidant capacity (TAC) values, determined using Cupric Reducing Antioxidant Capacity (CUPRAC) assay, of the analysed tea samples with flower and pine honey addition at 75˚C. Different letters on the columns represent the statistically significant (p<0.05) differences observed with flower or pine honey addition into a herbal infusion at 75˚C. (See Table 1 (for TP content data) and Table 2 (for TAC data obtained via CUPRAC method) for the complete statistical data). & Miotto, 2011a,b,c; Turkmen et al., 2006]. Turkmen et al. [2006], who studied the effect of heating honey to 50˚C, 60˚C, and 70˚C on the antioxidant activity and brown pigment formation due to Maillard reaction, determined that both of the measured values increased with the increased temperature. The authors evaluated that the increase in brown pigment formation, due to the formation of Maillard reaction products, was accompanied with the increase in antioxidant activity, which was more remarkable in heated honey samples at 70˚C than those at 50˚C and 60˚C [Turkmen et al., 2006]. In addition, these Maillard reaction products were also reported to react with Folin-Ciocalteau reagent [Verzelloni et al., 2007] which could explain the higher TP content values in honey added tea samples, specifically at higher temperatures of honey addition. In another study, Brudzynski & Miotto [2011a] hypothesized that phenolics in honey may be components of melanoidin structure, and they tested the melanoidin fractions of unheated and heat-treated honey samples for their total phe- 133 G. Toydemir et al. 3000 nioti & Zervalaki, 2001; Fallico et al., 2004]. HMF formation in honey could be influenced by the chemical properties of honey, including pH, total acidity, mineral content, etc., which are dependent on the floral source from which the honey sample has been extracted [Anam & Dart, 1995; Bath & Singh, 1999]. So, the inclusion of honey samples obtained from different floral sources can provide different levels of HMF contents. A CUPRAC (mg TE/L) 2500 2000 1500 1000 500 R2 = 0.9007 0 0 500 1000 1500 2000 DPPH (mg TE/L) 3000 B CUPRAC (mg TE/L) 2500 2000 1500 1000 500 R2 = 0.7363 0 0 200 400 600 800 1000 TP (mg GAE/L) 3000 C CUPRAC (mg TE/L) 2500 2000 1500 1000 500 R2 = 0.5431 0 0 1000 2000 3000 4000 5000 TF (mg CE/L) FIGURE 2. The linear correlation coefficients (R2) calculated for plots of (A) 1,1-diphenyl-2-picrylhydrazyl (DPPH) versus Cupric Reducing Antioxidant Capacity (CUPRAC), (B) Total phenolics (TP) versus CUPRAC, and (C) Total flavonoids (TF) versus CUPRAC assay results. nolic contents. Their results indicated a significant increase in the TP content in melanoidin fractions of the heat-treated honeys as compared to the TP content in melanoidin fractions of their unheated counterparts. This could also explain the reaction between Maillard reaction products and the Folin-Ciocalteau reagent. Because of the fact that heating of honey leads to the formation of HMF (5-hydroxymethylfurfural), as a result of the hexose dehydration in acid media [Belitz & Grosch, 1999], we also checked the HMF contents of the honey samples that were subjected to high temperatures in our study, and confirmed that the HMF contents were all below the limit value (40 mg/kg). HMF is considered as an important quality parameter for honey by means of evaluating the freshness and the heating and storage history [Karabour- The relationships between the results of the applied spectrophotometric assays The correlation coefficients (R2) calculated between the applied spectrophotometric methods showed that the results of the CUPRAC assay correlated better with the TP and TF contents of different herbal tea samples, compared to the DPPH assay results. Besides, good correlations were also observed between the results of DPPH and CUPRAC assays (Figure 2). In accordance with our results, CUPRAC method was proved to correlate well with ABTS and Folin-Ciocalteau assays in herbal plant infusions [Apak et al., 2006], apricot [Guclu et al., 2006], and kiwifruit [Park et al., 2006] extracts. Apak et al. [2006] reported the CUPRAC assay as the most consistent method of total antioxidant measurement in relation to Folin reagent-responsive TP content, since this method is suitable for and reacts with a variety of antioxidant compounds regardless of chemical type or hydrophilicity. Additionally, the linear correlation determined between CUPRAC and ABTS assays (R2=0.8) has been linked to the fact that these methods are similar electron transfer-based antioxidant assays [Apak et al., 2007], which can also be evaluated for the high correlation found out between DPPH and CUPRAC assays (R2=0.90073) in this present work. However, it is worth to remark that although there are a number of methods that have been developed to assess the antioxidant capacity of either pure antioxidant compounds or products containing complex mixture of antioxidants, there is still lack of correlation between the results obtained for the same compound/product by different assays, as well as by the same assay in different laboratories [Niki, 2011]. On the other hand, lower correlation coefficients were obtained between TF assay results and the results of the other three assays. Similarly, Park et al. [2006] and Meda et al. [2005] reported low correlations between ABTS, CUPRAC or TP content results and TF contents, which was linked to the nature of the measurement technique used for total flavonoids. The aluminum chloride (AlCl3) colorimetric test used for flavonoid analysis has been pointed out to be sensitive only for flavonoid groups that possess the characteristic chelating functional groups for Al binding (i.e. flavones and flavonols), while this method does not measure the flavonoids that do not include these functional groups (i.e. flavanones). This leads to the underestimation of the TF content by using this aluminum chloride method [Chang et al., 2002]. CONCLUSION The comparison on the effect of flower and pine honey addition into 9 different herbal tea samples at 4 different temperatures revealed that the TP content and TAC values 134 of the honey-added-tea samples were generally higher than those of the control tea samples, specifically with pine honey addition and at higher temperatures. These findings support the use of honey as a natural sweetener in tea drink in order to be able to benefit from the health-enhancing antioxidative properties of these two promising food products. ACKNOWLEDGEMENTS This project was financially supported by Istanbul Development Agency “Center of Excellence in Bee Products” project (Project Number: TR10/14/YEN/0028). Fatma Damla Bilen, Diyar Selimoglu, Gulbeyaz Cevik, and Oznur Aydın are acknowledged for analytical support. REFERENCES 1. Aljadi A.M., Kamaruddin M.Y., Evaluation of the phenolic contents and antioxidant capacities of two Malaysian floral honeys. Food Chem., 2004, 85, 513–518. 2. Alvarez-Suarez J.M., Giampieri F., Battino M., Honey as a source of dietary antioxidants: Structures, bioavailability and evidence of protective effects against human chronic diseases. Curr. Med. Chem., 2013, 20, 621–638. 3. Alvarez-Suarez J.M., Giampieri F., Damiani E., Astolfi P., Fattorini D., Regoli F., Quiles J.L., Battino M., Radical-scavenging activity, protective effect against lipid peroxidation and mineral contents of monofloral Cuban honeys. Plant Foods Hum. Nutr., 2012a, 67, 31–38. 4. Alvarez-Suarez J.M., Giampieri F., Gonzalez-Paramas A.M., Damiani E., Astolfi P., Martinez-Sanchez G., Bompadre S., Quiles J.L., Santos-Buelga C., Battino M., Phenolics from monofloral honeys protect human erythrocyte membranes against oxidative damage. Food Chem. Toxicol., 2012b, 50, 1508–1516. 5. Alvarez-Suarez J.M., Tulipani S., Diaz D., Estevez Y., Romandini S., Giampieri F., Damiani E., Astolfi P., Bompadre S., Battino M., Antioxidant and antimicrobial capacity of several monofloral Cuban honeys and their correlation with color, polyphenol content and other chemical compounds. Food Chem. Toxicol., 2010, 48, 2490–2499. 6. Al-Waili N.S., Salom K., Butler G., Al Ghamdi A.A., Honey and microbial infections: a review supporting the use of honey for microbial control. J. Med. Food., 2011, 14, 1079–1096. 7. Alzahrani H.A., Alsabehi R., Boukraa L., Abdellah F., Bellik Y., Bakhotmah B.A., Antibacterial and antioxidant potency of floral honeys from different botanical and geographical origins. Molecules, 2012, 17, 10540–10549. 8. Anam O.O., Dart R.K., Influence of metal ions on hydroxymethylfurfural formation in honey. Anal. Proc. Incl. Anal. Commun., 1995, 32, 515–517. 9. Apak R., Guclu K., Ozyurek M., Karademir S.E., Novel total antioxidant capacity index for dietary polyphenols and vitamins C and E, using their cupric ion reducing capability in the presence of neocuproine: CUPRAC method. J. Agric. Food Chem., 2004, 52, 7970–7981. 10. Apak R., Guclu K., Ozyurek M., Karademir S.E., Ercag E., The cupric ion reducing antioxidant capacity and polyphenolic content of some herbal teas. Int. J. Food Sci. Nutr., 2006, 57, 292–304. Antioxidative Properties of Honey-Added Herbal Teas 11. Apak R., Guclu K., Demirata B., Ozyurek M., Celik S.E., Bektasoglu B., Berker K.I., Ozyurt D., Comparative evaluation of various total antioxidant capacity assays applied to phenolic compounds with the CUPRAC assay. Molecules, 2007, 12, 1496–1547. 12. Bath P.K., Singh N., A comparison between Helianthus annuus & Eucalyptus lanceolatus honey. Food Chem., 1999, 67, 389–397. 13. Belitz H.D., Grosch W., Food Chemistry. 1999, Springer-Verlag; Berlin, Germany, pp. 252–261. 14. Box J.D., Investigation of the Folin-Ciocalteau phenol reagent for the determination of polyphenolic substances in natural waters. Water Res., 1983, 17, 511–525. 15. Brudzynski K., Miotto D., Honey melanoidins: Analysis of the compositions of the high molecular weight melanoidins exhibiting radical-scavenging activity. Food Chem., 2011a, 127, 1023–1030. 16. Brudzynski K., Miotto D., The recognition of high molecular weight melanoidins as the main components responsible for radical-scavenging capacity of unheated and heat-treated Canadian honeys. Food Chem., 2011b, 125, 570–575. 17. Brudzynski K., Miotto D., The relationship between the content of Maillard reaction-like products and bioactivity of Canadian honeys. Food Chem., 2011c, 124, 869–874. 18. Capanoglu E., Beekwilder J., Boyacioglu D., Hall R., De Vos R., Changes in antioxidant and metabolite profiles during production of tomato paste. J. Agric. Food Chem., 2008, 56, 964–973. 19. Chang X., Wang J., Yang S., Chen S., Song Y., Antioxidative, antibrowning and antibacterial activities of sixteen floral honeys. Food Funct., 2011, 9, 541–546. 20. Chang C.C., Yang M.H., Wen H.M., Chern J.C., Estimation of total flavonoid content in propolis by two complementary colorimetric methods. J. Food Drug Anal., 2002, 10, 178–182. 21. Codex standard for honey, codex stan-12 (1981, REV 2 2001) [http://www.codexalimentarius.org/input/download/standards/310/cxs_012e.pdf]. Retrieved November 24, 2013. 22. Craig W.J., Health-promoting properties of common herbs. Am. J. Clin. Nutr., 1999, 70, 491S-499S. 23. Erejuwa O.O., Sulaiman S.A., Ab Wahab, M.S., Honey: a novel antioxidant. Molecules, 2012, 17, 4400–4423. 24. Escuredo O., Fernandez-Gonzalez M., Rodriguez-Flores M.S., Seijo-Rodriguez A., Seijo-Coello M.C., Influence of the botanical origin of honey from north western Spain in some antioxidant components. J. Api. Sci., 2013, 57, 5–14. 25. Fallico B., Zappala M., Arena E., Verzera, A., Effects of conditioning on HMF content in unifloral honeys. Food Chem., 2004, 85, 305–313. 26. Frankel S., Robinson G.E., Berenbaum M.R., Antioxidant capacity and correlated characteristics of 14 unifloral honeys. J. Apic. Res., 1998, 37, 27–31. 27. Gheldof N., Engeseth N.J., Antioxidant capacity of honeys from various floral sources based on the determination of oxygen radical absorbance capacity and inhibition of in vitro lipoprotein oxidation in human serum samples. J. Agric. Food Chem., 2002, 50, 3050–3055. 28. Guclu K., Altun M., Ozyurek M., Karademir S.E., Apak R., Antioxidant capacity of fresh, sun- and sulfited-dried Malatya apricot (Prunus Armeniaca) assayed by CUPRAC, ABTS/TEAC and Folin methods. Int. J. Food Sci. Technol., 2006, 41, 76–85. G. Toydemir et al. 29. Israili Z.H., Antimicrobial properties of honey. Am. J. Ther., 2014, 21, 304–323. 30. Karabournioti S., Zervalaki P., The effect of heating on honey HMF and invertase. Apiacta, 2001, 36, 177–181. 31. Keli S.O., Hertog M.G.L., Feskens E.J.M., Kromhout D., Dietary flavonoids, antioxidant vitamins, and incidence of stroke. Arch. Intern. Med., 1996, 156, 637–642. 32. Kumaran A., Karunakaran R.J., Antioxidant and free radical scavenging activity of an aqueous extract of Coleus aromaticus. Food Chem., 2006, 97,109–114. 33. Kus P.M., Congiu F., Teper D., Sroka Z., Jerkovic I., Tuberoso C.I.G., Antioxidant activity, color characteristics, total phenol content and general HPLC fingerprints of six Polish unifloral honey types. LWT-Food Sci. Technol., 2014, 55, 124–130. 34. Meda A., Lamien C.E., Romito M., Millogo J., Nacoulma O.G., Determination of the totalphenolic, flavonoid and proline contents in Burkina Fasan honey, as well as their radical scavenging activity. Food Chem., 2005, 91, 571–577. 35. Niki E., Antioxidant capacity: Which capacity and how to assess it? J. Berry Res., 2011, 1, 169–176. 36. Park Y.S., Jung S.T., Kang S.G., Delgado-Licon E., Katrich E., Tashma Z., Trakhtenberg S., Gorinstein S., Effect of ethylene treatment on kiwifruit bioactivity. Plant Foods Hum. Nutr., 2006, 61, 151–156. 37. Persano Oddo L., Piana L., Bogdanov S., Bentabol A., Gotsiou P., Kerkvliet J., Martin P., Morlot M., Ortiz Valbuena A., Ruoff K., Von der Ohe K., Botanical species giving unifloral honey in Europe. Apidologie, 2004, 35, 82–93. 38. Prior R.L., Wu X., Schaich K., Standardized methods for the determination of antioxidant capacity and phenolics in foods and dietary supplements. J. Agric. Food Chem., 2005, 53, 4290–4302. 39. Shahidi F., Antioxidants in food and food antioxidants. Nahrung, 2000, 44, 158–163. 135 40. Silici S., Sarioglu K., Karaman K., Determination of polyphenols of some Turkish honeydew and nectar honeys using HPLC-DAD. J. Liq. Chromatogr. Relat. Technol., 2013, 36, 2330–2341. 41. The National Honey Board, 2002, Honey – health and therapeutic qualities. Available from: [www.nhb.org/download/factsht/ compendium.pdf] (12 11 04). 42. Trevisanato S.I., Young-in Kim M.D., Tea and health. Nutr. Rev., 2000, 58, 1–10. 43. Turkish Honey Standard. TS 3036, 2002, Ankara, Turkey. 44. Turkmen N., Sari F., Poyrazoglu E.S., Velioglu Y.S., Effects of prolonged heating on antioxidant activity and colour of honey. Food Chem., 2006, 95, 653–657. 45. Van Dokkum W., Frolich W., Saltmarsh M., Gee J., The health effects of bioactive plant components in food: results and opinions of the EU COST 926 action. Br. Nutr. Foundation Nutr. Bull., 2008, 33, 133–139. 46. Velioglu Y.S., Mazza G., Gao L., Oomah B.D., Antioxidant activity and total phenolics in selected fruits, vegetables, and grain products. J. Agric. Food Chem., 1998, 46, 4113–4117. 47. Verzelloni E., Tagliazucchi D., Conte A., Relationship between the antioxidant properties and the phenolic and flavonoid content in traditional balsamic vinegar. Food Chem., 2007, 105, 564–571. 48. Wilczynska A., Phenolic content and antioxidant activity of different types of Polish honey – A short report. Pol. J. Food Nutr. Sci., 2010, 60, 309–313. 49. Zhishen J., Mengcheng T., Jianming W., The determination of flavonoid contents in mulberry and their scavenging effects on superoxide radicals. Food Chem., 1999, 64, 555–559. Submitted: 22 July 2014. Revised: 31 October and 28 November 2014. Accepted: 26 January 2015. Published on-line: 15 April 2015. Pol. J. Food Nutr. Sci., 2015, Vol. 65, No. 2, pp. 137–142 DOI: 10.1515/pjfns-2015-0006 http://journal.pan.olsztyn.pl Original article Section: Food Quality and Functionality Influence of Sweetness and Ethanol Content on Mead Acceptability Teresa Gomes, Teresa Dias, Vasco Cadavez, João Verdial, Jorge Sá Morais, Elsa Ramalhosa*, Letícia M. Estevinho Mountain Research Centre (CIMO), ESA - Polytechnic Institute of Bragança, Campus de Stª Apolónia, Apartado 1172, 5301–855 Bragança, Bragança, Portugal Key words: mead, sweetness, ethanol content, fermentations, sensory analysis Mead is a traditional alcoholic beverage obtained by fermenting mead wort; however, its production still remains frequently an empirical exercise. Different meads can be produced, depending on fermentation conditions. Nevertheless, to date few studies have been developed on factors that may influence mead quality. The main objective of this work was to study the influence of sweetness and ethanol content on mead acceptability. Different meads were produced with two sweetness levels (sweet and dry meads) and three ethanol contents (18, 20, 22% (v/v)), adjusted by brandy addition. Afterwards, meads acceptability was evaluated by sensory analysis through a consumers’ panel (n=108) along with chemical analysis by HPLC-RID of glucose, fructose, ethanol, glycerol and acetic acid. The sweet (75 gglucose+fructose/L) and dry (23 gglucose+fructose/L) meads presented glycerol contents equal to 5.10±0.54 and 5.96±0.95 g/L, respectively, that were desirable since glycerol improves mead quality. Low concentrations of acetic acid were determined (0.46±0.08 and 0.57±0.09 g/L), avoiding the vinegar off-character. Concerning sensory analysis, the alcohol content of mead had no effect on the sensory attributes studied, namely, aroma, sweetness, flavour, alcohol feeling and general appreciation. Regarding sweetness, the “sweet meads” were the most appreciated by the consumers (score of 5.4±2.56), whereas the “dry meads” (score of 2.7±2.23) showed low acceptability. In conclusion, this work revealed that sweetness is a sensory key attribute for mead acceptance by the consumers, whereas ethanol content (18 to 22% (v/v)) is not. INTRODUCTION Beekeeping is an important income-generating activity in several countries. Portugal is no exception. In rural communities of NE of Portugal, honey production is of great importance; however, sometimes local beekeepers face problems during the sale of their productions due to the low prices practised in international markets. Thus, the development of new honey products can contribute to overcome this problem, to strengthen the local economy and to increase honey production activity competiveness. Mead is a traditional alcoholic beverage obtained by fermenting mead wort and can represent a good solution to honey over-production and a way of valorising honey of lower quality. Its production has been known since ancient times; however, it still remains frequently an empirical and traditional exercise. Some problems are often encountered during mead production, such as: delayed or arrested fermentations, production of unpleasant flavors, poor quality and inconsistency of the final product [Attfield, 1997; Bisson, 1999]. These problems are due to the high sugar and low nutrient contents of honey; its natural antifungal components; and the inability of yeast strains to adapt to these unfavourable growth conditions [Roldán et al., 2011]. * Corresponding Author: E-mail: [email protected] (Elsa Cristina Dantas Ramalhosa, Ph.D.) In order to overcome some of these fermentation problems, several research studies have been conducted by our research group focusing on the influence of mead wort composition [Pereira et al., 2009] and the effect of production scale and operational conditions on final product quality [Gomes, 2010; Gomes et al., 2010, 2011]. The role of using different Saccharomyces strains [Caridi et al., 1999] and types of honey [Vidrih & Hribar, 2007] on mead production, immobilized ethanol-tolerant yeasts [Navratil et al., 2001], must formulation [Mendes-Ferreira et al., 2010], different heat treatments of honey solutions [Kime et al., 1991a], application of ultra-filtration of honey solution [Kime et al., 1991b], and inoculum size and yeast pitching rate [Pereira et al., 2013], as well as the addition of black rice grains [Katoh et al., 2011] or pollen [Roldán et al., 2011], on mead quality and aroma profile have already been studied by other research groups. Concerning sensory properties of mead, these are very important for its acceptance by the final consumer. Until now, few studies have been performed on this subject. Only the effects of honey type [Vidrih & Hribar, 2007; Gupta & Sharma, 2009], heat treatment [Kime et al., 1991a], ultrafiltration [Kime et al., 1991b], pollen [Roldán et al., 2011] and black rice grains [Katoh et al., 2011] addition on mead sensory properties have been studied. Nevertheless, sweetness and ethanol content of beverages are fundamental characteristics for their acceptability by the consumer. Smogrovicova © Copyright by Institute of Animal Reproduction and Food Research of the Polish Academy of Sciences © 2015 Author(s). This is an open access article licensed under the Creative Commons Attribution-NonCommercial-NoDerivs License (http://creativecommons.org/licenses/by-nc-nd/3.0/). 138 et al. [2012] verified that different meads have distinct residual sugar contents, reporting that South African meads presented a mean residual sugar content about 70 g/L, whereas higher concentrations were determined in Slovak meads. Nevertheless, in that work no organoleptic studies were performed and so until now nothing is known about the role of sweetness and ethanol content on mead acceptability. As fermentation time influences sugar content and alcohol content, longer times will lead to fewer sugars and higher ethanol concentrations in the final product. Hence, fermentations performed along different time periods will lead to products with different physico-chemical and sensory properties. In spite of this, the main objective of this work was to study the influence of sweetness and ethanol content on mead acceptability. So, different meads were obtained by allowing the fermentation process to take place along different times. Then, the chemical and sensory characteristics of the meads were evaluated, in order to get knowledge about the role of sweetness and ethanol content on their acceptability. MATERIALS AND METHODS Reagents All chemicals, namely glucose, fructose, saccharose, ethanol, glycerol, acetic acid and tartaric acid, were of analytical grade and purchased from Sigma Chemical Co. (St. Louis, MO, USA). Phosphoric acid was obtained from Fisher Scientific (Porto Salvo, Portugal). Type 2 deionised water was obtained from a TGI pure water system (USA). Honey and yeast strain In this study, honey derived from plants of the Ericaceae (heather) family (Erica spp.) purchased on the Honey House of Trás-os-Montes region (NE of Portugal) was used in all experiments. The yeast strain used was Saccharomyces cerevisiae, from Fermol® Reims Champagne (Pascal Biotech®, Brescia, Italy), which is recommended for commercial production of white wines. Fermentation conditions The fermentation medium was prepared from honey diluted with water (395 g/L), supplemented with commercial nutrients (90 g/hL) (Enovit®, Brescia, Italy) and 6% (v/v) of SO2 (8 g/hL). The pH was corrected to 3.5 with tartaric acid, as described by Gupta & Sharma [2009]. The honey mixtures were inoculated with freeze-dried yeast cells (30 g/hL), previously hydrated in water with the addition of saccharose (50 g/L) and incubated at 35ºC for 20 min. The fermentations occurred in cubes of 25 L, using a working volume of 20 L, at 25ºC. All fermentations were performed in triplicate. Density and Beaumé degrees were measured by aerometry at regular intervals. To produce the “sweet meads”, the fermentation process was interrupted at 79 hours when the density was approximately 1060 g/mL by the addition of brandy with 77% (v/v) of alcohol, using the procedure described by Pato [1982]. Mead sweetness was equivalent to 8 ºBeaumé. The mead was divided and the alcohol content was adjusted to 18, 20 and 22% (v/v) with brandy. For production of “dry meads”, Mead Characteristics Versus Its Acceptability fermentations continued until reaching a density of about 1020 g/mL. At the end, brandy was added to obtain the alcoholic contents of 18, 20 and 22% (v/v). Fermentation parameters analysed Biomass was determined periodically by optical density at 640 nm (Jenway Genova®, Staffordshire, United Kingdom). Glucose, fructose, ethanol, glycerol, and acetic acid were quantified individually, following the methodology described by Pereira et al. [2009] and using a Varian HPLC system (Agilent, Santa Clara, USA) equipped with a Rheodyne injector with 20 μL loop, a Supelco Gel C-610H column (300×7.8 mm) at 35ºC and a refractive index detector RI-4 (Varian, Agilent, Santa Clara, USA). Isocratic elution was employed with a mobile phase consisting of 0.1% (v/v) phosphoric acid at a flow rate of 0.5 mL/min. Data were recorded and integrated using the Star Chromatography Workstation software (Varian, Agilent, Santa Clara, USA). Glucose, fructose, ethanol, glycerol and acetic acid were quantified by external standard calibration. Sensory analysis The sensory attributes of meads (acceptability) were evaluated by a consumers’ panel randomly selected among the academic community of our Institution (IPB). Three testing sessions were organised, each one with 36 persons (total = 108), in a sensory evaluation room equipped with individual cabins. The “sweet meads” and “dry meads”, varying in the alcohol content (18, 20 and 22%, v/v) were tasted by all consumers. The samples testing order were randomised in order to remove the effect of sample order presentation from the consumers’ evaluation. The consumers evaluated the six meads on a continuous scale from 0 (dislike extremely) to 10 (like extremely) for the following sensory attributes: aroma, flavour, sweetness, alcohol feeling and general appreciation. Statistical analysis The data obtained from the consumers’ sensory evaluation were analysed by the R® software. The effects of sweetness and alcohol content were evaluated by the following mixed model: Yijk= μ + ACi + Sj + Tk + eijk where: Yijk is the sensory appreciation of the k consumer for the mead with i alcoholic content and j sweetness; μ is the overall mean; ACi is the fixed effect of the alcohol content (i = 1, 2, 3); Sj is the fixed effect of sweetness (j = 1, 2); Tk is the random effect of the consumer (k = 1, 2, …, 108); eijk is the random error with zero mean and variance 1. All interaction terms were removed from the full model since they revealed as non-significant (p > 0.05) in a preliminary analysis of the data. RESULTS AND DISCUSSION Mead fermentations The rates of yeast growth, sugar consumption, and ethanol, glycerol and acetic acid productions during mead fermentations are represented in Figure 1. In sweet and dry mead fermenta- 139 T. Gomes et al. 200 12 Figure 1B represents the fermentation development for “dry mead”. In this case, ethanol content amounted to 106.8 g/L. This concentration was smaller than that reported by Ukpabi [2006] for cassava honey mead (12.7–15.0%), and Vidrih & Hribar [2007] after fermentation of chestnut, lime and honeydew meads (14.2%). On contrary, our results of “sweet” and “dry” meads were similar to the ethanol contents (4.6 to 11.8%) reported by Gupta & Sharma [2009] for home brewed and commercial meads made from soya honey. Glucose and fructose were metabolised by yeast to values of 2.5±0.9 g/L and 20.4±6.8 g/L, respectively. In this case, it was observed that the glucose consumption rate was higher than that of fructose. The final concentrations of glycerol and acetic acid (5.96±0.95 and 0.57±0.09 g/L, respectively) were similar to those obtained in sweet mead fermentations. The glycerol concentrations reported here were in agreement with those obtained by Pereira et al. [2009] of 4.2 to 5.7 g/L, using dark and light honeys enriched with a nitrogen source during mead production. Regarding glycerol, the production of this component is desirable to obtain good quality meads since its presence, like in wine, improves quality by influencing sweetness, fullness and smoothness. On contrary, the presence of acetic acid is highly undesirable. Our results were identical to those described by Pereira et al. [2009] and Mendes-Ferreira et al. [2010] who reported meads with a volatile acidity from 0.51 to 0.84 g acetic acid/L. The acetic acid contents reported by Róldan et al. [2011], and Sroka & Tuszynski [2007], when studying the influence of pollen addition and the use of buckwheat honey, were of 1.4±0.18 g/L and 0.7 to 1.0 g/L, respectively, values above the sensory threshold for table wines of 0.7 g acetic acid/L. Ethanol is a primary metabolite that is expected to be produced during the exponential phase; however, in this study, its production was also observed along the stationary phase during both “dry” and “sweet” mead productions. This fact is similar to the reported previously by Pereira et al. [2009] and Gomes [2010]. In general terms and regarding both experiments (“dry” and “sweet” meads), the glycerol concentrations obtained were similar and within the values reported in the literature for wines [Scanes et al., 1998]. In relation to the acetic acid, similar results were obtained for both types of mead, being the values smaller than the limit of human perception and within the contents reported for Port wines [Esteves et al., 2004]. A Brandy addition 150 8 6 100 4 Concentration (g/L) O.D. (640 nm) 10 50 2 0 0 0 10 20 30 40 50 60 70 80 90 Time (hours) 200 12 Brandy addition 10 B 6 100 4 Concentration (g/L) O.D. (640 nm) 150 8 50 2 0 0 20 40 60 80 100 120 140 160 180 200 0 220 240 Time (hours) Biomass Ethanol Glycerol Acetic acid Glucose Fructose FIGURE 1. Mead fermentations development. Evolution of biomass, ethanol, glycerol, acetic acid and reducing sugars are indicated for sweet (A) and dry (B) meads. tions (Figures 1A and 1B, respectively), lag phases around 10 hours were observed. The exponential phases followed approximately 45 hours. In sweet mead (Figure 1A), the sugar consumption percentage corresponded to about 80% of the initial level. Glucose and fructose were simultaneously consumed from the beginning to 27±4.2 g/L and 48±9.6 g/L, respectively. As the sweetening power of fructose is higher than glucose (approximately twice), it is expected that these conditions provided very sweet drinks [Lee, 1987]. At the time that the fermentations stopped, the ethanol content was equal to 59.5±0.42 g/L. Glycerol and acetic acid were also produced, reaching concentrations of 5.10±0.54 and 0.46±0.08 g/L, respectively. This low acetic acid content avoided the vinegar off-character [Mendes-Ferreira et al., 2010] that could be developed in the drink. TABLE 1. Scores given by the consumers’ panel to meads with different alcohol and sweetness contents in relation to aroma, sweetness, flavour, alcohol feeling and general appreciation. Aroma Alcohol content (% (v/v)) Sweetness Sweetness Flavour Alcohol General appreciation 18 4.4±2.41 3.8±2.57 3.8±2.61 4.0±2.54 4.1±2.83a 20 4.3±2.43a 3.9±2.56a 4.0±2.63a 4.2±2.37a 4.1±2.70a 22 4.7±2.39a 3.8±2.70a 3.9±2.84a 4.4±2.61a 4.0±2.77a Sweet 4.9±2.46a 5.2±2.42b 5.1±2.63b 5.0±2.36b 5.4±2.56b Dry 4.0±2.27b 2.5±2.02a 2.7±2.18a 3.4±2.39a 2.7±2.23a a a Values within columns with the same letter are not significantly different (p>0.05). a a 140 Mead Characteristics Versus Its Acceptability Female Male Female A 0.15 Male B 0.15 0.10 Density Density 0.10 0.05 0.05 0.00 0.00 0 5 Aroma 10 0 Male Female 5 Sweetness Female 10 Male C D 0.15 0.10 Density Density 0.10 0.05 0.05 0.00 0.00 0 5 Flavor 10 0 Female 5 Alcohol 10 Male E 0.15 Density 0.10 0.05 0.00 0 5 General appreciation 10 FIGURE 2. Density plots for consumers’ evaluation of meads aroma (A), sweetness (B), flavour (C), alcohol feeling (D) and general appreciation (E) by gender. Sensory analysis The sensory evaluation scores of meads obtained by the consumers’ panel are shown in Table 1. The statistical analysis was performed using the full model presented in the Materials and Methods section. This analysis showed that the interaction between alcohol degree and sweetness was non-significant (p>0.05) for all sensory parameters evaluated. Thus, a reduced model was used without this interaction term. The alcohol content of mead had no effect (p>0.05) on the sensory attributes studied, namely, aroma, sweetness, flavour, alcohol feeling and general appreciation. Even 141 T. Gomes et al. TABLE 2. Correlations among mead sensory attributes. Variables General appreciation General appreciation Aroma Sweetness Flavour Alcohol content 1 Aroma 0.43 1 Sweetness 0.76 0.44 1 Flavour 0.82 0.51 0.79 1 Alcohol content 0.69 0.40 0.65 0.62 though, three alcohol levels were studied (18, 20 and 22% (v/v)), no significant differences on consumers’ scores regarding the alcohol feeling of the meads were observed. On contrary, sweetness had a significant effect on mead sensory evaluation of consumers. The sweet meads had always higher scores (p<0.05) in aroma, sweetness, flavour, alcohol feeling and general appreciation, than dry meads. Thus, the meads with the highest sugar content (sweet meads) were the most appreciated by the consumers’ panel. Taking into account the scale from 0 (dislike extremely) to 10 (like extremely), the mean value obtained for general appreciation of 5.4±2.56 suggested that consumers liked slightly the “sweet meads”. On other hand, the “dry meads” were rated significantly (p<0.05) lower, 2.7±2.23, showing their low acceptability by the consumers. The correlations among the sensory attributes of meads varied from 0.40 to 0.82 as shown in Table 2. The general appreciation presented high correlations (> 0.75) with sweetness and flavour, indicating the relative importance of these two attributes for mead acceptability by consumers. The correlation between flavour and sweetness was high (r=0.79), showing the important effect of sweetness on mead flavour. Regarding gender, no differences (p>0.05) were found between males and females for the sensory attributes of meads, as shown by the density plots (Figures 2A to 2E), where similar distributions were observed for men and women for all sensory parameters studied. CONCLUSIONS Different types of mead with different sweetness and alcohol content were successfully produced by halting the fermentation process at different times and by adding different quantities of brandy. Thus, this study showed that it is possible to produce meads with different sweetness and alcohol content by changing the fermentation conditions. Sweetness influences significantly the sensory properties of mead, unlike alcohol content on the range of 18 to 22% (v/v). The sweet meads were the most appreciated by the consumers regardless their alcohol contents, showing that mead sweetness is an essential requisite for consumers’ acceptability. In conclusion, the present work showed that the final sugar content in mead is a key point for guaranteeing its acceptance by consumers. In order to increase consumers’ overall satisfaction, further studies should be conducted to define the optimum sugar content to be used in future mead production. 1 ACKNOWLEDGEMENTS We acknowledge the financial support (Project PTDC/ AGR-ALI/68284/2006) from Fundação para a Ciência e Tecnologia (FCT) of the Portuguese Republic Government. REFERENCES 1. Attfield P.V., Stress tolerance: the key to effective strains of industrial baker’s yeast. Nat. Biotechnol., 1997, 15, 1351–1357. 2. Bisson L.F., Stuck and sluggish fermentations. Am. J. Enol. Viticult., 1999, 50, 107–119. 3. Caridi A., Fuda S., Postorino S., Russo M., Sidari R., Selection of Saccharomyces sensu stricto for mead production. Food Technol. Biotech., 1999, 37, 203–207. 4. Esteves V.I., Lima S.S.F., Lima D.L.D., Duarte A.C., Using capillary electrophoresis for the determination of organic acids in Port wine. Anal. Chim. Acta, 2004, 513, 163–167. 5. Gomes T., Produção de hidromel: efeitos das condições de fermentação. 2010, Master thesis, Polytechnic Institute of Bragança, Bragança, pp. 14–64 (in Portuguese). 6. Gomes T., Barradas C., Dias T., Verdial J., Morais J.S., Ramalhosa E., Estevinho L., Mead production: comparison of different production scales (preliminary results). 2010, in: Proceedings FOODSIM’2010 (eds. V. Cadavez, D. Thiel), Instituto Politécnico de Bragança, Bragança, Portugal, pp. 244–247. 7. Gomes T., Barradas C., Dias T., Verdial J., Morais J.S., Ramalhosa E., Estevinho L., Mead production improvements after using a factorial design. 2011, in: Proceedings 6th International CIGR Technical Symposium – Towards a sustainable food chain (eds. Oniris, GEPEA). Nantes, France. 8. Gupta J.K., Sharma R., Production technology and quality characteristics of mead and fruit-honey wines: A review. Nat. Prod. Rad., 2009, 8, 345–355. 9. Katoh T., Koguchi M., Saigusa N., Teramoto Y., Production and antioxidative activity of mead made from various types of honey and black rice (Oryza sativa var. Indica cv. Shiun). Food Sci. Technol. Res., 2011, 17, 149–154. 10. Kime R.W., McLellan M.R., Lee C.Y., An improved method of mead production. Am. Bee J., 1991a, 131, 394–395. 11. Kime R.W., McLellan M.R., Lee C.Y., Ultra-filtration of honey for mead production. Am. Bee J., 1991b, 131, 517–521. 12. Lee C.K., The chemistry and biochemistry of the sweetness of sugars. Adv. Carboh. Chem. Biochem., 1987, 45, 199–351. 13. Mendes-Ferreira A., Cosme F., Barbosa C., Falco V., Inês A., Mendes-Faia A., Optimization of honey-must preparation 142 14. 15. 16. 17. 18. and alcoholic fermentation by Saccharomyces cerevisiae for mead production. Int. J. Food Microbiol., 2010, 144, 193–198. Navratil M., Sturdik E., Gemeiner P., Batch and continuous mead production with pectate immobilized, ethanol-tolerant yeast. Biotechnol. Lett., 2001, 23, 977–982. Pato O., O vinho: sua preparação e conservação. 1982, Clássica Editora, Lisboa, pp. 183–188 (in Portuguese). Pereira A.P., Dias T., Andrade J., Ramalhosa E., Estevinho L.M., Mead production: Selection and characterization assays of Saccharomyces cerevisiae strains. Food Chem. Toxicol., 2009, 47, 2057–2063. Pereira A.P., Mendes-Ferreira A., Oliveira J.M., Estevinho L.M., Mendes-Faia A., High-cell-density fermentation of Saccharomyces cerevisiae for the optimization of mead production. Food Microbiol., 2013, 33, 114–123. Roldán A., Van Muiswinkel G.C.J., Lasanta C., Caro I., Influence of pollen addition on mead elaboration: Physicochemical and sensory characteristics. Food Chem., 2011, 126, 574–582. Mead Characteristics Versus Its Acceptability 19. Scanes K.T., Hohmann S., Prior B.A., Glycerol production by the yeast Saccharomyces cervisiae and its relevance to wine: a review. S. Afr. J. Enol. Vitic., 1998, 19, 17–24. 20. Smogrovicova D., Nadasky P., Tandlich R., Wilhelmi B., Cambray G., Analytical and aroma profiles of Slovak and South African meads. Czech J. Food Sci., 2012, 30, 241–246. 21. Sroka P., Tuszynski T., Changes in organic acid contents during mead wort fermentation. Food Chem., 2007, 104, 1250–1257. 22. Ukpabi U.J., Quality evaluation of meads produced with cassava (Manihot esculenta) floral honey under farm conditions in Nigeria. Trop. Subtrop. Agroecosyst., 2006, 6, 37–41. 23. Vidrih R., Hribar J., Studies on the sensory properties of mead and the formation of aroma compounds related to the type of honey. Acta Aliment., 2007, 36, 151–162. Submitted: 12 May 2014. Revised: 28 July 2014. Accepted: 11 September 2014. Published on-line: 15 April 2015. Pol. J. Food Nutr. Sci., 2015, Vol. 65, No. 2, pp. 143–147 DOI: 10.1515/pjfns-2015-0025 http://journal.pan.olsztyn.pl Original article Section: Food Quality and Functionality Origin of Synthetic Particles in Honeys Gerd Liebezeit*, Elisabeth Liebezeit MarChemConsult, Altjührdener Strasse 6, 26316 Varel, Germany Key words: honey, contamination, particle, fibre, fragment, inflorescence A total of 47 honeys and 22 flowering plants was analysed for their load of synthetic fibres and fragments. In all samples investigated foreign particles were found. These include also black carbon particles which were not enumerated. Fibres and fragments ranged from 10 to 336 kg-1 and 2 to 82 kg-1 honey, respectively. The data of the flowering plants analysed indicate that a major proportion of the particle load may originate from external sources, i.e. these particles are brought into the beehive by the worker bees during nectar collection. INTRODUCTION MATERIAL AND METHODS Honey, despite it being an almost non-processed aliment, has been shown to contain contaminants such as trace metals [e.g. Formicki et al., 2013; Matusevicius et al., 2010], pesticides [Al-Waili et al., 2012], chlorinated compounds [Matusevicius et al., 2010; Rissato et al., 2007] and others [Bogdanov, 2006]. Honey has also been reported to contain filth of natural origin [Canale et al., 2014]. These authors noted the presence of carbon particles, other inorganic fragments and fragments of animal origin. These included insects, their cuticular fragments, mites and mammal hair. The abundance of this foreign matter showed no difference for honeys from both small and large-sized producers. Liebezeit & Liebezeit [2013] noted the presence of particles of synthetic origin in honeys available in Germany. Here also no differences were observed between small beekeeping enterprises and large producers. The latter authors also suggested possible pathways by which this contamination may reach the final product. These include external and internal sources. The internal sources can be related to the diligence shown during honey extraction and packaging. In this case, the extent of contamination can be controlled by the processing facility. The external source as was shown by the analysis of flowers is related to the presence of particles in the atmosphere that may deposit on flowers there being held by the pollenkitt. In this communication we present more data on the presence of synthetic particles in honeys as well as in external sources, i.e. flowers. A total of 47 honey samples was obtained from supermarkets as well as directly from German small-scale beekeepers. The honeys investigated are given in Table 1. Liquid honeys were mixed with a an equal volume of 40°C water while solid ones were heated to 40°C until liquified and then diluted. The mixtures were passed through a 40 μm steel sieve. The material remaining on the sieve was copiously rinsed with warm deionised water and, after transfer with 30% H2O2 to a 50 mL wide neck Erlenmeyer beaker and cooling to room temperature, treated at room temperature for 72 h. The oxidised samples were then filtered over 0.8 μm grey, gridded cellulose nitrate filters, treated several times with a small volume of 90°C water to remove waxy particles and dried at ambient temperature. One series of 12 samples was analysed in duplicate. Inflorescences of 22 species were collected from April 2014 to August 2014 (Table 2). Depending on the size of the inflorescence, between 1 and 25 specimens were completely covered with 30% H2O2 for 24 h. After removal of the larger parts such as petals the peroxide solution was sieved over a 40 m steel sieve. After copious rinsing, the remaining particulate material was filtered over 0.8 m cellulose nitrate filters. After extensive rinsing with 0.8 m filtered deionised water, wet filters were covered with 6 mL Rose Bengal (4,5,6,7-tetrachloro-2’,4’,5’,7’-tetraiodofluorescein, 200 mg/L; [Lusher et al., 2013; Williams & Williams, 1974] to stain natural organic particles. After 5 min, the dye was filtered and the stained material washed dye-free with filtered deionised water. After drying at ambient temperature, the samples were analysed under a dissecting microscope at up to 80x magnification. No attempts were made to determine fibre lengths or polymer type. Particles that were not stained are regarded as being * Corresponding Author: Tel.: +49 4451 804852; E-mail [email protected] (G. Liebezeit) © Copyright by Institute of Animal Reproduction and Food Research of the Polish Academy of Sciences © 2015 Author(s). This is an open access article licensed under the Creative Commons Attribution-NonCommercial-NoDerivs License (http://creativecommons.org/licenses/by-nc-nd/3.0/). 144 Origin of Synthetic Particles in Honeys TABLE 1. Summary of honeys analysed. No. Type Origin State 1 mountain Switzerland solid 2 not specified Switzerland solid 3 not specified Switzerland solid 4 chestnut Switzerland solid 5 flower EU/non-EU solid 6 flower EU/non-EU solid 7 forest Switzerland solid 8 forest Switzerland liquid 9 flower Switzerland liquid 10 spring Switzerland solid 11 country EU/non-EU solid 12 flower EU/non-EU solid 13 flower EU/non-EU solid 14 flower Bulgaria solid 15 flower Switzerland solid 16 not specified EU/non-EU solid 17 summer flower EU/non-EU solid 18 flower EU/non-EU solid 19 not specified Toscana solid 20 not specified Switzerland solid 21 not specified Germany solid 22 Millefiori Italy solid 23 chestnut Italy liquid 24 sunflower Italy solid 25 orange Italy solid 26 acacia Bulgaria liquid 27 eucalyptus Spain liquid 28 honeydew Italy liquid 29 chestnut Spain liquid 30 linden Bulgaria liquid 31 coriander Bulgaria liquid 32 Lavendulum Spain liquid 33 mountain Spain liquid 34 not specified Latin America/E Europe liquid 35 not specified EU/non-EU liquid 36 mountain Spain/France liquid 37 flower EU/non-EU liquid 38 not specified EU/non-EU liquid 39 not specified Latin America solid 40 mountain France solid 41 flower France liquid 42 not specified EU/non-EU liquid 43 not specified France liquid 44 flower France liquid 45 flower Latin America liquid 46 flower Germany liquid 47 fruit blossoms Germany solid of synthetic origin and will be referred to in the following as microplastics using the definition for this material as being particles smaller than 5 mm but larger than 1 m. As the filters used were found to be occasionally contaminated with fibres, presumably from the production process, they were rinsed with deionised filtered water and checked under the microscope prior to use. To avoid airborne contamination [Liebezeit & Liebezeit, 2013] the filtration unit and all other glassware used was covered during the whole workup procedure. Maximum exposure time to the atmosphere including microscopic analysis was 20 to 30 min. Blank filters carried through the complete scheme gave a maximum of 2 fibres/filter. Laboratory air sucked through a previously rinsed filter for 1 h at 50 L/min had 2 fibres, 0 fragments and 3 small granular particles [Liebezeit & Liebezeit, 2014]. Hence, contamination from this source can be neglected. All water used as well as the peroxide solution were filtered over 0.8 m cellulose nitrate filters prior to use. Some pollen types and also some string-like fibers were not stained under the conditions given above. Nevertheless these can be easily distinguished by their morphology from the more irregular microplastic particles. The same holds for chitin which is also not stained by Rose Bengal. Here again morphology and discolouration can be used to exclude these particles from the microplastic counts. As quartz grains were observed in the flowers analysed as well as in some cases in honey samples only fibre and fragment counts will be reported here. RESULTS AND DISCUSSION In all 47 honey samples analysed both fibres and fragments were found ranging from 10 to 336 fibres/kg and 2 to 82 fragments/kg (Figure 1). Fibres are clearly dominating (Figure 2) with lengths from 40 m up to several millimeters (Figure 3). Fragments were generally smaller in size reaching only some ten micrometers. For the 12 honeys investigated in duplicate (Figure 1) relative variations between samples ranged from 0 to 57.2% for fibres and 0 and 55.5% for fragments indicative of an inhomogeneous distribution of particles in the packaged product. In addition, black carbon particles were frequently encountered. Most of these were granular in shape and are hence not reported in detail here. These findings, however, corroborate the data by Canale et al. [2014] who also found large number of carbon particles in their samples of Italian honeys. Comparing samples from smaller beekeepers with those available from large scale producers did not show significant differences. This indicates that honey harvesting, processing and packaging do not contribute to a large extent to the foreign particle load. Canale et al. [2014] reported insects and mammal hair in some of their samples providing evidence for poor operating conditions during honey processing and packaging. In the present suite of samples no intact insects or insect remains were found while in two samples one hair each was noted. This might be due to the fact that the larger producers screen their products through 200 m sieves, a practice which, at least in Germany, is also exercised by small beekeepers. 145 G. Liebezeit & E. Liebezeit In all flowering plants analysed particles were found that could not be stained by Rose Bengal and hence can be considered to be of synthetic nature (Table 2; Figure 4). Furthermore, in several filaments of untreated lily blossoms (Lilium sp.) fi400 Total fibres (n/kg) 300 200 100 0 0 2 4 6 8 10 12 14 16 18 20 22 24 26 28 30 32 34 36 38 40 42 44 46 100 Total fragments (n/kg) 80 60 40 20 0 0 2 4 6 8 10 12 14 16 18 20 22 24 26 28 30 32 34 36 38 40 42 44 46 Sample number FIGURE 1. Fibre and fragment numbers in 47 honey samples. Numbers refer to Table 1. 400 bres were observed (Figure 4). As in the honeys analysed fibres were dominant also in all plant species (Table 2) making up on average 77.9±19.0% (n=27). This is direct evidence for the deposition of foreign particulate matter on flowers there being held by the pollenkitt and other pollen coatings [Hesse, 2010]. That this foreign material is transferred to the hive by pollen collecting bees is also evident from the finding of fibres in their pollen load. Here of six investigated specimens two were carrying fibres. Our results clearly indicate that fibres and, to a lesser extent, fragments are already present in the bees’ feed and are transferred from the blossoms to the hive by the insects. Particles in the atmosphere are derived from a variety of sources including abrasion of clothing. Also synthetic particles used to improve horticultural soils such as polystyrene peat or hygro peat may become airborne by outblowing after dry periods. The same may hold for synthetic fibres present in sewage sludge used as fertilizer in agriculture [Habib et al., 1998; Zubris & Richards, 2005]. Little information is available on the content of organic fibres, both natural and synthetic, in ambient air. Altree-Williams & Preston [1985] found contents from <1000 to 63,000 fibres m-3. Data provided by Schneider et al. [1996], using optical microscopy, support the finding that organic fibers in indoor air occur in concentrations larger than those of “other inorganic” fibres. Synthetic organic fibers include polyethylene, polypropylene, polyvinylalcohol, polyester, polyamide and polytetrafluoroethylene fibers [Hodgson, 1993]. Fragmentation of macroplastic litter due to the action of sunlight, oxygen, humidity and temperature [Barnes et al., 2009] or agricultural films may lead to the formation of fragments in the sub-millimetre range. These will, as other particles in this size range, become easily airborne. Especially for agricultural films the claim that these are degraded is based on the fact that some physical properties such as tensile strength or elongation at break change as films age. The formation of final degradation products such as water or carbon dioxide is only rarely assessed. Total particles (n/kg) 300 200 100 66 26 0 fibres fragments FIGURE 2. Median, upper and lower quartiles, 95% values and outliers for 47 honey samples. FIGURE 3. Example of fibres and fragments in honey. 146 Origin of Synthetic Particles in Honeys TABLE 2. Summary of flowering plants analysed. Species Aquilegia Aquilegia vulgaris Daisy Bellis perennis Cornflower Centaurea cyanus Cornel cherry Cornus mas Crocus Crocus sp. Hazelnut Corylus avellana Hawthorn Crataegus sp. Snowdrop Galanthus sp. Hyazinth Hyacinthus sp. Magnolia Magnolia sp. Daffodil, large Narcissus sp. Forgetmenot Myosotis sp. Daffodil, small Narcissus sp. Primrose Primula sp. Plum Prunus sp. Sour cherry Prunus cerasus Lungwort Pulmonaria officinalis Rose Rosa sp. Willow Salix sp. Dandelion Taraxacum officinale Tulip Tulipa sp. Inflorescences analysed Microplastic particles fibres fragments 5 3 5 9 2 3 10 12 2 4 4 28 8 11 4 10 5 0 4 4 50 40 4 5 5 16 6 25 0 1 8 14 0 1 9 2 5 5 1 3 21 4 12 17 4 5 23 6 4 51 6 14 14 2 10 13 2 6 38 4 3 3 39 6 2 4 8 24 3 5 4 2 3 15 7 Particles >10 m, referred to as giant or ultragiant particles [cf. Johnson, 1982] have been reported to be present in the atmosphere. For mineral particles >75 m long range transport has been shown by Betzer et al. [1988]. While most studies related to these particles determination for only the elemental composition, de Bock et al. [1994] reported on the presence of organic constituents in North Sea particles >20 m but did not investigate their exact nature. Van Malderen et al. [1992] noted a markedly higher abundance of giant organic particles in air masses with a continental origin. Black carbon or soot particles which were regularly found in the present suite of samples originate from combustion processes such as forest fires or fossil fuel burning. These particles may be transported over very long distances [e.g. Ramanathan et al., 2007]. FIGURE 4. Examples of foreign particles in various flowers. The lily filament in the upper right part was photographed directly without further treatment. These data suggest that the global environment is affected to a large extent by microplastic particles either from direct inputs or from fragmentation of macrolitter. While an atmospheric source for the particles is proven by our findings the exact contribution to the overall foreign particle load in honey is still to be determined. The finding of Canale et al. [2014] of insects or mammal hair or the data on fibre content of indoor air suggest that improper handling of the product or the ubiquitous presence of airborne particles may also contribute to the overall particle burden of honey. This can surely be reduced by the beekeeper using adequate processing techniques. ACKNOWLEDGEMENTS We are indebted to Swiss Radio and Television (SRF) for the permission to use data from an investigation carried out for SRF. REFERENCES 1. Altree-Williams S., Preston J.S., Asbestos and other fiber levels in buildings. Ann. Occup. Hyg., 1985, 29, 357–363. 2. Al-Waili, N., Salom, K., Al-Ghamdi, A., Ansari, M.J., Antibiotic, pesticide, and microbial contaminants of honey: Human health hazards. Scient. World J., 2012, Article ID 930849, 1–9. 3. Barnes D.K.A., Galgani F., Thompson R.C., Barlaz M., Accumulation and fragmentation of plastic debris in global environments. Phil. Trans. Roy. Soc. B – Biol. Sci., 2009, 364, 1985–1998. 4. Betzer P.R, Carder K.L., Duce R.A., Merrill J.T., Tindale N.W., Uematsu M., Costello D.K., Young R.W., Feely R.A., Breland J.A., Bernstein R.E., Greco A.M., Long-range transport of giant mineral aerosol particles. Nature, 1988, 336, 568–571. 5. Bogdanov S., Contaminants of bee products. Apidologie, 2006, 37, 1–18. G. Liebezeit & E. Liebezeit 6. de Bock L.A., van Malderen H., van Grieken R.E., Individual aerosol particle composition variations in air masses crossing the North Sea. Environ. Sci. Technol., 1994, 28, 1513–1520. 7. Canale A., Canovai R., Cosci F., Giannotti P., Benelli G., Survey of Italian honeys for the presence of foreign matter using the filth test. Food Add. Contam., 2014, 31, 905–909. 8. Formicki G., Gren A., Stawarz R., Zysk B., Gal A., Metal content in honey, propolis, wax, and bee pollen and implications for metal pollution monitoring. Pol. J. Environ. Stud., 2013, 22, 99–106. 9. Habib D., Locke D.C., Cannone L.J., Synthetic fibers as indicators of municipal sewage sludge, sludge products, and sewage treatment plant effluents. Water Air Soil Poll., 1998,103, 1–8. 10. Hesse M., Bonding single pollen grains together: How and why? 2010, in: Biological Adhesive Systems From Nature to Technical and Medical Application (eds. J.V. Byern, I Grunwald). Springer Verlag, Vienna, pp. 3–13. 11. Hodgson A.A., Industrial fibers: a technical and commercial review. Ann. Occup. Hyg., 1993, 37, 203–210. 12. Johnson D.B., The role of giant and ultragiant aerosol particles in warm rain initiation. J. Atmospher. Sci., 1982, 39, 448–460. 13. Liebezeit G., Liebezeit E., Non-pollen particulates in honey and sugar. Food Add. Contam. A, 2013, 30, 2136–2140. 14. Liebezeit G., Liebezeit E., Synthetic particles as contaminants in German beers. Food Add. Contam. A, 2014, 31, 1574–1578. 15. Lusher A.L., McHugh M., Thompson R.C., Occurrence of microplastics in the gastrointestinal tract of pelagic and demersal fish from the English Channel. Mar. Poll. Bull., 2013, 67, 94–99. 147 16. Matusevicius P., Staniskiene B., Budreckiene R., Metals and organochlorine compounds in Lithuanian honey. Pol. J. Food Nutr. Sci., 2010, 60, 159–163. 17. Ramanathan V., Li F., Ramana M.V., Praveen P.S., Kim D., Corrigan C.E., Nguyen H., Stone E.A., Schauer J.J., Carmichael G.R., Adhikary B., Yo S.C., Atmospheric brown clouds: Hemispherical and regional variations in long-range transport, absorption, and radiative forcing. J. Geophys. Res., 2007, 112, D22S21. 18. Rissato S.R., Galhiane M.S., Almeida M.V.d., Gerenutti M., Apon B.M., Multiresidue determination of pesticides in honey samples by gas chromatography–mass spectrometry and application in environmental contamination. Food Chem., 2007, 101, 1719–1726. 19. Schneider T., Burdett G., Martinon L., Brochard P., Guillemin M., Draeger U., Ubiquitous fiber exposure in selected sampling sites in Europe. Scand. J. Work Environ. Health, 1996, 22, 274–284. 20. van Malderen H., Rojas C., van Grieken R., Characterization of individual giant aerosol particles above the North Sea. Environ. Sci. Technol., 1992, 26, 750–756. 21. Williams D.D., Williams N.E., A counterstaining technique for use in sorting benthic samples. Limnol. Oceanogr., 1974, 19, 152–154. 22. Zubris K.A.V., Richards B.K., Synthetic fibers as an indicator of land application of sludge. Environ. Pollut., 2005, 138, 201–211. Submitted: 30 September 2014. Revised: 20 February 2015. Accepted: 24 February 2015. Published on-line: 15 April 2015. Pol. J. Food Nutr. Sci., 2015, Vol. 65, No. 2, pp. 149–150 http://journal.pan.olsztyn.pl Instruction for Authors Section: Editorial News INSTRUCTIONS FOR AUTHORS SUBMISSION. Original contributions relevant to food and nutrition sciences are accepted on the understanding that the material is not considered for publication elsewhere. All papers should be submitted and will be processed electronically via Editorial Manager system (available from PJFNS web site: http://journal.pan.olsztyn.pl). On submission, a corresponding author will be asked to provide: Cover letter; Files with Manuscripts, Tables, Figures/Photos; and Names of two potential reviewers (one from the author’s homeland – but outside author’s Institution, and the other from abroad). All papers which have been qualified as relevant with the scope of our Journal are reviewed. All contributions, except the invited reviews are charged. Authors should not expect royalties. Paper will normally be published in order of acceptance by the Editors, although this may occasionally be changed for reasons of space, or to publish more quickly particular paper which the Editors consider of topical interest. Proofs will be sent to the corresponding author or to the first author and should be returned within one week since receipt. No new material may be inserted in the text at proof stage. It is the author’s duty to proofread proofs for errors. Authors should very carefully consider the preparation of papers to ensure that they communicate efficiently, because it permits the reader to gain the greatest return for the time invested in reading. Thus, we are more likely to accept those that are carefully designed and conform the instruction. Otherwise, papers will be returned to the author(s) for correction. REVIEW PROCESS. All scientific contributions will be peer-reviewed on the criteria of originality and quality. Submitted manuscripts will be pre-evaluated by Editor-in-Chief and Statistical Editor (except for review articles), and when meeting PJFNS’ scope and formal requirements, they will be sent to a section Editor who upon positive pre-evaluation will assign at least two reviewers from Advisory Board Members, reviewers suggested by the author or other experts in the filed. Based on the reviews achieved, Section Editor and Editor-in-Chief will make a decision on whether a manuscript will be accepted for publication, sent back to the corresponding author for revision, or rejected. Once a manuscript is sent back to the corresponding author for revision, all points of the reviews should be answered or rebuttal should be provided in the Explanation letter. The revised manuscripts will be checked by Section Editor and by the original reviewers (if necessary), and a final decision will be made on acceptance or rejection by both Section Editor and Editor-in-Chief. TYPES OF CONTRIBUTIONS. Reviews: (at least: 30 pages and 50 references) these are critical and conclusive accounts on trends in food and nutrition sciences.; Original papers: (maximally: 30 pages and 50 references) these are reports of substantial research; Short reports: (maximally: 15 pages and 30 references) these describe smaller investigations and applications, useful techniques and apparatus; Book reviews, reports on post and forthcoming scientific events, and letters to the Editor (all up to three pages) are also invited (free of charge). AUTHORSHIP FORM referring to Authorship Responsibility and Acknowledgement, Conflict of Interest and Financial Disclosure, Copyright Transfer, are required for all authors, i.e. Authorship Responsibility and Acknowledgement: Everyone who has made substantial intellectual contributions to the study on which the article is based (for example, to the research question, design, analysis, interpretation, and written description) should be an author. It is dishonest to omit mention of someone who has participated in writing the manuscript (“ghost authorship”) and unfair to omit investigator who have had important engagement with other aspects of the work. All contributors who do not meet the criteria for authorship should be listed in an Acknowledgments section. Examples of those who might be acknowledged include a person who provided purely technical help, writing assistance, or a department chairperson who provided only general support. Any financial and material support should also be acknowledged. Conflict of Interest and Financial Disclosure: Authors are responsible for disclosing financial support from the industry or other conflicts of interest that might bias the interpretation of results. Copyright Transfer Agreement: Authors agree that papers accepted become the copyright of the Institute of Animal Reproduction and Food Research of the Polish Academy of Sciences in Olsztyn, Poland, and may not be published elsewhere without the Editor’s permission in writing. A manuscript will not be published once the signed form has not been submitted to the Editor. ETHICAL APPROVAL OF STUDIES AND INFORMED CONSENT. For all manuscripts reporting data from studies involving human participants or animals, formal approval by an appropriate institutional review board or ethics committee is required and should be described in the Methods section. For those investigators who do not have formal ethics review committees, the principles outlined in the Declaration of Helsinki should be followed. For investigations of humans, state in the Methods section the manner in which informed consent was obtained from the study participants (i.e., oral or written). Editors may request that authors provide documentation of the formal review and recommendation from the institutional review board or ethics committee responsible for oversight of the study. UNAUTHORIZED USE AND COPYRIGHT AGREEMENT. Published manuscripts become the property of the Institute of Animal Reproduction and Food Research of the Polish Academy of Sciences (IAR&FR PAS) and may not be published elsewhere without written permission. Unauthorized use of the PJFNS name, logo, or any content for commercial purposes or to promote commercial goods and services (in any format, including print, video, audio, and digital) is not permitted by IAR&FR PAS. MANUSCRIPTS. A manuscript in English must be single-sided, preferably in TimesNewRoman (12) with 1.5-point spacing. The Editor reserves the right to make literary corrections and to make suggestions to improve brevity. English is the official language. The English version of the paper will be checked by Language Editor. Unclear and unintelligible version will be sent to the author(s) for correction. Every paper should be divided under the following headings in this order: a Title (possibly below 150 spaces), Running title (up to 50 spaces, submitted under the Title); the Names(s) of the author(s) in full. In paper with more than one author, the asterisk indicates the name of the author to whom correspondence and inquiries should be addressed, otherwise the first author is considered for the correspondence. Current full postal address of the indicated corresponding author or the first author must be given in a footnote on the title page; the Place(s) where the work was done including the institution name, city, country if not Poland. In papers originated from several institutions the names of the authors should be marked with respective superscripts; the Key words (up to 6 words or phrases) for the main topics of the paper; an Abstract (up to 250 words for regular papers and reviews and 100 words for Short Reports) summarizing briefly main results of the paper, no literature references; an Introduction giving essential background by saying why the research is important, how it relates to © Copyright by Institute of Animal Reproduction and Food Research of the Polish Academy of Sciences © 2015 Author(s). This is an open access article licensed under the Creative Commons Attribution-NonCommercial-NoDerivs License (http://creativecommons.org/licenses/by-nc-nd/3.0/). 150 Instruction for Authors previous works and stating clearly the objectives at the end; Materials and Methods with sufficient experimental details permitting to repeat or extend the experiments. Literature references to the methods, sources of material, company names and location (city, country) for specific instruments must be given. Describe how the data were evaluated, including selection criteria used; Results and Discussion may be presented together or separately. Results should be presented concisely and organized to supplement, but not repeat, data in tables and figures. Do not display the data in both tabular and graphic form. Use narrative form to present the data for which tables or figures are unnecessary. Discussion should cover the implications and consequences, not merely recapitulating the results, and it must be accomplished with concise Conclusions; Acknowledgements should be made to persons who do not fill the authorship criteria (see: Authorship forms) and include financial and material support; Appendix if necessary; References as shown below; a Summary (up to 25 lines in Polish for the native authors exclusively) giving main results with the reference to the tables and figures. ABBREVIATIONS AND UNITS. Abbreviations should only be used when long or unwieldy names occur frequently, and never in the title; they should be given at the first mention of the name. Metric SI units should be used. The capital letter L should be used for liters. Avoid the use of percentages (% g/g,% w/w; Mol-%; vol-%;), ppm, ppb. Instead, the expression such as g/kg, g/L, mg/kg, mg/cm3 should be used. Report concentration as 1 mol/L not 1 M/L. A space must be left between a number and a symbol (e.g. 50 mL not 50mL). A small × must be used as multiplication sign between numeric values (e.g. 5 × 10 2 mol-1). Statistics and measurements should be given in figures, except when the number begins a sentence. Chemical formulae and solutions must specify the form used. Chemical abbreviations, unless they are internationally known, Greek symbols and unusual symbols for the first time should be defined by name in the left margin. Common species names should be followed by the Latin at the first mention, with contracting it to a single letter or word for subsequent use. FIGURES should be submitted in separate files. They should be comprehensible without reference to the text. Maximum size 20 x 28 cm. If submitting chromatograms, please have them redrawn. Lettering: typed lettering not acceptable, should not appear on the figure but in the figure legend and should be uniform between figures. Three-dimensional graphs should only be used to illustrate real 3-D relationships. Start the scale of axes and bars or columns at zero, do not interrupt them or omit missing data on them. Figures must be cited in Arabic numbers in the text. Self-explanatory legend to all figures should be provided on the last pages of the manuscript under the heading “Legends to figures”. Electronic versions of Figures submitted with the manuscript should contain a link to data, so that they can be edited. TABLES should be submitted in separate files. They should be as few in number and as simple as possible (like figures, they are expensive and space consuming), and include only essential data with appropriate statistical values. Each must have an Arabic number, and a self-explanatory caption. EQUATIONS in the text as A = B/(C–D) not A B , unless they are more complicated. C–D REFERENCES each must have and Arabic number and must be listed alphabetically at the end of the paper in the form as follows: Periodicals – names and initials of all the authors, title of the paper, abbreviated journal title as in Chemical Abstracts, year of publication, volume, inclusive page numbers (titles of papers published in Polish must be translated into English; see example below); Books – names and initials of all the authors, name’s of editors, year of publication, publishing company, place of publication, inclusive page numbers; Patents – the name of the application, the title, the country, patent number or application number, the year of publication. For papers published in language other than English, the original language with a note whether the paper contains English abstract should be given in parentheses at the end. The reference list should only include peer-reviewed works that are cited in the text and that have been published or accepted for publication. References in the text must be cited by name and year in square parentheses (e.g.: one author – [Tokarz, 1994]; two authors – [Słonimski & Campbell, 1987]; more than two authors – [Amarowicz et al., 1994]). If more than one paper is published in the same year by the same author or group of authors use [Tokarz, 1994a, b]. Unpublished work must only be cited where necessary and only in the text by giving the person’s name. Examples: 1. Słonimski B.A., Campbell L.D., Gas chromatographic determination of indole glucosinolates – A re-examination. J. Sci. Food Agric., 1987, 40, 131–143. 2. Klos A., Rozmysl E., Stuzycka E., Bertrandt J., Cadmium and lead intake in daily diet of young males. Bromat. Chem. Toksykol., 1996, 29, 31–34 (in Polish; English abstract). 3. Uden Peter C., Gas chromatography. 1987, in: CRC Handbook of Chromatography, Inorganics, vol. 1 (ed. M. Queresi). CRC Press Inc., Boca Raton, Florida, pp. 44–46. 4. Baryłko-Pikielna N., Zarys analizy sensorycznej zywnosci. 1975, WNT, Warszawa, pp. 20–25 (in Polish). 5. Sandberg A.S., New aspects of antinutrient effect of phytate. 1994, in: Proceedings Intern. Euro Food Tox IV Conference, Bioactive substances in food of plant origin, vol. 2 (eds. H. Kozlowska, J. Fornal, Z. Zdunczyk). Centre for Agrotechnology and Veterinary Sciences, Polish Academy of Sciences, Olsztyn, Poland, pp. 303–315. 6. Kozlowska H., Nowak H., Method for myrosinase inactivation. Poland, patent No 118747, 1983 (in Polish). PAGE CHARGES. A standard page charge has been established at the rate of 40 PLN + 23% VAT per page of the manuscript. One page is 1800 characters including spaces. Each table and figure will be charged at the rate of 20 PLN + 23% VAT. Extra payment (+30% of standard page charge) will be charged of the author(s) applying for “express publication”. Additional charges can be considered in the case of authors whose paper will require the following: (i) remarking the figures in case the originals are expected to give poor reproductions; and (ii) ondemand printing of colour photographs. After notification by the Editor, the payment should be made by direct bank transfer to Bank Gospodarki Żywnościowej, Olsztyn, account No 17203000451110000000452110 Re: “Pol. J. Food Nutr. Sci.”. It is the author’s duty to prove that the payment has been made by sending the copy of bank transfer. Information on publishing and subscription is available from: Ms. Joanna Molga Editorial Office of Pol. J. Food Nutr. Sci. Institute of Animal Reproduction and Food Research Tuwima 10 Str., 10–747 Olsztyn 5, Poland phone (48 89) 523–46–70, fax (48 89) 523–46–70; e-mail: [email protected]; http://journal.pan.olsztyn.pl


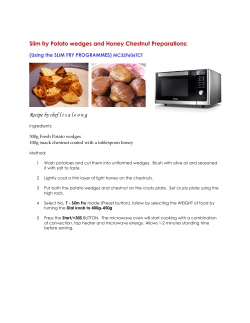

© Copyright 2026