
Vaccination versus treatment of influenza in working adults: a cost-effectiveness analysis
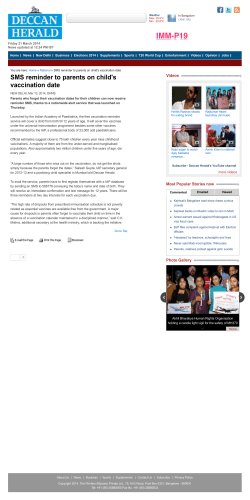
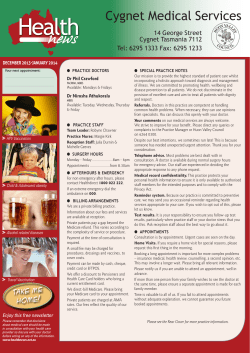
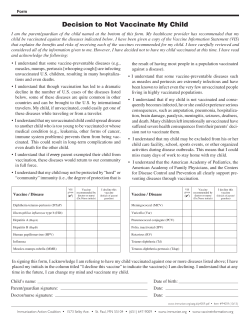
The American Journal of Medicine (2005) 118, 68-77
CLINICAL RESEARCH STUDY
Vaccination versus treatment of influenza in working
adults: a cost-effectiveness analysis
Michael B. Rothberg, MD, MPH,a,b David N. Rose, MDa,b
a
From the Division of General Medicine and Geriatrics, Department of Medicine, Baystate Medical Center (MR), Springfield,
Massachusetts, and
b
Tufts University School of Medicine (DNR), Boston, Massachusetts.
KEYWORDS:
Influenza;
Vaccination;
Antiviral therapy;
Cost-effectiveness;
Decision model
Purpose: To determine the cost-effectiveness of influenza vaccination, antiviral therapy, or no
intervention for healthy working adults, accounting for annual variation in vaccine efficacy.
Methods: We conducted a cost-effectiveness analysis based on published clinical trials of influenza
vaccine and antiviral drugs, incorporating 10 years of surveillance data from the World Health
Organization. We modeled influenza vaccination, treatment of influenza-like illness with antiviral
drugs, or both, as compared with no intervention, targeting healthy working adults under age 50 years
in the general community or workplace. Outcomes included costs, illness days, and quality-adjusted
days gained.
Results: In the base case analysis, the majority of costs incurred for all strategies were related to lost
productivity from influenza illness. The least expensive strategy varied from year to year. For the
10-year period, antiviral therapy without vaccination was associated with the lowest overall costs ($234
per person per year). Annual vaccination cost was $239 per person, and was associated with 0.0409
quality-adjusted days saved, for a marginal cost-effectiveness ratio of $113 per quality-adjusted day
gained or $41,000 per quality-adjusted life-year saved compared with antiviral therapy. No intervention
was the most expensive and least effective option. In sensitivity analyses, lower vaccination costs,
higher annual probabilities of influenza, and higher numbers of workdays lost to influenza made
vaccination more cost-effective than treatment. If vaccination cost was less than $16 or time lost from
work exceeded 2.4 days per episode of influenza, then vaccination was cost saving compared with all
other strategies.
Conclusion: Influenza vaccination for healthy working adults is reasonable economically, and under
certain circumstances is cost saving. Antiviral therapy is consistently cost saving.
© 2005 Elsevier Inc. All rights reserved.
Influenza affects 5% to 10% of the workforce annually,
costing billions of dollars in lost productivity.1 Although influenza vaccination is cost saving in elderly and high-risk
patients,2-5 results of cost-effectiveness studies involving
Requests for reprints should be addressed to Michael Rothberg, MD,
MPH, Division of General Medicine and Geriatrics, Baystate Medical
Center, 759 Chestnut Street, Springfield, Massachusetts 01199, or
E-mail address: [email protected].
0002-9343/$ -see front matter © 2005 Elsevier Inc. All rights reserved.
doi:10.1016/j.amjmed.2004.03.044
younger samples have been conflicting, even when accounting
for the economic effect of time lost from work.3,6-10 Because
hospitalizations or deaths due to influenza are rare among
healthy adults,11 vaccination mostly decreases morbidity. Annual vaccination could potentially prevent most cases of influenza. However, 10 to 40 workers must be vaccinated to prevent 1 case.12 Giving antiviral drugs to persons who develop
influenza-like illness is an alternative approach. Although antiviral therapy may work for more than half of all recipients, it
Rothberg and Rose
Vaccination versus Treatment of Influenza
Annual Vaccination
Antiviral Therapy
No Intervention
}
Healthy
Immune to A
M
Immune to B
Immune A & B
}
69
No ILI
Treat
Physician Visit
Test and Treat +
ILI
No Intervention
No Physician Visit
}
No Influenza
Influenza A
Influenza
Influenza B
}
No Complication
Hospitalization
Emergency
Room Visit
Complication
Home
Antibiotics
Figure 1 Markov model of yearly influenza infection. The decision to vaccinate is made before the start of the influenza season, at which
time all cohort members begin in the healthy state. Each week, subjects may develop influenza-like illness, which may be followed by a
physician visit. The physician decides, based on the current incidence of influenza, whether to treat, test, or withhold treatment (see Methods
for details). Patients with influenza may develop complications, including hospitalization, emergency department visit, or bacterial infection
requiring antibiotics. At the end of each week, cohort members return to the appropriate healthy or immune state. At the end of the season,
all members return to the healthy state. Squares denote decision nodes; M denotes weekly Markov cycle; circles denote chance events;
diamonds denote return to next Markov cycle; A and B refer to influenza types. ILI ⫽ influenza-like illness.
shortens the course of but does not prevent the illness, and it is
more expensive per course than vaccination. Rapid diagnostic
testing can improve the likelihood that only patients with
influenza will receive treatment, but testing is also expensive.
Randomized controlled trials conducted in a single year or
location are limited by annual variations in influenza incidence
and vaccination efficacy, and their results are therefore not
generalizable.6
We constructed a decision analysis model to determine
the cost-effectiveness of influenza vaccination, antiviral
therapy, or both for healthy working adults. To make sense
of discordant trial results, we incorporated yearly variations
in influenza rates and vaccine efficacy from 10 influenza
seasons. We also examined the effect of worksite-specific
variables, such as vaccination costs, the value of a workday,
and the number of workdays lost to influenza.
Methods
Decision analysis model
We constructed a Markov model using Decision Maker
7.07 (Pratt Medical Group, Boston, Massachusetts) to compare the outcomes of four strategies for healthy working
adults under 50 years of age: annual vaccination; two antiviral therapy strategies for patients presenting with influenza-like illness; and no intervention. To model vaccination
and treatment efficacy, we used World Health Organization
(WHO) and Centers for Disease Control and Prevention
(CDC) reports of the week-by-week incidence of influenzalike illness, and confirmed influenza infections by type from
1993 through 2002 (Appendix). The outcomes calculated
were cost and quality-adjusted days gained.
We made the following assumptions. The decision to vaccinate or to treat with antiviral therapy is made at the beginning
of the influenza season. Vaccination is provided in a low-cost
setting, such as an employee health service, and antiviral therapy is prescribed in a physician’s office. Influenza-like illness
is defined as an abrupt onset of fever plus cough, headache,
sore throat, or malaise. Antiviral therapy is initiated only if the
patient presents within 48 hours of symptom onset, and only
when influenza infections are reported in the previous week to
comprise 10% or greater of cases of influenza-like illness. The
CDC reports this information on its website14 and elsewhere.
The choice of antiviral medication is made when the patient
presents to the physician. We modeled two antiviral drug
strategies that have been shown to be reasonable when influenza prevalence is under 30%: empirical amantadine and rapid
testing followed by oseltamivir if results are positive.15,16 Both
drugs are effective against influenza type A and relatively safe.
Oseltamivir is more expensive, but is effective against influenza type B.
The model begins with all patients in the healthy state at
the start of the influenza season (Figure 1). During each
weekly cycle, patients may contract influenza-like illness
caused by influenza A, influenza B, or other viruses. Those
not contracting the illness remain in the healthy state. Ill
70
The American Journal of Medicine, Vol 118, No 1, January 2005
Table 1
Values, utilities, and costs used in the analysis, and ranges tested in sensitivity analyses
Variable
Baseline*
Influenza-like illness (per week)
Influenza, given influenza-like illness
Influenza B, given influenza
Physician office visit, given influenza-like illness
Complication of influenza requiring antibiotics
Hospitalization, given influenza
Average work loss from influenza (days)
Length of hospitalization (days)
Vaccination
Efficacy against matched strain
Side effects
Minor
Guillain-Barré Syndrome
Influenza rapid test
Sensitivity
Specificity
Antiviral therapy
Shortens duration of illness by (hours)
Amantadine
Oseltamivir
Efficacy against complications requiring antibiotics
Amantadine
Oseltamivir
Side effects
Amantadine
Oseltamivir
Utilities‡
Influenza
Hospitalization
Antiviral drug side effects
Vaccine minor side effects
Costs ($)
Vaccine§
Vaccine administration
Drugs, per course§
Amantadine
Oseltamivir
Antibiotics for influenza complications
Rapid test
Moderate complexity office visit
Emergency department visit
Hospitalization for influenza
Guillain-Barré Syndrome
Workday
0.02
Varies by week and year
Varies by week and year
0.4
0.10
0.004
1.9
4.4
Range*
Reference
0.005–0.03
0–0.31
0–1
0–1
0.05–0.17
0.001–0.007
0.5–5.0
3.9–4.8
14
14
14
6,17
18–20
21–23
8,24,25
26
0.72
0.54–0.83
12
0.64
1 ⫻ 10⫺6
0.10–0.70
1 ⫻ 10⫺5–1 ⫻ 10⫺7
27
28
0.65
0.99
0.50–0.78
0.95–1.00
Manufacturer†
Manufacturer†
17.5–31.0
24–72
29
18
0
0.53
0
0.08–0.76
No data
18,20
0.09
0.10
0–0.26
0.075–0.11
29–32
18,20,33,34
0.6
0.4
0.88
0.999
0–1
0–0.5
0.5–1.0
0.8–1.0
9,10
9,10
Estimate
Estimate
8.07
1.80
4.50–8.25
1.80–3.60
35
36
24
24
1.57
59.54
41.84
14.5
46
160
3663
124,737
177
0–25
3663–4957
0–500
37
37
37
List price
38
26
26,39
40
41
*Values are probabilities unless otherwise stated.
†Zstatflu-ZymeTx, Oklahoma City, Oklahoma.
‡Range from 1.0 (perfect health) to 0 (death).
§Component cost of the vaccine or drug. The total cost of treatment also includes the value of 30 minutes of worker’s time.
patients may consult a physician, who may prescribe empiric therapy or perform rapid testing. Patients with influenza may develop complications requiring antibiotics,
emergency department visits, or hospitalization. After recovering from influenza, patients are immune to the corresponding influenza type for the remainder of that season. At
the end of the season, all patients return to the healthy state
and the process is repeated for the next season.
We calculated outcomes with base case parameter values
and then performed sensitivity analyses using a wide range
of published values (Table 1).
We assumed that workers miss an average of 1.9 days for
an influenza-like illness, based on three U.S. studies,8,24,25 but
tested the range from 0.5 to 5.0 days in the sensitivity analysis.
Because work loss occurs only on weekdays, weekend days
count toward quality-adjusted days but do not accrue indirect
costs from work loss. We assumed that 40% of patients with
influenza-like illness visit a physician6,8,17,24 and that all visits
take place within 48 hours of symptom onset.
Antibiotic-requiring complication rates were based on
the experience of subjects in the placebo arms of treatment
trials.18,19 Hospitalization rates were based on rates calcu-
Rothberg and Rose
Vaccination versus Treatment of Influenza
lated for healthy young women21 and in healthy patients
under 65 years of age,22,23 which correlate closely with the
hospitalization rate among placebo recipients in influenza
treatment trials.42 Because influenza deaths in the young are
rare and there are no available data on mortality rates, we
assumed that no patients die of influenza.
Vaccine efficacy varies from year to year, depending on
how well the vaccine matches the circulating strains. In
well-matched years, efficacy against serologically proven
influenza is 72%.12 For each simulated year, we calculated
vaccine efficacy by multiplying 0.72 by the percentage of
circulating viruses that matched the vaccine strain in that
year.13,43,44 Adverse effects of influenza vaccine include
local soreness at the injection site,27 and, rarely, GuillainBarré syndrome.28 We estimated that adverse effects other
than Guillain-Barré syndrome last for 2 days.
The efficacy and side effects of antiviral drugs were
taken from randomized placebo-controlled trials of average-risk subjects with naturally occurring infection. Antiviral drugs decreased symptoms by 1 to 1.5 days,18 and
none have been proven to be more effective than another.
We modeled amantadine because it is the least expensive
in its class and oseltamivir because it is the only oral
neuraminidase inhibitor. Only neuraminidase inhibitors
have been shown to prevent bacterial complications of
influenza.18,20 Both drugs have a similar incidence of side
effects.18,20,29-34
Utilities are used to measure the quality of life in
various health states, using a scale from 1.0 for perfect
health to 0 for death. Previous cost-effectiveness models
of influenza vaccine, which employed the Quality of
Well-Being Index, assigned influenza illness a value of
0.6.9,10 Although some studies suggest that this estimate
may be too high,45 we used it to ease comparison between
studies. In the sensitivity analysis, we tested the full
range from 0 to 1.
Costs
We took a societal perspective in keeping with the recommendations of the Panel on Cost-Effectiveness in Health
and Medicine.46 Thus, we considered direct medical costs,
as well as the indirect cost of lost productivity due to illness,
using the average hourly cost of compensation for all civilian workers.41 Physician fees were based on a moderatecomplexity office visit for an established patient.38 We used
the retail price provided by the manufacturer for the rapid
diagnostic test (Zstatflu-ZymeTx, Oklahoma City, Oklahoma). Vaccination costs included the cost of the vaccine,
30 minutes of a worker’s time, and 5 minutes of a nurse’s
time. Medication costs were average wholesale prices plus
30 minutes of a worker’s time to fill the prescription. Hospitalization costs were based on 333 patients hospitalized
for influenza at 75 hospitals.26 All costs are converted to
2001 dollars using the medical care component of the Consumer Price Index.47
71
Sensitivity analysis
We performed one-way and multiway sensitivity analyses to determine if reasonable variations in parameter values
substantially affect the decision. We also performed a probabilistic (Monte Carlo) analysis to determine the probability
that each intervention is reasonably cost-effective. We used
normal distributions (for variables with values ⬎1) and logit
distributions (for values between 0 and 1) based on the 95%
confidence intervals reported in the literature. We then performed 1000 analyses, each calculated with randomly chosen values from these variable distributions.
Results
For the overall 10-year period, amantadine therapy was the
least expensive strategy, costing $234 per person per year,
and resulting in 0.0102 quality-adjusted days gained per
person per year as compared with no intervention (Table 2).
Annual vaccination cost was $4.64 more than amantadine
therapy and resulted in 0.0409 quality-adjusted days gained,
for a marginal cost-effectiveness ratio of $113 per qualityadjusted day gained or $41,000 per quality-adjusted lifeyear (QALY) saved. Oseltamivir therapy was less effective
than annual vaccination and cost more per quality-adjusted
day gained. For patients who were unwilling to take amantadine, annual vaccination had a cost-effectiveness ratio of
$46 per quality-adjusted day or $17,000 per QALY saved.
The least expensive strategy changed from year to year,
as a result of variations in circulating influenza strains
and the match between the strains and the vaccine
(Figure 2). For every influenza season except 1997–1998,
annual vaccination was the most effective strategy, and in
four of 10 seasons it was also the least expensive. In half the
years it was less expensive than no intervention, which was
always the least effective strategy.
In a hypothetical cohort of 1000 healthy working
adults, amantadine therapy had no effect, as compared
with no intervention, on the number of cases of illness,
hospitalizations, or physician office visits, but reduced
the number of lost workdays by 16% (Table 3). Annual
vaccination had a greater effect than did no intervention,
reducing by 57% the numbers of cases of influenza, lost
workdays, and hospitalizations. However, annual vaccination reduced cases of influenza-like illness and physician office visits by only 8%. Total costs for the cohort
ranged from $234,000 for amantadine therapy to
$239,000 for annual vaccination, with the majority of
costs due to lost productivity from influenza-like illness
(Table 4). Amantadine saved $3000 and vaccination
saved $6000 in lost productivity compared with no intervention. These savings were partially offset by the cost of
amantadine and wholly offset by the cost of vaccination.
72
The American Journal of Medicine, Vol 118, No 1, January 2005
Table 2
Results of base case analysis of four influenza strategies for healthy working adults
Strategy
Amantadine therapy
No intervention
Rapid test-oseltamivir therapy
Annual vaccination
Cost ($) Per
Year
Effectiveness (Illness
Days Per Year)
Incremental
Cost ($)
Incremental
Effectiveness (Illness
Days Avoided)
234
236
237⫺
239
1.75
1.76
1.73
1.63
—
2.31
2.51
4.64
—
⫺0.006
0.018
0.124
Quality-Adjusted
Days Lost
Amantadine therapy
No intervention
Rapid test-oseltamivir therapy
Annual vaccination
234
236
237
239
Incremental Costeffectiveness Ratio
($/Illness Day
Avoided)
—
Dominated*
Extended dominance†
37
Quality-Adjusted
Days Gained
0.692
0.702
0.692
0.651
—
2.31
2.51
4.64
—
⫺0.0102
0.0002
0.0409
Dominated*
Extended dominance†
113
*Removed because strategy costs more and is less effective than amantadine therapy.
†Removed because strategy is less cost-effective than vaccination.
Sensitivity analysis
Worksite-specific variables
Assuming an average rate for influenza-like illness of
2% per week during influenza season, the model predicted an annual influenza infection rate that varied from
6% to 10% during the 10-year study period (Table 5).
For the 3 years when the rate fell below 8%, annual
vaccination was expensive as compared with amantadine therapy ($222 per quality-adjusted day saved to
$682 per quality-adjusted day saved). In 4 of the years
when the rate exceeded 8%, annual vaccination was cost
saving.
In assessment of the least expensive strategy based on
three worksite-specific factors (the number of workdays
lost per episode of influenza, the value of those days, and
the cost of vaccination), annual vaccination was more
cost-effective for workers who missed more days of work
because of influenza illness (Figure 3). Beyond 2.4 days
of work lost per episode of influenza illness, annual
vaccination saved money relative to the amantadine therapy strategy. In contrast, if workers typically lost 1 day of
work, annual vaccination still improved health, but at a
0.08
20
0.06
Cost ($)
0.02
0
0
Cost ($)
Quality-Adjusted Days Gained
0.04
10
-0.02
Quality-adjusted days
gained
-10
-0.04
19921993
19931994
19941995
19951996
19961997
19971998
19981999
19992000
20002001
20012002
Influenza Season
Figure 2 Cost and effectiveness of annual vaccination as compared with no intervention over 10 consecutive influenza seasons. The dark
bars represent the difference in cost between the two strategies; the white bars represent the difference in quality-adjusted life-years
(QALYs). Positive numbers mean that annual vaccination increases costs or QALYs as compared with no intervention.
Rothberg and Rose
Vaccination versus Treatment of Influenza
73
Table 3 Annual effect (effectiveness) of four influenza vaccination and treatment strategies on a cohort of 1000 healthy adult
workers, averaged over 10 years
Strategy
Cases of
Influenza-Like
Illness
Cases of
Influenza
Lost Workdays
from Influenza
Hospitalizations
Courses of
Antiviral
Therapy
Rapid Office
Tests
Performed
Physician
Office Visits
0
0
264 (255–279)
0
264 (255–279)
Number (Range)
No intervention
Amantadine
therapy
Rapid testoseltamivir
Annual
vaccination
659 (636–698) 86 (65–103)
164 (123–201) 0.34 (0.30–0.40)
659 (636–698) 86 (65–103)
139 (107–169) 0.34 (0.30–0.40) 158 (131–199)
659 (636–698) 86 (65–103)
144 (109–175) 0.34 (0.30–0.40) 21 (15–27)
610 (581–645) 37 (27–72)
71 (51–138)
0.15 (0.10–0.30)
marginal cost of $753 per quality-adjusted day saved as
compared with amantadine therapy.
For nonworking adults, no intervention was the least
expensive strategy. Amantadine therapy cost $24 per quality-adjusted day saved compared with no intervention; annual vaccination cost $186 per quality-adjusted day saved
compared with amantadine therapy.
Changes as small as $5 in the overall cost of vaccination
made annual vaccination either cost saving or more than
$233 per quality-adjusted day gained. The cutoff of $5
represents just over 13 minutes of a worker’s time, and
formulations of the vaccine vary in price by as much as
$3.50 per dose.
Monte Carlo analysis
No intervention was never favored under any circumstances (Figure 4). Annual vaccination was always the most
effective strategy, as well as the least expensive strategy
18% of the time. Amantadine therapy was the least expensive the rest of the time. Annual vaccination cost less than
$100 per quality-adjusted day gained 40% of the time, and
less than $300 per quality-adjusted day gained 77% of the
time. Rapid testing followed by oseltamivir was more costeffective than the other two strategies less than 4% of the
time.
0
158 (131–199) 264 (255–279)
0
244 (229–257)
Discussion
Our analysis of influenza strategies for working adults accounted for variations in the match between circulating
influenza strains and vaccine components over a 10-year
period, and tested both annual vaccination and the option of
treating persons who develop influenza symptoms. During
this period, antiviral therapy with amantadine, but not oseltamivir, was found to be consistently cost saving compared with no intervention, and overall was the least expensive strategy, although it provided fewer health benefits than
did annual vaccination. Both the benefits and costs associated with vaccination were small. On average, vaccination
could be expected to prevent 49 cases of influenza per 1000
workers vaccinated, avoiding 93 lost workdays, or 0.09
days per employee, at a net cost of approximately $3 per
employee vaccinated.
We also found that the determinants of cost-effectiveness
fell into two categories: worksite-specific and influenza season–specific. Worksite variables, such as vaccination cost and
the average number of sick days taken by a worker because of
influenza infection, are predictable at the start of the influenza
season. Vaccination cost includes the cost of the vaccine, its
administration, and worker time spent being vaccinated. We
found vaccination attractive only when administered in a lowcost site, such as an employee health service.
Table 4 Annual effect (costs) of four influenza vaccination and treatment strategies on a cohort of 1000 healthy adult workers,
averaged over 10 years
Strategy
Total Cost
Lost
Productivity
Physician Office
Visits Cost ($)
Antiviral
Drugs
Rapid
Testing
Vaccine*
Complications†
Amantadine therapy
No intervention
Rapid test-oseltamivir
Annual vaccination
234,000
236,000
237,000
239,000
219,000
222,000
219,000
216,000
12,500
12,500
12,500
11,400
250
0
1230
0
0
0
2280
0
0
0
0
9870
1840
1840
1820
920
*Vaccine and administration, not including worker time for administration.
†Complications of influenza include sinusitis, pneumonia, and hospitalization.
74
The American Journal of Medicine, Vol 118, No 1, January 2005
Table 5
Sensitivity analysis*
Variable
Baseline Value (Range)
Probability of physician visit within 48 hours
Cost of a workday ($)
Workdays lost per episode of influenza
Workdays saved by a course of antiviral therapy
Utility of a day of influenza
Cost of vaccination ($)
0.4
177
1.9
1.0
0.6
21.06
(0.1–0.9)
(0–500)
(0.5–4.0)
(0.8–1.2)
(0–1)
(16–26)
Threshold
Value†
Range of Marginal Cost-effectiveness‡
($/Quality-Adjusted Day Gained)
—
455
2.44
—
—
16.42
74–227
Cost-saving - 186
Cost-saving - 6300
88–145
47–1780
Cost-saving - 236
*Only variables that changed the marginal cost-effectiveness by at least 30% are presented.
†Threshold at which annual vaccination becomes cost saving as compared with all other strategies.
‡Marginal cost-effectiveness as compared with amantadine therapy.
The number of workdays missed as a result of influenza
can be predicted based on worker demographic characteristics. Male workers and those in high-paying or demanding
jobs report missing fewer workdays due to influenza.25,48 In
1996, female workers under the age of 44 years reported
three times as many workdays lost due to influenza as did
male employees aged 45 years or older. This partially explains why one randomized trial found vaccination to be
costly, even when the vaccine was highly effective.6 In that
study, workers were predominantly male, and three quarters
had annual incomes of more than $70,000. Participants
missed an average of 0.79 workdays per influenza-like illness. Similar results have been reported in studies of healthcare workers.7,49,50 In contrast, studies of factory and service workers found that these employees missed between
2.8 and 4.9 workdays per illness.51,52 Because worker age,
sex, and compensation are known before the influenza season, these factors could be used in choosing workers for
vaccination.
Unlike worksite-specific determinants, influenza season–
specific determinants, such as the incidence of influenza and
the degree of match between the vaccine and circulating
viruses, vary from year to year and are unknown at the
beginning of the influenza season. For this reason, we relied
on CDC reports of national influenza activity and circulating viral strains to predict how vaccination programs would
have fared from 1992 to 2002. In years when influenza was
prevalent and the vaccine well-matched, vaccination was
inexpensive or even cost saving. When the match was poor
or influenza was uncommon, vaccination was very expensive. On average, the cost-effectiveness of vaccination compares favorably with other commonly accepted interventions, provided the cost of vaccination is low.53
Given the variability in both worksite- and influenza
season–specific determinants, it is not surprising that previous cost-effectiveness analyses have yielded discordant results. Although all investigators have found that vaccination
improves health, the economic effect is less certain. Large,
randomized placebo-controlled trials have only added to the
controversy. One trial found that vaccination saved $47 per
person vaccinated,17 whereas another, conducted over two
consecutive influenza seasons, found that vaccination increased societal costs by $11 to $66 per person vaccinated,
100
Value of a Workday ($)
400
Annual Vaccination
300
Amantadine Therapy
200
X
100
0
1.0
+$5
-$5
No Intervention
1.5
2.0
2.5
3.0
3.5
4.0
Workdays Lost Per Episode of Influenza Illness
Figure 3 Least costly influenza strategy as a function of worksite-specific variables. The graph is divided into zones, representing the least costly strategy. The solid line represents the thresholds among strategies in the base case; the dashed lines show how
the threshold changes if the cost of vaccination is increased (large
dashes) or decreased (small dashes) by $5. The X represents the
base case values.
Proportion of Monte Carlo Iterations Where Strategy
Is Favored (%)
500
90
80
70
60
Annual Vaccination
Test-Oseltamivir
Amantadine
50
40
30
20
10
0
0
200
400
600
800
1000
Willingness to Pay ($/Quality-Adjusted Day Gained)
Figure 4 Monte Carlo probabilistic sensitivity analysis for
healthy workers over a period of 10 years. Each line shows the
proportion of simulations for which that strategy would be optimal
for each willingness-to-pay value.
Rothberg and Rose
Vaccination versus Treatment of Influenza
depending on the year.6 Neither study considered the possibility of treatment with antiviral drugs.
The use of antiviral drugs for influenza has been
shown to be economically reasonable in working
adults.14,15,54 Obviously, the greater the probability that
the patient with influenza-like illness actually has influenza, the more cost-effective the use of antiviral medication. Based on the WHO surveillance criteria, even at
the peak of the influenza season, the proportion of isolates testing positive for influenza never exceeds 33%.14
However, when influenza is locally prevalent, the WHO
criteria of fever and cough have a positive predictive
value of greater than 70%.55,56 The cost-effectiveness of
antiviral therapy is also dependent on patients seeking
medical attention within 48 hours of symptom onset.
Although we assumed that only 40% of employees would
seek attention, this variable is potentially within the employer’s control. Encouraging employees to seek prompt
medical attention for fever and cough during the influenza season appears to save money, even for patients who
have already been vaccinated, especially in years when
the vaccine is not well matched to circulating strains of
influenza. If patients seek medical attention after 48
hours, the cost-effectiveness of empiric amantadine will
resemble no intervention, because no drugs will be dispensed.
Whether the benefit of vaccination justifies the cost depends on the perspective of the payer. Although cost-effectiveness analyses are typically conducted from the societal
perspective, society rarely pays for the interventions. For
the employer whose goal is to minimize costs, vaccination
makes sense only if worksite-specific variables favor vaccination. Health insurers or public payers who strive to
provide cost-effective care should consider vaccinating
healthy adults if vaccination costs less than $10, as in our
base case. Live attenuated influenza vaccine is currently too
expensive to consider for healthy adult workers. If it could
be administered for under $10, it would offer a reasonable
alternative to the injectable vaccine.
Our analysis has limitations. By not including a pandemic year, we almost certainly underestimated the benefits
of vaccination. In such years, attack rates may be much
higher and mortality in healthy adults rises sharply,11 making vaccination cost saving. Conversely, we also assumed
that vaccination side effects are mild. While in most years
this is true, in 1976 the rate of postvaccination GuillainBarré syndrome was 10 times higher than usual. We also
failed to include the effects of vaccination on nonvaccinated
workers. Decreasing influenza among vaccinated workers
may provide some protection to nonvaccinated colleagues
and family members as well. In health care facilities, vaccinating workers protects patients.57 Moreover, not all
workers are young and healthy. Instituting workplace vaccination could benefit workers with chronic illness who
might not otherwise comply with current recommendations
for vaccination.
75
After 20 years of data collection and public health
policy analysis, experts agree that vaccination benefits
healthy adults, but there is still no consensus on whether
the benefit justifies the cost. Because all strategies produce similar outcomes, small variations in influenza rate,
vaccine efficacy, or worker characteristics may tip the
balance for or against vaccination. Although these factors
are quantifiable, they are neither constant from year to
year nor from place to place. Thus, additional randomized clinical trials cannot answer the broader question.
Vaccination cannot be considered cost-effective under all
circumstances, nor can it be generally rejected. Individual persons, health plans, and employers must decide on
the basis of their specific circumstances, namely the cost
of vaccination and the quantity of work lost due to
influenza illness. For many healthy workers, annual vaccination is reasonable economically, but it will not save
money. At a minimum, prudent use of amantadine, as
compared with no intervention, should consistently reduce both days of illness and costs.
Appendix
Estimating the weekly incidence of influenza and influenza-like illness is challenging because both vary from
week to week. During the influenza season, the Centers for
Disease Control and Prevention (CDC) reports the number
of influenza-like illness specimens received from its sentinel
sites each week, as well as the proportion that test positive
for influenza. Assuming that the number of specimens collected is proportional to the number of cases of influenzalike illness, we were able to calculate the number of influenza cases for any given week y by the formula iy ⫽ b *
(wy/a) * py, where iy ⫽ number of influenza cases for week
y, b ⫽ baseline rate of influenza-like illness, wy ⫽ the
number of influenza-like illness cases in week y, a ⫽ the
average number of influenza-like illness cases that year, and
py ⫽ the percentage of influenza-like illness cases caused by
influenza in week y. All values are reported by the CDC
except for b. Empirically varying b results in different
predicted annual rates of influenza illness. When b ⫽ 2%
per week, the average predicted annual influenza attack rate
is 8.6%, with annual rates ranging from 6% to 10%, in
keeping with estimates by others.1,6,13
References
1. Szucs T: The socio-economic burden of influenza. J Antimicrob Chemother 1999;44(suppl B):11–15
2. Nichol KL, Baken L, Wuorenma J, Nelson A: The health and economic benefits associated with pneumococcal vaccination of elderly
persons with chronic lung disease. Arch Intern Med 1999;159:2437–
2442
3. Nichol KL, Margolis KL, Wuorenma J, Von Sternberg T: The efficacy
and cost effectiveness of vaccination against influenza among elderly
persons living in the community. N Engl J Med 1994;331:778 –784
76
4. Davis JW, Lee E, Taira DA, Chung RS: Influenza vaccination, hospitalizations, and costs among members of a Medicare managed care
plan. Med Care 2001;39:1273–1280
5. Nordin J, Mullooly J, Poblete S, et al: Influenza vaccine effectiveness
in preventing hospitalizations and deaths in persons 65 years or older
in Minnesota, New York, and Oregon: data from 3 health plans.
J Infect Dis 2001;184:665– 670
6. Bridges CB, Thompson WW, Meltzer MI, et al: Effectiveness and
cost-benefit of influenza vaccination of healthy working adults: a
randomized controlled trial. JAMA 2000;284:1655–1663
7. Weingarten S, Staniloff H, Ault M, Miles P, Bamberger M, Meyer RD:
Do hospital employees benefit from the influenza vaccine? A placebocontrolled clinical trial. J Gen Intern Med 1988;3:32–37
8. Campbell DS, Rumley MH: Cost-effectiveness of the influenza vaccine in a healthy, working-age population. J Occup Environ Med
1997;39:408 – 414
9. Cost-effectiveness of flu vaccine. Congressional Office of Technology
Assessment. Conn Med 1982;46:607
10. Muennig PA, Khan K: Cost-effectiveness of vaccination versus treatment of influenza in healthy adolescents and adults. Clin Infect Dis
2001;33:1879 –1885
11. Simonsen L, Clarke MJ, Schonberger LB, Arden NH, Cox NJ, Fukuda
K: Pandemic versus epidemic influenza mortality: a pattern of changing age distribution. J Infect Dis 1998;178:53– 60
12. Demicheli V, Rivetti D, Deeks J, Jefferson T: Vaccines for preventing
influenza in healthy adults. Cochrane Database Syst Rev Volume 2;
2002
13. Nichol KL: Cost-benefit analysis of a strategy to vaccinate healthy
working adults against influenza. Arch Intern Med 2001;161:749 –759
14. Centers for Disease Control and Prevention. Reports and Surveillance Methods In The United States: Current U.S. Flu Report.
2002. Available at: http://www.cdc.gov/ncidod/diseases/flu/
weeklychoice.htm. Accessed May 28, 2002
15. Rothberg MB, He S, Rose DN: Management of influenza symptoms in
healthy adults. J Gen Intern Med 2003;18:808 – 815
16. Smith KJ, Roberts MS: Cost-effectiveness of newer treatment strategies for influenza. Am J Med 2002;113:300 –307
17. Nichol KL, Lind A, Margolis KL, et al: The effectiveness of vaccination against influenza in healthy, working adults. N Engl J Med
1995;333:889 – 893
18. Treanor JJ, Hayden FG, Vrooman PS, et al: Efficacy and safety of the
oral neuraminidase inhibitor oseltamivir in treating acute influenza: a
randomized controlled trial. US Oral Neuraminidase Study Group.
JAMA 2000;283:1016 –1024
19. Kaiser L, Henry D, Flack NP, Keene O, Hayden FG: Short-term
treatment with zanamivir to prevent influenza: results of a placebocontrolled study. Clin Infect Dis 2000;30:587–589
20. Nicholson KG, Aoki FY, Osterhaus AD, et al: Efficacy and safety of
oseltamivir in treatment of acute influenza: a randomised controlled
trial. Neuraminidase Inhibitor Flu Treatment Investigator Group. Lancet 2000;355:1845–1850
21. Neuzil KM, Reed GW, Mitchel EF Jr, Griffin MR: Influenza-associated morbidity and mortality in young and middle-aged women.
JAMA 1999;281:901–907
22. Barker WH, Mullooly JP: Impact of epidemic type A influenza in a
defined adult population. Am J Epidemiol 1980;112:798 – 811
23. Simonsen L, Fukuda K, Schonberger LB, Cox NJ: The impact of
influenza epidemics on hospitalizations. J Infect Dis 2000;181:831–
837
24. Nichol KL, Mendelman PM, Mallon KP, et al: Effectiveness of live,
attenuated intranasal influenza virus vaccine in healthy, working
adults: a randomized controlled trial. JAMA 1999;282:137–144
25. Olsen GW, Burris JM, Burlew MM, et al: Absenteeism among employees who participated in a workplace influenza immunization program. J Occup Environ Med 1998;40:311–316
26. Cox FM, Cobb MM, Chua WQ, McLaughlin TP, Okamoto LJ: Cost of
treating influenza in emergency department and hospital settings. Am J
Manag Care 2000;6:205–214
The American Journal of Medicine, Vol 118, No 1, January 2005
27. Nichol KL, Margolis KL, Lind A, et al: Side effects associated with
influenza vaccination in healthy working adults. A randomized, placebo-controlled trial. Arch Intern Med 1996;156:1546 –1550
28. Lasky T, Terracciano GJ, Magder L, et al: The Guillain-Barre syndrome and the 1992-1993 and 1993-1994 influenza vaccines. N Engl
J Med 1998;339:1797–1802
29. Jefferson T, Demicheli V, Rivetti D, Deeks J: Cochrane reviews and
systematic reviews of economic evaluations. Amantadine and rimantadine in the prevention and treatment of influenza. Pharmacoeconomics 1999;16(suppl 1):85– 89
30. Wingfield WL, Pollack D, Grunert RR: Therapeutic efficacy of
amantadine HCl and rimantadine HCl in naturally occurring influenza A2 respiratory illness in man. N Engl J Med 1969;281:579 –
584
31. Van Voris LP, Betts RF, Hayden FG, Christmas WA, Douglas RG Jr:
Successful treatment of naturally occurring influenza A/USSR/77
H1N1. JAMA 1981;245:1128 –1131
32. Dolin R, Reichman RC, Madore HP, Maynard R, Linton PN, WebberJones J: A controlled trial of amantadine and rimantadine in the
prophylaxis of influenza A infection. N Engl J Med 1982;307:580 –584
33. Hayden FG, Atmar RL, Schilling M, et al: Use of the selective oral
neuraminidase inhibitor oseltamivir to prevent influenza. N Engl
J Med 1999;341:1336 –1343
34. Hayden FG, Treanor JJ, Fritz RS, et al: Use of the oral neuraminidase
inhibitor oseltamivir in experimental human influenza: randomized
controlled trials for prevention and treatment. JAMA 1999;282:1240 –
1246
35. 2002 Mosby’s Drug Consult. St. Louis, Missouri: Mosby, Inc.; 2002
36. U.S. Bureau of Labor Statistics: 2000 National Occupational Employment and Wage Estimates Healthcare Practitioners and Technical Occupations. Available at: http://www.bls.gov/oes/2000/
oes_29He.htm. Accessed October 2, 2002.
37. 2001 Drug Topics Red Book. Montvale, New Jersey: Medical Economics, Inc; 2001
38. Crane M: What you charge vs what you get. Med Econ 2001;78:50 –
52,55-57
39. The MEDSTAT Group: 2000 DRG Guide: Descriptions and Normative Values. Ann Arbor, Michigan: MEDSTAT Group; 2001
40. Meltzer MI, Cox NJ, Fukuda K: The economic impact of pandemic
influenza in the United States: priorities for intervention. Emerg Infect
Dis 1999;5:659 – 671
41. U.S. Bureau of Labor Statistics: Employer Costs for Employee Compensation—March 2001. Available at: ftp://ftp.bls.gov/pub/special.
requests/ocwc/ect/ececrlse.pdf. Accessed May 28, 2002.
42. Kaiser L, Keene ON, Hammond JM, Elliott M, Hayden FG: Impact of
zanamivir on antibiotic use for respiratory events following acute
influenza in adolescents and adults. Arch Intern Med 2000;160:3234 –
3240
43. Brammer L, Fukuda K, Arden N, et al: Influenza surveillance—United
States, 1992-93 and 1993-94. Mor Mortal Wkly Rep CDC Surveill
Summ. 1997;46:1–12
44. Brammer TL, Izurieta HS, Fukuda K, et al: Surveillance for influenza—United States, 1994-95, 1995-96, and 1996-97 seasons. Mor
Mortal Wkly Rep CDC Surveill Summ 2000;49:13–28
45. Griffin AD, Perry AS, Fleming DM: Cost-effectiveness analysis of
inhaled zanamivir in the treatment of influenza A and B in high-risk
patients. Pharmacoeconomics 2001;19:293–301
46. Gold M, Siegel J, Russell L, Weinstein M, eds: Cost-Effectiveness in
Health and Medicine. New York, New York: Oxford University Press;
1996
47. U.S. Bureau of Labor Statistics. Consumer Price Index—All Urban Consumers. Available at: http://data.bls.gov/cgi-bin/surveymost?cu. Accessed
May 28, 2002
48. Adams P, Hendershot G, Marano M: Current estimates from the
National Health Interview Survey, 1996. Vital Health Stat 10. 1999;
200:55
Rothberg and Rose
Vaccination versus Treatment of Influenza
49. Saxen H, Virtanen M: Randomized, placebo-controlled double blind
study on the efficacy of influenza immunization on absenteeism of
health care workers. Pediatr Infect Dis J 1999;18:779 –783
50. Wilde JA, McMillan JA, Serwint J, Butta J, O’Riordan MA, Steinhoff
MC: Effectiveness of influenza vaccine in health care professionals: a
randomized trial. JAMA 1999;281:908 –913
51. Keech M, Scott AJ, Ryan PJ: The impact of influenza and influenzalike illness on productivity and healthcare resource utilization in a
working population. Occup Med (Lond) 1998;48:85–90
52. Kumpulainen V, Makela M: Influenza vaccination among healthy employees: a cost-benefit analysis. Scand J Infect Dis 1997;29:181–185
53. Mark DB, Hlatky MA, Califf RM, et al: Cost effectiveness of thrombolytic therapy with tissue plasminogen activator as compared with streptokinase for acute myocardial. N Engl J Med 1995;332:1418 –1424
77
54. Lee PY, Matchar DB, Clements DA, Huber J, Hamilton JD, Peterson ED: Economic analysis of influenza vaccination and antiviral
treatment for healthy working adults. Ann Intern Med 2002;137:
225–231
55. Boivin G, Hardy I, Tellier G, Maziade J: Predicting influenza infections during epidemics with use of a clinical case definition. Clin Infect
Dis 2000;31:1166 –1169
56. Zambon M, Hays J, Webster A, Newman R, Keene O: Diagnosis of
influenza in the community: relationship of clinical diagnosis to confirmed virological, serologic, or molecular detection of influenza. Arch
Intern Med 2001;161:2116 –2122
57. Potter J, Stott DJ, Roberts MA, et al: Influenza vaccination of health
care workers in long-term-care hospitals reduces the mortality of
elderly patients. J Infect Dis 1997;175:1– 6


© Copyright 2026