
Document 137463
Eur Aesplr J
1991' 4, 1106-1116
Chronic obstructive pulmonary disease and anaesthesia:
formation of atelectasis and gas exchange impairment
L. Gunnarsson, L. Tokics, H. Lundquist, B. Brismar,
A.
Strandberg, B. Berg, G. Hedenstierna
Chronic obstructive pulmonary disease and anaesthesia: formation of
atelectasis and gas exchange impairment. L. Gunnarsson, L. Tokics,
H. Lundquist, B. Brismar, A. Strandberg, B. Berg, G. Hedenstierna.
ABSTRACT: Gas exchange Impairment and the development or atel·
ectasis during enflurane anaesthesia were studied In 10 patients (me.a n
age 70 yrs) with chronic obstructive pulmonary disease (COPD). Awake,
no patient displayed atelectasis as assessed by COI}lplJted X-ray tomog·
raphy. The veotilation!perfusloo distribution (VA/Q), studied by the
mu~tlpl~ inert gas elimination technique, displayed an increased dispersion
of VA/Q ratios (the logarithmic standard deviation or the perfusioo
distribution, mean log Q so 0.99; upper 95% confidence llmi~ o~ normal
subject:, 0.~0), and Increased perfusion of regions with low VA/Q ratios
(0.005<VA/Q<0.1: 5.4% of cardiac output). Shunt was negligible (mean
0.6%). Computed chest tomography showed significantly larger cross·
sectional thoracic areas than previously seen in subjects with healthy
. •
lu.ngs (p<0.01). No atelectasis was seen In any patient.
During anaesthesia there was a further worsening or the VA/Q
mismatch with slgolflcantly Increased log Q so (1.29, p<0.05) but no
Increase In shunt (mean 1% ). Minor atelectatic areas were noted In
three patients, the others displayed oo atelectasis at all. Chest dimensions
were reduced by oo more than 3% during anaesthesia, suggesting ao
unchanged or only minimally affected functional residual capacity.
These findings contrast with those seen io patients with healthy lungs
in whom atelectasis and shunt regularly develop during anaesthesia.
Eur Respir J., 1991, 4, 1106-1116.
Pulmonary gas exchange is impaired during anaesthesia and sometimes arterial hypoxaemia may develop
despite supplemental oxygen in the inspired g~s
2].
Studies on ventilation/perfusion distributions VA/Q, as
assessed by multiple inert gas elimination technique [3],
have shown the appearance of shunt and yarY.ing but
mostly minor increase in the dispersion of VA/Q ratios
[4-7]. In recent studies we have demonstrated prompt
development of atelectasis on induction of anaesthesia
[8]. The magnitude of shunt correlated to the size of
the atelectasis [9, 10]. Thus, a major cause of gas
exchange impairment during anaesthesia has been
identified.
Patients with chronic obstructive pulmonary disease
(COPD) have an impaired gas exchange already in the
awake state [3, 11, 12], and there is a further worsening
of their gas exchange impairment during anaesthesia
[2-4]. COPD patients also have a higher incidence of
postoperative complications than patients with healthy
lungs [4, 13-16].
We addressed the question of whether COPD patients
develop their more severe gas exchange impairment
during anaesthesia because of larger formation of atelectasis than in anaesthetized subjects with healthy lungs,
or whether they develop a qualitatively different
n.
Depts of Anaestbesiology, Roentgenology and
Surgery, Huddinge University Hospital, Huddinge
and Dept of Clinical Physiology, University
Hospital, Uppsala, Sweden.
Correspondence: G. Hedenstiema, Dept of Clinical
Physiology, University Hospital, S-75185 Uppsala,
Sweden.
Keywords: Anaesthesia; atelectasis; chronic
obstructive pulmonary disease; computed tomography; enflurane; inhalation; lung; ventilation distribution, ventilation/perfusion.
Received: April 13, 1989; accepted after revision
June 3, 1991.
Supported by the Swedish Medical Research Council (5315), the Karolinska Institute and the Swedish
Heart and Lung Foundation.
pulmonary dysfunction. The purpose of the present study
was, therefore, to study gas exchange and ventilation/
perfusion distributions with the multiple inert gas elimination technique in patients with severe chronic obstructive pulmonary disease, and to correlate the findings
with atelectasis formation, if any, as assessed by
computed chest tomography.
Patients and methods
Ten patients scheduled for elective abdominal or
vascular reconstructive surgery were studied, awake,
immediately before, and during general anaesthesia.
Seven were men and three women, their ages ranging
from 57-77 yrs (mean 70 yrs) (table 1). All patients
were, or had been, heavy smokers and all patients suffered from chronic bronchitis according to the defini·
tion of the British Medical Research Council (productive
cough for at least 3 months per year during the last 3
years). Spirometry before the investigation showed
increased functional residual capacity (FRC) and/or
residual volume (RV), and reduced expiratory flow to
less than 80% of the expected value in all patients
(table 1). Most of the patients received medication both
Table 1. -
Subject data
No. Sex Age Height
Weight
Smoking habits
free
pack
yrs
yrs
TLC
FRC
%pred %pred
VC
RVfl'LC
FEV/FVC
%pred
%
%
Pao2 Paco2
awake awake
kPa
kPa
Surgical
diagnosis
Medication
M/F
yrs
m
kg
1
M
77
1.80
60
6
25
96
124
85
54
44
10.8
4.1
Sigmoid cancer
Furosemide
2
F
70
1.45
41
0.5
12
140
156
75
63
40
8.1
5.9
Stenosis of the
femoral artery
Salbutamol, nifedipine,
furosemide
3
M
72
1.74
70
8
30
104
131
112
48
38
7.9
5.2
Aortic aneurysm
Terbutaline, salbutamol,
becotide, theophylline
4
M
74
1.75
74
10
40
107
130
98
46
34
10.7
3.7
Aortic aneurysm
Salbutamol,
be<:lomethasone
s
M
65
1.74
77
2
40
116
144
102
47
so
10.3
5.5
Renal artery
stenosis
Digoxine, nifedipine,
enalapril, prazosin
6
M
57
1.78
87
42
97
72
89
40
55
9.6
5.3
Rectal cancer
Metaprolol,
hydralazine,
bendroflumethiazide
~
~
>
S!
(")
7
M
75
1.78
56
8
M
67
1.76
49
9
F
69
1.52
44
10
Mean
SD
F
77
1.74
70
70
1.72
:7.9 :0.11
63
:17.4
10
0.3
2
22
80
75
76
45
60
9.6
5.3
Sigmoid cancer
Theophylline
39
103
147
81
55
50
12.0
4.8
Rectal cancer
Theophylline, digoxin
25
111
119
92
58
57
9.0
6.5
Aortic, iliacal
emboli
Theophylline,
terbutaline,
beclomethasone
55
111
163
67
107
126
:31.0
88
:13.6
:15.5
68
45
8.5
6.2
52
47
:t:8.6
9.7
:t:1.3
:0.7
:~:8:8
Aortic aneurysm
Theophylline,
bromhexine
bendroftumethiazide,
sodium cromoglycate
0
9
~
~fil
~
~
~
(")
~
0
m
5.6
TLC: total lung capacity; FRC: functional residual capacity; VC: vital capacity; RV: residual volume; FEV1: forced expiratory volume in one second; FVC: forced vital capacity;
Pao2 and Paro2: arterial oxygen and carbon dioxide tension, respectively.
....
....
0
-..1
1108
L. GUNNARSSON ET AL.
for COPD and coexistent cardiovascular disease,
consisting of theophylline, ~2-agonists, digitalis and diuretics. The patients did not receive any bronchodilator
therapy for at least 12 h prior to the study and none of
the patients needed bronchodilator treatment during the
investigation. The patients were studied in the awake
state and after 15 min of general anaesthesia. Five of
the patients were randomly selected and studied after
an additional 30 min of anaesthesia.
Informed consent was obtained from each patient and
the study was approved by the Ethics Committee of
Huddinge University Hospital. All patients were ventilated postoperatively until circulation was stable and
body temperature normal. The postoperative ventilator
period lasted less than 6 h in all patients except in patient
no. 9. She was reoperated twice due to bleeding and
eventually died two days later. No other postoperative
complications were noted.
Anaesthesia
All patients received atropine 0.5 mg i. v. before
induction of anaesthesia. No other premedication was
given. Anaesthesia was induced with thiopental
300-400 mg and fentanyl 0.10 mg i.v., and was maintained with enflurane (0.6-1.0%) in oxygen/nitrogen with
an inspired oxygen fraction of 0.4. To facilitate
intubation the patients received suxamethonium 75-100
mg i. v. To maintain muscle paralysis a priming dose of
6-8 mg pancuronium bromide was given i. v., and
intermittent doses of 2 mg i. v. were given when needed.
After intubation the patients were ventilated mechanically at a rate of 12 breaths·min·1 (Servo 900 C Ventilator, Siemens) equipped with an infra-red carbon
dioxide analyser (C0 2 Analyzer 930, Siemens).
The minute ventilation was adjusted to maintain an
end-tidal CO concentration of approximately 4%.
Ventilatory voiumes and airway pressures were read on
the ventilator.
calculated. Systemic (SVR) and pulmonary (PVR)
vascular resistances were calculated as SVR=(systemic
mean arterial pressure-right atrial pressure)/cardiac
output and PVR=(pulmonary artery mean pressurepulmonary capillary wedge pressure)/cardiac output,
respectively.
Ventilation perfusion ratios
Six gases (sulphur hexafluoride, ethane, cyclopropane,
halothane, diethyl ether and acetone) were dissolved in
isotonic saline and infused into a vein at a rate of 3
ml·min·1• After 40 min of infusion, under steady-state
conditions, arterial and mixed venous blood samples
were taken and mixed expired gas was collected for
analysis by gas chromatography (Sigma 3, PerkinElmer). Technical details have been reported previously,
[17). Blood-gas-partition coefficients were determined
by a two-step procedure [18]. Arterial/mixed venous
and mixed expired/mixed venous gas concentration ratios
(retention and excretion, respectively) were plotted
against blood gas partition coefficients. By formal
mathematical analysis with enforced smoothing, these
relationships were transformed into a multi~ompartmental plot of blo<?d flow and ventilation against
VA/Q [19, 20). From the VA/Q distributions, we present
data for the mean and standard deviation of the blood
flow log distribution (QM and log so Q, respectively),
shunt (perfusio,n qf lung regions with VA/Q ratios
<0.005), "low VA/Q" (perfusion of lung regions with
0.005 <VA/Q ratios <0.1), the mean and standard
deviation of the ventilation l9g qistribution (VM and log
so V, respectively), "~igh VA/Q" (ventilation of lung
regions with 10<VA/Q ratios <lOq), ~nd deadspace
(Vo; ventilation of lung regions with VA/Q ratios >100).
All subdivisions of blood flow and ventilation are
expressed in percentage of cardiac output and expired
minute ventilation, respectively.
Additional gas analysis
Catheterization
A triple-lumen thermistor-tipped catheter, Swan-Ganz
7 F (Edward's Laboratories), was introduced percutaneously by a sleeve technique into a medial cubital vein.
The catheter was advanced to the pulmonary artery under
radiographic guidance. Pulmonary vascular pressures
relative to atmospheric pressure were recorded, and
mixed venous blood was drawn for gas analyses (see
below). The brachial artery was cannulated for pressure recordings and blood sampling, and an additional
venous catheter was inserted into the opposite arm for
infusion of inert gases (see below).
Cardiac output was determined by thermodilution. Ten
ml of ice-cold glucose 5% was manually injected into
the right atrium at random during the respiratory cycle,
and the dilution curve was analysed by a cardiac output
computer (model 9250 A, Edward's Laboratories).
Under each investigated condition 3 to 4 measurements
of cardiac output were made and the mean value was
Arterial oxygen tension (Pao:J, mixed venous oxygen
tension (Pvo 2) and arterial carbon dioxide tension
(Paco 2,) were measured by standard techniques
(blood-gas analyser: ABL2, Radiometer). Samples of
inspiratory gas were analysed for oxygen by mass
spectrometry (Centronics, MGA 200).
Computed tomography (CT) of the chest
The transverse lung area and the structure and density
of the lungs were studied by CT scanning. The subject
lay supine on the tomograph table (Somatom 2,
Siemens). A frontal scout view covering the chest was
initially obtained. Two CT scans in the transverse plane
were then performed, the lowermost at a level just above
the top of the diaphragm and the other 5 cm cephalad
to the first one. The same scan levels, relative to the
spine, were used during the succeeding measurements
during anaesthesia. The scan time was 5 s, at 115 mAs
ANAESTHESIA IN COPD, ATELECfASIS AND GAS EXCHANGE
and 125 kV, slice thickness 8 mm, and centre/window
setting ::t0/512.
The transverse area of the thorax was calculated from
the images. To calculate the dense area a magnified
image (2x) was made of the dorsal portion of the er
scan with an image from both the right and left
lungs. The border between the thoracic wall and the
dense area can be identified on the magnified image,
although the attenuations of the dense area and of the
soft tissues of the chest wall did not differ by more than
30-40 Hounsfield units (HU). A manual delineation of
the dorsal border of the dense area was made. The
ventral border of the dense area is recognized by the
high contrast in the er scan between the air-filled and
dense lung parenchyma. The ventral border was
encircled at some distance so that, together with the
dorsal border, a region of interest was created. Within
this region, atelectasis was defined as picture elements
(pixels) with an attenuation value between -100
and +100 HU. The atelectatic area was calculated by
the computer. The amount of atelectasis in the lungs
was expressed in percentage of the total transverse area
of the thoracic cavity. The variability in duplicate
measurements of the manually delineated areas was 5%.
Procedure
The catheters were introduced at the catheterization
laboratory, and the infusion of the inert gases was started.
The patient was then moved to the X-ray department
and after 20 min of complete rest (40 min of infusion)
recordings of central haemodynamic and gas exchange
variables were made while the patient was breathing
air. er scans were then obtained and the patient
was anaesthetized. After 15 min of enflurane anaesthesia in oxygen/nitrogen, the haemodynamic and gas
exchange variables were recorded and the er scans repeated. In five patients new measurements were made
after an additional 30 min (total 45 min) of anaesthesia.
After the study the patient, while still anaesthetized,
was moved to the operating room. All recordings, awake
and during anaesthesia, were made with the patient in
the supine position.
Statistics
Mean values and standard deviations (so) were calculated. The significance of a difference between the
awake state and the condition of anaesthesia, as well as
between 15 and 45 min of anaesthesia, were tested by
Wilcoxon signed rank's test and Friedman two-way
analysis of variance by ranks.
Results
Awake
Before induction of anaesthesia, minute ventilation,
cardiac output, and central systemic and pulmonary
1109
vascular pressures were within normal limits in all subjects, but pulmonary vascular resistance (PVR) was
increased [21] (tables 2 and 3). No correlation between
impairment of spirometry and impairment of gas
exchange could be found.
Retention and excretion data of the measured inert
gases resulted in technically good VA/Q distributions.
The fit of the VA/Q data expressed as the remaining
sum of squares (RSS) averaged 3.1 and was less than 6
in all but two patients (table 3) (22]. The ventilation/
perfusion distribution was abnorm~l in. all patients with:
1) perfusion of regions with low VA/Q ratios (patients
no. 6-10); 2) ventilation of regions with high VA/Q
ratios (patient no. 2), or a combination of both (patients
no. 3-5); or 3) broadening of the main mode (increased
log so Q: 0.99; upper 95% confidence limit of normal:
0.60 [23]) (patient no. 1) (fig. 1). The perfusion of
regions with low VA/Q ratios averaged 5.4% of cardiac
output and the ventilation of regions with high VA/Q
ratios was 2.2% of the total minute ventilation. Only a
small shunt was seen, with a mean of 0.6%. For data
on VA/Q distributions, see table 3. Six patients had
a Pao2 below 10.0 kPa, the lower normal limit at
our laboratory, see also [24). Paco2 averaged 5.3 kPa
(table 3). PVo2 was 5.1 kPa awake.
The cross-sectional thoracic area averaged 398 cm2 in
the caudal er scan and 375 cm2 in the cranial er scan,
which was significantly larger at both scan levels than
in previously studied subjects with healthy lungs (areas:
scan 1: 377::t41 and scan 2: 335::t45 cm 2, n=45, p<0.01
at both scan levels, own unpublished data) (fig. 2). For
comparison with a subject with healthy lungs, see fig 3.
No atelectasis was seen in any of the patients (table 4).
No correlation between cross-sectional thoracic area and
pulmonary function tests was found.
Anaesthesia. (table 2 and 3)
The first recordings were made after approximately
15 min of enflurane anaesthesia during mechanical
ventilation and muscle paralysis. Cardiac output and
systemic arterial blood pressure were reduced to
approximately 65-80% of the awake level. Heart rate
tended to increase. Minor changes in right atrial,
pulmonary arterial mean and wedge pressures were seen
however, the PVR was not altered compared to the
awake state. Tidal volume (and minute ventilation) was
deliberately reduced to about 3/4 of the awake level to
maintain an end-tidal C0 2 level of approximately 4%.
End-inspiratory airway pressure, measured in the
ventilator tubings, averaged 11 cmH20.
RSS averaged 2.4 during the anaesthesia measurements, and exceeded 6 in only one of the 15 recordings
made during anaesthesia. There was an increased
dispersion of ratios (increased log so Q) after 15 min of
anaesthesia, indicating a worsening of the mismatch,
and a slight right shift of the distribution of the ventilation curves towards higher VA/Q ratios (increased VM).
The ,COf!lmOn finding in all patients was that the pattern
of VA/Q mismatch that was seen when awake was
Table 2. -
....
....
....0
Central circulation and ventilation, awake and during anasthesia
CO
Vascular mean pressures
Syst
Pulm
Wedge
mmHg
mmHg
mmHg
HR
SVR
RA
mmHg
PVR
Vs
VT
Respiratory
l·m.in·l
ml
breath·min·1
End-inspiratory
airway pressure
cmHzO
646
:t211
13
:t0.3
0
:tO
l·m.in·l
b·m.in·l
5.0
:t1.3
68
:t6
94
:t21
18
:t4
7
:t3
5
:t4
~.3
2.31
:t0.83
8.0
:t2.4
Anaesthesia 15 miD (n=10)
3.8•
:t0.9
73
:t14
62*
:t10
15
:t3
6
:t3
5
:t3
15.7
:t3.8
2.27
:t0.98
5.8•
:t1.6
480•
:t77
12
:tO.O
11•
:t4
Anaesthesia 45 mla (n=S)
3.8•
:t1.2
75
:t14
69
:t23
17
:t.3
7
:t3
6
:t2
16.7
:t4.3
2.60
:tl.lO
5.8•
:t0.4
475*
:t59
12
:tO.O
9•
:t2
Percentage of anaesth. 15 min1
106
103
113
113
117
120
99
100
100
100
100
100
mmHg·l"1·min
Awake (a=lO}
19.1
Data are presented as mean:tso. CO: cardiac output; HR: h~ rate; syst: systemic; pulm: pulmonary artery; wedge: pulmonary capillary wedge; RA: right atrial; SVR and PVR:
systemic and pulmonary vasculary resistance, respectively; Vs: minute ventilation; V'r: tidal volume. ' the percentage values in the bottom line of the table show the change in
cardiovascular data from 15 to 45 m.in of anaesthesia in the five subjects studied on both occasions. • : significantly different from awake, p<0.05.
Table 3.
-
Shunt
%CO
Low VA/Q
%CO
Vo
5.4
2.2
~.9
~.6
Anaesthesia 15 mla (n=10)
8.5
1.0
:t1.1
:t7.4
~
~
QM
Jog so Q
%Vs
VM
log so V
Flo1
Pao1
Paco2
PVo1
~
~
Awake (n=10)
39.8
:t7.8
0.71
:t0.28
0.99
:t0.30
1.61
:t0.68
0.78
:t0.29
0.21
:tO.OO
9.16
:t1.3
5.3
:t0.9
5.1
:t0.7
6.1
:t7.8
34.7
~.9
0.62
:t0.18
1.29*
:t0.31
2.33*
:t0.85
1.00
:t0.29
0.38
:t0.02
16.8
:t6.1
5.2
:t0.5
5.1
:t0.8
Aaaesthesia 45 mla (n:::;5)
2.6
9.6
:t4.0
:t2.5
8.9
:t7.2
32.1
:t3.6
0.85
:t1.00
1.26
:t0.48
2.93
:t1.54
1.11
:t0.24
0.39
:t0.01
18.0
:t8.1
5.4
:t0.4
5.0
:t0.9
Percentage of anaestb. 15 m.in1
217
126
73
100
144
102
103
90
100
97
102
98
0.6
:t0.4
o
~
Cl)
Gas exchange awake and during anaesthesia
high VA/Q
%Vs
r
Data are presented as mean:tso. Shunt and low. VAjQ: perfusion of non-ve!ltil~ted (VA/6 <().005) and poorly ventilated (0.005<VA/Q<0.1) regions, respectively; high VA/0. and
Vo: ventilation of poorly perfused regions (10<VA/Q<100) and deadspace (VA/0>100), respectively; QM, log so Q, Vu and Jog so V: mean and log so of perfusion and ventilation
respectively; Flo2 : inspired oxygen fraction; P\lo1: mixed venous oxygen tension. For other abbreviations see legends to tables 1 and 2. 11 see explanation in legend to table 2;
•: significantly different from awalce, p<0.05.
i
0.8
Vt>=52X
0.4
Vt>=45%
0.6
~ 0.4
02
0 5•0.6%
0.2
00
Os;OX
02
I
0 0.01 0.1
10 100
0.0
'1MO
0 0.01
o·
100
0
1.0
0.8
12
1.0
08
0.6
0.4 0s"1.4%
Vos29X
0.8
0.6
2!
0.6
0.4
(")
0
0,4
"'11
.?
02 Os--il.4%
I
•
I
0 001 0.1
10 100
o.o 0
"~~to
'MO
i>
0
0.01 0.1
~
10
0 0.01 0.1
&;
g
~
04
¥.>=39%
Vo•37X
0.1
0s<>6X
Vo=27X
0.4
Vo=34X
0.6
021
·~ 02
0.8
02
0.4
0.8
0.6
~
0.4
~
VD•25X
(I)
111
><
• s"0.4X
(")
0.0
o o.o· c·
0.6
·o
100
'V•IO
Vo=33X
0.0
0 0.01 0.1
10 100
'it./0
0.2
Vo•37X
0.6
0.4
~t
0.8
0.4
Os=2.0X
- 0.2
0 0.01 0.1
•
0 001 0.1
0
111
0.8
Vo=31X
10 100
"~~to
2
Vo=3 t%
O.L
10 100
'MO
0.8
0.6
02 0 5=0%
0.2
0.0 .
0 0.01 01
0.0 .
0 C.01 0.1
I
I
10 100
~
00.
0 001 0.1
06
I
02
I
00 •
Vo=29%
0 5=9.6%
0.0
10 100
1MO
'V.to
3
4
5
.....
....
.....
.....
L. GUNNARSSON ET AL.
1112
"0
·~
11'1
•
'0
~
.,.,
....
>t
....11
"'
or- .~
("')
S?
;>
•,;
0 0
~·
0'-
~
~
..,
oO
0 '- .~
11
0
0
1g
'J:I
q
0
CQ
0
<q
0
~
....
~
0
0
~
0
11
g
d
0
""11
"'
~
~
8
Ci
e
0
0
~
"0
..
oo
0'........~
-5
S?
·~
(")
~,;:
M
<D
CQ
8Q
""0
:;;
d
q
Cll)
-6
0>
Q.
g
CQ
<q
0
0
o6
lg
0
6
N
<"!
d
0
oo
o .....
....""m11
0
a·~
<D
~
!) A
--~
11
-§!
S?
"':a
oo
o-....
""
- .-;:
~
0.
0
Cl ..
.~
2
CO
""
cJ
o_
CQ
<q
0
0
6
<"!
0
d
""....0
<q
0
CQ
0
N
:>
S?
l~
'? g·
...
·-·~
0
-§!
0
8Q
11
2
,.._
<Q
0
<q
0
....
d
0
0
"'
<"!
0
0
d
00
~
o .....
-.~
<"')
"
-§!
S?
·~ .s
<I)~
«>
d
ga
<D
6
0
~
d
r@"
-~
oO
""
"
~
U')
(')
.:~
0'-
.oJ!
<"1il
~
d
0
0
q
1_U!W·I
N
d
0
0
0
0
Q)
CO
0
0
""ci
1
_UW-I
N
ci
0
0
Cross-sectional area
Atelectasis
Scan 1 Scan 2
Scan 1 Scan 2
cm2
cm2 % of intrathoracic area
!!!
'0 ·..,
~ -~
0
0
d
Table 4. - Computed tomography (CT) cross-sectional
and atelectatic areas, awake and during anaesthesia
·== e
N
(!)
CQ
0
~ .~
.,e,.,
Q
11
Cl -
Ol!
Cl A
ii
d
""~
<I)
c:~o-e
0
(')
-.~
'Oi'
~ ......
tiOu
.s~
0
d
0
""m
8Q
11
...
0
c_.
,s,.
-~
•
g
11
>
i .§
0
""~
0
g
i•
.
:s.
0
exaggerated during anaesthesia. Thus, all patients wno
showed perfusion of regions with low VA/Q ratios awake
(patients no. 3-10), increased their perfusion to such
regions during anaesthesia. The P!ltie~ts who had ventilation of regions with high V A/Q ratios awake
(patie~ts ~o. 2-5}, also increased their ventilation of
high VA/Q regions during an~est.hesia . Patient no. 1,
who had a broad unimodal VA/Q distribution awake,
widened his VA/Q mode further during anaesthesia, so
that it included regions with both high and low VA/Q
ratios. However, due to the interindividual differences
in re~po~se to anaesthesia the changes in perfusion of
low VA/Q regions and ventilation of high regions were
not significant for the material as a whole. Only two
patients had a shunt above 2% (patients no. 3: 4.1% and
no. 9: 2.4%). In the remaining patients the shunt was
less than 1% or was absent. Due to the increased inspired oxygen fraction during anaesthesia, Pao11 increased
to a mean of 16.8 kPa. Paco2 and PVo2 remamed stable
at the same level as in the awake state (table 3).
Mter another 30 min of anaesthesia, no significant
changes were noted in any variable (patients no. 1-5)
(tables 2 and 3). However, in patient no. 3, who had
the largest shunt after 15 min of anaesthesia, a further
increase in shunt to 9.6% was noted (fig. 1).
The cross-sectional area at the two er scan levels was
not significantly altered, after induction of anaesthesia,
although a small mean reduction of 2- 3% was shown
(table 4). During anaesthesia the diaphragm was seen
in the caudal er scan in two patients (nos 2 and 3), the
scan level relative to the spine being the same as during
the awake recordings. Awake, this level was just above
the top of the dome of the diaphragm (approximately
0.5 cm above). This suggests that the diaphragm had
been displaced cranially in 2 of the 10 patients during
anaesthesia, whereas in the other eight patients no, or
only minor, displacement of the diaphragm had occurred.
Small atelectatic areas were shown in two patients in
the caudal er scan (patient no. 1: 0.2% and no. 9:
0.8%), while in another three patients atelectases were
·> ~
g~
Awake (n=10)
.!:!'-'
398
375
:t48
:t69
Anaesthesia 15 min (n=10)
391
365
:t69
:t53
Anaesthesia 45 min (n=5)
397
381
:t64
:t95
Percentage of anaesth. 15 min*
99
100
...
li
Data are presented as mean:tso. Scan 1 and Scan 2: caudal
and cranial CT scan, respectively. 11: see explanation in
table 2.
li
-g.,.,
...
·=·
~~
~re
;; .s
-6"E
·s: 8
:ae
I·~
.....• ..c:l
;;
0.00
:tO.OO
0.00
:tO.OO
0.10
:t0.27
0.21
:t0.37
0.04
:t0.09
0.26
:t0.36
100
115
ANAESTHESIA IN COPD, ATELECI'ASIS AND GAS EXCHANGE
1113
Awake
0.8
V1 • 3e X
0.$
~
OA
0.2
O, • 0.1 X
I
9,.10
0.0
0
0.01
0.1
10
100
Anaesthesia
0.$
V0 • 35 X
0.$
c:
'I! 0.4
:::.
0.2
9,./0
0.0
0
0.01
0.1
10
100
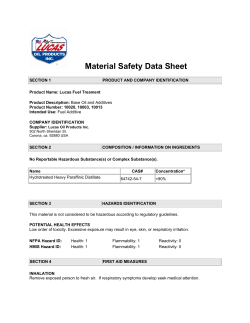
Fig 2. - Ventilation perfusion CvA/0) distribution and computed tomography (CT) scans in patient no. 6 awake and during enflurane
anaesthesia. Perfusion (e) and ventilation (0). Note the large transverse lung area, suggestive of hyperinflation, in comparison with a lung
healthy subject (fig. 3).
Awake
1.5
Vo • 35 I
LO
i
:::.
0.5
0, • 1.2 I
0.0
0
'
9,.10
0.01
0.1
10
100
Anaesthesia
0.8
V0
•
41 I
O.G
~
:::.
o, -
0.4
7.1:1
1
02
9,/0
0
0
0.01
0.1
10
100
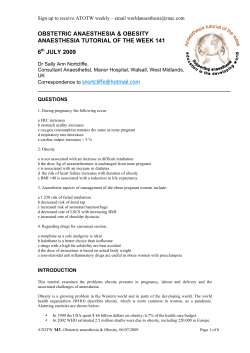
Fig 3.- Ventilation perfusion (VA/Q) distribution and computed tomography (CT) scans in a subject with healthy lungs awake and during
enflurane anaesthesia. Perfusion (e) and ventilation (0). The subject participated in the study by GuNNARSSON et al. [10], his individual data
have not been published previously.
L. OUNNARSSON BT AL.
1114
shown in the cranial er scan (patient no. 3: 1.1 %, no.
5: 0.4% and no 6: 0.6%) (table 4, and fig. 2). There
was no further increase in the atelectatic area during
anaesthesia.
Discussion
In previous studies on patients with healthy lungs we
have shown prompt development of atelectasis and shunt
on induction of anaesthesia [1-5]. The presently
studied patients with chronic bronchitis developed almost no atelectasis at all and only sm.all ~hunt during
anaesthesia, but the large dispersion of VA/Q ratios, seen
already when awake, increased further during anaesthesia. Mechanisms that may explain the difference in
reaction between patients with chronic bronchitis and
patients without lung disease will be discussed in the
following paragraphs.
Gas exchange
The increased dispersion of VA/Q ratios that was seen
in all pat.ien~s, and the presence of bimodal or even
trimodal VA/Q distributions, in combination with no, or
only minor, shunt are similar to what has been reported
earlier in patients with chronic obstructive pulmonary
disease (3, 12, 25, 26). In asthmatic patients, the
l!bsence of shunt and presence of perfusion of low VA/
Q regions have been considered an indication of collateral ventilation, maintaining a certain gas exchange in
lung units behind occluded airways [27). Hypoxic
pulmonary vasoconstriction (HPV) is another mechanism to reduce shunt, by diverting blood flow away
from poorly- or non-ventilated lung regions. The
moderate hypoxaemia that was seen in most patients
should have stimulated the HPV response, according to
the dose-response curves by BARER et al. [28].
The major effect of anaesthesia was a further increase
in the VA/Q mismatch with widened perfusion distribution, as indicated by an increased log Q so. Possible
causes may be attenuation of the HPV response by the
anaesthetic [29], which increases perfusion of poorlyventilated lung regions, and regional increases in airway resistance [30], and more widespread airway closure
[31], which reduce ventilation in relation to blood flow.
Interestingly, shunt was virtually absent in the anaesthetized COPD patient, with one exception, in striking
difference to the findings in anaesthetized subjects with
healthy lungs who develop large shunts [6-10]. The
shunt in the anaesthetized normal subject is more likely
to be explained by the formation of atelectasis in dependent lung regions [8, 9], and similarly the absence
of shunt in the COPD patient is reasonably explained
by the absence of atelectasis. The only patient with
large shunt in the present study also had the largest
atelectasis although the atelectatic area was still smaller
than normally seen in subjects with healthy lungs
during anaesthesia [8-10).
Our results contrast to some extent to those of DUECK
et al. [5] in patients with COPD during halothane/
nitrous oxide anaesthesia. They found increasing shunt
and perfusion of regions of low VA/Q ratios. The
difference may in part be explained by their use of
nitr.ous oxide, t~e ~ast uptake of which may force
regtons of low VA/Q to collapse rapidly, producing
atelectasis and shunt. A progressive increase in
atelectasis and shunt during anaesthesia with enflurane
and nitrous oxide was also seen in subjects without
pulmonary disease, who were followed for 90 min [10].
Atelectasis and chest dimensions
It is not clear why the patients with chronic obstructive pulmonary disease developed no or only minimal
atelectasis during anaesthesia, contrary to normal
subjects who regularly develop atelectasis at the same
er scan levels of the lungs as studied here [1, 3]. Most
patients had signs of hyperinflation and air trapping on
spirometry in the awake state. The cross-sectional
thoracic area was approximately 5-10% larger in the
COPD patients than in subjects with normal pulmonary
function. Moreover, anaesthesia produced only minor
and nonsignificant reductions of the cross-sectional area,
in contrast to normal subjects who displayed larger and
significant decreases [32]. Also, the position of the
diaphragm was almost unaltered, or shifted cranially to
a very minor extent, in the anaesthetized COPD patient,
as inferred from the maintained diaphragm area, or
absence of the diaphragm in the caudal er scan. Again
this contrasts with the cranial shift of the diaphragm
that has been regularly seen in our own studies on
anaesthetized subjects with healthy lungs [8-10, 33].
However, more varied results on diaphragm shape during
anaesthesia have been presented by KRAYER et al. [34).
Taken together, these small changes suggest that there
was only a minor decrease in FRC during anaesthesia
in the COPD patients, as opposed to subjects with
healthy lungs where a reduction of around 0.4-0.5 1 is
the normal finding [33]. However, no direct measurement of FRC was made in the COPD patients during
anaesthesia.
It may, thus, be that the lungs due to long-standing
hyperinflation have become resistant to a volume
decrease and collapse on induction of anaesthesia. Whatever the mechanisms of preventing early formation of
atelectasis (altered chest-wall mechanics, loss of elastic
recoil of the lung, airway closure?), slow resorption of
the trapped gas behind closed airways may still produce
atelectasis after a long enough time, as discussed by
DANTZKER et al. [35]. However, this may take a longer
time than covered by this study.
In conclusion, the present study demonstrated
that patients with chronic obstructive pulmonary
disease developed only small shunt and almost no
atelectasis during anae.sth~sia. However, they did
develop a more severe VA/Q mismatch with increased
log Q so. It may be, that long-standing hyperinflation of
the lungs makes them resistant to early collapse, and/or
ANAESTHESIA IN COPD, ATELECTASIS AND GAS EXCHANGE
that airway closure prevents gas from leaving the
alveoli (gas trapping).
Acknowl•dg•m•nts: The authors highly appreciated the assistance of M. Enros, nurse anaesthetist,
and H. Gustavsson and E-M. Hedln, technicians. They
also express their gratitude to R. Cronestra.nd for his
support.
References
1. Marshall BE, Wyche MQ Jr. - Hypoxemia during and
after anesthesia. Anesthesiology, 1972, 37, 178-209.
2. Nunn JF, Milledge JS, Chen D, Dore C. - Respiratory
criteria for fitness for surgery and anaesthesia. Anaesthesia,
1988, 43, 543-551.
3. Wagner PD, Dantzker DR, Dueck R, Clausen JL, West
Ventilation-perfusion inequality in chronic
JB.
obstructive pulmonary disease. J Clin Invest, 1977, 59,
203-216.
4. Rehder, K, Knopp, TJ, Sessler, AD, Didier, PE. Ventilation-perfusion relationship in young healthy awake and
anesthetized-paralyzed man. J Appl Physiol, 1979, 47,
745-753.
5. Dueck R, Young I, Clausen I, Wagner PD. - Altered
distribution of pulmonary ventilation and blood flow following induction of inhalational anesthesia. Anesthesiology, 1980,
52, 113- 125.
6. Prutow RJ, Dueck R, Davies NJH, Clausen J. - Shunt
development in young adult surgical patients due to
inhalational anesthesia. Anesthesiology, 1982, 57, A477.
7. Bindslev L, Hedenstierna 0, Santesson I, Gottlieb I,
Carvallhas A. - Ventilation-perfusion distribution during
inhalational anaesthesia. Effect of spontaneous breathing,
mechanical ventilation and positive end-expiratory pressure.
Acta Anaesth Scand, 1981, 25, 360-371.
8. Brismar B, Hedenstierna G, Lundquist H, Strandberg A,
Svensson L, Tokics L. - Pulmonary densities during
anesthesia with muscular relaxation - a proposal of
atelectasis. Anesthesiology, 1985, 62, 422-428.
9. Tokics L, Hedenstierna 0, Strandberg A. Brismar B,
Lundquist H. - Lung collapse and gas exchange during
general anesthesia - effects of spontaneous breathing, muscle paralysis and positive end-expiratory pressure.
Anesthesiology, 1987, 66, 157-167.
10. Gunnarsson L, Strandberg A, Brismar B, Tokics L,
Lundquist H, Hedenstiema G. - Atelectasis and gas
exchange impairment during enflurane/nitrous oxide anaesthesia. Acta Anaesthesiol Scand, 1989, 33, 629-637.
11. Briscoe WA, Cree EM, FillerS, Houssay HEJ, Cournand
A. - Lung volume, alveolar ventilation and perfusion interrelationships in chronic pulmonary emphysema. J Appl
Physiol, 1960, 15, 785-795.
12. Marthan R, Castaing Y, Manier G, Guenard H. - Gas
exchange alterations in patients with chronic obstructive lung
disease. Chest, 1985, 87, 470-475.
13. Fowkes FOR, Lunn JN, Farrow SC, Robertson IB,
Samuel P. - Epidemiology in anaesthesia. Ill: Mortality
risk in patients with coexisting physical disease. Br J Anaesth,
1982, 54, 819-825.
14. Tarhan S, Moffit EA, Sessler A, Douglas WW, Taylor
WF. - Risk of anesthesia and surgery in patients with chronic
bronchitis and chronic obstructive pulmonary disease. Surgery, 1973, 74, 720-726.
15. Gass GD, Olsen GN. - Preoperative pulmonary function testing to predict postoperative morbidity and mortality.
Chest, 1986, 89, 127-135.
1115
16. Tisi GM. - Preoperative evaluation of pulmonary
function. Am Rev Respir Dis, 1979, 119, 293-310.
17. Hedenstierna G, Lundh R, Johansson H. - Alveolar
stability during anaesthesia for reconstructive vascular
surgery of the leg. Acta Anaesth Scand, 1983, 27, 26-34.
18. Wagner PD, Naumann PF, Lavaruso RB. - Simultaneous measurement of eight foreign gases in blood by gas
chromatography. J Appl Physiol, 1974, 36, 60G-605.
19. Wagner PD, Saltzman HA, West JB. - Measurement of
continuous distribution of ventilation-perfusion ratios. Theory.
J Appl Physiol, 1974, 36, 588-599.
. .
20. Evans IW, Wagner PD. - Limits of VA/Q distributions
from analysis of experimental inert gas elimination. J Appl
Physiol, 1977, 42, 889-898.
21. Ekelund LG, Holmgren A. - Central hemodynamics
during exercise. Circ Res, 1967, 20 (suppl. 1), 33-43.
22. Wagner PD, West JB. - Continuous distributions of
ventilation-perfusion relationships. In: Pulmonary gas
exchange, vol 1. J.B. West ed., Academic Press, New York,
1980, pp. 233-235.
23. Wagner PD, Hedenstierna G, Bylin G. - Ventilationperfusion inequality in chronic asthma. Am Rev Respir Dis,
1987, 136, 605-612.
24. Raine JM, Bishop JM. - A-a difference in 0 tension
and physiological deadspace in normal man. J AppfPhysiol,
1963, 18, 284-288.
25. Torres A, Reyes A, Roca J, Wagner PD, RodriguezRoisin R. - Ventilation-perfusion mismatching in chronic
obstructive pulmonary disease during ventilator weaning. Am
Rev Respir Dis, 1989, 140, 1246-1250.
26. Freyshuss U, Hedlin G, Hedenstierna G. - Ventilationperfusion relationships during exercise-induced asthma in
children. Am Rev Respir Dis, 1984, 130, 888-894.
27. Wagner PD, Dantzker DR, Iacovoni VE, Tomlin WC,
West IB. - Ventilation-perfusion inequality in asymptomatic asthma. Am Rev Respir Dis, 1978, 118, 511-524.
28. Barer GR, Howard P, Shaw IW. - Stimulus-response
curves for the pulmonary vascular bed to hypoxia and hypercapnia. J Physiol, 1970, 211, 139-155.
29. Marshall C, Lindgren L, Marshall BE. - Effects of
halothane, enflurane and isoflurane in rat lungs in vitro.
Anesthesiology, 1984, 60, 304-308.
30. Broseghini C, Brandolese R, Poggi R, Polese G, Manzin
E, Milic-Emili J, Rossi A. - Respiratory mechanics during
the first day of mechanical ventilation in patients with
pulmonary edema and chronic airway obstruction. Am Rev
Respir Dis, 1988, 138, 355-361.
31. von Mieding G, LOllgren H, Smidt U, Linde H. Simultaneous washout of helium and sulphur hexafluoride in
healthy subjects and patients with chronic bronchitis, bronchial asthma, and emphysema. Am Rev Respir Dis, 1977,
116, 649-660.
32: Hedenstiema G, Strandberg A, Brismar B, Lundquist H,
Svensson L, Tokics L. - Functional residual capacity,
thoracoabdominal dimensions, and central blood volume
during general anesthesia with muscle paralysis and mechanical ventilation. Anesthesiology, 1985, 62, 247-254.
33. Rehder 1(, Sessler AD, Marsch HM. - Lung disease.
State of art, general anesthesia and the lung. Am Rev Respir
Dis, 1975, 112, 541-563.
34. Krayer S, Rehder 1(, Vetterman J, Didier EP, Ritman
EL. - Position and motion of the human diaphragm
during anesthesia-paralysis. Anesthesiology, 1989, 70, 891898.
35. Dantzker DR, ~ag!ler PD, West JB. - Instability of
lung units with low VA/Q ratios during 0 2 breathing. J Appl
Physiol, 1975, 38, 886-895.
1116
L. GUNNARSSON ET AL.
Maladie pulmonaire obstructive chronique et anesthesie Formation d'atelectasies et troubles des echanges gazeux.
L. Gunnarsson, L. Tokics, H. Lundquist, B. Brismar, A.
Strandberg, B. Berg, G. Hede~tierna.
RESUMB: Les troubles des echanges gazeux et le
developpement d'atelectasies au cours d'une anesth6sie A
I'enflurane ont 6t6 etudies chez 10 patients (Sge moyen: 70
ans) atteints de maladie pulmonaire chronique obstructive
(COPD). A l'etat d'eveil, aucun patient n'a developpe
d'atelectasie apr~s etude au moyen de la tomographic
c<;>mP.utee. La distribution de la ventilation et de la perfusion
(VA/Q), etudi6e par la technique d'elimination de gaz mu,ltiples inertes, a montre une dispersion accrue des relations VA/
Q (la deviation standard logarithmique de la distribution de
la perfusion, logarithme moyen Q SD 0.99; intervalle de
confiance superieur a 95% chez un sujet normal: 0.60), ainsi
qu'une augmentation de la perfusion des regions dont les
rapports VA/Q sont bas (0.005 <VA/Q <0.1: 5.4% du debit
cardique). Le shunt est negligeable (moyenne 0.6%). La
tomographic computee .d u thorax a montre des zones
transversales thoraciques plus grandes qu'elles n'avaient ete
d6celees anterieurement chez les sujets a poumons sains
(p<0.01). Aucune atelectasie n'a ete decelee chez aucun
patient.
Au cours de l'anesthesie, l'on a note un~ aggr~vation plus
marquee du manque de congruence entre VA et Q, avec une
augmentation significative de log Q SD (1.29, p<0.05), mais
pas d'augmentation du shunt (moyenne 1%). Des zones
atelectasiques minimes ont ete notees chez trois patients, les
autres n'ayant aucune atelectasie. Les dimensions du thorax
n'ont pas ete reduites de plus de 3% au cours de l'anesthesie,
ce qui sugg~re que la capacite residuelle fonctionnelle n'a
pas ete modifiee, ou seulement affectee de fa~on minime.
Ces observations contrastent avec ce qui se produit chez
des patients dont les poumons sont sains, et chez Iesquels
l'atelactasie et Ies shunts se developpent reguli~rement au
cours de 1'anesthesie.
Eur Respir J 1991, 4, 1106-1116.


© Copyright 2026