
Business Results for the Fiscal Year Ended March
This is the English translation of the original Japanese-language Business Results of KITO COROPRATION (the
Company) for the fiscal year ended March 31, 2015 and is provided for reference purposes only. Readers are advised
that the Company does not guarantee the accuracy of the content contained in this report. In the event of any
discrepancy between this translation and the Japanese original, the Japanese original shall prevail.
Business Results for the Fiscal Year Ended March 31, 2015
[Japan GAAP] (Consolidated)
May 15, 2015
KITO COROPRATION
Listed on the TSE 1st Section
6409
URL: http://Kito .com/
Yoshio Kito , President & CEO
Shigeki Osozawa
Contact
TEL: +81-3-5908-0161
Director, Executive Officer, GM, Corporate Management Division
Expected date of annual shareholders’ meeting:
Expected starting date of dividend
June 23, 2015
payment:
June 24, 2015
Expected date of filing of annual securities report:
June 24, 2015
Preparation of supplementary financial document:
Yes
Results briefing:
Yes (for institutional investors)
Company
Stock Code
Representative
(Rounded down to the nearest million yen)
1. Consolidated business results for the fiscal year ended March 31, 2015 (April 1, 2014 to March 31, 2015)
(1) Consolidated results of operations
(% change from the previous corresponding period)
Net sales
Operating income
Ordinary income
Net income
Million yen
%
Million yen
%
Million yen
%
Million yen
%
FY ended Mar. 2015
49,968
19.4
3,395
(15.2)
3,423
(16.4)
2,026
(14.2)
FY ended Mar. 2014
41,855
17.9
4,006
59.6
4,094
67.7
2,361
130.8
(Note) Comprehensive income
Fiscal year ended Mar. 2015: 3,741 million yen (16.6)%
Fiscal year ended Mar. 2014: 4,484 million yen 81.4%
Ratio of operating
Net income
Diluted net
Return on
Ratio of ordinary
income
per share
income per share
equity
income to total assets
to net sales
Yen
Yen
%
%
%
FY ended Mar. 2015
77.52
77.11
8.9
6.6
6.8
FY ended Mar. 2014
91.25
90.42
12.3
10.8
9.6
(Reference) Equity in earnings of affiliates:
Fiscal year ended Mar. 2015: — million yen
Fiscal year ended Mar. 2014: — million yen
(Note) Effective October 1, 2014, Kito conducted a 2-for-1 stock split of its common stock. Accordingly, net income per share
and diluted net income per share are calculated on the assumption that the stock split was completed as of the beginning of the
previous fiscal year.
(2) Consolidated financial position
Total assets
Net assets
Shareholders’
equity ratio
%
38.9
51.2
Net assets per
share
Yen
936.83
806.32
Million yen
Million yen
63,183
25,626
41,108
22,003
As of Mar. 2015: 24,576 million yen
As of Mar. 2014: 21,051 million yen
(Note) Effective October 1, 2014, Kito conducted a 2-for-1 stock split of its common stock. Accordingly, net assets per share
data is calculated on the assumption that the stock split was completed as of the beginning of the previous fiscal year.
As of Mar. 2015
As of Mar. 2014
(Reference) Shareholders’ equity
(3) Consolidated results of cash flows
Cash flows from
operating activities
FY ended Mar. 2015
FY ended Mar. 2014
Million yen
3,338
4,056
Cash flows from
investing activities
Million yen
(8,402)
(2,729)
Cash flows from
financing activities
Million yen
7,050
465
Cash and cash
equivalents at the end
of period
Million yen
9,777
6,219
2.
Dividends
Annual dividend
End of
Q1
End of
Q2
End of
Q3
Year-
end
Annual
Total
Dividend
payout ratio
(Consolidated)
Rate of total dividend
to net assets
(Consolidated)
FY ended Mar.
Yen
Yen
Yen
Yen
Yen
Million yen
%
%
2014
-
15.00
-
25.00
40.00
522
21.9
2.7
FY ended Mar.
-
25.00
-
12.50
37.50
654
32.3
2.9
2015
FY ending Mar.
-
14.00
-
14.00
28.00
25.7
2016 (forecast)
(Note) Effective October 1, 2014, Kito conducted a 2-for-1 stock split of its common stock. Accordingly, the actual dividend
amount for the fiscal year ended March 31, 2015 prior to the stock split has been recorded.
3.Forecast of consolidated business results for the fiscal year ending March 31, 2016 (April 1, 2015 to March 31, 2016)
(% change from the previous year)
Operating
income
Net sales
Million yen
For the six months
ending Sept. 30, 2015
FY ending Mar. 31,
2016
Ordinary income
%
Million yen
%
Million yen
%
27,000
46.7
1,300
52.0
1,100
23.2
60,000
20.1
5,500
62.0
5,000
46.0
Net income
Million yen
Net income per share
%
Yen
500
(0.9)
19.06
3,000
48.0
114.36
※ Notes:
(1) Changes in significant subsidiaries during the period (changes in specified subsidiaries resulting in a change in the scope of
consolidation): Yes
New: 2
PEERLESS INDUSTRIAL GROUP, INC.
Excluded: —
Peerless Chain Co., Inc.
(Note) For details, please refer to page 6, “2. Status of the corporate group”
(2) Changes in accounting policies, accounting estimates, and restatements
Changes in accounting policies due to revisions of accounting standards: Yes
Changes in accounting policies other than above: No
Changes of accounting estimates: No
Restatements: No
(Note) For details, please refer to “5. Consolidated Financial Statements (5) Notes to Consolidated Financial Statements
(Changes in accounting policies) on page 19 of the supplementary materials.
(3) Number of shares issued (common stock)
Number of shares issued at the end of period (treasury stock included)
As of Mar. 2015: 27,048,200 shares
As of Mar. 2014: 27,048,200 shares
Number of treasury stock at the end of period
As of Mar. 2015: 815,016 shares
As of Mar. 2014: 939,966 shares
Average number of shares over the period
Fiscal 2014: 26,147,003 shares
Fiscal 2013: 25,884,032 shares
(Note) Effective October 1, 2014, KITO conducted a 2-for-1 stock split of its common stock. Accordingly, the number of
shares issued (common stock) is calculated on the assumption that the stock split was completed as of the beginning of the
previous fiscal year.
ii
(Reference) Summary of non-consolidated business results
Non-consolidated business results for the fiscal year ended March 31, 2015 (April 1, 2014 to March 31, 2015)
(1) Non-consolidated results of operations
(% change from the previous fiscal year)
Net sales
Operating income
Ordinary income
Net income
Million yen
%
Million yen
%
Million yen
%
Million yen
%
Fiscal year
24,514
8.6
2,640
10.2
3,062
8.2
1,495
41.4
ended Mar. 2015
Fiscal year
22,577
6.0
2,395
83.3
2,831
50.0
1,057
6.5
ended Mar. 2014
Net income per share
Yen
57.18
40.86
Fiscal year ended Mar. 2015
Fiscal year ended Mar. 2014
Diluted net income per share
Yen
56.88
40.49
(Note) Effective October 1, 2014, KITO conducted a 2-for-1 stock split of its common stock. Accordingly, net income per
share and diluted net income per share are calculated on the assumption that the stock split was completed as of the
beginning of the previous fiscal year.
(2) Non-consolidated financial position
Total assets
Net assets
Million yen
Million yen
As of Mar. 2015
44,659
17,257
As of Mar. 2014
29,108
15,859
Shareholders’ equity ratio
%
38.6
54.4
Net assets per share
Yen
656.72
606.05
(Reference) Shareholders’ equity:
As of Mar. 2015: 17,227 million yen
As of Mar. 2014: 15,822 million yen
(Note) Effective October 1, 2014, KITO conducted a 2-for-1 stock split of its common stock. Accordingly, net assets per
share data is calculated on the assumption that the stock split was completed as of the beginning of the previous fiscal year.
* Indication of the status of audit-procedures execution
This financial summary is not subject to audit procedures pursuant to the Financial Instruments and Exchange Act of Japan.
However, audit procedures were in progress as of the date of report disclosure.
* Explanation regarding the appropriate use of business forecasts and other special instructions
- Caution concerning forward-looking statements
The performance forecasts and other forward-looking statements presented in this summary are based on information
currently available and certain assumptions deemed to be reasonable, and are not to be read as guarantees of future
performance by KITO . Actual performance, etc., may differ substantially due to various factors. For the preconditions of the
assumptions and special instructions regarding the appropriate use of business forecasts, refer to “1. Analysis of results of
operations and financial position, (1) Analysis of results of operations” on page 2 of the supplementary materials.
- Method of obtaining the supplementary financial documents and the contents of the briefing session
Kito is planning to hold a briefing session for institutional investors on Tuesday, May 19, 2015. Materials provided shall be
posted on Kito’s website immediately after the session.
iii
Contents of Attached materials
1.
Analyses of results of operations and financial position……………………………………………………………………..
P. 2
(1) Analysis of results of operations…………………………………………………………………………………………………..
P. 2
(2) Analysis of financial position ………………………………………………………………………………………………………
(3) Basic policy on profit distribution, along with dividends for the fiscal year ended March 31, 2015 and the fiscal year
ending March 31, 2016……………………………………………………………………………………………………………
2. Status of the corporate group ……………………………………………………………………………………………………..
P. 4
3. Management policy …………………………………………………………………………………………………………………..
P.7
P. 5
P.6
(1) Basic corporate management policy ……………………………………………………………………………………………..
P.7
(2) Target management benchmarks…………………………………………………………………………………………………
P. 7
(3) Mid-to long-term corporate management strategy…………………………………………………………………………
P. 7
(4) Corporate challenges to be addressed……………………………………………………………………………………………
P. 7
(5) Other important matters concerning corporate management··…………………………………………………………………
P. 7
4.
Basic approach toward the selection of accounting standards………………………………………………………………
P. 8
5.
Consolidated financial statements…………………………………………………………………………………………………
P. 9
5.
(1) Consolidated balance sheets………………………………………………………………………………………………………
P. 9
(2) Consolidated statements of income/Consolidated statements of comprehensive income …………………………………
P. 11
Consolidated statements of income……………………………………………………………………………………………
P. 11
Consolidated statements of comprehensive income…………………………………………………………………………
P. 12
(3) Consolidated statements of changes in net assets……………………………………………………………………………..
P. 13
(4) Consolidated statements of cash flows……………………………………………………………………………….................
P. 15
(5) Notes to consolidated financial statements………………………………………………………………………………………
P. 17
(Notes regarding ongoing concern assumption)………………………………………………………………………………..
P. 17
(Important matters fundamental to the preparation of consolidated financial statements) …………………………………
P. 17
(Changes in accounting policies) …………………………………………………………………………………………………
(Changes in presentation methods)………………………………………………………………………………………………
(In relation to consolidated balance sheets)…………………………………………………………………………................
P. 19
P. 20
P. 20
(In relation to consolidated statements of income)……………………………………………………………………………..
P. 21
(In relation to consolidated statements of changes in net assets)…………………………………………………………….
P. 22
(In relation to the consolidated statements of cash flows) ·……………………………………………………………………
P. 24
(Segment information)……………………………………………………………………………………………….....................
P. 25
(Per share information)…………………………………………………………………………………………………………….
P. 26
(Important subsequent events)………………………………………………………………………………………..................
P. 27
Others……………………………………………………………………………………………………………………………………
P. 28
(1) Management changes·……………………………………………………………………………………………………………..
P. 28
- 1 -
1. Analyses of results of operations and financial position
(1) Analysis of results of operations
(i) Results of operations for the fiscal year ended March 2015
In fiscal 2014, the fiscal year ended March 31, 2015, the corporate sector in Japan continued to exhibit an appetite for
capital investment by Japanese firms while conditions throughout North America showed positive signs of recovery in
corporate sector results. Meanwhile, China experienced a persistent slowdown in its rate of economic growth. As a result,
future economic trends in this part of the world remain shrouded in uncertainty. Turning to Asia, signs of stagnation began
to emerge. This is expected to dull the momentum of growth.
Under these circumstances, the Kito Group continued to carry out its Mid-term Management Plan. Throughout
the fiscal year under review, the Kito Group continued to work on (1) expanding its business in emerging markets,
principally Asia; (2) strengthening its product lineup; (3) promoting the globalization of production and procurement; and
(4) establishing a crane business structure.
In fiscal 2014, the fourth year of its Mid-term Management Plan, the KITO Group experienced mixed conditions.
The operating environment in Asia and other emerging markets together with demand in China exhibited a greater-than
-expected downturn. On the other hand, robust results in the Americas contributed to an overall positive performance.
On August 21, 2014, Kito acquired all of the shares of its U.S.-based subsidiary, PEERLESS INDUSTRIAL GROUP, INC.
(“PEERLESS”). The company was then included in the scope of KITO’s consolidation as a wholly owned subsidiary from
the third quarter of the fiscal year under review. As a result, revenue improved year on year. Against this backdrop,
business in the Americas experienced remarkable growth. Trends in Japan were also firm and demand remaining solid
which were mainly buoyed by healthy private-sector capital investment.
From a profit perspective, earnings declined compared with the previous fiscal year. This was largely attributable
to the greater-than-expected downturn in profits in Asia as well as the incidence of expenses, including temporary
measures to account for inventory valuation at the time of the PEERLESS acquisition and the reversal of deferred tax
assets in line with the decline in the income tax rate, which were higher than estimated at the time the Company
announced its forecasts of operating results.
Accounting for each of these factors, consolidated net sales were 49,968 million yen (+19.4% compared with the
previous fiscal year), consolidated operating income was 3,395 million yen (-15.2% compared with the previous fiscal
year), consolidated ordinary income was 3,423 million yen (-16.4% compared with the previous fiscal year), and
consolidated net income was 2,026 million yen (-14.2% compared with the previous fiscal year).
The Kito Group conducts business activities on a segment basis by location in connection with the operations of Kito
Corporation and its consolidated subsidiaries. Business results by segment are as presented as follows.
Segment
Net Sales
(YoY change in %)
Operating Income (Loss)
(YOY change in %)
Japan
24,514 million yen (+8.6%)
4,726 million yen (+12.7%)
The Americas
21,967 million yen (+68.2%)
744 million yen (-17.6%)
China
8,504 million yen (-2.7%)
836 million yen (-12.4%)
Asia
5,471 million yen (-17.7%)
(374) million yen (Operating income of 459 million
yen for the previous fiscal year)
Europe
1,692 million yen (+9.5%)
9 million yen (-79.7%)
Japan:
Net sales climbed 8.6% compared with the previous fiscal year, to 24,514 million yen. This largely supported the continued
appetite of Japan’s private sector as well as firm demand from American subsidiaries. Operating income also increased
12.7% year on year, to 4,726 million yen, owing mainly to the impact of the weak yen.
The Americas:
In the United States, demand remained strong across a wide range of industries and, in particular, the manufacturing
sector on the back of an ongoing recovery in the overall economy. Buoyed by contributions from PEERLESS, which was
included in the scope of the Company’s consolidation from the third quarter of the fiscal year under review, net sales
across the Americas climbed substantially, to 21,967 million yen, up 68.2% compared with the previous fiscal year. Strong
results in the United States offset the drop in demand for natural resources, including oil sands in Canada. Accordingly, net
sales of existing businesses excluding Peerless on a local currency U.S. dollar basis grew 6.3% indicating continued
robust results across the Americas as a whole. The costs associated with the acquisition of PEERLESS were borne by the
Company’s local subsidiary in the United States, which undertook the actual purchase. On this basis, operating income
came to 744 million yen, down 17.6% compared with the previous fiscal year.
- 2 -
China:
With a persistent slowdown in economic growth, China future remains shrouded in uncertainty. Net sales converted to
Japanese yen came to 8,504 million yen, down 2.7% compared with the previous fiscal year. Operating income for the
period declined 12.4% year on year, to 836 million yen.
Asia:
Conditions throughout Asia were impacted by a slowdown in the rate of economic growth in China. As a result, investment
demand was weak in such countries as Thailand and Indonesia where growth was expected. At the same time, demand
by Japanese companies operating in Thailand was subdued owing mainly to the impact of prolonged political instability.
Taking into consideration each of these factors, net sales in Asia totaled 5,471 million yen, down 17.7% compared with the
previous fiscal year. On the earnings front, the Kito Group incurred an operating loss of 374 million yen compared with
operating income of 459 million yen recorded in fiscal 2013. This substantial deterioration in profit was caused by a variety
of factors, including an increase in fixed expenses following the start of operations at a second factory in Thailand last
fiscal year and the downturn in profitability of certain large-scale projects.
Europe:
Demand was strong and net sales in Europe increased 9.5% compared with the previous fiscal year, to 1,692 million yen.
Operating income declined 79.7% year on year, to 9 million yen.
(ii) Outlook for the fiscal year ending March 31, 2016
Looking at the business environment in which the KITO Group operates, Asia and China are expected to exhibit ongoing
weak demand. In contrast, North America is projected to remain robust, while demand in Japan is anticipated to be firm.
Under these circumstances, the Group will allocate resources to growth regions while looking at ways to expand
the scope of its business by pursuing M&A in a bid to further boost operating results.
In Japan, sales of manually products are expected to stay strong. This is largely attributable to private-sector
capital investment as well as demand from the construction and civil engineering sectors in the infrastructure, recovery,
and other fields. The KITO Group will work diligently to increase its market share by continuing to upgrade and expand its
product lineup and boosting sales of wire rope hoists.
In the Americas, the manufacturing sector is projected to lead robust overall demand. In addition to ongoing
efforts aimed at streamlining the supply chain by promoting the local production of certain products, energies will be
directed toward strengthening the Group’s lineup of finished products together with the chain, hoist, and other peripheral
products of PEERLESS. Complementing these measures, the KITO Group will continue to cultivate markets in Central
and South America. On this basis, every effort will be made to secure sustainable growth across the Americas.
In China, the pace of economic growth is expected to continue its downward path with demand also remaining
weak. Despite these difficult conditions, the KITO Group will continue to cultivate sales routes in the northeastern and
inland regions while, at the same time, promoting ongoing efforts aimed at securing an increase in sales volumes.
Focusing mainly on Asia, the Group will look to increase earnings in emerging markets. While concentrating on
the existing crane business, the KITO Group will also work to expand its maintenance service business and to commence
the sale of single unit hoist products. Moving forward, particular emphasis will be placed on capturing the sound capital
investment undertaken by the corporate sector and, in particular, the Japanese manufacturing industry.
Drawing on this outlook of the future, the KITO Group is forecasting increases in both revenue and earnings in
the fiscal year ending March 31, 2016. In specific terms, net sales, operating income, ordinary income, and net income are
expected to reach 60,000 million yen, 5,500 million yen, 5,000 million yen, and 3,000 million yen, respectively, on a
consolidated basis.
The outlook for the fiscal year ending March 31, 2016 is based on a projected exchange rate of 115.0 yen to the
U.S. dollar.
(iii) Status of progress under the Mid-term Management Plan
With the objective of becoming the “true global No. 1 hoist manufacturer,” the KITO Group is pressing ahead with its Mid
-term Management Plan, which covers the five-year period from the fiscal year ended March 31, 2012 to the fiscal year
ending March 31, 2016.
Details of quantitative targets and the status of progress are presented as follows.
a. Performance targets
In the fiscal year ending March 31, 2016, the final year of the Mid-term Management Plan, the KITO Group will
continue to steadfastly carrying out the strategies presented as follows. With this as its road map, the Group is targeting
60 billion yen in consolidated net sales, 5.5 billion yen in consolidated operating income, and a 9.2% operating margin for
the fiscal year ending March 2016.
- 3 -
Target figures for the fiscal year ending March 2016 on a consolidated basis
Fiscal year ended March 31, 2015
(actual results)
Consolidated net sales
49.9
(billion yen)
Consolidated operating income
3.3
(billion yen)
Operating margin (%)
6.8
Fiscal year ending March 31, 2016
(targets)
60.0
5.5
9.2
b. Regional strategy
In the Group’s existing major markets, Japan and North America, we will seek to keep and strengthen our position as well
as expand operations based on the relationships of trust that we have been built with our customers over time as well as
our strong agency network. In the United States, we will also streamline our supply chain by promoting local production
going forward. We will also work to upgrade and expand our product lineup while increasing our market share. Turning to
China, we will endeavor to build a distribution network particularly in inland areas in a bid to capture the expandable
demand. Meanwhile, in such emerging countries as Thailand, Indonesia, and India, where a distribution network is yet to
fully develop, we will work to capture expanding demand through a direct sales system while strengthening our crane
business and upgrading our after-sales services. With regard to Europe and other regions, we will branch out from our
mainstay market of Germany to expand into Africa and other regions.
c. Product strategy
We are focusing on the upgrade and expansion of product lineup such as wire rope hoists and theatrical hoists especially
in Japan and the Americas. In particular, we are adding the PEERLESS range of products, including below hook device,
to our lineup in the Americas. Moreover, we are increasing our solution proposal capabilities by strengthening our crane
production capacity particularly in South Korea, Thailand, and India, and bolstering our engineering functions in Japan.
d. Manufacturing strategy
We are engaging in efforts to increase our overseas manufacturing capacity and expanding production in North America
and China in order to decentralize production costs as well as risks. By adding PEERLESS, the largest manufacturer of
chains in North America, to the Group, we are taking positive steps toward enhancing the efficiency of our chain product
supply chain. Moving forward, the KITO Group will continue to mitigate foreign currency exchange rate risks and reduce
procurement prices.
e. Corporate management
The KITO Group introduced organizational management based on a matrix of regional business-based organizations
and function-based organizations to shore up the management of strategic actions as well as profit and loss. In addition,
we have been working on the globalization of human resources, hiring non-Japanese executives at overseas offices,
and proactively assigning personnel to bases that exhibit growth potential in an effort to secure higher productivity while
improving the quality of management as a global corporation.
(2) Analysis of financial position
(i) Status of assets, liabilities, and net assets
Assets:
Total assets stood at 63,183 million yen as of March 31, 2015, up 22,075 million yen compared with the end of the
previous fiscal year. This was largely attributable to increases in cash and deposits, notes and accounts receivable-trade,
merchandise and finished goods, and goodwill of 3,561 million yen, 3,179 million yen, 4,204 million yen, and 3,444 million
yen, respectively.
Liabilities:
Total liabilities amounted to 37,557 million yen, an increase of 18,452 million yen compared with the previous fiscal year-
end. Principal movements included increases in accrued expenses, long-term loans payable, and deferred tax liabilities
of 891 million yen, 14,781 million yen, and 1,549 million yen, respectively.
Net assets:
Net assets as of the end of the fiscal year under review stood at 25,626 million yen. This was 3,623 million yen higher
than the balance as of March 31, 2014. During the period under review, retained earnings climbed 1,878 million yen, while
foreign currency translation adjustment increased 1,752 million yen and minority interests grew 105 million yen year on
year.
- 4 -
(ii) Status of cash flows
Cash and cash equivalents as of the end of the fiscal year under review stood at 9,777 million yen, up 3,558 million yen
compared with the end of the previous fiscal year.
Cash flows from operating activities:
Net cash provided by operating activities totaled 3,338 million yen. This was a decrease of 717 million yen compared with
the previous fiscal year. Major cash inflows were income before income taxes of 3,671 million yen and changes in
inventories of 1,004 million yen. The principal cash outflow was changes in trade payables of 916 million yen.
Cash flows from investing activities:
Net cash used in investing activities came to 8,402 million yen, up 5,673 million yen year on year. Major cash outflows
included payments for the acquisition of tangible noncurrent assets and purchase of investments in subsidiaries resulting
in change in scope of consolidation of 1,365 million yen and 7,840 million yen, respectively. The principal cash inflow was
proceeds from the sales of tangible noncurrent assets of 932 million yen.
Cash flows from financing activities:
Net cash provided by financing activities was 7,050 million yen, up 6,584 million yen compared with the previous fiscal
year. The principal cash inflow was proceeds from long-term loans payable of 15,824 million yen. Major outflows were
repayments of long-term loans payable of 5,714 million yen and cash dividends paid by the parent company of 653
million yen.
Reference: Cash flow-related figures
FY ended
March 31, 2011
FY ended
March 31, 2012
FY ended
March 31, 2013
FY ended
March 31, 2014
FY ended
March 31, 2015
Shareholders’ equity ratio (%)
53.8
48.5
49.8
51.2
38.9
Shareholders’ equity ratio
(on a market-value basis) (%)
35.0
29.3
38.4
67.1
50.7
Cash flows to interest-bearing
liabilities ratio (per annum)
1.4
9.6
-
1.6
6.4
51.1
5.4
-
22.8
14.8
Interest coverage ratio (times)
Shareholders’ equity ratio=Shareholders’ equity/Total assets
Shareholders’ equity ratio (on a market-value basis)=Aggregate market value/Total assets
Cash flows to interest-bearing liabilities ratio=Interest-bearing liabilities/Cash flows
Interest coverage ratio=Cash flows/Interest payments
(Note 1) Figures are calculated using financial data on a consolidated basis.
(Note 2) The aggregate market value is calculated based on the number of shares outstanding excluding treasury stock.
(Note 3) Cash flow data is based on cash flows from operating activities.
(Note 4) Interest-bearing liabilities include all liabilities listed in the consolidated balance sheets for which interest is paid.
(Note 5) “Cash flows to interest-bearing liabilities ratio” and “interest coverage ratio” data for the fiscal year ended March
2013 are not listed due to the negative cash flows from operating activities for that particular fiscal year.
(3) Basic policy on profit distribution, along with dividends for the fiscal year ended March 31, 2015 and the fiscal
year ending March 31, 2016
KITO COROPRATION recognizes the importance of returning appropriate levels of profits to shareholders in accordance
with the Company’s business results. Of equal importance is the need to expand retained earnings in order to strengthen
the Company’s management and operating platforms and to secure sufficient funds to expand business going forward.
Based on this understanding, KITO COROPRATION has identified a consolidated dividend payout ratio target of 20% or
more after taking into consideration consolidated business results and the status of the Company’s financial standing.
Every effort is made to increase the level of dividend payment.
In distributing profits to shareholders, KITO has adopted the basic policy of paying cash dividends twice a year. In
specific terms, this entails the payment of an interim and period-end cash dividend. For the fiscal year ended March 31,
2015, the Company has decided to pay an interim dividend of 25 yen per share and a period-end dividend of 12.5 yen
per share for an annual dividend of 37.5 yen per share. This translates to a dividend payout ratio of 32.3%.
For the fiscal year ending March 31, 2016, the Company intends to pay an interim dividend of 14 yen per share
and a period-end dividend of 14 yen per share for an annual dividend of 28 yen per share and a dividend payout ratio of
25.7%.
Note: Effective October 1, 2014, KITO conducted a 2-for-1 stock split of its common stock. Taking into consideration
the effects of this stock split, the interim cash dividend for the fiscal year under review comes to 12.5 yen per share.
- 5 -
2. Status of the corporate group
The KITO Group consists of KITO COROPRATION and its 20 consolidated subsidiaries. The Group is mainly engaged in
the manufacture and sale of hoisting equipment and cranes.
In addition, the KITO Group is divided into five regional reportable segments based on manufacturing and sales
systems. These five regional reportable segments are Japan, the Americas, China, Asia, and Europe.
Changes in the Group’s affiliates during the fiscal year under review are presented as follows.
Americas:
During the second quarter of the fiscal year under review, the KITO Group acquired all of the shares of PEERLESS
INDUSTRIAL GROUP, INC. As a result, this company and its three subsidiaries were included in the scope of KITO ’s
consolidation.
Asia:
Taking into account its growing importance, KITO HOISTS & CRANES ASIA PTE. LTD., a company that was reported as
a non-consolidated subsidiary as of the end of the previous fiscal year, was included in the scope of the Company’s
consolidation effective from the second quarter of the fiscal year ended March 31, 2015.
The followings are the Group’s principal affiliated companies.
<Japan> KITO COROPRATION (The Company)
Product sales
<Americas>
• Harrington Hoists, Inc. (U.S.A.)
• KITO CANADA INC. (Canada)
• KITO DO BRASIL COMERCIO DE TALHAS E GUINDASTES LTDA. (Brazil)
<China>
• KITO HOISTS & CRANES (SHANGHAI) CO., LTD. (China)
<Asia>
• KITO KOREA CO., LTD. (South Korea)
• KITO TAIWAN CO., LTD. (Taiwan)
• SIAM KITO CO., LTD. (Thailand)
• PT. KITO INDONESIA (Indonesia)
<Europe>
• Kito Europe GmbH (Germany)
Manufacture and sale of wire rope hoists, etc.; manufacture of component parts for KITO ’s products
<China>
• JIANGYIN KITO CRANE CO., LTD. (China)
Manufacture and sale of chain and chain-related products
<Americas>
•Peerless Chain Co., Inc. (U.S.A.)
Manufacture of component parts for KITO ’s products
<Asia>
• KITO PHILIPPINES, INC. (Philippines)
Manufacture and sale of cranes, wire rope hoists, etc.
<Asia>
• ARMSEL MHE PVT. LTD. (India)
Investment holding companies
<Americas>
• KITO Americas, Inc. (U.S.A.)
• PEERLESS INDUSTRIAL GROUP, INC. (U.S.A.)
<Asia>
• SUKIT BUSINESS CO., LTD. (Thailand)
• KITO HOISTS & CRANES ASIA PTE. LTD. (Singapore)
Trademark management
<Americas>
• Har Ki, Inc. (U.S.A.)
- 6 -
3. Management policy
(1) Basic corporate management policy
With the aim of becoming a company that is trusted by its customers, the KITO Group is committed to across-the-board
business activities that are based on the following overarching corporate philosophy:
· KITO’s mission: Deliver unmatched satisfaction to our customers.
· KITO’s quality: Our driving “spirit” is “quality.”
· KITO’s innovation: Change and challenge always.
· KITO’s fundamental values: Integrity, honesty, pride, and gratitude
(2) Target management benchmarks
The KITO Group aim is targeting net sales of 100 billion yen through the organic growth of existing businesses and the
aggressive pursuit of M&A.
Fiscal year ending March 31, 2016 (Targets)
Consolidated net sales (Billion yen)
60.0
Operating income (Billion yen)
5.5
Operating margin (%)
9.2
(3) Mid-to long-term corporate management strategy
The KITO Group’s mid-to long-term management vision* is “to continually provide value that exceeds customers’
expectations” in order to maximize the value of the KITO brand in the market and “to truly become the global No. 1 hoist
manufacturer.”
Working toward this goal, each employee is proactively committed to and engaged in the pursuit of
“differentiation” as well as “business efficiency” as a basic strategy.
* The KITO Group uniform global slogan: “For the Global Next Stage”
(4) Corporate challenges to be addressed
In order to achieve the above vision, the KITO Group will further strengthen its business operations in the global market as
stated in its Mid-term Management Plan that carries through to the fiscal year ending in March 31, 2016. The following
four points have been identified as top priorities in order to achieve the level of corporate quality and size necessary to
survive against global competition.
(i) Manufacture trustworthy products: Identify and thoroughly address the causes of non-conforming products; establish
a practice of preventive measure implementation
We will provide products and services that enhance the “life-cycle value” of customers (provide long-term benefits) to
ensure that our products and services stand out from those of other companies. We will focus on strengthening the quality
control and quality assurance system in order to maintain and improve the level of quality—even during a period of rapid
sales network expansion.
(ii) Put forward product strategies and promote regional business as well as manufacturing strategies
We will not only expand our capacity to manufacture cranes at sites where demand is prevalent, but also the engineering
function and service system. In this manner, we will improve the skills necessary to provide solutions. In addition, we will
intensify the development of wire rope hoist intended for the global market.
(iii) Undertake concrete measures in a bid to establish an optimal global supply chain
We will address the need for production cost decentralization from the viewpoint of mitigating currency risks (exchange
rate risks). We will add the Americas and Asia to our existing major production bases of Japan and China in order to
establish a decentralized four-region production system. Moreover, we will also work to optimize our manufacturing
structure and systems for chains, principal components for hoist equipment, centering on Japan and the United States.
(iv) Nurture global business leaders and establish new global management approaches
We will unify members with diverse cultural backgrounds in order to exercise teamwork and develop human resources
that can drive forward business operations in the global market. In addition, we will enhance corporate governance in an
effort to establish a sound and efficient business management system.
We will endeavor to reinforce the Group’s IT platform and build a robust Group-wide IT infrastructure with a
view to further expanding our overseas business.
(5) Other important matters concerning corporate management
No relevant matters to be noted.
- 7 -
4. Basic approach toward the selection of accounting standards
The consolidated financial statements of the Company are prepared by the KITO Group based on the Ordinance on
Terminology, Forms, and Preparation Methods of Consolidated Financial Statements (excluding Chapter VII & Chapter
VIII) Ordinance of the Ministry of Finance No. 28 (1976). This step is taken to facilitate the comparison between
companies and periods.
The Company maintains the policy of adopting international accounting standards after taking into consideration
a variety of factors and conditions in Japan and overseas.
- 8 -
5. Consolidated financial statements
(1) Consolidated balance sheets
(Million yen)
As of March 31, 2014
Assets
Current assets
Cash and deposits
Notes and accounts receivable-trade
Merchandise and finished goods
Work in process
Raw materials and supplies
Deferred tax assets
Other current assets
Allowance for doubtful receivables
Total current assets
Fixed assets
Property and equipment
Buildings and structures
Accumulated depreciation
Buildings and structures (net)
Machinery, equipment, and vehicles
Accumulated depreciation
Machinery, equipment, and vehicles (net)
Land
Construction in progress
Others
Accumulated depreciation
Others (net)
Total property and equipment
Intangible assets
Goodwill
Software
Other intangible assets
Total intangible assets
Investments and other assets
Investment securities
Deferred tax assets
Other investments and other assets
Total investments and other assets
Total fixed assets
Deferred assets
Bond issuance expenses
Total deferred assets
Total assets
6,230
9,414
7,433
1,619
1,274
1,232
745
(29)
27,920
9,792
12,593
11,638
1,798
1,669
1,334
1,707
(55)
40,478
9,916
(5,625)
4,290
14,629
(11,543)
3,086
2,047
203
5,813
(5,436)
376
10,003
10,532
(5,630)
4,901
16,717
(11,919)
4,797
1,658
270
6,097
(5,565)
532
12,161
567
612
14
1,194
4,012
590
4,407
9,009
2
- 9 -
As of March 31, 2015
2
*
185
895
901
1,982
13,181
*
38
532
961
1,532
22,703
5
5
41,108
1
1
63,183
(Million yen)
As of March 31, 2014
Liabilities
Current liabilities
Notes and accounts payable-trade
Short-term loans payable
Corporate bonds redeemable within one year
Current portion of long-term debts payable within
one year
Accrued expenses
Income taxes payable
Provision for bonuses for employees
Provision for product warranties
Provision for sales returns
Other current liabilities
Total current liabilities
Long-term liabilities
Bonds payable
Long-term loans payable
Provision for directors’ retirement benefits
Net defined benefit liability
Deferred tax liabilities
Other long-term liabilities
Total long-term liabilities
Total liabilities
Net assets
Shareholders’ equity
Capital stock
Capital surplus
Retained earnings
Treasury stock
Total shareholders’ equity
Accumulated other comprehensive income
Valuation difference on other available-for-sale
securities
Deferred gains or losses on hedges
Foreign currency translation adjustment
Remeasurements of defined benefit plans
Total accumulated other comprehensive income
Stock acquisition rights to shares
Minority interests
Total net assets
Total liabilities and net assets
- 10 -
As of March 31, 2015
5,249
1,552
-
6,113
1,689
1,000
1,068
2,629
1,859
1,022
317
54
26
1,378
12,528
2,750
1,013
328
55
402
1,109
17,093
1,000
2,805
157
2,458
70
84
6,576
19,104
-
16,025
181
2,431
1,619
205
20,464
37,557
3,976
5,199
11,599
(423)
20,353
3,976
5,219
13,477
(367)
22,307
(6)
1
-
891
(186)
698
37
914
22,003
41,108
(56)
2,643
(318)
2,269
30
1,020
25,626
63,183
(2) Consolidated statements of income/Consolidated statements of comprehensive income
(Consolidated statements of income)
(Million yen)
FY2013
(April 1, 2013 to March 31,
2014)
Net sales
Cost of sales
Gross profit
Selling, general, and administrative expenses
Selling expense
General and administrative expense
Total selling, general, and administrative expenses
41,855
26,952
14,903
2
*
2
*
1
*
Operating income
Non-operating income
Interest income
Dividends income
Foreign exchange gains
Other
Total non-operating income
Non-operating expenses
Interest expense
Other
Total non-operating expenses
Ordinary income
Extraordinary income
Gain on sale of noncurrent assets
Gain on change in equity
Gain on negative goodwill
Surrender value of insurance
Total extraordinary income
Extraordinary loss
Impairment loss
Loss on retirement of noncurrent assets
Loss on liquidation of subsidiaries
Total extraordinary loss
Income before income taxes
Income taxes – current
Income taxes – deferred
Income taxes (current and deferred)
Income before minority interests
Minority interests in income
Net income
8,038
2,858
10,897
4,006
49,968
33,143
16,824
2
*
2
*
1
*
10,272
3,156
13,429
3,395
31
2
100
227
361
40
0
112
217
371
157
115
273
4,094
239
103
343
3,423
-
2
10
4
17
4
* 22
5
* 94
6
* 188
305
3,806
1,804
(494)
1,310
2,495
133
2,361
- 11 -
FY2014
(April 1, 2014 to March 31,
2015)
3
*
347
-
-
-
347
4
*
99
-
-
99
3,671
1,845
(232)
1,613
2,057
31
2,026
(Consolidated statements of comprehensive income)
(Million yen)
FY2013
(April 1, 2013 to March 31,
2014)
Income before minority interests
Other comprehensive income
Valuation difference on other available-for-sale
securities
Deferred gains or losses on hedges
Foreign currency translation adjustment
Remeasurements of defined benefit plans
Total other comprehensive income
Comprehensive income
(Comprehensive income attributable to)
Owners of the parent
Minority interests
- 12 -
FY2014
(April 1, 2014 to March 31,
2015)
2,495
2,057
2
7
-
1,986
-
1,989
4,484
(56)
1,865
(132)
1,684
3,741
4,184
300
3,597
144
(3) Consolidated statements of changes in net assets
Fiscal year ended March 31, 2014 (April 1, 2013 to March 31, 2014)
(Million yen)
Shareholders’ equity
Capital stock
Balance as of the beginning of
the period
Capital surplus
Retained earnings
Treasury stock
Total shareholders’ equity
3,976
5,199
9,622
(544)
18,254
3,976
5,199
9,622
(544)
18,254
Cumulative effect of
changes in accounting
policies
Balance as of the beginning of
the period after reflecting
changes in accounting policies
Changes during the period
Dividends from surplus
(323)
(323)
Net income
2,361
2,361
Purchase of treasury stock
Disposal of treasury stock
(25)
Transfer of loss on disposal of
treasury stocks
Changes in the scope of
consolidation
Changes of items other than
shareholders’ equity during the
period (net)
25
Total changes during the period
Balance as of the end of the
period
(0)
(0)
120
95
(25)
-
(35)
(35)
-
-
1,977
120
2,098
3,976
5,199
11,599
(423)
20,353
Accumulated other comprehensive income
Valuation
Total
difference on Deferred gains or
Total accumulated
Foreign currency
accumulated
other
losses on
remeasurements
other
translation
available-for
hedges
of defined benefit comprehensive
adjustment
-sale
plans
income
securities
Balance as of the beginning of
the period
Stock acquisition
Minority interests
rights to shares
Total net
assets
(8)
-
(929)
-
(937)
45
649
18,012
(8)
-
(929)
-
(937)
45
649
18,012
Cumulative effect of
changes in accounting
policies
Balance as of the beginning of
the period after reflecting
changes in accounting policies
Changes during the period
Dividends from surplus
(323)
Net income
2,361
Purchase of treasury stock
(0)
Disposal of treasury stock
95
Transfer of loss on disposal of
treasury stocks
Changes in the scope of
consolidation
Changes of items other than
shareholders’ equity during the
period (net)
-
Total changes during the period
Balance as of the end of the
period
(35)
2
-
1,820
(186)
1,635
(8)
265
1,893
2
-
1,820
(186)
1,635
(8)
265
3,991
(6)
-
891
(186)
698
37
914
22,003
- 13 -
Fiscal year ended March 31, 2015 (April 1, 2014 to March 31, 2015)
(Million yen)
Shareholders’ equity
Capital stock
Balance as of the beginning of the
period
Capital surplus
3,976
Retained earnings
5,199
Treasury stock
11,599
Cumulative effect of changes
in accounting policies
Total shareholders’ equity
(423)
20,353
536
Balance as of the beginning of the
period after reflecting changes in
accounting policies
3,976
5,199
536
12,136
(423)
20,889
Changes during the period
Dividends from surplus
(653)
(653)
Net income
2,026
2,026
Purchase of treasury stock
Disposal of treasury stock
19
Transfer of loss on disposal of
treasury stocks
Changes in the scope of
consolidation
Changes of items other than
shareholders’ equity during the
period (net)
(0)
(0)
56
75
-
(32)
Total changes during the period
Balance as of the end of the period
(32)
-
19
1,341
56
1,417
3,976
5,219
13,477
(367)
22,307
Accumulated other comprehensive income
Valuation
difference on
Deferred gains
other available- or losses on
for-sale
hedges
securities
Balance as of the beginning of
the period
(6)
-
Total
Total
Stock acquisition
Minority interests Total net assets
Foreign currency
accumulated
accumulated
rights to shares
other
translation
remeasurements
adjustment
of defined benefit comprehensive
income
plans
891
(186)
698
37
914
Cumulative effect of changes
in accounting policies
Balance as of the beginning of
the period after reflecting
changes in accounting policies
22,003
536
(6)
-
891
(186)
698
37
914
22,539
Changes during the period
Dividends from surplus
(653)
Net income
2,026
Purchase of treasury stock
(0)
Disposal of treasury stock
75
Transfer of loss on disposal
of treasury stocks
Changes in the scope of
consolidation
Changes of items other
than shareholders’ equity during
the period (net)
Total changes during the
period
Balance as of the end of the
period
-
(32)
7
(56)
1,752
(132)
1,570
(7)
105
1,669
7
(56)
1,752
(132)
1,570
(7)
105
3,086
1
(56)
2,643
(318)
2,269
30
1,020
25,626
- 14 -
(4) Consolidated statements of cash flows
(Million yen)
FY2013
(April 1, 2013 to March 31,
2014)
Cash flows from operating activities
Income before income taxes
Depreciation and amortization
Impairment loss
Depreciation of goodwill
Loss on liquidation of subsidiaries
Changes in allowance for doubtful receivables
Changes in reserve for bonuses for employees
Changes in reserve for bonuses for officers
Changes in reserve for retirement benefits for
employees
Changes in reserve for retirement benefits for officers
Changes in net defined benefit liability
Interest and dividends income
Interest expense
Loss on the retirement of noncurrent assets
Loss (gain) on sales of property and equipment
Changes in trade receivables
Changes in inventories
Changes in accounts receivable
Changes in prepaid expense
Changes in trade payables
Changes in accrued expenses
Changes in advances received
Others
Subtotal
Cash received from interest and dividends
Interest paid
Income taxes paid
Refund of income taxes
Net cash provided by operating activities
Cash flows from investing activities
Payments for the acquisition of tangible noncurrent
assets
Proceeds from the sales of tangible noncurrent assets
Payments for retirement of property, plant and
equipment
Payments into time deposits
Payments of investment securities
Payments for the acquisition of intangible noncurrent
assets
Payments of stocks of subsidiaries and affiliates
Proceeds from the collection of guarantee money
deposited
Changes in investments and other assets
Purchase of investments in subsidiaries resulting in
change in scope of consolidation
Others
Net cash used in investing activities
FY2014
(April 1, 2014 to March 31,
2015)
3,806
954
22
167
188
(21)
16
(36)
3,671
1,311
99
252
-
4
69
-
(2,133)
-
21
2,177
(33)
157
107
(13)
(761)
535
290
35
(284)
304
(33)
(8)
5,457
64
(178)
(1,301)
13
4,056
23
143
(41)
239
8
(351)
(189)
1,004
113
(109)
(916)
139
79
(98)
5,454
43
(224)
(1,939)
5
3,338
(2,087)
(1,365)
29
932
(94)
-
(86)
(158)
(1)
-
(353)
(42)
(45)
-
10
5
60
-
(5)
(2,729)
- 15 -
(237)
2
*
(7,840)
146
(8,402)
(Million yen)
FY2013
(April 1, 2013 to March 31,
2014)
Cash flows from financing activities
Proceeds from short-term loans payable
Repayments of short-term loans payable
Proceeds from long-term loans payable
Repayments of long-term loans payable
Redemption of bonds
Cash dividends paid by parent company
Cash dividends paid for minority interests
Proceeds from sales of treasury stocks
Others
Net cash provided by financing activities
Effect of exchange rate change on cash and cash
equivalents
Net increase in cash and cash equivalents
Cash and cash equivalents at the beginning of the year
Increase (decrease) in cash and cash equivalents
resulting from changes in the scope of consolidation
Cash and cash equivalents at the end of the year
1
*
- 16 -
FY2014
(April 1, 2014 to March 31,
2015)
576
(1,043)
2,221
(670)
(300)
(323)
(59)
85
(19)
465
15,359
(17,706)
15,824
(5,714)
-
(653)
(55)
59
(63)
7,050
241
1,455
2,033
4,132
3,441
6,219
53
117
6,219
1
*
9,777
(5) Notes to consolidated financial statements
(Notes regarding ongoing concern assumption)…
No relevant matters to be noted.
(Important matters fundamental to the preparation of consolidated financial statements)
1. Matters concerning the scope of consolidation
All subsidiaries are included in the scope of the Company’s consolidation.
Number of consolidated subsidiaries: 20
Names of consolidated subsidiaries:
KITO Americas, Inc.
Harrington Hoists, Inc.
Har Ki, Inc.
KITO CANADA INC.
Kito Europe GmbH
KITO PHILIPPINES, INC.
KITO HOISTS & CRANES (SHANGHAI) CO., LTD.
JIANGYIN KITO CRANE CO., LTD.
SIAM KITO CO., LTD.
SUKIT BUSINESS CO., LTD.
KITO KOREA CO., LTD.
ARMSEL MHE PVT. LTD.
PT. KITO INDONESIA
KITO DO BRASIL COMERCIO DE TALHAS E GUINDASTES LTDA.
KITO TAIWAN CO., LTD.
KITO HOISTS & CRANES ASIA PTE. LTD.
PEERLESS INDUSTRIAL GROUP, INC.
Peerless Chain Co., Inc.
SCC JAPAN GODO KAISHA
SCC-SECURITY CHAIN (EUROPE) HANDELES-GMBH
Effective from the fiscal year ended March 31, 2015, PEERLESS INDUSTRIAL GROUP, INC. and its three subsidiaries
have been included in the scope of the Company’s consolidation. This follows the acquisition of all of the shares of
PEERLESS INDUSTRIAL GROUP, INC. In addition, KITO HOISTS & CRANES ASIA PTE. LTD. has also been included
in the scope of the Company’s consolidation effective from the fiscal year under review due to its growing importance.
Effective from the fiscal year ended March 31, 2015, KIMA REALTY, INC. was excluded from the scope of the
Company’ consolidation due to the sale of all of its shares.
2. Matters concerning application of the equity method
No relevant matters to be noted.
3. Matters concerning the fiscal years of consolidated subsidiaries
The closing date of financial statements is December 31 for the following consolidated subsidiaries:
KITO HOISTS & CRANES (SHANGHAI) CO., LTD.; JIANGYIN KITO CRANE CO., LTD.; SIAM KITO CO., LTD.; SUKIT
BUSINESS CO., LTD.; KITO KOREA CO., LTD.; KITO DO BRASIL COMERCIO DE TALHAS E GUINDASTES LTDA.; and
KITO TAIWAN CO., LTD.
Financial statements as of December 31 are used to prepare consolidated financial statements. Any important
transactions that took place between December 31 and the consolidated closing date are adjusted as appropriate for
consolidation purposes.
4. Matters concerning accounting standards
(1) Valuation standards and methods for essential assets
(i) Inventories
Inventories are posted mainly based on the cost method in accordance with the gross average method (i.e., the write-
down method based on deteriorating profitability).
(ii) Securities
Other securities
Securities whose market value is readily determinable:
Reported at market value as of the balance sheet date with unrealized gains or losses, net of applicable taxes, reported
- 17 -
as a separate component of net assets. The cost of securities sold is determined based on the moving-average method.
Securities whose market value is not readily determinable:
Reported at cost based on the moving-average method.
(iii) Derivatives
Reported at market value.
(2) Depreciation methods for important depreciable assets
(i) Tangible noncurrent assets (excluding lease assets)
The Group uses the straight-line method.
The useful service life is as follows:
Buildings
7–50 years
Machinery and equipment
9 years
(ii) Intangible noncurrent assets (excluding lease assets)
The Group uses the straight-line method.
Software (for internal use) is based on the straight-line method in accordance with the internal availability period (five
years).
(iii) Lease assets
Lease assets associated with non-ownership-transfer finance lease transactions
Lease assets associated with non-ownership-transfer finance lease transactions are posted based on the straight-line
method in which the lease term is deemed as the service life with the residual value as zero.
(3) Accounting methods for important deferred assets
Bond issuance expenses
Bond issuance expenses are depreciated based on the straight-line method for the period up until the bond is redeemed.
(4) Posting methods for important allowances, provisions, and reserves
(i) Allowance for doubtful receivables
To prepare for possible losses resulting from uncollectible accounts, an estimated uncollectible amount is posted after
conducting a review of general accounts receivables based on the actual rate of losses from bad debts, with collectibility
reviewed on a case-by-case basis for specific receivables, such as doubtful receivables.
(ii) Reserve for bonuses for employees
To prepare for the payment of employee bonuses, a reserve for employee bonuses is posted based on the estimated
amount of payment.
(iii) Reserve for bonuses for officers
To prepare for the payment of officer bonuses, a reserve for officer bonuses is posted based on the estimated amount of
payment.
(iv) Reserve for product warranties
To prepare for the possibility of future payments for free after-sales service for products sold, a reserve for product
warranties is posted based on past records of product warranties.
(v) Reserve for sales returns
To prepare for the possibility of future loss resulting from product returns, an amount allocated to each fiscal year under
review is posted based on the estimated amount of possible future loss resulting from product returns that is calculated in
accordance with past records of product returns and the gross profit margin.
(vi) Reserve for retirement benefits for officers
To prepare for the payment of retirement benefits for officers, an amount of payment required as of the end of the fiscal
year is posted in accordance with internal rules regarding the reserve for retirement benefits for officers.
(5) Accounting method retirement benefits
(i) Method of attributing expected benefits to periods
In calculating retirement benefit obligations, the Company has adopted the straight-line method for attributing expected
benefits up to the end of the fiscal year.
- 18 -
(ii) Method for handling actuarial difference and prior service costs
Past service cost is mainly amortized on a straight-line basis over a certain period (10 years) within the number of
average remaining service years of employees as of the time of occurrence.
For actuarial difference, the amount proportionately divided by a fixed number of years (10 years) within the number of
average remaining service years of employees as of the time of accrual during each consolidated fiscal year is posted as
expenses from the consolidated fiscal year following the fiscal year of accrual.
(6) Posting methods for important income and expenses
Posting method for net sales:
The percentage-of-completion method (the rate of progress is estimated based on the cost-to-cost method) is
applied to that portion of progress up to the end of the fiscal year under review with a high degree of recognized certainty.
The completed contract method is applied to all other operations.
(7) Accounting methods for major hedge transactions
(i) Hedge accounting methods
The Company adopts the deferred and appropriation methods of hedge accounting.
(ii) Hedging instruments and items covered
Hedging instruments: forward foreign exchange contracts and interest rate swaps
Items covered: foreign currency - denominated claims and obligations; scheduled foreign currency - denominated
transactions; foreign currency-denominated monetary obligations
(iii) Hedging policy
In accordance with internal rules, the Company enters into hedge transactions depending on the circumstances in order to
avoid any damages associated with future movements in market conditions and fix the level of costs.
The Company does not enter into hedge transactions for speculative purposes or to secure any short-term gain.
Hedge transactions are conducted within the scope of each subject obligation in order to minimize the risks associated
with movements in interest rates and to improve the financial account balance.
(iv) Method for evaluating the effectiveness of hedges
During the period from the commencement of hedging to the point at which effectiveness is assessed, the Company
undertakes a comparison with the cumulative total of market changes in the targeted objects of hedging and the
cumulative total of market changes in hedging instruments with respect to interest rate swap transactions in order to
confirm hedging effectives. Turning to foreign exchange forward contracts, the Company does not evaluate the effective of
a hedge transaction when the key conditions relating to hedging instruments and targeted objects of hedging are identical
and the hedging instrument and the targeted object of hedging completely offset anticipated market changes and changes
in cash flows from the commencement of hedging and thereafter on an ongoing basis.
(8) Amortization method and period for goodwill
Goodwill is evaluated on a case-by-case basis and is amortized within the amortization period of up to 20 years
based on the straight-line method.Goodwill that is deemed to be of minimal significance is amortized during the fiscal
year in which it occurs.
Negative goodwill that accrued before March 31, 2010 is amortized over the period of five years from the fiscal year it
occurs based on the straight-line method.
(9) Scope of funds in the consolidated statements of cash flows
Cash on hand and deposits that can be withdrawn at any time and short-term investments maturing within three months
from the day of acquisition that are easily cashable and that incur only insignificant risks of value fluctuation are included
in the scope of funds in the consolidated statements of cash flows.
(10) Other important matters fundamental to the preparation of consolidated financial statements
Accounting methods for consumption tax, etc.:
Consumption tax and local consumption tax are accounted for based on the tax exclusion method. Non-deductible
consumption tax and local consumption tax are accounted for as expenses in the fiscal year under review.
(Changes in accounting policies)
(Application of accounting standards for retirement benefits)
The Company adopted the “Accounting Standard for Retirement Benefits” (Accounting Standards Board of Japan (ASBJ)
Statement No. 26 issued on May 17, 2012 (hereafter referred to as the “Standard”) and the “Guidance on Accounting
- 19 -
Standard for Retirement Benefits” (ASBJ Guidance No. 25 issued on March 26, 2015 (hereafter referred to as the
“Guidance”) effective from the fiscal year under review in accordance with the provisions stated in Paragraph 35 of the
Standard and Paragraph 67 of the Guidance. As a result, the methods for calculating retirement benefit obligations and
service costs have been revised in the following respects: The method for attributing projected benefits to periods has
been changed from the straight-line basis to the benefit formula basis. Also, the method for determining the discount rate
has been changed from using the duration of bonds that approximate to the average remaining years of service of the
eligible employees to a single weighted average discount rate that reflects the periods until the expected payment of
retirement benefits and the amount of projected benefits every such period.
According to the transitional treatment provided in Paragraph 37 of the Standard, the effect of changing the
method for calculating retirement benefit obligations and service costs was recognized by adjusting retained earnings as
of the beginning of the fiscal year under review.
As a result, net defined benefit liability decreased 822 million yen and retained earnings increased 536 million
yen as of the beginning of the fiscal year under review. Net assets per share increased 20.45 yen at the end of the fiscal
year. The effect of this change on profit and loss for the fiscal year under review is immaterial.
(Changes in presentation methods)
(Consolidated statements of income)
“Proceeds from sales of scrap” under “Non-operating income,” which was separately listed in the previous fiscal year, is
included in “Other” for this fiscal year under review as the amount is below 10% of total non-operating income. To reflect
this change in the representation method, the consolidated financial statements for the previous fiscal year have been
reclassified.
As a result, 39 million yen posted as “Proceeds from sales of scrap” under “Non-operating incomes” in the
consolidated statements of income for the previous fiscal year is now reclassified as “Other.”
(Consolidated statements of cash flows)
“Loss (gain) on sales of property and equipment,” which was included in “Others” under “Cash flows from operating
activities” in the previous fiscal year, is now separately listed from the fiscal year under review due to its growing
significance. To reflect this change in the representation method, the consolidated financial statements for the previous
fiscal year have been reclassified.
Accordingly, -22 million yen posted as “Others” under “Cash flows from operating activities” in the consolidated
statements of cash flows for the previous fiscal year is now reclassified as two separate amounts of -13 million yen and
-9 million yen in “Loss (gain) on sales of property and equipment” and in “Others,” respectively.
(Consolidated balance sheets)
1. For the sake of efficient working capital funding operations, KITO has entered into commitment line contracts with
Sumitomo Mitsui Banking Corporation and three other banks. The amount of commitment lines unexecuted as of the end
of the fiscal year under review is as indicated below:
FY2013 (As of March 31, 2014)
FY2014 (As of March 31, 2015)
Total commitment lines
Outstanding borrowings
5,000 million yen
- million yen
5,000 million yen
- million yen
Balance
5,000 million yen
5,000 million yen
These commitment line contracts contain financial covenants. Details of certain financial covenants are presented as
follows:
(1) Shareholders’ equity (the total amount of net assets – the amount of new stock acquisition rights to shares – the
amount of deferred gains or losses on hedges + the amount of treasury stock) that is calculated on a non-consolidated
balance sheet basis as of the end of fiscal 2012 and the end of each fiscal year thereafter must be maintained at an
amount that is no less than 75% of the shareholders’ equity that is calculated on a non-consolidated balance sheet basis
as of the end of fiscal 2011.
(2) In addition, shareholders’ equity (the total amount of net assets – the amount of new stock acquisition rights to shares
– the amount of deferred gains or losses on hedges – the amount of minority interests + the amount of treasury stock) that
is calculated on a consolidated balance sheet basis as of the end of fiscal 2012 and the end of each fiscal year thereafter
must be maintained at an amount that is no less than 75% of the shareholders’ equity that is calculated on a consolidated
balance sheet basis as of the end of fiscal 2011.
(3) Operating income or loss listed in the consolidated statements of income as of the end of fiscal 2010 and the end of
each fiscal year thereafter must not be a loss.
- 20 -
*2. Items relating to non-consolidated subsidiaries and affiliated companies are presented as follows:
Fiscal 2013
(As of March 31, 2014)
Fiscal 2014
(As of March 31, 2015)
Investment securities (shares)
158 million yen
(Consolidated statements of income)
*1. Major items and the amounts of selling, general, and administrative expenses are as follows:
Fiscal 2013
(April 1, 2013 to March 31, 2014)
Salaries/bonuses
Bonuses for officers
Provision of reserve for bonuses for
employees
Retirement benefit expenses
Provision of reserve for retirement benefits
for officers
Provision of allowance for doubtful
receivables
Depreciation and amortization
Research & development expenses
-million yen
Fiscal 2014
(April 1, 2014 to March 31, 2015)
3,779 million yen
6 million yen
4,686 million yen
10 million yen
124 million yen
137 million yen
181 million yen
184 million yen
21 million yen
23 million yen
12 million yen
24 million yen
233 million yen
361 million yen
790 million yen
769 million yen
*2. Research & development expenses that are included in general and administrative expenses and manufacturing costs
are presented as follows:
Fiscal 2013
(April 1, 2013 to March 31, 2014)
General and administrative expenses
Manufacturing costs for the fiscal year
Total
Fiscal 2014
(April 1, 2014 to March 31, 2015)
790 million yen
769 million yen
111 million yen
108 million yen
901 million yen
877 million yen
*3. Details of gain on sales of noncurrent assets are presented as follows:
Fiscal 2013
(April 1, 2013 to March 31, 2014)
Fiscal 2014
(April 1, 2014 to March 31, 2015)
Buildings and structures
-million yen
Machinery, equipment, and vehicles
-million yen
59 million yen
Land
-million yen
237 million yen
-million yen
347 million yen
Total
50 million yen
*4. Impairment loss
The KITO Group incurred a loss on impairment on the following asset groups for the fiscal year ended March 31, 2014:
Previous year 2014 (April 1, 2013 to March 31, 2014)
Location
Usage
Type
Minami-Alps, Yamanashi
Assets earmarked for sale
Land
Showacho, Yamanashi
Dormant assets
Construction in progress
The KITO Group groups assets earmarked for sale and dormant assets by individual asset class.
Assets earmarked for sale where their projected sales prices fell below their book values and dormant assets that
have no potential for future use were reduced to their recoverable values, and posted as an impairment loss (22 million
yen) under extraordinary losses for the fiscal year under review. The breakdown is 17 million yen for land and 5 million yen
for construction progress.
The recoverable value of the asset group is measured by the net selling price or utility value. Land is estimated
based on the amount recorded under sales agreements.
- 21 -
Fiscal year under review (April 1, 2014 to March 31, 2015)
Location
Usage
Type
India
Others
Goodwill
Turning to asset groupings to which asset impairment accounting is applied, the KITO Group groups goodwill by individual
asset class. In the fiscal year under review, business conditions in India where there is ARMSEL MHE PVT. LTD., Kito
subsidiary, remained difficult and the book value of goodwill fell to the recoverable value. As a result, the KITO Group
posted an impairment loss (99 million yen) under extraordinary losses for the fiscal year under review.
The recoverable value is measured by the utility value calculated using a discount rate of 12.5%.
*5 Details of loss on retirement of noncurrent assets is presented as follows:
Fiscal 2013 (April 1, 2013 to March 31, 2014) Fiscal 2014 (April 1, 2014 to March 31, 2015)
Buildings and structures
94 million yen
- million yen
Total
94 million yen
- million yen
*6 Loss on liquidation of subsidiaries
Previous year 2014 (April 1, 2013 to March 31, 2014)
The KITO Group has posted a loss on the liquidation of assets and personnel of an overseas subsidiary that engages in
the manufacture and supply of components.
(Consolidated statements of changes in net assets)
Previous fiscal year (April 1, 2013 to March 31, 2014)
1. Matters concerning outstanding shares
As of the beginning
Type of stock
Increase
of the fiscal year
Common stock
135,241
13,388,859
(shares)
As of the end
of the fiscal year
Decrease
-
13,524,100
Note: The increase reflects the 100-for-1 stock split conducted on April 1, 2013.
2. Matters concerning treasury stocks
As of the beginning
As of the end
Type of stock
Increase
Decrease
of the fiscal year
of the fiscal year
Common stock
6,043
598,340
134,400
469,983
(shares)
Note: Looking at a breakdown of the increase in shares, 598,257 shares are attributable to the 100-for-1 stock split
conducted on April 1, 2013, while 83 shares are due to the purchase of odd-lot shares. The decrease in the number of
shares is the result of the exercise of stock options.
3. Matters concerning stock acquisition rights to shares
Name
of
company
KITO
CORPO
RATION
Details
Type of
stocks
underlying
stock
acquisition
rights to
shares
Number of stocks underlying stock acquisition rights to
shares (shares)
As of the
beginning of
the period
Increase
Decrease
As of the
end of
the period
As of the
end of
the period
(million yen)
The 5th
stock acquisition rights to shares
as stock options
-
-
-
-
-
16
The 7th
stock acquisition rights to shares
as stock options
-
-
-
-
-
8
The 8th
stock acquisition rights to shares
as stock options
-
-
-
-
-
3
The 9th
stock acquisition rights to shares
as stock options
-
-
-
-
-
6
- 22 -
The 10th
stock acquisition rights to shares
as stock options
-
Total
-
-
-
-
1
-
-
-
-
37
Note: The first day of the exercise period for the 10th stock acquisition rights to shares as stock options has not arrived
yet.
4. Matters concerning dividends
(1) Amounts of dividend payments
Resolution
June 20, 2013
Annual
shareholders’
meeting
Nov. 12, 2013
the board of
directors
Total dividends
(million yen)
Type of stock
Dividend per
share (yen)
Base date
Effective date
Common stock
129
1,000.00
Mar. 31, 2013
June 21, 2013
Common stock
194
15.00
Sept. 30, 2013
Dec. 3, 2013
Note: The increase reflects the 100-for-1 stock split conducted on April 1, 2013.
(2) Dividends for which the base date belongs in the fiscal year, but where the effective date belongs in the following fiscal
year
Resolution
June 24, 2014
Annual
shareholders’
meeting
Type of stock
Dividend
resources
Common
stock
Retained
earnings
Total dividends Dividend per
(million yen)
share (yen)
326
25.00
Base date
Effective date
Mar. 31, 2014
June 25, 2014
Fiscal year under review (April 1, 2014 to March 31, 2015)
1. Matters concerning outstanding shares
As of the beginning
Type of stock
Increase
Decrease
of the fiscal year
Common stock
13,524,100
13,524,100
(shares)
Note: The increase reflects the 2-for-1 stock split conducted on October 1, 2014.
As of the end
of the fiscal year
-
27,048,200
2. Matters concerning treasury stocks
As of the beginning
As of the end
Type of stock
Increase
Decrease
of the fiscal year
of the fiscal year
Common stock
469,983
452,033
107,000
815,016
(shares)
Note: Looking at a breakdown of the increase in shares, 451,983 shares are attributable to the 2-for-1 stock split
conducted on October 1, 2014, while 50 shares are due to the purchase of odd-lot shares. The decrease in the number
of shares is the result of the exercise of stock options.
3. Matters concerning stock acquisition rights to shares
Name
of
company
KITO
CORPO
RATION
Details
Number of stocks underlying stock acquisition rights to
shares (shares)
Type of
stocks
underlying
stock
warrants
As of the
beginning of
the period
Increase
As of the
end of
the period
(million yen)
As of the
end of
the period
Decrease
The 5th
stock acquisition rights to shares
as stock options
-
-
-
-
-
8
The 7th
-
-
-
-
-
7
- 23 -
stock acquisition rights to shares
as stock options
The 9th
stock acquisition rights to shares
as stock options
-
-
-
-
-
3
The 10th
stock acquisition rights to shares
as stock options
-
-
-
-
-
3
The 11th
stock acquisition rights to shares
as stock options
-
-
-
-
-
6
-
-
-
-
30
Notes: The first day of the exercise period of stock acquisition rights to shares as the 10th and 11th stock acquisition rights
to shares as stock options has not yet arrived.
4. Matters concerning dividends
(1) Amounts of dividend payments
Resolution
Type of stock
Total dividends
(million yen)
Dividend per
share (yen)
June 24, 2014
Annual
Common stock
326
25.00
shareholders’
meeting
Nov. 13, 2014
the board of
Common stock
326
25.00
directors
Note: The Company conducted a 2-for-1 stock split on October 1, 2014.
Base date
Effective date
Mar. 31, 2014
June 25, 2014
Sept. 30, 2014
Dec. 3, 2014
(2) Dividends for which the base date belongs in the fiscal year, but where the effective date belongs in the following fiscal
year
Resolution
June 23, 2015
Annual
shareholders’
meeting
Type of stock
Dividend
resources
Common
stock
Retained
earnings
Total dividends Dividend per
(million yen)
share (yen)
327
12.50
Base date
Effective date
Mar. 31, 2015
June 24, 2015
(Consolidated statements of cash flows)
1. In relation to consolidated statements of cash flows:
The relation between cash and cash equivalents as of the end of the period and the amounts of items listed in the
consolidated balance sheets are as follows:
(million yen)
FY2013
(From April 1, 2013 to
March 31, 2014)
Cash and deposits
Time deposits (over 3 months)
Cash and cash equivalents
- 24 -
FY2014
(From April 1, 2014 to
March 31, 2015)
6,230
9,794
(11)
(14)
6,219
9,779
(Segment Information)
[Segment information]
1. Reportable segments (overview)
The reportable segments of KITO COROPRATION are units of the corporation, for which financial information is
separately available and which are subject to periodic reviews in order for the board of directors to determine the
allocation of management resources and to assess business results.
KITO COROPRATION manufactures and sells hoisting equipment and cranes. The corporation takes care of the
domestic market, while for overseas markets, locally incorporated companies in the regions of the Americas, China, Asia,
and Europe are respectively in charge of their own markets. Each of the locally incorporated companies is an independent
management unit, plans comprehensive strategies for its products by region, and conducts business operations.
Therefore, KITO consists of these regional segments based on manufacturing and sales systems; the five
reportable segments are Japan, the Americas, China, Asia, and Europe.
2. Calculation methods for net sales, income or loss, assets, liabilities, and other items of reportable segments
The accounting methods used for financial statements of respective reportable segments are basically the same as those
stated in “Important matters fundamental to the preparation of consolidated financial statements.”
Income of reportable segments is based on operating income, and internal sales and transfers among segments
are on a market-value basis.
3. Information on the amounts of net sales, income or loss, assets, liabilities, and other items of reportable segments
Previous fiscal year (April 1, 2013 to March 31, 2014)
(Million yen)
Adjustment
Note 1
Consolidated
financial
statement
amount
Note 2
Reportable segments
Total
Japan
Americas
China
Asia
Europe
Net sales
Net sales to unaffiliated
customers
Net internal sales or
transfers among
segments
12,849
13,031
8,604
5,829
1,540
41,855
-
41,855
9,727
29
138
819
5
10,720
(10,720)
-
Total
22,577
13,060
8,742
6,649
1,546
52,576
(10,720)
41,855
Segment income
4,194
903
954
459
45
6,556
(2,550)
4,006
Segment assets
21,310
8,665
8,245
6,258
1,106
45,587
(4,479)
41,108
494
70
246
113
17
942
11
954
11
-
65
97
-
174
-
174
1,642
67
124
565
22
2,422
17
2,440
Others
Depreciation and
amortization
Depreciation of goodwill
Increases in tangible
noncurrent assets and
intangible noncurrent
assets
Notes:
1. The details of adjustments are as stated below:
(1) The segment income adjustment of –2,550 million yen includes transaction offsets among segments (–751
million yen) and Company-wide expenses that are not allocated to respective reportable segments (–1,798
million yen). Company - wide expenses are expenses mostly related to the general affairs, finance and
accounting, and corporate planning departments of the parent company.
(2) The segment assets adjustment of –4,479 million yen includes transaction offsets among segments (–4,230
million yen) and Company-wide assets that are not allocated to respective reportable segments (66 million yen).
Company-wide assets are mainly the headquarters building that does not belong to any of the reportable
segments.
- 25 -
(3) The adjustment in the increase in tangible noncurrent assets and intangible noncurrent assets (17 million yen) is
the amount of capital investment in Company-wide assets that are not allocated to the respective reportable
segments.
2.
Segment income is adjusted to operating income listed in the consolidated financial statements.
Fiscal year under review (April 1, 2014 to March 31, 2015)
(Million yen)
Reportable segments
Total
Japan
Adjustment
Note 1
Consolidated financial
statement
amount
Note 2
Americas
China
Asia
Europe
12,751
21,888
8,198
5,442
1,686
49,968
-
49,968
11,763
78
305
29
5
12,182
(12,182)
-
Total
24,514
21,967
8,504
5,471
1,692
62,150
(12,182)
49,968
Segment income or
segment loss
4,726
744
836
(374)
9
5,941
(2,545)
3,395
Segment assets
24,862
28,622
8,718
5,964
1,064
69,232
(6,048)
63,183
578
302
264
148
7
1,301
9
1,311
11
172
0
67
-
252
-
252
894
265
144
97
5
1,408
0
1,408
Net sales
Net sales to unaffiliated
customers
Net internal sales or
transfers among
segments
Others
Depreciation and
amortization
Depreciation of goodwill
Increases in tangible
noncurrent assets and
intangible noncurrent
assets
1. The details of adjustments are as stated below:
(1) The segment income or segment loss adjustment of –2,545 million yen includes transaction offsets among segments
(–459 million yen) and Company-wide expenses that are not allocated to respective reportable segments (–2,085
million yen). Company-wide expenses are expenses mostly related to the general affairs, finance & accounting, and
corporate planning departments of the parent company.
(2) The segment assets adjustment of –6,048 million yen includes transaction offsets among segments (–6,131 million
yen) and Company-wide assets that are not allocated to respective reportable segments (56 million yen). Company
-wide assets are mainly those of the parent company’s General Administration, Accounting, and Corporate Planning
departments that do not belong to any of the reportable segments.
(3) The adjustment in the increase in tangible noncurrent assets and intangible noncurrent assets (0 million yen) is the
amount of capital investment in Company-wide assets that are not allocated to the respective reportable segments.
2. Segment income or segment loss is adjusted to operating income or operating loss listed in the consolidated financial
statements.
(Per share information)
Fiscal 2013
(April 1, 2013 to March 31, 2014)
Fiscal 2014
(April 1, 2014 to March 31, 2015)
Net assets per share
806.32 yen
936.83 yen
Net income per share
91.25 yen
77.52 yen
Diluted net income per share
90.42 yen
77.11 yen
Notes:
1. The Company conducted a 2-for-1 stock split on October 1, 2014. Net assets per share, net income per share,
- 26 -
and diluted net income per share are calculated based on the assumption that this stock split had been executed as
of the beginning of the previous fiscal year.
2.
The basis for calculating net assets per share is presented as follows:
Fiscal 2013
(As of March 31, 2014)
Total net assets (million yen)
Amount deducted from net assets (million yen)
Stock acquisition rights to shares
Minority interests
Common stocks within net assets as of the end
of the year (million yen)
Number of common stocks as of the end of the
year used for the calculation of net assets per
share (shares)
Fiscal 2014
(As of March 31, 2015)
22,003
25,626
951
1,050
37
30
914
1,020
21,051
24,576
26,108,234
26,233,184
3. The basis for calculating net income per share and diluted net income per share is presented as follows:
Fiscal 2013
(April 1, 2013 to March 31, 2014)
Fiscal 2014
(April 1, 2014 to March 31, 2015)
Net income per share
Net income (million yen)
2,361
2,026
-
-
Attributable to common stock (million yen)
2,361
2,026
Average number of common stocks during
the year (shares)
25,884,032
26,147,003
237,356
139,796
237,356
139,796
Not attributable to ordinary shareholders
(million yen)
Diluted net income per share
Increase in common stocks (shares)
Stock acquisition rights to shares
(shares)
Dilutive shares that do not have dilutive effect
and thus are not included in the calculation of
diluted net income per share (Summary)
The 10th stock acquisition rights to
shares:
Special resolution passed at the
annual shareholders’ meeting on
June 22, 2012; passed at the
board of directors meeting on May
28, 2013.
(Number of stock acquisition rights
to shares: 100, Common stocks:
20,000 shares)
- 27 -
The 11th stock acquisition rights to
shares:
Special resolution passed at the
annual shareholders’ meeting on
June 20, 2013; passed at the
board of directors meeting on May
27, 2014.
(Number of stock acquisition
rights to shares: 300, Common
stocks: 60,000 shares)
(Important subsequent events)
Issuance of stock acquisition rights to shares (stock options)
On May 15, 2015, the board of directors of KITO COROPRATION passed a resolution to bring up matters for discussion at
the 71st annual shareholders’ meeting scheduled on June 23, 2015, in order to issue stock acquisition rights to shares, as
stock options, for directors (excluding external directors) and executive officers of the corporation pursuant to Articles 236, 238,
and 239 of the Companies Act, and to delegate the determination of stock acquisition requirements for the stock acquisition
rights to shares to the board of directors of the corporation. Details are presented briefly as follows:
(i) Reason for the issuance of the stock acquisition rights to shares:
To motivate and provide an incentive for enhancing the business results and corporate value of the corporation
(ii) Number of stock acquisition rights to shares: Up to 1,000
(iii) Type of stocks underlying the stock acquisition rights to shares: Common stock
(iv) Number of stocks underlying the stock acquisition rights to shares: Up to 200,000 shares
(v) Exercise period for the stock acquisition rights to shares:
From the day on which two years will have elapsed from the day when the resolution was passed to the day on which 10 years
will have elapsed, and as prescribed by the board of directors of the corporation
(vi) Amount of capital stock and capital surplus to be increased in cases where stocks are issued by way of the exercise of the
stock acquisition rights to shares:
(a) The amount of the capital stock to be increased in the case where stocks are issued by way of the exercise of the stock
acquisition rights to shares shall be half of the amount of the maximum increase in the capital stock as calculated pursuant to
Article 17 (1) of the “Ordinance on Company Accounting,” and a fraction of less than one yen resulting from the calculation shall
be rounded up.
(b) The amount of the capital surplus to be increased in the case where the stocks are issued by way of the exercise of the stock
acquisition rights to shares shall be the amount calculated by subtracting the amount of the capital stock to be increased as
stipulated in (a) from the amount of the maximum increase in the capital stock as in (a).
(vii) Other details of the stock acquisition rights to shares:
It was defined at the board of directors meeting of the corporation that determines the stock acquisition requirements for the
stock acquisition rights to shares.
6. Others
(1) Management changes
(i) Changes in representatives
No relevant matters to be noted.
(ii) Other changes in officers (scheduled for June 23, 2015)
a. New director candidate
Director: Akihide Miyawaki (current Senior Executive Officer, Head of the Corporate Planning Office & the Corporate
Management Division)
b. Scheduled retiring director
Hajime Ito
* Mr. Ito, who is scheduled to retire as a director, will continue his responsibilities as a senior executive officer.
c. New auditor candidate
Kentaro Yoneyama (current General Manager of the Corporate Management Department)
d. Scheduled retiring auditor
Auditor: Noboru Sato
- 28 -


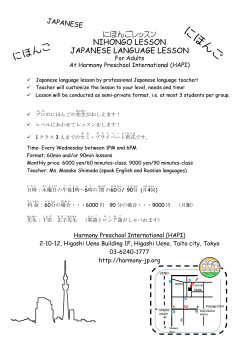


© Copyright 2026