
Canadian Cancer Statistics 2013 Special topic: Liver cancer
Canadian
Cancer Statistics
2013
Special topic: Liver cancer
Produced by Canadian Cancer Society, Statistics Canada,
Public Health Agency of Canada, Provincial/Territorial Cancer Registries
cancer.ca/statistics
1 888 939 3333 | cancer.ca
Citation:
Material appearing in this publication may be reproduced or copied
without permission; however, the following citation must be used
to indicate the source: Canadian Cancer Society’s Advisory
Committee on Cancer Statistics. Canadian Cancer Statistics 2013.
Toronto, ON: Canadian Cancer Society; 2013.
[May 2013]
ISSN 0835-2976
This publication is available in English and French on the Canadian
Cancer Society’s website at cancer.ca/statistics. The website
includes additional resources, such as individual figures from the
publication and an archive of previous editions.
The development of this publication over the years has benefited
considerably from the comments and suggestions of readers. The
Advisory Committee appreciates and welcomes such comments. To
be notified about next year’s publication or to offer ideas on how
the publication can be improved, please complete the evaluation
form or e-mail [email protected].
Canadian Cancer Society
n
Canadian Cancer Statistics 2013
2
Members of the Canadian Cancer
Statistics Advisory Committee
Les Mery, MSc (Chair)
Hannah K. Weir, PhD
Centre for Chronic Disease Prevention, Public Health
Agency of Canada, Ottawa, Ontario
Division of Cancer Prevention and Control, Centers
for Disease Control and Prevention, Atlanta, Georgia
Kimberley Boyuk, MA
Analytic and statistical support
Health Statistics Division, Statistics Canada, Ottawa,
Ontario
Robert Semenciw, MSc
Gillian Bromfield, MSc
Cancer Control Policy, Canadian Cancer Society,
Toronto, Ontario
Centre for Chronic Disease Prevention, Public Health
Agency of Canada, Ottawa, Ontario
Lin Xie, MSc (Statistics), MSc (MIS)
Darlene Dale, BASc, FHA
Centre for Chronic Disease Prevention, Public Health
Agency of Canada, Ottawa, Ontario
Princess Margaret Cancer Registry, Princess Margaret
Cancer Centre, Toronto, Ontario
Dianne Zakaria, PhD
Prithwish De, PhD
Cancer Control Policy, Canadian Cancer Society,
Toronto, Ontario
Dagny Dryer, MD, FRCPC
PEI Cancer Treatment Centre and Cancer Registry,
Charlottetown, Prince Edward Island
Health Statistics Division, Statistics Canada, Ottawa,
Ontario
The analysts were supported by:
Amanda Shaw, MSc, and Maggie Stewart, BA
Public Health Agency of Canada, Ottawa, Ontario
Review of French translation:
Maureen MacIntyre, MHSA
Jean-Marc Daigle, MSc
Surveillance and Epidemiology Unit, Cancer Care
Nova Scotia, Halifax, Nova Scotia
Institut national de santé publique du Québec,
Québec, Québec
Rami Rahal, BSc, MBA
System Performance and Surveillance, Canadian
Partnership Against Cancer, Toronto, Ontario
Canadian Cancer Society
n
Canadian Cancer Statistics 2013
3
Table of Contents
Executive summary . . . . . . . . . . . . . . . . . . . . . . . . . 6
About this publication . . . . . . . . . . . . . . . . . . . . . . . 8
Purpose and intended audience . . . . . . . . . . . . . . . .
Format . . . . . . . . . . . . . . . . . . . . . . . . . . . . . . . . . . . . .
Analysis and production . . . . . . . . . . . . . . . . . . . . . .
A note on data . . . . . . . . . . . . . . . . . . . . . . . . . . . . . .
Actual and estimated data . . . . . . . . . . . . . . . . . . . .
8
8
8
8
9
INTRODUCTION:
Cancer in Canada . . . . . . . . . . . . . . . . . . . . . . . . . . 10
CHAPTER 1:
Incidence: How many people in Canada
get cancer? . . . . . . . . . . . . . . . . . . . . . . . . . . . . . . . 14
Highlights . . . . . . . . . . . . . . . . . . . . . . . . . . . . . . . . .
Introduction . . . . . . . . . . . . . . . . . . . . . . . . . . . . . . .
Probability of developing cancer . . . . . . . . . . . . . .
New cases of cancer in 2013 . . . . . . . . . . . . . . . . . .
Trends over time . . . . . . . . . . . . . . . . . . . . . . . . . . .
Trends for selected cancers . . . . . . . . . . . . . . . . . . .
What do these statistics mean? . . . . . . . . . . . . . . .
Canadian Cancer Society
n
Canadian Cancer Statistics 2013
14
14
14
15
16
17
20
CHAPTER 2:
Incidence by sex, age and geography:
Who gets cancer in Canada? . . . . . . . . . . . . . . . . 26
Highlights . . . . . . . . . . . . . . . . . . . . . . . . . . . . . . . . .
Introduction . . . . . . . . . . . . . . . . . . . . . . . . . . . . . . .
Incidence by sex . . . . . . . . . . . . . . . . . . . . . . . . . . . .
Incidence by age . . . . . . . . . . . . . . . . . . . . . . . . . . .
Incidence by geographic region . . . . . . . . . . . . . . .
What do these statistics mean? . . . . . . . . . . . . . . .
26
26
26
27
28
30
CHAPTER 3:
Mortality: How many people in Canada
die of cancer? . . . . . . . . . . . . . . . . . . . . . . . . . . . . . 35
Highlights . . . . . . . . . . . . . . . . . . . . . . . . . . . . . . . . .
Introduction . . . . . . . . . . . . . . . . . . . . . . . . . . . . . . .
Probability of dying from cancer . . . . . . . . . . . . . .
Deaths from cancer in 2013 . . . . . . . . . . . . . . . . . .
Trends over time . . . . . . . . . . . . . . . . . . . . . . . . . .
Trends for selected cancers . . . . . . . . . . . . . . . . . . .
What do these statistics mean? . . . . . . . . . . . . . . .
35
35
35
36
37
38
40
4
Table of Contents
CHAPTER 4:
Mortality by sex, age and geography:
Who dies of cancer in Canada? . . . . . . . . . . . . . .47
Highlights . . . . . . . . . . . . . . . . . . . . . . . . . . . . . . . . .
Introduction . . . . . . . . . . . . . . . . . . . . . . . . . . . . . . .
Mortality by sex . . . . . . . . . . . . . . . . . . . . . . . . . . . .
Mortality by age . . . . . . . . . . . . . . . . . . . . . . . . . . . .
Mortality by geographic region . . . . . . . . . . . . . . .
What do these statistics mean? . . . . . . . . . . . . . . .
47
47
47
48
50
51
CHAPTER 5:
Relative survival: What is the likelihood of
surviving cancer? . . . . . . . . . . . . . . . . . . . . . . . . . . 56
Highlights . . . . . . . . . . . . . . . . . . . . . . . . . . . . . . . . .
Introduction . . . . . . . . . . . . . . . . . . . . . . . . . . . . . . .
Five-year relative survival . . . . . . . . . . . . . . . . . . . .
Five-year conditional relative survival . . . . . . . . .
What do these statistics mean? . . . . . . . . . . . . . . .
Canadian Cancer Society
n
Canadian Cancer Statistics 2013
56
56
57
59
60
CHAPTER 6:
Prevalence: How many people diagnosed with
cancer are alive today? . . . . . . . . . . . . . . . . . . . . . 64
Highlights . . . . . . . . . . . . . . . . . . . . . . . . . . . . . . . . .
Introduction . . . . . . . . . . . . . . . . . . . . . . . . . . . . . . .
Tumour-based prevalence . . . . . . . . . . . . . . . . . . . .
Person-based prevalence . . . . . . . . . . . . . . . . . . . . .
What do these statistics mean? . . . . . . . . . . . . . . .
64
64
65
66
67
CHAPTER 7:
Special topic: Liver cancer . . . . . . . . . . . . . . . . . . . 72
Highlights . . . . . . . . . . . . . . . . . . . . . . . . . . . . . . . . .
Epidemiology of liver cancer . . . . . . . . . . . . . . . . .
Risk factors . . . . . . . . . . . . . . . . . . . . . . . . . . . . . . . .
Diagnosis, treatment, survival and prevalence . .
Prevention and control . . . . . . . . . . . . . . . . . . . . . .
Costs associated with liver cancer care . . . . . . . . .
New developments in liver cancer management
and research . . . . . . . . . . . . . . . . . . . . . . . . . . . . . . .
What do these statistics mean? . . . . . . . . . . . . . . .
72
72
74
75
78
79
80
81
APPENDIX I:
Actual data for new cases and deaths . . . . . . . . 88
APPENDIX II:
Data sources and methods . . . . . . . . . . . . . . . . . . 94
Data sources . . . . . . . . . . . . . . . . . . . . . . . . . . . . . . . 94
Methods . . . . . . . . . . . . . . . . . . . . . . . . . . . . . . . . . . . 95
Data and methods issues . . . . . . . . . . . . . . . . . . . . 100
APPENDIX III:
Previous special topics, abbreviations and
indices . . . . . . . . . . . . . . . . . . . . . . . . . . . . . . . . . . 106
Previous special topics . . . . . . . . . . . . . . . . . . . . . 106
Abbreviations . . . . . . . . . . . . . . . . . . . . . . . . . . . . . 107
Index of tables and figures . . . . . . . . . . . . . . . . . . 108
FOR FURTHER INFORMATION . . . . . . . . . . . . 110
Partner organizations . . . . . . . . . . . . . . . . . . . . . . 110
Canadian Council of Cancer Registries . . . . . . . 111
Canadian Cancer Society offices . . . . . . . . . . . . . 113
5
Executive summary
Canadian Cancer Statistics is an annual publication
that provides estimates of the burden of cancer in
Canada for the current year.
About 2 in 5 Canadians will develop cancer in their
lifetime and about 1 in 4 Canadians will die of cancer.
In 2013, it is estimated that 187,600 Canadians will
develop cancer and 75,500 will die of cancer. More
than half of new cancer cases (52%) will be lung,
breast, colorectal and prostate cancer. Lung cancer is
the leading cause of cancer death, causing more cancer
deaths among Canadians than the other three cancer
types combined. Despite this large impact, there has
been a significant drop in the lung cancer death rate
(especially for men) over the past 20 years, which has
driven a decline in the overall cancer death rate.
Slightly more men than women get cancer in Canada,
and the vast majority (88%) of Canadians who develop
cancer are over the age of 50. However, cancer can
occur at any age. Its impact at a younger age can be
particularly devastating: according to Statistics
Canada, in 2009, cancer was the leading cause of
disease-related death in children under the age of
15 years.
Overall, the five-year relative survival ratio for people
diagnosed with cancer is 63%, but it ranges widely by
the type of cancer. Some cancers have very high
five-year relative survival ratios, including thyroid
cancer (98%). Other cancers have consistently low
five-year relative survival ratios, such as pancreatic
cancer (8%).
Canadian Cancer Society
n
Canadian Cancer Statistics 2013
838,724
Canadians were alive at
the beginning of 2009
with a cancer diagnosed
in the previous
10 years
2 in 5
Canadians will
develop cancer in
their lifetime
187,600
63%
Canadians will be diagnosed
with cancer in 2013
The likelihood of
Canadians with cancer
surviving 5 years relative
to the general
population
75,500
Canadians
will die of cancer
in 2013
1 in 4
Canadians will die
of cancer
6
Executive Summary
As of January 2009, 838,724 Canadians had been
diagnosed with cancer within the previous 10 years
and were still alive on that date. This means that about
2.5% of the Canadian population were living with, or
beyond, a cancer diagnosis in the decade leading up
to 2009.
This year’s publication also features an in-depth
analysis of liver cancer (Chapter 7: Special topic: Liver
cancer). This cancer is one of the fastest growing cancer
types in Canada with regard to new cases and deaths.
It is increasing particularly quickly in men, with an
average annual percent increase in incidence of 3.6%
(1970 to 2007). An estimated 1,550 men and 490
women will be diagnosed with liver cancer this year.
Major risk factors for liver cancer include viral
hepatitis infection (hepatitis B and C), smoking,
alcohol consumption and obesity. A higher risk of liver
cancer in lower income populations and concomitant
barriers to accessing healthcare, early detection and
treatment need to be investigated further to reduce the
impact of this cancer. More Canadian data are also
needed to understand the best strategies for risk
reduction, early detection and treatment of hepatitis
infection, as well as approaches to community
engagement in promoting healthy behaviours in
hard-to-reach populations.
Canadian Cancer Society
n
Canadian Cancer Statistics 2013
Measuring the cancer burden in Canada is vital for
health policy and it helps decision-makers assess the
type and allocation of health resources needed. The
data are also essential in focusing prevention efforts, in
both primary prevention of cancer and secondary
prevention, allowing more effective treatment of
certain cancers through earlier detection. Finally, these
statistics can be useful for prioritizing services to help
Canadians and their families who have been affected
by cancer and who may need supportive care after
their treatment has ended. We hope that our readers
will think critically about what these numbers mean
and how they can be used to improve survival, develop
better overall care for those with cancer and reduce
cancer incidence in Canada.
7
About this publication
Canadian Cancer Statistics is part of an annual series
that began in 1987. It has been developed by cancer
surveillance experts on the Canadian Cancer Statistics
Advisory Committee who were brought together by
the Canadian Cancer Society, the Public Health
Agency of Canada and Statistics Canada. In addition to
these organizations, members of this committee are
from the Canadian Council of Cancer Registries,
Canadian Partnership Against Cancer and the US
Centers for Disease Control and Prevention, as well as
researchers based in universities and provincial or
territorial cancer agencies.
Purpose and intended audience
The aim of this annual publication is to provide
detailed information regarding incidence, mortality,
survival and other measures of cancer burden for the
most common types of cancer. Data are presented by
sex, age and province or territory. They also show
trends over time. The publication is designed to help
health professionals, policy-makers and researchers
identify and make decisions about new areas for
investigation. The media, educators and members of
the public with an interest in cancer will also find this
publication valuable.
Format
Based on a recent evaluation of this publication, the
content and format of this year’s edition have changed.
• The Introduction provides an overview of cancer in
Canada by describing the health and economic
challenges posed by the disease, the potential role
prevention can play in addressing the cancer burden
and the value of surveillance in cancer control efforts
in Canada.
Canadian Cancer Society
n
Canadian Cancer Statistics 2013
• Chapters 1 and 2 describe the incidence of cancer in
Canada overall, by the demographic profile and over
time.
• Chapters 3 and 4 examine the mortality associated
with cancer in Canada by the demographic profile
and over time.
• Chapter 5 focuses on relative survival for cancer in
Canada by population demographics and over time.
• Chapter 6 describes the prevalence of cancer in
Canada by examining the number of cancer cases
and the number of people affected by cancer who are
still alive.
• Chapter 7 is a special topic for this year’s publication.
The chapter explores the epidemiology of liver
cancer, challenges in clinical management,
prevention of this disease and new developments
related to the control of the disease in Canada. In
future editions, this chapter will feature other
emerging or prominent issues on cancer, which are
selected annually based on criteria that include data
availability, recent trends and feedback from our
readers through evaluation forms.
• The appendices provide the actual (not projected)
data for new cancer cases and deaths, as well as
additional information on data sources and
projection methods. They also discuss caveats to the
analyses presented in this publication and provide a
listing of previously covered special topics, which are
available in past editions of this publication.
• The last section of this publication (For further
information) includes contact information for
partner organizations and the provincial and
territorial cancer registries.
The Introduction and Chapters 1 to 7 conclude with a
list of other relevant resources, including links to
online databases for additional analyses.
Analysis and production
The Chronic Disease Surveillance and Monitoring
Division of the Centre for Chronic Disease Prevention
(CCDP) at the Public Health Agency of Canada
conducted the data analyses on incidence, mortality,
probability and trends presented in this publication.
The Health Statistics Division of Statistics Canada
conducted the analyses on survival and prevalence
presented in this publication. Provincial and territorial
cancer registries were consulted regarding the cancer
incidence and mortality estimates for their own
jurisdictions.
The Canadian Cancer Society supports the production
of this publication with charitable funds. Ms Monika
Dixon coordinated the production process and
provided administrative support from the initial
planning through to release.
A note on data
The main sources of data for this publication are the
Canadian Cancer Registry (CCR), National Cancer
Incidence Reporting System (NCIRS), Canadian Vital
Statistics — Death database (CVS: D) and population
life tables, censuses and forecasts.
• Provincial and territorial cancer registries collect
clinical and demographic data on newly diagnosed
cancer cases for people residing in the province or
territory. These data are reported annually to
Statistics Canada and added to the CCR.
8
About this publication
• Provincial and territorial registrars of vital statistics
collect demographic and cause-of-death information
for people who die in their province or territory.
These data are reported annually to Statistics Canada
and added to the CVS: D.
• Cancers in this publication include only invasive
primary cancers and are defined according to
ICD-O-3(1) and ICD-10(2) classifications, unless
otherwise noted.
• Non-melanoma skin cancers (basal and squamous)
are not included because most provincial and
territorial cancer registries do not collect incidence
data on this type of cancer. Canada-wide nonmelanoma skin cancer estimates are based on data
from three provinces only and are shown in select
tables. Note that for the chapters on survival and
prevalence, all non-melanoma skin cancers (in
addition to basal and squamous) are excluded.
This publication examines approximately 20 cancer
types, which represent the vast majority of cancers that
occur in Canada. For practical considerations of space
and data quality, the less common cancers are excluded
from this publication. Information on cancer types not
covered here may be found through reports from
Statistics Canada and the Public Health Agency of
Canada.
Canadian Cancer Society
n
Canadian Cancer Statistics 2013
Actual and estimated data
This publication strives to provide the most up-to-date
data. However, because time is required for reporting,
collating, verifying, analyzing and publishing
surveillance data, the most recent information
available is several years behind the current year.
Actual cancer incidence data reported in this
publication are for the period 1984 to 2010 (except for
Quebec, for which data in the CCR in time for this
publication were available to 2007). Actual mortality
data are for the period 1984 to 2009 for all provinces
and territories. Short-term statistical projections
provide an estimate of cancer incidence and mortality
for recent years (see Appendix II: Data sources and
methods). Incidence is projected for 2008 to 2013 for
Quebec, and for 2011 to 2013 for the other provinces
and territories. Mortality is projected for 2010 to 2013.
Because the CCR is a dynamic database, estimates may
be updated as new data become available. Projected
data are derived using statistical models and, therefore,
they should be considered as estimates only and
approached with caution. Moreover, models can
produce estimates that vary considerably from year to
year. For this reason, using the estimates to track
year-to-year changes (such as comparing estimates to
those from prior editions of this publication) can be
misleading and is discouraged.
Tables A1 and A2 list a larger number of cancer types
than those found elsewhere in the publication. In
addition, Tables A3 to A6 provide actual incidence and
mortality counts and age-standardized rates for
selected cancers by province and territory. Because of
the small populations of the territories, only five-year
averages (2006 to 2010 for incidence and 2005 to 2009
for mortality) are provided.
For information on how to access the most recent
available data, refer to the additional sources of
information listed at the end of each chapter or contact
the respective cancer registries (see a list of Canadian
Cancer Registries).
References
1. Fritz A, Percy C, Jack A, Shanmugaratnam K, Sobin L, Parkin D, et al., eds. International
Classification of Diseases for Oncology. 3rd ed. Geneva, Switzerland: World Health
Organization; 2000.
2. World Health Organization. International Statistical Classification of Diseases and Related
Health Problems, Tenth Revision. Volumes 1 to 3. Geneva, Switzerland: World Health
Organization; 1992.
9
Introduction
Cancer in Canada
Almost half of all Canadians (41% of females and 46%
of males) will develop cancer in their lifetime and a
quarter of all Canadians are expected to die of the
disease. Cancer is the leading cause of death in Canada
(Figure A), responsible for nearly 30% of all deaths,
followed by cardiovascular diseases (diseases of the
heart and cerebrovascular diseases) and chronic lower
respiratory diseases.(1) In addition to being personally
costly, cancer has major economic ramifications on
society at large. In 2000, cancer was the fourth-costliest
disease in Canada, accounting for $17.4 billion. These
costs include $2.6 billion in direct healthcare costs,
which included physician and hospital expenses, and
$14.8 billion in indirect costs from lost productivity
and premature death.(2) Due to our aging population,
these costs are likely to increase. Although many
individuals who survive a cancer diagnosis continue to
live productive and rewarding lives, the cancer
experience presents many physical, emotional and
spiritual challenges that can persist long after the
disease is treated.
Despite these ongoing challenges, much progress has
been made in our fight against cancer. Today, we know
more about what causes cancer, how it develops and
how best to treat it. We also know more about how we
can improve the quality of life of people living with
cancer and cancer survivors, as well as their families
and caregivers. One example of progress is seen in the
drop in the lung cancer mortality rate, especially in
males, from the control of tobacco use among
Canadians. It is estimated that since 1989, nearly
Canadian Cancer Society
n
Canadian Cancer Statistics 2013
100,000 deaths in males and females have been avoided
as a result of cancer control efforts, many of which
would have been due to lung cancer (Figure B).
Other signs of progress are illustrated by the fact that
Canada compares favourably to other countries on
several measures, such as relative survival and
mortality rates. Examples of such comparisons of
cancer indicators among different countries can be
found through various international resources, such as
the GLOBOCAN database,(3) the Cancer Incidence in
Five Continents publication,(4) the International
Cancer Benchmarking Partnership(5) and CONCORD
studies on cancer survival.(6)
According to the American Institute for Cancer
Research and the World Cancer Research Fund,(7)
about one-third of 12 major cancers can be prevented
through a combination of changes in behaviour and
lifestyle, such as a healthy diet, regular physical activity
and maintaining a healthy body weight. The World
Health Organization suggests that prevention offers the
most cost-effective, long-term strategy for controlling
cancer and other non-communicable diseases.(8)
Cancer prevention and risk reduction can be further
achieved through the following initiatives:
FIGURE A Proportion of deaths due to cancer and other causes,
Canada, 2009
Cancer
29.8%
Other
23.6%
Kidney disease 1.5%
Suicide 1.6%
Influenza and pneumonia 2.4%
Alzheimer’s disease 2.6%
Diabetes 2.9%
Diseases
of the heart
20.7%
Accidents 4.3%
Chronic lower
respiratory diseases Cerebrovascular
4.6%
5.9%
Note: The total of all deaths in 2009 in Canada was 238,418
Adapted from: Statistics Canada. Leading Causes of Death in Canada, 2009,
CANSIM Table 102-0561
• Eliminating tobacco use — Tobacco is responsible
for nearly one-quarter of cancer deaths worldwide,
making it the single greatest avoidable risk factor for
cancer.(8)
• Reducing alcohol consumption — Alcohol is a risk
factor for many different cancers and the risk of
cancer increases with the amount of alcohol
consumed.(8)
10
Introduction
• Reducing prolonged exposure to sunlight and
eliminating artificial tanning — Wearing protective
clothing and using sunscreen can help reduce the
risk of skin cancer, while still allowing people to
receive the benefits of sun exposure.
• Reducing exposure to other preventable risk factors
for cancer — This includes infections (responsible
for about 6% of cancer deaths in industrialized
countries), environmental pollution (such as
second-hand smoke), occupational exposures to
carcinogens (such as industrial chemicals) and
radiation.(8)
According to Statistics Canada, the Canadian
population will increase from 34.9 million in 2012 to
as much as 47.7 million people by 2036. The number
of seniors is expected to more than double (to as high
as 10.9 million) during this time period.(9) Increases
in the number of new cancer cases in Canada over
the past 30 years can largely be attributed to the aging
and growing population. In Figure C, the lowest solid
line represents the total number of new cancer cases
or cancer deaths that would have occurred each year
if the population size and age structure remained the
same as they were in 1984. Thus, this line measures
the effect of changes in cancer risk and cancer control
practices. There is very little increase in cancer
incidence as a result of changes in cancer risk or
changes in cancer control practices. The uppermost
line represents the number of new cases or deaths
that actually occurred once the impact of population
growth and aging are taken into account. With such
population factors expected to continue into the
foreseeable future, the Canadian healthcare system is
expected to face greater demand for cancer screening,
as well as diagnostic and treatment services.
FIGURE B Number of cancer deaths avoided* (1989–2007) since the cancer mortality rate peaked in Canada in 1988
Deaths (in thousands)
50
50
45
45
40
40
35
35
30
30
25
Males
Expected deaths
Observed deaths
25
79,600 cancer deaths avoided
20
20
15
15
1984
50
1989
1994
1999
2004
2007
Deaths (in thousands)
50
45
45
40
40
35
30
30
25
25
20
20
15
15
1989
1994
Expected deaths
Observed deaths
35
15,785 cancer deaths avoided
1984
Females
1999
2004
* The dashed line represents the
number of deaths that would have
occurred if the death rate had
remained the same as in 1988.
2007
Analysis by: Canadian Cancer Society
Data source: Canadian Vital Statistics Death database at Statistics Canada
Canadian Cancer Society
n
Canadian Cancer Statistics 2013
11
Introduction
FIGURE C Trends in new cases and deaths for all cancers and ages, attributed to cancer risk, population growth and aging population, both sexes, Canada, 1984–2013
Incidence
100
100
40
90
90
35
80
80
(1984 cancer count)
50
40
Changes in cancer risk
and cancer control
practices
30
Estimated
40
60
Population growth
50
20
10
100
30
1989
1994
1999
2004
10
2009
90
90
80
80
70
70
Aging population
50
40
(1984 cancer count)
Changes in cancer risk
and cancer control
practices
20
Estimated
30
60
Population growth
50
40
10
0
1984
20
1989
1994
1999
2004
2009
2013
25
Population growth
(1984 cancer death)
20
Changes in cancer risk
and cancer control
practices
15
15
10
5
0
30
20
40
1989
1994
1999
2004
2009
Mortality
Deaths (in thousands)
40
30
Aging population
25
0
20
(1984 cancer death)
15
Changes in cancer risk
and cancer control
practices
10
0
25
Population growth
20
5
Females
35
30
10
5
2013
35
15
10
0
1984
2013
100
60
30
25
Incidence
New cases (in thousands)
Aging population
30
20
0
0
1984
Males
35
Estimated
60
40
70
Aging population
70
Mortality
Deaths (in thousands)
Estimated
New cases (in thousands)
10
5
0
1984
1989
1994
1999
2004
2009
2013
Note: New cases exclude
non-melanoma skin cancer (basal
and squamous). Actual incidence
data were available up to the year
2010 for all provinces except for
Quebec (2007). Actual mortality
data were available up to 2009.
The range of scales differs between
the figures.
Analysis by: Chronic Disease Surveillance and Monitoring Division, CCDP, Public Health Agency of Canada
Data sources: Canadian Cancer Registry, National Cancer Incidence Reporting System and Canadian Vital Statistics Death databases at Statistics Canada
Canadian Cancer Society
n
Canadian Cancer Statistics 2013
12
Introduction
Cancer surveillance can help inform cancer prevention
and control. Canada is one of the few nations in the
world with a national population-based cancer registry
that covers the entire population. The information
gained from the national and provincial cancer
registries is valuable for monitoring cancer patterns
and serves as a source of data for cancer control
planning, healthcare resource allocation and research.
Surveillance data are also essential to help focus both
primary prevention efforts (through reducing risk
factors and promoting protective factors) and
secondary prevention efforts (which have the goal of
improving survival through the earlier detection of
cancers and treatment of cancer precursors). To this
end, the annual Canadian Cancer Statistics publication
aims to provide the most current summary of key
cancer surveillance indicators. n
Canadian Cancer Society
n
Canadian Cancer Statistics 2013
For more information
References
• North American Association of Central Cancer Registries.
Cancer in North America: 2005–2009. Available at:
www.naaccr.org/DataandPublications/CINAPubs.aspx
(Accessed June 1, 2012).
1. Statistics Canada. Leading Causes of Death in Canada, 2009. Ottawa: Statistics Canada;
2012.
2. Institute of Health Economics. IHE in your pocket 2008: A handbook of health
economic statistics. Edmonton: Institute of Health Economics; 2008. Available at:
http://www.ihe.ca/documents/IHIYP.pdf (Accessed November 13, 2012).
3. International Agency for Research on Cancer. GLOBOCAN 2008. Available at:
http://globocan.iarc.fr/factsheets/cancers/all.asp (Accessed June 1, 2012).
4. Curado MP, Edwards B, Shin HR, Storm H, Ferlay J, Heanue M, et al., eds. Cancer
Incidence in Five Continents, Volume IX. Lyon, France: International Agency for Research
on Cancer (IARC); 2007.
5. International Cancer Benchmarking Partnership. Available at: http://www.
cancerresearchuk.org/cancer-info/spotcancerearly/ICBP/ (Accessed Nov 26, 2012).
6. Global surveillance of cancer survival: the CONCORD programme. Available at:
http://www.lshtm.ac.uk/eph/ncde/cancersurvival/research/concord/concord_2.html
(Accessed Nov 26, 2012).
7. World Cancer Research Fund/American Institute for Cancer Research. Policy and action
for cancer prevention: Food, nutrition, and physical activity. Washington, DC: American
Institute for Cancer Reseach (AICR); 2010.
8. World Health Organization. Cancer Prevention. Available at: http://who.int/cancer/
prevention/en/index.html (Accessed June 1, 2012).
9. Statistics Canada. Population projections: Canada, the provinces and territories.
Ottawa; 2010. Available from: http://www.statcan.gc.ca/daily-quotidien/100526/
dq100526b-eng.html (Accessed June 1, 2012).
• Canadian Partnership Against Cancer. The Future of Cancer
Control in Canada. Toronto, 2011.
• Canadian Partnership Against Cancer. The 2012 Cancer
Systems Performance Report. Toronto, 2012.
13
CHAPTER 1:
Incidence: How many people in Canada get cancer?
Highlights
• It is expected that 2 in 5 Canadians will develop
cancer in their lifetimes. Males have a 46% lifetime
probability (or a 1 in 2.2 chance) of developing
cancer. Females have a 41% lifetime probability
(or a 1 in 2.4 chance) of developing cancer.
• An estimated 187,600 new cases of cancer are
expected to be diagnosed in Canada in 2013. More
than half of these cases (52%) will be lung, breast,
colorectal and prostate cancers.
• From 1998 to 2007, the incidence rate rose by 0.3%
per year for females (statistically significant).
Between 2003 and 2007, incidence increased by 0.1%
per year for males (not statistically significant).
• Some of the overall increase in the incidence rate is
related to increased detection, while decreases
correspond in part to previous declines in major risk
factors, such as tobacco use or alcohol consumption.
• Increases in the number of new cases over the past
30 years can largely be attributed to a growing and
aging population, rather than to an increase in
cancer risk. Given current population trends,
increases in cancer incidence are expected to
continue. Increases in incidence will have
implications for screening, diagnostic and treatment
services.
• Increased prevention efforts could reduce incidence
rates or result in earlier diagnosis and treatment,
thereby helping to improve survival rates.
important measure of cancer burden on the Canadian
population and healthcare system. Trends in incidence
rates can be used to predict the future burden of
cancer. This information is essential in ensuring
adequate testing, diagnostic and treatment services, as
well as directing future cancer prevention, control and
research programs.
Probability of developing cancer
Probability
The chance a person has of developing cancer
measured over a period of time. The data here are
presented over a lifetime, but probability can also
be calculated as the chance of developing cancer at
a specific point in time, such as by age 30 or over
the next 10 years. The probability of developing
cancer is expressed as a percentage or as a chance
(e.g., a 1 in 5 chance).
The probability of developing a specific type of cancer
depends on many factors, including the population
characteristics (e.g., demographics), prevalence of risk
factors (e.g., smoking, obesity), life expectancy and
others. This probability reflects the average experience
of people in Canada and does not take into account
individual behaviours and risk factors.
represent the fastest-growing age group in Canada. As
a result, it is expected that a growing number of people
will be diagnosed with diseases related to aging, such
as cancer.
The Canadian population is aging.(1) Like many other
developed countries, Canada has a greater proportion
of people who are seniors than in the past. Seniors
In Canada, 1 in 2.2 males and 1 in 2.4 females
(approximately 2 in 5 Canadians) are expected
to develop cancer in their lifetime (Figure 1.1).
FIGURE 1.1 Lifetime probability of developing cancer, Canada, 2007
Males
Females
46%
(1 in 2.2)
41%
(1 in 2.4)
Introduction
Each hour, an estimated 21 people will be diagnosed
with cancer in Canada in 2013. The number of new
cases of cancer each year (the incidence) is an
Canadian Cancer Society
n
Canadian Cancer Statistics 2013
Analysis by: Chronic Disease Surveillance and Monitoring Division, CCDP, Public Health Agency of Canada
Data sources: Canadian Cancer Registry and Vital Statistics Death databases at Statistics Canada
14
CHAPTER 1: Incidence: How many people in Canada get cancer?
The probability of developing cancer varies by cancer
type for males and females.
• As shown in Table 1.1, Canadian males are most
likely to develop prostate cancer, with 1 in 7 males
expected to be diagnosed with prostate cancer in
their lifetime. After prostate cancer, males have the
highest probability of developing lung cancer, with 1
in 11 males expected to be diagnosed in their
lifetime, followed by colorectal cancer, with 1 in 13
males expected to develop colorectal cancer in their
lifetime.
Age-standardized incidence rate (ASIR)
The number of new cases of cancer per 100,000
people, standardized to the age structure of the
1991 Canadian population to account for changes
in age distribution over time.
Annual percent change (APC)
The estimated change in the rate of new cases
(incidence) from one year to the next over a defined
period of time, reported as a percentage. Along with
the changepoint (the year in which the APC
changed), the APC is useful for examining trends.
Incidence
• Canadian females are most likely to develop breast
FIGURE 1.2 Percent distribution of estimated new cancer cases, by sex,
Canada, 2013
cancer, with 1 in 9 females expected to develop
breast cancer in their lifetime. As with men, lung and
colorectal cancer are the next most likely cancers to
develop. Each type of cancer is expected to be
diagnosed in 1 in 15 females during their lifetime. Males
Males
Females
Females
New cases of cancer in 2013
96,200 96,200
New cases
An estimated 187,600 new cases of cancer, as well as an
estimated 81,700 new cases of non-melanoma skin
cancers (basal and squamous), are expected to be
diagnosed in 2013 (Table 1.2).
• As shown in Figure 1.2, four cancers — prostate,
breast, lung and colorectal — together are expected
to account for more than half (52%) of all cancers
diagnosed in Canada in 2013.
• The leading cancers are prostate cancer for males
(23,600 expected new cases, or 25% of all new male
cases) and breast cancer for females (23,800 expected
new cases, or 26% of all new female cases).
• In both males and females, lung cancer is the second
most common cancer, representing 14% and 13% of
cases, respectively. Colorectal cancer is the third
most common cancer for both males and females.
New cases
Prostate24.5%
Lung13.8%
Colorectal13.8%
Bladder6.1%
Non-Hodgkin lymphoma 4.4%
Kidney3.8%
Leukemia3.4%
Melanoma3.4%
Oral2.9%
Pancreas2.4%
Stomach2.2%
Brain1.7%
Liver1.6%
Esophagus1.6%
Multiple myeloma
1.5%
Thyroid1.3%
Testis1.0%
Larynx0.9%
Hodgkin lymphoma
0.6%
Breast0.2%
All other cancers
8.9%
91,400 91,400
New cases
New cases
Breast26.1%
Lung13.3%
Colorectal11.6%
Body of uterus
6.1%
Thyroid4.8%
Non-Hodgkin lymphoma 3.9%
Melanoma3.0%
Ovary2.9%
Leukemia2.7%
Pancreas2.6%
Kidney2.5%
Bladder2.2%
Cervix1.6%
Oral1.5%
Brain1.3%
Stomach1.3%
Multiple myeloma
1.2%
Liver0.5%
Esophagus0.5%
Hodgkin lymphoma
0.5%
Larynx0.2%
All other cancers
9.6%
The number of new cases of cancer in a given year.
Statistical significance
Refers to a number or a relationship that is unlikely
to occur simply by chance. In other words, a statistic
that is reliable.
Canadian Cancer Society
n
Canadian Cancer Statistics 2013
Analysis by: Chronic Disease Surveillance and Monitoring Division, CCDP, Public Health
Agency of Canada
Data source: Canadian Cancer Registry database at Statistics Canada
15
CHAPTER 1: Incidence: How many people in Canada get cancer?
Trends over time
FIGURE 1.3 New cases and age-standardized incidence rates (ASIR) for all cancers, Canada, 1984–2013
Between 1984 and 2013, the number of new cancer
cases rose steadily (Figure 1.3). However, agestandardized incidence rates (ASIR) were mostly stable
for males and increased slightly for females.
600
• In males, brief peaks in the number of new cancer
cases in early 1990s and early 2000s reflect the
underlying trend in the prostate cancer incidence
rate, the leading type of cancer in Canadian men.
• Among females, the overall cancer incidence rate
primarily reflects the steady rise in lung, thyroid and
breast cancer incidence rates.
ASIR (per 100,000)
New cases (in thousands)
100
90
500
80
Males
ASIR
New cases
Estimated
70
400
60
50
300
40
Estimated 30
200
20
10
100
1984
1989
1994
1999
2004
ASIR (per 100,000)
2009
2013
0
New cases (in thousands)
100
600
90
500
80
Females
ASIR
New cases
Estimated
70
400
60
50
300
40
Estimated 30
200
20
10
100
1984
1989
1994
1999
2004
2009
2013
0
Note: “All cancers” excludes
non-melanoma skin cancer
(basal and squamous). Rates are
age-standardized to the 1991
Canadian population. Actual
incidence data were available to
2010 except for Quebec (2007).
For further details, see
Appendix II: Data sources
and methods.
Analysis by: Chronic Disease Surveillance and Monitoring Division, CCDP, Public Health Agency of Canada
Data sources: Canadian Cancer Registry and National Cancer Incidence Reporting System databases at Statistics Canada
Canadian Cancer Society
n
Canadian Cancer Statistics 2013
16
CHAPTER 1: Incidence: How many people in Canada get cancer?
Figures 1.4 and 1.5 show the five most common
cancers (both sexes combined) and those with the
largest statistically significant increases or decreases in
APC (of at least 2% per year). These cancers are
discussed below.
Bladder cancer
Bladder cancer predominantly affects Canadians over
the age of 70 years and occurs more commonly in the
Atlantic provinces. Between 1998 and 2007, incidence
rates in males have fallen slightly (by 0.7% per year).
Little or no change has been seen for the incidence rate
in females. According to one US study,(2) tobacco
smoking, particularly cigarette smoking, accounts for
approximately 50% of all bladder cancers in both males
and females. Occupational exposure to certain
chemicals is the second most important risk factor for
bladder cancer. Exposure to aromatic amines
(especially beta-naphthylamine, benzidine,
4-aminobiphenyl and 4-o-toluidine), polyaromatic
hydrocarbons (PAHs) and diesel engine exhaust are
most commonly found to increase the risk for bladder
cancer.(3)
FIGURE 1.4 Age-standardized incidence rates (ASIR) for selected* cancers, males, Canada, 1984–2013
ASIR (per 100,000)
160
160
Estimated
Tables 1.3 and 1. 4 show the ASIR for selected cancers
in males and females over 30 years. Table 1.5 shows the
annual percent change (APC).
140
120
140
120
100
100
80
80
60
60
40
40
20
20
0
1984
1989
1994
1999
2004
2009
2013
Males
Prostate
Lung
Colorectal
Bladder
0
ASIR (per 100,000)
30
30
Estimated
Trends for selected cancers
25
20
25
20
15
15
10
10
5
5
0
1984
1989
1994
1999
2004
2009
2013
0
Males
Stomach
Kidney
Larynx
Liver
Thyroid
* Five most frequent cancers (both
sexes combined) and cancers with
a statistically significant change in
incidence rate of at least 2% per
year (see Table 1.5).
Note: Rates are age-standardized
to the 1991 Canadian population.
See Table 1.3 for data points.
Actual data for incidence were
available to 2010 except for
Quebec (2007). The range of scales
differs widely between the figures.
Analysis by: Chronic Disease Surveillance and Monitoring Division, CCDP, Public Health Agency of Canada
Data sources: Canadian Cancer Registry and National Cancer Incidence Reporting System databases at Statistics Canada
Canadian Cancer Society
n
Canadian Cancer Statistics 2013
17
CHAPTER 1: Incidence: How many people in Canada get cancer?
Breast cancer
FIGURE 1.5 Age-standardized incidence rates (ASIR) for selected* cancers, females, Canada, 1984–2013
ASIR (per 100,000)
160
160
Estimated
The breast cancer incidence rate rose through the early
1990s. This increase in the incidence rate is due in part
to increased opportunistic mammography screening
that was done before organized provincial screening
programs were implemented from 1988 onward. Since
1988 the rates have fluctuated. The reasons for these
fluctuations are unclear, but they likely have to do with
continued participation in mammography screening
and long-term changes in hormonal factors, such as
early age at menarche, breastfeeding, late age at
menopause, oral contraceptive use and late age at
full-term pregnancy.(4) The decrease in incidence that
occurred around 2002 may reflect the reduced use of
hormone replacement therapy (HRT) among postmenopausal women.(5)
140
120
140
Females
Breast
Colorectal
Lung
120
100
100
80
80
60
60
40
40
20
20
0
Colorectal cancer
1984
Screening for colorectal cancer can identify and
remove precancerous polyps, which can in turn reduce
incidence. As of 2010, all provinces had announced or
started implementing organized screening programs,
although screening rates remain low.(6) Colorectal
cancer is linked to several modifiable risk factors
including obesity, physical inactivity, consumption of
red and processed meat and smoking.(7,8)
1994
1999
2004
2009
2013
ASIR (per 100,000)
30
30
Estimated
Starting from the mid-1980s, incidence rates declined
for both sexes until the mid-1990s (although this
decline was more prominent for females). Incidence
rates then rose through 2000, only to decline
significantly thereafter.
1989
25
25
20
20
15
15
10
10
5
5
0
1984
1989
1994
1999
2004
2009
2013
0
Females
Bladder
Thyroid
Larynx
Liver
* Five most frequent cancers
(both sexes combined) and cancers
with a statistically significant
change in incidence rate of at least
2% per year (see Table 1.5).
Note: Rates are age-standardized
to the 1991 Canadian population.
See Table 1.4 for data points.
Actual data for incidence were
available to 2010 except for
Quebec (2007). The range of scales
differs widely between the figures.
Analysis by: Chronic Disease Surveillance and Monitoring Division, CCDPC, Public Health Agency of Canada
Data sources: Canadian Cancer Registry Registry and National Cancer Incidence Reporting System databases at Statistics Canada
Canadian Cancer Society
n
Canadian Cancer Statistics 2013
18
CHAPTER 1: Incidence: How many people in Canada get cancer?
Larynx cancer
Incidence rates of larynx cancer decreased significantly
from 1998 to 2007 for both males (3.8% per year) and
females (3.3% per year). As cancer of the larynx is most
strongly associated with smoking(9) and alcohol,(10)
declines in incidence rates reflect decreasing trends in
these risk factors.(11,12)
Liver cancer
The incidence rate of liver cancer increased
significantly for males (3.7% per year) and females
(2.4% per year). These increases may be at least
partially explained by rising immigration from regions
of the world where risk factors for liver cancer, such as
hepatitis B and C infection and exposure to aflatoxin,
are more common.(13) See Chapter 7 for more
information on liver cancer.
Lung cancer
In males, the incidence rate of lung cancer began to
level off in the mid-1980s and has been declining
significantly (1.8% per year) since at least 1998. Among
females, the incidence rate has been increasing since
1982, with a significant upward trend of 1.1% per year
between 1998 and 2007. Despite the increasing
number of cases among women, the incidence rate of
lung cancer is higher among males (60 per 100,000)
than females (47 per 100,000).
Canadian Cancer Society
n
Canadian Cancer Statistics 2013
The differences in lung cancer incidence rates among
males and females reflect past differences in tobacco
use. In 2011, smoking prevalence among Canadians
aged 15 and over was estimated to be 17%.(11) In males,
a drop in smoking began in the mid-1960s, preceding
the drop in lung cancer incidence by about 20 years. In
females, tobacco consumption began to drop in the
mid-1980s, suggesting that lung cancer incidence rates
in women should also begin to level off or decrease in
the next two decades.
Prostate cancer
The prostate-specific antigen (PSA) test is not currently
recommended in Canada as a population-based
screening test. Despite uncertainty about the benefits
and risks of prostate cancer testing, use of the PSA test
is widespread.(14) In Canada, the incidence rate of
prostate cancer peaked in 1993 and 2001. Each of these
peaks was followed by a decline. These peaks are
compatible with two waves of intensified screening
activity using the PSA test.
Thyroid cancer
The incidence rate of thyroid cancer is the most rapidly
increasing incidence rate among all major cancers.
There was a 6.8% per year increase in males since 1998,
and a 7.0% per year increase in females since 2002. The
rise may be due to several reasons. More frequent use
of diagnostic testing, including ultrasound, computed
tomography (CT) scanning and magnetic resonance
imaging (MRI), may mean that more earlier stage,
asymptomatic thyroid cancers are being diagnosed.(18)
Exposure to diagnostic ionizing radiation has likely
increased over time and this could promote the
initiation of new tumours.(19) Finally, the increase could
be spurred by exposure to a yet unidentified risk factor.
Stomach cancer
Incidence rates of stomach cancer are declining in both
males (2.0% per year) and females (1.6% per year).
These rates are now about half of what they were in
1984. This decline may be due to long-term
improvements in diets(15) and decreases in smoking
and heavy alcohol use.(16) The declining incidence rates
of stomach cancer may also be related to the more
recent recognition and treatment of infection with the
bacterium Helicobacter pylori, an important risk factor
for stomach cancer.(17)
19
CHAPTER 1: Incidence: How many people in Canada get cancer?
What do these statistics mean?
Generally, the incidence rate for all cancers combined
in males has been stable over the past two decades. In
contrast, the incidence rate for all cancers combined in
females has continued to increase. This increase is
driven mainly by the rise in lung cancer incidence,
which appears to be plateauing in recent years, and
thyroid cancer incidence. While the incidence rates for
individual cancer types can be better explained by
changes in risk factors and prevention efforts, the
overall trend reflects the cumulative impact of the
changes seen for each type of cancer.
Given that so much of the increase in cancer incidence
over the past 30 years is due to an aging population,
this increase can be expected to continue as the
population continues to age. With the rising incidence
of cancer, there will be a commensurate increase in the
need for diagnostic, treatment and support services in
the healthcare system. It will also be important to
develop early strategies to address the cancers that are
now showing significant increase in incidence, such as
liver and thyroid cancers.
Primary prevention efforts should be improved to
reduce the impact of risk factors, such as tobacco use
or obesity. A sustained focus on screening for breast,
colorectal and cervical cancers will help catch and
more effectively treat these cancers earlier in their
course.
Canadian Cancer Society
n
Canadian Cancer Statistics 2013
For more information
Publications
• Kachuri L, De P, Ellison LF, Semenciw R. Cancer incidence,
mortality and survival trends in Canada, 1970–2007. Chronic
Diseases and Injuries in Canada. 2013;33(2):69–80.
• Navaneelan T, Janz T. Cancer in Canada: Focus on Lung,
Colorectal, Breast and Prostate. Health at a Glance, Statistics
Canada. (Catalogue no. 82-624-X), 2011.
• Marrett LD, De P, Airia P, Dryer D. Cancer in Canada in 2008.
CMAJ. 2008; 179(11): 1163–70.
• Statistics Canada. Cancer Incidence in Canada. (Catalogue
82-231-X). Ottawa, 2011.
Databases
• Statistics Canada. Table 103-0550 — New cases for ICD-O-3
primary sites of cancer (based on the July 2011 CCR
tabulation file), by age group and sex, Canada, provinces
and territories, annual, CANSIM (database).
• Statistics Canada. Table 103-0553 — New cases and
age-standardized rate for ICD-O-3 primary sites of cancer
(based on the July 2011 CCR tabulation file), by sex, Canada,
provinces and territories, annual, CANSIM (database).
• Public Health Agency of Canada. Chronic Disease Infobase
Cubes. Ottawa, Canada.
References
1. Statistics Canada. The Canadian Population in 2011: Age and Sex. Catalogue no.
98-311-X2011001. Statistics Canada, May 2012.
2. Freedman ND, Silverman DT, Hollenbeck AR, Schatzkin A, Abnet CC. Association
Between Smoking and Risk of Bladder Cancer Among Men and Women. JAMA. 2011;
306(7):737–45.
3. Kogevinas M, Montserrat G, and Trichopoulos D. Urinary bladder cancer. In: Adami H-O,
Hunter D, Trichopoulos D. Textbook of Cancer Epidemiology. 2nd ed. Oxford: Oxford
University Press. 2008:573–596.
4. Holford TR, Cronin KA, Marriotto AB, Feuer EJ. Changing patterns in breast cancer
incidence trends. JNCI Monographs. 2006;36:19–25
5. De P, Neutel CI, Olivotto I, Morrison H. Breast cancer incidence and hormone replacement
therapy in Canada. Journal of the National Cancer Institute. 2010;102(19):1489–95.
6. Canadian Partnership Against Cancer. System Performance Report. Toronto, ON: CPAC;
2010.
7. World Cancer Research Fund / American Institute for Cancer Research. Continuous
Update Project Interim Report Summary. Food, Nutrition, Physical Activity and the
Prevention of Colorectal Cancer. Washington, DC: AICR; 2011.
8. Wolin KY, Yan Y, Colditz GA, Lee IM. Physical activity and colon cancer prevention: A
meta-analysis. British Journal of Cancer. 2009;100(4):611–6.
9. International Agency for Research on Cancer. Tobacco smoke and involuntary smoking.
IARC Monographs on the Evaluation of Carcinogenic Risks to Humans, Vol 83. Lyon,
France: IARC; 2004.
10.International Agency for Research on Cancer. Alcohol consumption and ethyl carbamate.
IARC Monographs on the Evaluation of Carcinogenic Risks to Humans, Vol 96. Lyon,
France: IARC; 2010.
11.Health Canada. Canadian Tobacco Use Monitoring Survey (CTUMS). Ottawa, ON: Health
Canada; 2011.
12.Health Canada. Canadian Alcohol and Drug Use Monitoring Survey (CADUMS). Ottawa,
ON: Health Canada; 2011.
13.El-Serag HB, Davila JA, Petersen NJ, McGlynn KA. The continuing increase in the incidence
of hepatocellular carcinoma in the United States: An update. Annals of Internal Medicine.
2003;139(10):817–23.
14.Levy I. Prostate cancer: The epidemiologic perspective. The Canadian Journal of Oncology.
1994;4 Suppl 1:4–7.
15.Howson CP, Hiyama T, Wynder EL. The decline in gastric cancer: Epidemiology of an
unplanned triumph. Epidemiologic Reviews. 1986;8:1–27.
16.Health Canada. Focus on gender — A national survey of Canadians’ use of alcohol and
other drugs. Canadian Addiction Survey (CAS). Ottawa, ON: Minister of Health; 2008.
17.International Agency for Research on Cancer. Schistosomes, Liver Flukes and Helicobacter
Pylori. Lyon, France: IARC; 1994.
18.Kent WD, Hall SF, Isotalo PA, Houlden RL, George RL, Groome PA. Increased incidence of
differentiated thyroid carcinoma and detection of subclinical disease. CMAJ.
2007;177(11):1357–61.
19.How J, Tabah R. Explaining the increasing incidence of differentiated thyroid cancer.
CMAJ. 2007;177(11):1383–4.
20
CHAPTER 1: Incidence: How many people in Canada get cancer?
TABLE 1.1 Lifetime probability of developing cancer overall and by age group, Canada, 2007
Lifetime probability
of developing cancer
overall
%
One in:
Males
All cancers*
Prostate
Lung
Colorectal
Bladder
Non-Hodgkin lymphoma
Leukemia
Kidney
Melanoma
Oral
Pancreas
Stomach
Brain
Esophagus
Multiple myeloma
Liver
Larynx
Thyroid
Females
All cancers*
Breast
Lung
Colorectal
Body of uterus
Non-Hodgkin lymphoma
Thyroid
Ovary
Pancreas
Leukemia
Bladder
Melanoma
Kidney
Stomach
Oral
Cervix
Brain
Multiple myeloma
Esophgus
Liver
Larynx
Lifetime probability (%) of developing cancer in next 10 years by age group
30–39
40–49
50–59
60–69
70–79
80–89
46.4
14.3
9.0
7.7
3.6
2.4
1.9
1.8
1.6
1.5
1.4
1.4
0.9
0.8
0.8
0.8
0.6
0.5
2.2
7
11
13
28
41
53
56
63
67
71
73
117
125
131
132
170
217
0.7
—
—
0.1
—
0.1
—
—
0.1
—
—
—
—
—
—
—
—
0.1
1.7
0.2
0.1
0.2
0.1
0.1
0.1
0.1
0.1
0.1
—
—
0.1
—
—
—
—
0.1
6.3
1.9
0.8
0.9
0.3
0.3
0.2
0.3
0.2
0.3
0.2
0.1
0.1
0.1
0.1
0.1
0.1
0.1
15.2
5.7
2.4
2.1
0.8
0.6
0.4
0.5
0.4
0.4
0.3
0.3
0.2
0.2
0.2
0.2
0.2
0.1
21.9
6.3
4.3
3.4
1.6
0.9
0.7
0.6
0.5
0.5
0.6
0.5
0.3
0.4
0.3
0.3
0.2
0.1
21.0
4.6
3.9
3.4
1.9
0.9
0.9
0.5
0.6
0.5
0.6
0.7
0.2
0.3
0.4
0.2
0.2
—
41.3
11.5
6.9
6.6
2.6
1.9
1.5
1.5
1.4
1.4
1.3
1.3
1.2
0.8
0.7
0.7
0.7
0.6
0.3
0.3
0.1
2.4
9
15
15
39
52
66
68
69
72
78
79
82
127
137
145
150
157
359
377
743
1.3
0.4
—
0.1
—
—
0.3
—
—
—
—
0.1
—
—
—
0.1
—
—
—
—
—
3.2
1.3
0.2
0.2
0.1
0.1
0.3
0.1
—
0.1
—
0.2
0.1
—
0.1
0.1
—
—
—
—
—
6.3
2.2
0.8
0.6
0.6
0.2
0.3
0.2
0.1
0.1
0.1
0.2
0.2
0.1
0.1
0.1
0.1
0.1
—
—
—
10.7
3.2
1.9
1.3
0.8
0.4
0.3
0.3
0.2
0.3
0.3
0.3
0.3
0.1
0.2
0.1
0.1
0.1
0.1
0.1
—
14.3
3.2
2.7
2.3
0.7
0.7
0.2
0.4
0.5
0.4
0.5
0.3
0.4
0.3
0.2
0.1
0.2
0.2
0.1
0.1
0.1
14.6
2.7
2.2
2.7
0.5
0.7
0.1
0.4
0.7
0.5
0.5
0.3
0.4
0.3
0.2
0.1
0.2
0.3
0.1
0.1
—
— Value less than 0.05
* “All cancers” excludes in situ bladder cancer and non-melanoma
skin cancer (basal and squamous).
Note: The probability of developing cancer is calculated based on
age- and sex-specific cancer incidence and mortality rates for Canada
in 2007 and on life tables based on 2006–2008 all-cause mortality
rates. For further details, see Appendix II: Data sources and methods.
Analysis by: Chronic Disease Surveillance and Monitoring Division, CCDP, Public Health Agency of Canada
Data sources: Canadian Cancer Registry and Canadian Vital Statistics Death databases at Statistics Canada
Canadian Cancer Society
n
Canadian Cancer Statistics 2013
21
CHAPTER 1: Incidence: How many people in Canada get cancer?
TABLE 1.2 Estimated new cases and age-standardized incidence rates (ASIR) for cancers by sex, Canada, 2013
New cases (2013 estimates)
All cancers
Lung
Breast
Colorectal
Prostate
Bladder†
Non-Hodgkin lymphoma
Melanoma
Kidney
Leukemia
Thyroid
Body of uterus
Pancreas
Oral
Stomach
Brain
Ovary
Multiple myeloma
Liver
Esophagus
Cervix
Larynx
Hodgkin lymphoma
Testis
All other cancers
Non-melanoma skin
Cases per 100,000
Total*
Males
Females
Total*
Males
Females
187,600
25,500
24,000
23,900
23,600
7,900
7,800
6,000
5,900
5,800
5,700
5,600
4,700
4,100
3,300
2,900
2,600
2,500
2,100
2,000
1,450
1,050
1,000
960
17,400
81,700
96,200
13,300
200
13,200
23,600
5,900
4,300
3,300
3,600
3,300
1,250
—
2,300
2,800
2,100
1,650
—
1,400
1,550
1,550
—
860
560
960
8,600
45,000
91,400
12,200
23,800
10,600
—
2,000
3,600
2,700
2,300
2,500
4,400
5,600
2,400
1,350
1,200
1,200
2,600
1,100
490
460
1,450
180
440
—
8,800
36,800
398.6
52.6
51.6
49.1
—
16.2
16.9
13.4
12.5
12.8
14.0
—
9.5
8.7
6.8
6.9
—
5.2
4.3
4.1
—
2.2
2.8
—
36.2
—
437.0
60.1
0.9
59.7
103.9
26.7
19.7
15.1
16.4
15.7
6.2
—
10.3
12.2
9.5
8.2
—
6.3
6.9
6.8
—
3.8
3.2
6.0
39.5
—
370.6
46.8
98.7
39.9
—
7.5
14.4
12.2
9.1
10.3
21.8
22.4
8.7
5.4
4.5
5.7
10.8
4.2
1.9
1.7
7.4
0.7
2.5
—
33.8
—
— Not applicable.
* Column totals may not sum to row totals due to rounding.
†
Ontario does not currently report in situ bladder cancer.
Note: “All cancers” excludes the estimated new cases of non-melanoma
skin cancer (basal and squamous).
Analysis by: Chronic Disease Surveillance and Monitoring Division, CCDP, Public Health Agency of Canada
Data source: Canadian Cancer Registry database at Statistics Canada
Canadian Cancer Society
n
Canadian Cancer Statistics 2013
22
CHAPTER 1: Incidence: How many people in Canada get cancer?
TABLE 1.3 Age-standardized incidence rates (ASIR) for selected* cancers, males, Canada, 1984–2013
Cases per 100,000
Year
1984
1985
1986
1987
1988
1989
1990
1991
1992
1993
1994
1995
1996
1997
1998
1999
2000
2001
2002
2003
2004
2005
2006
2007
2008
2009
2010
2011†
2012†
2013†
All cancers
Prostate
Lung
Colorectal
Bladder
Kidney
Stomach
Liver
Thyroid
Larynx
452.3
452.3
453.9
458.5
460.9
453.8
460.2
472.4
491.1
503.7
491.9
467.6
458.7
461.6
461.6
472.4
476.8
482.8
467.0
462.8
466.8
465.6
465.2
467.5
453.2
448.4
438.3
442.3
439.6
437.0
81.0
85.1
86.1
89.5
90.4
91.8
99.8
112.5
125.8
140.8
129.9
111.9
110.1
115.7
115.1
119.6
124.9
133.3
123.9
120.5
122.7
122.1
126.2
125.8
113.8
111.2
107.6
107.3
105.6
103.9
96.9
93.0
96.1
94.8
95.1
93.3
92.4
90.5
90.6
91.6
86.9
84.8
82.3
79.4
80.7
79.6
77.1
77.0
74.5
72.4
72.4
71.2
69.1
69.0
66.3
66.2
63.2
62.6
61.3
60.1
63.8
65.2
63.5
63.4
63.4
62.0
61.9
61.8
63.4
61.0
62.1
60.6
59.5
59.2
61.4
62.2
64.2
63.2
62.6
60.4
61.6
61.5
60.5
60.8
61.3
59.7
57.3
59.8
59.8
59.7
33.6
32.3
32.5
33.2
32.9
30.3
29.9
30.5
30.2
30.4
30.3
29.6
28.6
29.7
28.4
30.0
28.9
28.0
28.1
28.6
28.7
27.6
27.7
27.0
27.7
27.8
27.5
27.1
26.9
26.7
11.3
11.5
11.6
12.0
13.3
13.4
12.9
13.6
13.1
13.2
13.4
12.8
13.0
13.4
12.9
13.6
13.5
13.7
14.0
13.6
14.0
14.5
14.9
15.2
15.0
15.0
15.2
15.9
16.1
16.4
18.4
18.0
18.0
17.4
17.0
16.7
15.8
15.6
14.6
14.3
14.2
13.3
13.6
13.1
12.6
12.6
12.3
12.0
11.0
11.7
11.4
11.1
10.8
10.6
10.5
10.2
9.6
9.8
9.6
9.5
3.1
2.8
3.3
3.1
3.0
3.2
3.4
3.6
3.5
3.8
4.3
4.2
4.2
4.5
4.4
4.6
4.7
5.3
5.4
5.1
5.4
5.8
5.8
6.3
6.1
6.5
6.3
6.7
6.8
6.9
2.0
1.8
2.0
2.2
2.1
2.1
2.2
2.4
2.0
2.5
2.7
2.6
2.6
2.6
2.7
3.2
3.5
3.6
4.0
3.7
4.0
4.7
5.0
5.2
5.4
5.7
5.6
5.9
6.0
6.2
8.9
8.8
8.8
8.8
8.6
8.1
7.7
8.4
8.1
7.4
7.5
7.4
6.9
6.6
6.7
6.6
5.9
6.1
5.8
5.4
5.3
5.2
4.7
4.8
4.5
4.4
4.2
4.1
3.9
3.8
* Five most frequent cancers (both sexes combined) and cancers
with a statistically significant change in incidence rate of at least
2% per year (see Table 1.5).
Rates for these years are estimated based on all provinces and
territories. Actual data were available to 2010 except for Quebec
(2007). These estimates are based on long-term trends and may not
reflect recent changes in trends.
†
Note: “All cancers” excludes non-melanoma skin cancer (basal and
squamous). Rates are age-standardized to the 1991 Canadian
population.
Analysis by: Chronic Disease Surveillance and Monitoring Division, CCDP, Public Health Agency of Canada
Data sources: Canadian Cancer Registry and National Cancer Incidence Reporting System databases at Statistics Canada
Canadian Cancer Society
n
Canadian Cancer Statistics 2013
23
CHAPTER 1: Incidence: How many people in Canada get cancer?
TABLE 1.4 Age-standardized incidence rates (ASIR) for selected* cancers, females, Canada, 1984–2013
Cases per 100,000
Year
1984
1985
1986
1987
1988
1989
1990
1991
1992
1993
1994
1995
1996
1997
1998
1999
2000
2001
2002
2003
2004
2005
2006
2007
2008
2009
2010
2011†
2012†
2013†
All cancers
Breast
Lung
Colorectal
Thyroid
Bladder
Liver
Larynx
329.9
336.1
325.4
331.6
336.8
330.6
333.6
338.0
344.5
343.9
344.4
342.5
340.7
345.0
352.7
353.5
355.3
353.0
358.9
351.7
354.5
361.2
361.0
364.8
361.4
367.3
366.8
368.1
369.4
370.6
90.3
92.2
88.6
91.1
97.8
96.4
96.0
100.2
102.2
99.3
99.3
99.0
99.0
102.5
103.6
105.6
101.9
100.5
102.5
97.0
97.4
98.6
98.5
98.8
97.0
99.1
101.1
98.8
98.8
98.7
29.5
30.8
31.5
33.2
34.6
34.9
36.3
37.5
39.7
40.6
39.8
40.8
42.0
42.0
43.7
43.5
45.1
45.1
45.7
45.6
46.3
47.6
48.0
47.9
47.6
47.6
46.3
47.0
46.9
46.8
47.8
49.5
47.1
46.7
45.0
44.3
44.5
43.2
43.3
43.2
42.6
41.5
40.2
40.5
42.9
42.0
43.0
42.4
42.1
41.2
41.7
41.5
40.3
40.9
40.5
40.3
39.6
40.1
40.0
39.9
4.9
5.3
5.2
5.2
5.1
5.6
5.8
5.9
6.8
7.1
7.6
7.6
7.8
7.8
8.2
9.5
10.4
11.2
13.3
13.6
15.1
16.7
16.8
18.0
18.9
19.5
20.3
20.6
21.2
21.8
8.7
8.8
7.9
8.6
9.0
7.8
7.9
7.9
7.6
8.2
7.8
7.9
7.4
7.7
8.1
7.8
7.4
7.5
7.5
7.8
7.7
7.8
7.6
7.9
7.3
7.7
7.5
7.5
7.5
7.5
0.9
1.1
0.9
1.1
1.1
1.2
1.0
1.0
1.3
1.3
1.3
1.3
1.4
1.3
1.6
1.2
1.6
1.5
1.5
1.6
1.5
1.6
1.8
1.8
1.8
1.8
1.8
1.8
1.9
1.9
1.4
1.5
1.4
1.5
1.5
1.6
1.4
1.6
1.3
1.3
1.4
1.4
1.3
1.3
1.2
1.2
1.1
1.1
1.1
1.1
1.0
0.9
0.8
1.0
0.9
0.8
0.8
0.8
0.7
0.7
* Five most frequent cancers (both sexes combined) and cancers
with a statistically significant change in incidence rate of at least
2% per year (see Table 1.5).
Rates for these years are estimated based on all provinces and
territories. Actual data were available to 2010 except for Quebec
(2007). These estimates are based on long-term trends and may not
reflect recent changes in trends.
†
Note: “All cancers” excludes non-melanoma skin cancer (basal and
squamous). Rates are age-standardized to the 1991 Canadian
population.
Analysis by: Chronic Disease Surveillance and Monitoring Division, CCDP, Public Health Agency of Canada
Data sources: Canadian Cancer Registry and National Cancer Incidence Reporting System databases at Statistics Canada
Canadian Cancer Society
n
Canadian Cancer Statistics 2013
24
CHAPTER 1: Incidence: How many people in Canada get cancer?
TABLE 1.5 Annual percent change (APC) in age-standardized incidence rates for selected cancers, by sex, Canada, 1998–2007
Males
All cancers
Prostate
Lung
Breast
Colorectal
Non-Hodgkin lymphoma
Bladder
Melanoma
Thyroid
Leukemia
Kidney
Body of uterus
Pancreas
Oral
Stomach
Brain
Ovary
Multiple myeloma
Liver
Esophagus
Cervix
Larynx
Hodgkin lymphoma
Testis
Females
APC
Changepoint
0.1
–0.5
–1.8**
—
–0.8**
0.8**
–0.7*
1.4**
6.8**
0.5
2.6*
—
–0.3
–1.0*
–2.0**
–0.4
—
0.5
3.7**
0.6
—
–3.8**
0.5
1.4*
2003
2001
†
‡
2000
2003
APC
†
0.3**
—
1.1**
–0.7**
–0.8**
0.4
–0.1
1.5**
7.0**
1.1**
1.9**
0.7*
0.4
0.1
–1.6**
–0.8
–0.2
0.1
2.4*
–0.6
–1.4**
–3.3**
0.9
—
Changepoint‡
2000
2002
— Not applicable or small number of cancer cases.
* Significant increase or decrease in APC, p<0.05.
** Significant increase or decrease in APC, p<0.01.
APC is calculated assuming a piecewise log linear model. The model
was fitted to the rates in 1986–2007. “All cancers” includes cancers
not found in the table but excludes non-melanoma skin cancer (basal
and squamous). When there is no changepoint in the most recent
10 years, the APC was obtained by running a separate changepoint
analysis on the most recent 10 years. If there is a changepoint, the
APC was taken from the last segment. For further details, see
Appendix II: Data sources and methods.
†
Changepoint indicates the baseline year for the APC shown, if the
slope of the trend changed after 1998.
‡
Analysis by: Chronic Disease Surveillance and Monitoring Division, CCDP, Public Health Agency of Canada
Data source: Canadian Cancer Registry at Statistics Canada
Canadian Cancer Society
n
Canadian Cancer Statistics 2013
25
CHAPTER 2:
Incidence by sex, age and geography: Who gets cancer in Canada?
Highlights
Incidence by sex
• More cases of cancer are diagnosed in males under
the age of 19 and over the age of 59 than in females
in the same age groups.
• Canadians over the age of 50 represent 88% of all
new cancer cases; nearly half of all new cases (43%)
will occur in individuals aged 70 years or older.
• A variety of factors, including cancer type and age,
influence treatment needs for people with cancer.
For example, treatment decisions may be different
for people nearing the end of their lives. Canadians
in the prime of their lives may have specific needs for
supportive services to help them balance their work
and family responsibilities.
• Cancer incidence decreases from east to west across
the country. The highest incidence rates are generally
found in the Atlantic provinces and Quebec, while
the lowest incidence rates are in British Columbia.
Correlating incidence data with regional risk factor
information, such as tobacco use or obesity rates,
could help better target regional and local prevention
efforts.
Prostate and breast cancer are the most frequently
diagnosed cancers for males and females respectively,
followed by lung and colorectal cancers. Overall, more
males are diagnosed with cancer than females: 51% of
all new cases are diagnosed in males; 49% of all new
cases are diagnosed in females (Table 2.1).
Trends over time
Figure 2.1 shows that the incidence rates for both
males and females changed between 1984 and 2013.
• The overall cancer incidence rate for males of all ages
rose until the early 1990s. Since 1993, there has been
a decline in the incidence rate in males.
• Among females, the overall cancer incidence rate has
been increasing slowly since the early 1990s. This
increase reflects a rise primarily of lung cancer, but it
also represents an increase in thyroid and kidney
cancers, as well as leukemia and melanoma, in
females.
FIGURE 2.1 Age-standardized incidence and mortality rates for all cancers combined, by sex, Canada, 1984–2013
Rate (per 100,000)
600
600
500
500
400
400
Males
Incidence
Mortality
Females
300
300
200
200
100
100
Incidence
Mortality
Introduction
Cancer strikes males and females, young and old, and
those in different regions across Canada on a decidedly
uneven basis. This chapter examines incidence by sex,
age and geographic region to see how cancer affects
people in Canada.
0
1984
1989
1994
1999
2004
2009
2013
0
Note: Rates are agestandardized to the 1991
Canadian population. Actual
incidence data were available
to 2010 except for Quebec
(2007). Actual data for mortality
were available to 2009.
Analysis by: Chronic Disease Surveillance and Monitoring Division, CCDP, Public Health Agency of Canada
Data sources: Canadian Cancer Registry, National Cancer Incidence Reporting System and Canadian Vital Statistics Death databases at Statistics Canada
Canadian Cancer Society
n
Canadian Cancer Statistics 2013
26
CHAPTER 2: Incidence by sex, age and geography: Who gets cancer in Canada?
Cancer primarily affects Canadians over the age of 50:
88% of all new cases are diagnosed in people in this
age group. For both males and females, the median age
of cancer diagnosis is between 65 and 69 years of age.
As shown in Table 2.1, it is estimated that in 2013:
• 43% of all new cases will occur in people aged 70
years or older.
• 28% of all new cases will occur in people aged 60–69
years.
• 18% of all new cases will occur in people aged 50–59
years.
• Less than 1% of all new cases will occur in children
and youth aged 0–19 years. Although this represents
a small percentage of new cancer cases, the diagnoses
have a significant impact on these children and their
families.
The largest proportion of diagnoses of new cases from
the most common cancers occurs in older adults
(Table 2.2).
• Approximately half (53%) of all newly diagnosed
cases of lung and colorectal cancer will occur among
people aged 70 years or older. It is important to note
that the overall cancer incidence rate in males aged
70 and older has been dropping over time, primarily
due to a declining rate of lung cancer from decreased
tobacco use in past decades.(1)
• Breast cancer occurs primarily in females 50–69
years of age (52%). Approximately 30% of cases will
be diagnosed in females over the age of 69, while
18% of cases will occur in females under age 50.
• Prostate cancer will be diagnosed most frequently in
males aged 60–69 years (40%).
Figure 2.2 shows that the distribution of new cancer
cases is quite different between older and younger age
groups.
• Between 2003 and 2007, the most commonly
diagnosed childhood cancer was leukemia, which
accounted for 34% of all newly diagnosed cases,
followed by cancers of the central nervous system
(CNS) and lymphomas (19% and 11% respectively).
• New cancer cases among older adolescents and
young adults aged 15–29 years accounted for 1.5% of
all new cancer cases. The most commonly diagnosed
cancers in this age group were testicular and
non-Hodgkin lymphoma in males and thyroid and
melanoma in females, as well as Hodgkin lymphoma
in both sexes.
FIGURE 2.2 Distribution of new cancer cases for selected cancers by age group, both sexes combined, Canada, 2003–2007
100
N=4,300
80
N=11,400
Thyroid
(15%)
90
Leukemia
(34%)
Testis
(13%)
60
CNS
(19%)
50
40
30
Melanoma
(8%)
Brain
(7%)
Lymphoma
(11%)
Neuroblastoma
and other PNC (7%)
N=88,500
Breast
(25%)
Hodgkin
lymphoma
(13%)
70
% of cases
Incidence by age
Non-Hodgkin
lymphoma (7%)
Renal tumours (5%)
Malignant bone (5%)
10
Prostate
(18%)
Colorectal (7%)
N=342,200
Lung
(17%)
Breast
(14%)
Colorectal
(16%)
Lung
(14%)
Prostate
(14%)
Thyroid
(9%)
Lung (6%)
Melanoma (6%)
Non-Hodgkin
lymphoma (5%)
Colorectal
(12%)
Breast
(9%)
Bladder
(6%)
Leukemia
(6%)
Soft tissue (5%)
20
N=329,600
Other
(31%)
Other
(41%)
Other
(42%)
Other
(39%)
Note: Childhood cancers
(ages 0–14) are classified
according to ICCC-3(2) and young
adults (ages 15–29) and adult
cancers according to ICD-0-3.(3)
Other malignant
epithelial (4%)
Other
(9%)
0
0–14
15–29
N is the total number of cases
over 5 years (2003–2007) for each
age group; CNS=central nervous
system; PNC=peripheral nervous
cell tumours.
30–49
Age group (years)
50–69
70+
Analysis by: Chronic Disease Surveillance and Monitoring Division, CCDP, Public Health Agency of Canada
Data source: Canadian Cancer Registry database at Statistics Canada
Canadian Cancer Society
n
Canadian Cancer Statistics 2013
27
CHAPTER 2: Incidence by sex, age and geography: Who gets cancer in Canada?
Trends over time
Age-standardized incidence rate (ASIR)
Incidence rates differ between sexes according to age.
Specifically, females in the four age groups between 20
and 59 years have consistently higher incidence rates
than males over time (Figure 2.3).
The number of new cases of cancer per 100,000 people, standardized to the age structure of the 1991 Canadian
population to account for changes in age distribution over time.
In this section, age standardization is used to adjust for differences in age distributions among the provinces and
territories, which allows for more accurate comparisons.
Incidence by geographic region
Province or territory
The estimated numbers of new cases for all cancers
combined by province and territory for 2013 are
shown in Figure 2.4, with data in Table 2.3. The
age-standardized incidence rate (ASIR) shows a
declining trend moving from east to west in Canada,
with the highest incidence rates in the Atlantic
provinces and Quebec and the lowest rates in British
Columbia.
Refers to the province or territory of a person’s permanent residence at the time of cancer diagnosis.
The most recent actual data for provinces and territories are available to 2010 (see Tables A3 and A4 in
Appendix I: Actual data for new cases and deaths).
FIGURE 2.3 Age-standardized incidence rates (ASIR) for all cancers, by age group, Canada 1984–2013
Estimated
Rate per 100,000
100
80
100
80
60
60
40
40
20
20
1984
1989
1994
1999
Females (0–19)
Females (20–29)
Females (30–39)
2004
2009 2013
0
Age groups 40 to 69
1,800
1,800
1,600
1,600
1,400
1,200
1,000
1,200
1,000
800
600
600
400
400
200
200
1984
Males (0–19)
Males (20–29)
Males (30–39)
1989
1994
Females (40–49)
Females (50–59)
Females (60–69)
1999
2004
2009 2013
Males (40–49)
Males (50–59)
Males (60–69)
0
Age groups 70 to 80+
4,000
3,500
1,400
800
0
4,000
2,000
Estimated
120
120
0
2,000
Rate per 100,000
140
Estimated
Age groups 0 to 39
Rate per 100,000
140
3,000
3,500
3,000
2,500
2,500
2,000
2,000
1,500
1,500
1,000
1984
1989
1994
Females (70–79)
Females (80+)
1999
2004
2009 2013
1,000
Note: The range of rate scales
differs widely between the age
groups. Incidence rates exclude
non-melanoma skin cancer (basal
and squamous). Actual incidence
data were available up to the year
2010 for all provinces and
territories except Quebec (2007).
Males (70–79)
Males (80+)
Analysis by: Chronic Disease Surveillance and Monitoring Division, CCDP, Public Health Agency of Canada
Data sources: Canadian Cancer Registry and National Cancer Incidence Reporting System databases at Statistics Canada
Canadian Cancer Society
n
Canadian Cancer Statistics 2013
28
CHAPTER 2: Incidence by sex, age and geography: Who gets cancer in Canada?
Estimated new cases (Table 2.4) and ASIR (Table 2.5)
for specific cancer types show that there are geographic
differences for males and females.
• Prostate cancer incidence rates vary greatly among
the provinces, possibly due to variations in PSA
testing across the country.
• Among males, lung cancer incidence rates are
estimated to be highest in Quebec and lowest in
British Columbia. This difference in incidence rates
is linked in large part to the prevalence of smoking
in each province.
• Colorectal cancer incidence rates for both males and
females are highest in Newfoundland and Labrador.
For females, high rates are also seen in Nova Scotia
and Prince Edward Island. The lowest rates for both
sexes are in British Columbia.
• Apart from Newfoundland and Labrador, breast
cancer incidence rates appear to be fairly consistent
across the country, with no discernible geographic
pattern. The lower rate in Newfoundland and
Labrador may be related to incomplete registration
of all breast cancers.
Geographic variations in incidence rates may be due to
differences in modifiable risk factors, such as
unhealthy diet, smoking, obesity and physical
inactivity. Differences in incidence rates may also be
related to different provincial or territorial programs or
procedures for the diagnosis and early detection of
cancer, such as approved screening programs and the
availability of diagnostic services.
Other factors may impact the interpretation of
variations in projected rates among the provinces,
including the following:
Canadian Cancer Society
n
Canadian Cancer Statistics 2013
FIGURE 2.4 Geographic distribution of estimated new cancer cases and age-standardized incidence rates (ASIR) by province or territory,
both sexes, Canada, 2013
344.8 per 100,000
(130 new cases)
368.4 per 100,000
(140 new cases)
386.4 per 100,000
(70 new cases)
362.0 per 100,000
(23,700 new cases)
429.7 per 100,000
(3,300 new cases)
371.2 per 100,000
(16,200 new cases)
391.6 per 100,000
(6,400 new cases)
377.8 per 100,000
(5,300 new cases)
402.2 per 100,000
(71,900 new cases)
419.9 per 100,000
(48,700 new cases)
424.6 per 100,000
(4,900 new cases)
409.1 per 100,000
(880 new cases)
423.0 per 100,000
(6,100 new cases)
Analysis by: Chronic Disease Surveillance and Monitoring Division, CCDP, Public Health Agency of Canada
Data source: Canadian Cancer Registry database at Statistics Canada
29
CHAPTER 2: Incidence by sex, age and geography: Who gets cancer in Canada?
• Cancer frequency — When a cancer is rare or the
population is small, the estimated number of new
cases of a cancer type may be subject to greater
statistical variation.
• Cancer registration method — While the registration
of new cancer cases is generally very good across the
country, there are exceptions. Incomplete
registration is mainly linked to the unavailability and
inaccuracy of death certificate data and specific
diagnostic information in some provinces.
• Method of projection — The selected method of
projection (Nordpred Power5 regression model or
five-year average) for provincial data can vary across
provinces and across cancer types (see Tables A9 and
A10 in Appendix II: Data sources and methods).
• Availability of in situ cases — The large variation
seen in bladder cancer incidence rates among the
provinces is likely due to differences in reporting of
in situ cases, especially in Ontario, where such cases
were not collected until recently and were not
available for this publication.
The data indicate that females are more likely than
males to be diagnosed with cancer in the prime of their
lives (between the ages of 20 and 59 years), which
reflects patterns for specific cancers, such as breast and
thyroid. The priorities of people with cancer and their
needs for services can be expected to vary at different
points in the age continuum; in this case, issues may
arise as females with cancer try to balance family and
work responsibilities.
What do these statistics mean?
• Furlong W, Rae C, Greenberg ML, Barr RD. Surveillance and
survival among adolescents and young adults with cancer in
Ontario, Canada. International Journal of Cancer. 2012;
131(11):2660-7.
This chapter shows a distinct picture of cancer
distribution in Canada by presenting incidence
estimates by sex, age and geographic region. These data
can support informed decision-making to ensure that
healthcare services meet the needs of a specific
population and identify opportunities to target
prevention and cancer control initiatives. For example,
nearly half of all people diagnosed with cancer will be
over the age of 70 and it must be recognized that
evidence-based treatment guidelines may vary by age.
Canadian Cancer Society
n
Canadian Cancer Statistics 2013
Finally, cancer incidence rates across the country are
decidedly uneven, with higher rates in the east and
lower rates in the west. To better target prevention
efforts, these data can be correlated with data on risk
factors such as tobacco and alcohol consumption,
physical inactivity or obesity rates.
Databases
• Statistics Canada. Table 103-0550 — New cases for ICD-O-3
primary sites of cancer (based on the July 2011 CCR
tabulation file), by age group and sex, Canada, provinces
and territories, annual, CANSIM (database).
• Statistics Canada. Table 103-0553 — New cases and
age-standardized rate for ICD-O-3 primary sites of cancer
(based on the July 2011 CCR tabulation file), by sex, Canada,
provinces and territories, annual, CANSIM (database).
References
1. Health Canada. Canadian Tobacco Use Monitoring Survey (CTUMS). Otttawa; 2011.
2. Steliarova-Foucher E, Stiller CA, Lacour B, Kaatsch P. International classification of
childhood cancer. 3rd ed. Cancer. 2005;103:1457–1467.
3. Fritz A, Jack A, Parkin DM, et al., eds. International Classification of Diseases for Oncology.
3rd ed. Geneva, Switzerland: World Health Organization; 2000.
For further information
Publications
• Mitra D, Shaw AK, Hutchings K. Trends in incidence of
childhood cancer in Canada, 1992–2006. Chronic Diseases
and Injuries in Canada. 2012;32(3):131–9.
• De P, Ellison LF, Barr RD, et al. Canadian adolescents and
young adults with cancer: opportunity to improve
coordination and level of care. CMAJ. 2011;183:E187–E194.
• Navaneelan T, Janz T. Cancer in Canada: Focus on lung,
colorectal, breast and prostate. Health at a Glance, Statistics
Canada (Catalogue no. 82-624-X), 2011.
• Ellison LF, De P, Mery LS, Grundy PE. Canadian cancer
statistics at a glance: Cancer in children. CMAJ.
2009:180(4):422-4
30
CHAPTER 2: Incidence by sex, age and geography: Who gets cancer in Canada?
TABLE 2.1 Estimated population and new cases for all cancers by age group and sex, Canada, 2013
Population (in thousands)
New cases (2013 estimates)
Age
Total*
Males
Females
Total*
Males
Females
All ages
0–19
20–29
30–39
40–49
50–59
60–69
70–79
80+
35,318
7,907
4,897
4,796
4,994
5,248
3,839
2,183
1,454
17,521
4,058
2,495
2,401
2,515
2,613
1,871
1,016
552
17,796
3,849
2,403
2,395
2,479
2,635
1,968
1,166
902
187,600
1,450
2,100
5,000
13,100
33,800
51,600
45,100
35,500
96,200
790
990
1,700
4,600
16,300
29,100
25,500
17,300
91,400
670
1,150
3,300
8,500
17,600
22,500
19,600
18,200
* Column totals may not sum to row totals due to rounding.
Note: “New cases” excludes non-melanoma skin cancer (basal and
squamous).
Analysis by: Chronic Disease Surveillance and Monitoring Division, CCDP, Public Health Agency of Canada
Data sources: Canadian Cancer Registry database and Census and Demographics Branch at Statistics Canada
TABLE 2.2 Estimated new cases for the most common cancers by age group and sex, Canada, 2013
Lung
Colorectal
Prostate
Breast
Age
Total*
Males
Females
Total*
Males
Females
Males
Females
All ages
0–19
20–29
30–39
40–49
50–59
60–69
70–79
80+
25,500
5
20
90
720
3,700
7,400
7,900
5,600
13,300
5
10
35
320
1,800
4,000
4,300
2,900
12,200
—
10
50
400
1,950
3,500
3,600
2,700
23,900
10
75
270
1,100
3,600
6,200
6,600
6,000
13,200
5
40
140
570
2,000
3,800
3,900
2,700
10,600
5
35
130
530
1,500
2,400
2,800
3,300
23,600
—
—
5
470
4,400
9,400
6,300
3,000
23,800
5
120
930
3,300
5,900
6,400
4,300
2,900
— Fewer than 3 cases.
* Column totals may not sum to row totals due to rounding.
Analysis by: Chronic Disease Surveillance and Monitoring Division, CCDP, Public Health Agency of Canada
Data source: Canadian Cancer Registry database at Statistics Canada
Canadian Cancer Society
n
Canadian Cancer Statistics 2013
31
CHAPTER 2: Incidence by sex, age and geography: Who gets cancer in Canada?
TABLE 2.3 Estimated population and new cases for all cancers by sex and geographic region, Canada, 2013
Population (in thousands)
CANADA
British Columbia (BC)
Alberta (AB)
Saskatchewan (SK)
Manitoba (MB)
Ontario (ON)
Quebec (QC)†
New Brunswick (NB)
Nova Scotia (NS)
Prince Edward Island (PE)
Newfoundland and Labrador (NL)†
Yukon (YT)
Northwest Territories (NT)
Nunavut (NU)
New cases (2013 estimates)
Total*
Males
Females
Total*
Males
Females
35,318
4,744
3,893
1,055
1,274
13,775
8,089
763
957
146
509
34
45
34
17,521
2,352
1,982
525
635
6,795
4,013
375
466
71
249
17
23
17
17,796
2,391
1,910
530
639
6,981
4,076
388
492
75
260
17
22
16
187,600
23,700
16,200
5,300
6,400
71,900
48,700
4,900
6, 100
880
3,300
130
140
70
96,200
12,600
8,600
2,700
3,200
36,400
24,500
2,600
3,100
490
1,800
65
70
35
91,400
11,200
7,600
2,600
3,200
35,500
24,200
2,200
2,900
390
1,450
65
75
35
* Column totals may not sum to row totals due to rounding.
The number of cases for some cancers used to calculate the overall 2013
incidence estimates for this province was underestimated.
†
Note: New cases excludes non-melanoma skin cancer (basal and
squamous).
Analysis by: Chronic Disease Surveillance and Monitoring Division, CCDP, Public Health Agency of Canada
Data sources: Canadian Cancer Registry and Census and Demographics Branch at Statistics Canada
Canadian Cancer Society
n
Canadian Cancer Statistics 2013
32
CHAPTER 2: Incidence by sex, age and geography: Who gets cancer in Canada?
TABLE 2.4 Estimated new cases for selected cancers by sex and province, Canada, 2013
Canada*
BC
AB
SK
MB
ON
QC†
NB
NS
PE
NL†
96,200
23,600
13,300
13,200
5,900
4,300
3,600
3,300
3,300
2,800
2,300
2,100
1,650
1,550
1,550
1,400
1,250
12,600
3,500
1,500
1,600
840
600
330
450
520
360
310
260
190
230
200
180
110
8,600
2,200
1,050
1,150
570
410
330
330
300
240
200
190
150
140
160
130
120
2,700
650
360
410
190
130
110
110
75
65
65
60
45
25
40
35
20
3,200
720
420
510
210
150
150
130
100
110
80
85
45
35
45
40
30
36,400
9,600
4,400
4,800
1,600
1,700
1,350
1,350
1,600
1,150
840
750
690
630
630
550
610
24,500
4,800
4,300
3,500
2,000
960
950
740
360
640
630
570
440
430
320
370
290
2,600
740
420
350
180
100
130
80
85
65
60
55
35
20
40
35
35
3,100
720
470
480
220
130
140
75
140
90
65
60
45
35
55
45
30
490
140
75
60
30
15
20
15
25
15
10
10
5
5
5
5
5
1,800
500
260
310
95
75
90
30
50
45
25
55
25
15
20
15
15
91,400
23,800
12,200
10,600
5,600
4,400
3,600
2,700
2,600
2,500
2,400
2,300
2,000
1,450
1,350
1,200
1,200
1,100
11,200
3,100
1,500
1,300
720
280
470
430
300
310
290
190
270
170
170
140
130
130
7,600
2,100
1,000
860
500
350
340
250
180
240
200
200
170
160
100
100
85
100
2,600
690
390
330
160
50
110
60
80
80
70
75
70
45
35
35
35
35
3,200
820
450
410
230
100
130
75
100
75
80
75
70
50
55
35
40
35
35,500
9,300
4,200
3,900
2,400
2,300
1,400
1,350
1,150
1,100
810
870
500
610
570
470
480
450
24,200
6,000
3,500
2,800
1,200
1,050
850
280
660
550
740
620
760
280
320
340
310
290
2,200
550
360
250
130
100
90
85
65
50
70
75
60
30
30
30
35
25
2,900
750
460
400
150
90
120
130
65
60
75
95
75
45
40
40
35
30
390
100
55
55
25
10
15
15
10
10
10
10
10
10
10
5
5
5
1,450
330
170
220
110
40
65
35
30
20
20
45
35
30
15
20
30
15
Males
All cancers
Prostate
Lung
Colorectal
Bladder§
Non-Hodgkin lymphoma
Kidney
Leukemia
Melanoma
Oral
Pancreas
Stomach
Brain
Liver
Esophagus
Multiple myeloma
Thyroid
Females
All cancers
Breast
Lung
Colorectal
Body of uterus
Thyroid
Non-Hodgkin lymphoma
Melanoma
Ovary
Leukemia
Pancreas
Kidney
Bladder§
Cervix
Oral
Brain
Stomach
Multiple myeloma
* Column totals may not sum to row totals due to rounding. Canada totals
include provincial and territorial estimates. Territories are not listed
separately due to small numbers.
The number of cases for some cancers used to calculate the overall 2013
estimates for this province was underestimated.
†
Ontario does not currently report in situ bladder cancers; this should be
considered when making comparisons across provinces.
§
Note: “All cancers” excludes non-melanoma skin cancer (basal and
squamous).
Analysis by: Chronic Disease Surveillance and Monitoring Division, CCDP, Public Health Agency of Canada
Data source: Canadian Cancer Registry database at Statistics Canada
Canadian Cancer Society
n
Canadian Cancer Statistics 2013
33
CHAPTER 2: Incidence by sex, age and geography: Who gets cancer in Canada?
TABLE 2.5 Estimated age-standardized incidence rates (ASIR) for selected cancers by sex and province, Canada, 2013
Cases per 100,000
Canada*
BC
AB
SK
MB
ON
QC†
NB
NS
PE
NL†
437
104
60
60
27
20
16
16
15
12
10
9
8
7
7
6
6
402
110
47
51
27
20
11
15
17
11
10
8
7
7
6
6
4
415
102
52
57
29
20
16
16
14
11
10
9
7
6
8
6
6
406
97
53
62
28
20
17
18
12
10
10
9
7
4
6
6
4
428
94
56
66
28
20
19
17
13
14
10
11
7
5
6
6
5
435
112
53
57
19
20
16
17
20
13
10
9
9
7
7
7
8
462
86
80
66
37
18
18
15
7
12
12
11
9
8
6
7
6
491
130
77
65
33
20
23
16
17
11
11
10
7
3
8
6
7
472
102
69
71
32
20
22
12
23
13
10
9
8
5
8
6
5
490
131
74
60
30
16
20
14
24
14
12
8
7
4
8
7
6
500
129
70
85
27
21
24
10
14
12
7
15
8
3
5
5
5
371
99
47
40
22
22
14
12
11
10
9
9
8
7
6
5
5
4
329
95
42
35
21
10
14
14
9
9
5
8
7
6
5
5
4
4
337
92
44
37
22
17
15
11
8
11
9
9
7
8
5
4
4
4
357
97
51
42
22
9
15
9
11
11
10
9
9
9
5
5
4
5
366
99
50
43
28
14
15
9
12
9
9
8
7
7
5
6
4
3
379
101
42
39
25
29
15
16
12
12
9
8
5
8
6
6
5
4
394
102
55
42
19
23
14
5
11
9
10
11
12
6
7
5
5
4
370
93
56
39
21
22
15
16
11
9
12
10
9
7
6
5
5
4
385
101
57
49
20
15
15
19
8
8
12
9
9
8
6
5
5
4
344
93
47
44
19
10
13
15
10
8
11
8
7
10
5
7
4
4
370
82
41
54
26
13
16
9
8
6
12
5
8
10
5
4
8
3
Males
All cancers
Prostate
Lung
Colorectal
Bladder§
Non-Hodgkin lymphoma
Kidney
Leukemia
Melanoma
Oral
Pancreas
Stomach
Brain
Liver
Esophagus
Multiple myeloma
Thyroid
Females
All cancers
Breast
Lung
Colorectal
Body of uterus
Thyroid
Non-Hodgkin lymphoma
Melanoma
Ovary
Leukemia
Kidney
Pancreas
Bladder§
Cervix
Brain
Oral
Stomach
Multiple myeloma
* Canada totals include provincial and territorial estimates. Territories
are not listed separately due to small numbers.
The number of cases for some cancers that were used to calculate
the overall 2013 estimates for this province was underestimated.
†
Ontario does not currently report in situ bladder cancers; this should be
considered when making comparisons across provinces.
§
Note: “All cancers” excludes non-melanoma skin cancer (basal and
squamous). Rates are age-standardized to the 1991 Canadian population.
Analysis by: Chronic Disease Surveillance and Monitoring Division, CCDP, Public Health Agency of Canada
Data source: Canadian Cancer Registry database at Statistics Canada
Canadian Cancer Society
n
Canadian Cancer Statistics 2013
34
CHAPTER 3:
Mortality: How many people in Canada die of cancer?
Highlights
Probability of dying from cancer
• An estimated 75,500 Canadians are expected to die
of cancer in 2013.
• It is expected that 1 in 4 Canadians will die of cancer
in their lifetime. Males have a 28% lifetime
probability (approximately a 1 in 3.6 chance) of
dying from cancer. Females have a 24% lifetime
probability (approximately a 1 in 4.2 chance) of
dying from cancer.
• Between 2001 and 2009, overall mortality rates
declined by 1.9% per year for males. A similar
decline of 1.2% per year for females was seen
between 2002 and 2009. On average, mortality rates
declined by at least 2% per year for the following
cancers: colorectal, lung and prostate cancers in
males; breast, ovary and cervical cancers in females;
and larynx, non-Hodgkin lymphoma and stomach
cancers in both sexes.
• Between 2000 and 2009, liver cancer mortality rates
increased in both males and females.
• The mortality rate continues to increase for lung
cancer in females, although the rate of increase is
slowing.
The chance of dying from cancer differs slightly by sex
(see Figure 3.1). As shown in Table 3.1, males have a
28% chance (or 1 in 3.6 chance) of dying from cancer.
Lung cancer is the most likely cause of cancer death,
with a 1 in 13 chance. Prostate cancer is the next most
likely cause of cancer death, with a 1 in 28 chance.
Colorectal cancer is the third most likely cause of
cancer death, with a 1 in 29 chance.
Table 3.1 also shows that females in Canada have a
24% chance (or a 1 in 4.2 chance) of dying from
cancer. Lung cancer is the most likely cause of cancer
death in females, with a 1 in 18 chance. Similar to the
probability of prostate cancer death in males, females
have a 1 in 29 chance of dying from breast cancer. This
was followed by a 1 in 31 chance of dying from
colorectal cancer.
FIGURE 3.1 Lifetime probability of dying from cancer, Canada, 2007
Males
Females
28%
(1 in 3.6)
24%
(1 in 4.2)
Introduction
Each hour, an estimated nine people will die of cancer
in Canada, in 2013. Monitoring cancer deaths over
time allows us to measure progress in reducing cancer
deaths and contemplate the implications of changing
patterns on the Canadian healthcare system.
Canadian Cancer Society
n
Canadian Cancer Statistics 2013
Analysis by: Chronic Disease Surveillance and Monitoring Division, CCDP, Public Health Agency of Canada
Data source: Canadian Vital Statistics Death database at Statistics Canada
35
CHAPTER 3: Mortality: How many people in Canada die of cancer?
Deaths from cancer in 2013
An estimated 75,500 Canadians are expected to die
from cancer in 2013 (Table 3.2).
FIGURE 3.2 Percent distribution of estimated cancer deaths, by sex,
Canada, 2013
• Lung, colorectal, breast and prostate cancers each
account for 10% or more of all cancer deaths in each
Males
Males
sex (Figure 3.2).
39,400
39,400
• Lung cancer is the leading cause of cancer death for Deaths
Deaths
both sexes. It is responsible for approximately equal
Lung27.2%
proportions of all cancer deaths in both males and
Colorectal12.7%
Prostate10.0%
females.
Pancreas5.5%
• Colorectal cancer is the second most common cause
Leukemia3.8%
of cancer death for males and the third most
Bladder3.8%
Esophagus3.8%
common cause of cancer death for females.
Non-Hodgkin lymphoma 3.6%
• Breast cancer is the second most common cause of
Stomach3.2%
cancer death in females.
Brain2.9%
Kidney2.8%
• Prostate cancer is the third most common cause of
Liver2.0%
cancer death in males.
Oral2.0%
• Although it is much less commonly diagnosed than
Multiple myeloma
1.8%
Melanoma1.6%
many other cancers, pancreatic cancer is the fourth
Larynx0.8%
leading cause of cancer death in both sexes because
Breast0.2%
of its low survival rate.
All other cancers
12.3%
Females
Females
Deaths
Deaths
36,100 36,100
Lung26.3%
Breast13.9%
Colorectal11.6%
Pancreas6.0%
Ovary4.7%
Non-Hodgkin lymphoma 3.3%
Leukemia3.1%
Body of uterus
2.5%
Brain2.2%
Stomach2.2%
Kidney1.8%
Bladder1.7%
Multiple myeloma
1.7%
Esophagus1.2%
Melanoma1.1%
Oral1.0%
Cervix1.0%
Liver0.7%
Larynx0.2%
All other cancers
13.7%
Age-standardized mortality rate (ASMR)
The number of cancer deaths per 100,000 people,
standardized to the age structure of the 1991
Canadian population to account for changes in age
distribution over time.
Annual percent change (APC)
The estimated change in the rate of cancer deaths
(mortality) from one year to the next over a defined
period of time, reported as a percentage. Along
with the changepoint (the year in which the APC
changed), the APC is useful for examining trends.
Mortality
The number of deaths due to cancer in a given year.
Probability
The chance a person has of dying from cancer
measured over a period of time. The probability of
dying from cancer is expressed as a percentage or as
a chance (e.g., a 1 in 5 chance).
Statistical significance
Refers to a number or a relationship that is unlikely
to occur simply by chance. In other words, a statistic
that is reliable.
Analysis by: Chronic Disease Surveillance and Monitoring Division, CCDP, Public Health
Agency of Canada
Data source: Canadian Vital Statistics Death database at Statistics Canada
Canadian Cancer Society
n
Canadian Cancer Statistics 2013
36
CHAPTER 3: Mortality: How many people in Canada die of cancer?
Trends over time
FIGURE 3.3 Deaths and age-standardized mortality rates (ASMR) for all cancers, Canada, 1984–2013
Since 1984, the number of cancer deaths per year has
increased in both sexes. During this period, agestandardized mortality rates (ASMR) for some cancers
have varied between the sexes (Figures 3.3–3.5).
600
• For males, the mortality rate for all cancers has been
decreasing after it reached a peak in 1988. This is
largely due to decreases in mortality rates for lung
cancer and, to a lesser extent, decreases in deaths
from colorectal and prostate cancers.
• For females, the cancer mortality rate for all cancers
has also declined, but to a lesser degree than for
males. The ASMR for females had dropped since
1988 as a result of declines in the mortality rates for
breast and colorectal cancers.
• Since the early 2000s, the mortality rate for nonHodgkin lymphoma has declined for both sexes.
• Cancer mortality rates continue to increase for liver
cancer in both sexes, and for lung cancer in females
(although the rate of increase for lung cancer is
slowing).
ASMR (per 100,000)
Deaths (in thousands)
80
70
Males
ASMR
Deaths
Estimated
500
60
50
400
40
300
30
Estimated
20
200
10
100
1984
1989
1994
1999
2004
ASMR (per 100,000)
2009
2013
0
Deaths (in thousands)
80
600
70
Females
ASMR
Deaths
Estimated
500
60
50
400
40
300
30
Estimated
20
200
10
100
0
Note: Rates are agestandardized to the 1991
Canadian population.
Actual mortality data were
available to 2009.
Analysis by: Chronic Disease Surveillance and Monitoring Division, CCDP, Public Health Agency of Canada
Data source: Canadian Vital Statistics Death database at Statistics Canada
Canadian Cancer Society
n
Canadian Cancer Statistics 2013
37
CHAPTER 3: Mortality: How many people in Canada die of cancer?
Trends for selected cancers
Tables 3.3 and 3.4 show the ASMR from 1984 to 2013
for selected cancers in males and females. Table 3.5
shows the annual percentage change (APC). Figures 3.4
and 3.5 show the five most common cancers (both
sexes combined) and those with the largest statistically
significant decreases or increases in APC (of at least
2% per year). These cancers are discussed below.
Breast cancer
The female breast cancer death rate has been declining
since the mid-1980s. After its peak in 1986, the
age-standardized mortality rate has fallen 42%, from
32.0 deaths per 100,000 in 1986 to a projected rate of
18.7 deaths per 100,000 in 2013. The downward trend
has accelerated to 2.4% per year since 2000, which is
likely due to a combination of increased
mammography screening(1) and the use of more
effective therapies following breast cancer surgery.(2,3)
The breast cancer mortality rate in Canada is the
lowest it has been since 1950, with similar declines
observed in the United States, United Kingdom and
Australia.(4)
FIGURE 3.4 Age-standardized mortality rates (ASMR) for selected* cancers, males, Canada, 1984–2013
ASMR (per 100,000)
90
90
80
Estimated 80
70
70
60
60
50
50
40
40
30
30
20
20
10
10
1984
1989
1994
1999
2004
Canadian Cancer Statistics 2013
0
ASMR (per 100,000)
20
Estimated
15
15
10
10
5
5
1984
1989
1994
1999
2004
Analysis by: Chronic Disease Surveillance and Monitoring Division, CCDP, Public Health Agency of Canada
Data source: Canadian Vital Statistics Death database at Statistics Canada
n
2013
20
0
Canadian Cancer Society
2009
Males
Lung
Colorectal
Prostate
2009
2013
0
Males
Stomach
Pancreas
Non-Hodgkin lymphoma
Larynx
Liver
* Five most frequent causes of
cancer death (both sexes
combined) and cancers with a
statistically significant change in
mortality rate of at least 2% per
year (see Table 3.5).
Note: Rates are age-standardized
to the 1991 Canadian population.
See Table 3.3 for data points.
Actual data for mortality were
available to 2009. The range of
scales differs widely between the
figures.
38
CHAPTER 3: Mortality: How many people in Canada die of cancer?
Cervical cancer
FIGURE 3.5 Age-standardized mortality rates (ASMR) for selected* cancers, females, Canada, 1984–2013
The mortality rate for cervical cancer decreased by
2.7% per year between 2000 and 2009. The decrease in
mortality rate has followed the reduction in the
cervical cancer incidence rate over the same period of
time. The latter is largely the result of Pap test
screening,(5) which has helped detect precancerous and
malignant lesions at an earlier stage when treatment is
more effective.
ASMR (per 100,000)
50
50
Estimated
40
40
30
30
20
20
10
10
Females
Breast
Colorectal
Lung
Colorectal cancer
The death rate from colorectal cancer continues to
decline for both males (2.7% per year since 2004)
and females (1.8% per year since 2000). This is likely
due to improvements in treatments (particularly
chemotherapy).
0
Larynx cancer
Deaths due to larynx cancer have been declining in
both males (4.7% per year) and females (4.0% per
year) since 2000. The trend in mortality rates has
followed the reduction in the larynx cancer incidence
rate during the same time period.
Liver cancer
1984
1989
1994
1999
2004
2013
15
Estimated
10
5
5
1984
1989
1994
1999
2004
Analysis by: Chronic Disease Surveillance and Monitoring Division, CCDP, Public Health of Agency of Canada
Data source: Canadian Vital Statistics Death database at Statistics Canada
Canadian Cancer Statistics 2013
Females
Ovary
Pancreas
Stomach
Non-Hodgkin lymphoma
Cervix
Liver
Larynx
0
n
0
ASMR (per 100,000)
15
10
Between 2000 and 2009, the mortality rate of liver
cancer has increased significantly for both males (3.2%
per year) and females (2.0% per year). The upward
trend in mortality rates has followed the increase in
liver cancer incidence rate. See Chapter 7 for more
information about liver cancer.
Canadian Cancer Society
2009
2009
2013
0
* Five most frequent causes of
cancer death (both sexes
combined) and cancers with a
statistically significant change in
mortality rate of at least 2% per
year (see Table 3.5).
Note: Rates are age-standardized
to the 1991 Canadian population.
See Table 3.4 for data points.
Actual data for mortality were
available to 2009. The range of
scales differs widely between the
figures.
39
CHAPTER 3: Mortality: How many people in Canada die of cancer?
Lung cancer
Pancreatic cancer
Stomach cancer
In males, the mortality rate of lung cancer began to
level off in the late 1980s and has been declining ever
since. The mortality rate for females shows a slight but
statistically significant increase (0.6% per year since
2000). The rate of increase is slowing. The death rate in
females is expected to begin to decline in the future,
similar to the trend in female lung cancer death rate
seen in the US.(6) Despite the diverging trends, males
are projected to continue to have a higher mortality
rate of lung cancer (48.4 per 100,000) than females
(35.9 per 100,000) in 2013.
Mortality rates for pancreatic cancer have been stable
in males and females. The mortality rates for
pancreatic cancer closely reflect the incidence rates for
this cancer due to the low survival. In other countries,
trends in pancreatic cancer mortality rates have shown
wide variation in the past decade. For example, the
UK experienced decreases,(8) while the US showed
increases of pancreatic cancer mortality rates.(9)
Between 2000 and 2009, mortality rates for stomach
cancer have declined for both males (3.0% per year)
and females (2.7% per year). Mortality rates for both
males and females are now one half or less than what
they were in 1984. The trend in mortality rates has
followed the reduction in the stomach cancer
incidence rate during the same time period.
Prostate cancer
While the overall incidence rate of cancer has been
slightly increasing in Canada, the cancer death rate has
been decreasing. The relatively large reduction in
mortality rates from lung, oral and larynx cancers
reflect the reduction in smoking rates, particularly
among males. The decrease in the overall mortality
rate also reflects the availability of better treatment
options, particularly for cancers that are detected at an
early stage of disease when they are most amenable to
treatments. Although the ASMR for cancer continues
to decline, the actual number of cancer deaths
continues to increase. This has implications for health
policy and resource planning.
Non-Hodgkin lymphoma (NHL)
Mortality rates for NHL have declined for both males
(2.5% per year) and females (2.7% per year) since
2000. Declines in mortality may reflect recent
improvements in treatment, such as immunotherapy
(e.g., rituximab). In addition, the introduction of
highly active antiretroviral therapy (HAART) in the
late 1990s(7) for HIV infection has resulted in a decline
of aggressive forms of non-Hodgkin lymphoma
attributable to HIV infection.
Canadian Cancer Society
n
Canadian Cancer Statistics 2013
The mortality rate for prostate cancer rose slowly from
1984 to the mid-1990s, when it began to decline.
Between 2001 and 2009, the mortality rate declined
significantly (by 3.9% per year). This decline likely
reflects improved treatment following the introduction
of hormonal therapy for early and advanced-stage
disease(10,11) and advances in radiation therapy.(12) The
role that screening with the prostate-specific antigen
(PSA) test played in the reduced mortality rate remains
unclear. In 2009, two large randomized trials in the US
and Europe that studied the use of PSA testing in males
over the age of 55 reported conflicting results.(13,14) The
ongoing follow-up of the men in these studies may
help clarify the role of PSA testing in reducing deaths
from prostate cancer.
What do these statistics mean?
40
CHAPTER 3: Mortality: How many people in Canada die of cancer?
For further information
Publications
• Kachuri L, De P, Ellison LF, Semenciw R. Cancer incidence,
mortality and survival trends in Canada, 1970–2007. Chronic
Diseases and Injuries in Canada. 2013;33(2):69–80.
• Navaneelan T, Janz T. Cancer in Canada: Focus on lung,
colorectal, breast and prostate. Health at a Glance, Statistics
Canada (Catalogue no. 82-624-X); 2011.
• Marrett LD, De P, Airia P, Dryer D. Cancer in Canada in 2008.
CMAJ. 2008;179(11):1163–70.
• Statistics Canada. Mortality, Summary List of Causes, 2009.
(Catalogue no. 84F0209X); 2012.
Databases
• Statistics Canada. Table 102-0522 — Deaths, by cause,
Chapter II: Neoplasms (C00 to D48), age group and sex,
Canada, annual (number), CANSIM (database).
• Statistics Canada. Table 102-4309 — Mortality and potential
years of life lost, by selected causes of death and sex,
three-year average, Canada, provinces, territories, health
regions and peer groups, occasional (number unless
otherwise noted), CANSIM (database).
• Public Health Agency of Canada. Chronic Disease Infobase
Cubes. Ottawa, Canada.
Canadian Cancer Society
n
Canadian Cancer Statistics 2013
References
1. Shields M, Wilkins K. An update on mammography use in Canada. Health Reports.
2009;20(3):7–19.
2. Mariotto A, Feuer EJ, Harlan LC, Wun LM, Johnson KA, Abrams J. Trends in use of adjuvant
multi-agent chemotherapy and tamoxifen for breast cancer in the United States:
1975–1999. Journal of the National Cancer Institute. 2002;94(21):1626–34.
3. Edwards BK, Brown ML, Wingo PA, Howe HL, Ward E, Ries LA, et al. Annual report to the
nation on the status of cancer, 1975–2002, featuring population-based trends in cancer
treatment. Journal of the National Cancer Institute. 2005;97(19):1407–27.
4. Bray F, McCarron P, Parkin DM. The changing global patterns of female breast cancer
incidence and mortality. Breast Cancer Research: BCR. 2004;6(6):229–39.
5. Liu S, Semenciw R, Probert A, Mao Y. Cervical cancer in Canada: Changing patterns in
incidence and mortality. International Journal of Gynecological Cancer: Official Journal of
the International Gynecological Cancer Society. 2001;11(1):24–31.
6. Kohler BA, Ward E, McCarthy BJ, Schymura MJ, Ries LA, Eheman C, et al. Annual report to
the nation on the status of cancer, 1975–2007, featuring tumors of the brain and other
nervous system. Journal of the National Cancer Institute. 2011;103(9):714–36.
7. Pulte D, Gondos A, Brenner H. Ongoing improvement in outcomes for patients diagnosed
as having Non-Hodgkin lymphoma from the 1990s to the early 21st century. Archives of
Internal Medicine. 2008;168(5):469–76.
8. Cancer Research UK. Pancreatic cancer mortality statistics. Available at: http://www.
cancerresearchuk.org/cancer-info/cancerstats/types/pancreas/mortality/uk-pancreaticcancer-mortality-statistics (Accessed Feb 6, 2013).
9. American Cancer Society. Cancer Facts & Figures 2013. Atlanta: American Cancer Society;
2013.
10.Cooperberg MR, Grossfeld GD, Lubeck DP, Carroll PR. National practice patterns and time
trends in androgen ablation for localized prostate cancer. Journal of the National Cancer
Institute. 2003;95(13):981–9.
11.Meng MV, Grossfeld GD, Sadetsky N, Mehta SS, Lubeck DP, Carroll PR. Contemporary
patterns of androgen deprivation therapy use for newly diagnosed prostate cancer.
Urology. 2002;60(3 Suppl 1):7–11; discussion -2.
12.Kupelian PA, Buchsbaum JC, Elshaikh MA, Reddy CA, Klein EA. Improvement in
relapse-free survival throughout the PSA era in patients with localized prostate cancer
treated with definitive radiotherapy: Year of treatment an independent predictor of
outcome. International Journal of Radiation Oncology, Biology, Physics. 2003;57(3):
629–34.
13.Andriole GL, Crawford ED, Grubb RL, 3rd, Buys SS, Chia D, Church TR, et al. Mortality
results from a randomized prostate-cancer screening trial. The New England Journal of
Medicine. 2009;360(13):1310–9.
14.Schroder FH, Hugosson J, Roobol MJ, Tammela TL, Ciatto S, Nelen V, et al. Screening and
prostate-cancer mortality in a randomized European study. The New England Journal of
Medicine. 2009;360(13):1320–8.
41
CHAPTER 3: Mortality: How many people in Canada die of cancer?
TABLE 3.1 Lifetime probability of dying from cancer, Canada, 2007
Probability (%)
One in:
28.1
7.7
3.6
3.5
1.4
1.1
1.0
1.0
0.9
0.8
0.7
0.6
0.5
0.5
0.4
0.3
0.2
3.6
13
28
29
72
89
95
96
111
119
149
165
200
205
269
287
407
23.7
5.5
3.5
3.2
1.4
1.0
0.9
0.7
0.6
0.5
0.5
0.5
0.4
0.4
0.3
0.2
0.2
0.2
0.1
4.2
18
29
31
71
95
110
134
173
195
213
220
247
252
339
420
406
443
769
Males
All cancers
Lung
Prostate
Colorectal
Pancreas
Bladder
Non-Hodgkin lymphoma
Leukemia
Stomach
Esophagus
Kidney
Brain
Oral
Multiple myeloma
Liver
Melanoma
Larynx
Females
All cancers
Lung
Breast
Colorectal
Pancreas
Ovary
Non-Hodgkin lymphoma
Leukemia
Body of uterus
Stomach
Bladder
Brain
Multiple myeloma
Kidney
Esophagus
Melanoma
Oral
Cervix
Liver
Note: The probability of dying from cancer represents the proportion
of Canadians who die of cancer in a cohort subjected to the mortality
conditions prevailing in the population at large in 2007. For further
details, see Appendix II: Data sources and methods.
Analysis by: Chronic Disease Surveillance and Monitoring Division, CCDP, Public Health Agency of Canada
Data source: Canadian Vital Statistics Death database at Statistics Canada
Canadian Cancer Society
n
Canadian Cancer Statistics 2013
42
CHAPTER 3: Mortality: How many people in Canada die of cancer?
TABLE 3.2 Estimated deaths and age-standardized mortality rates (ASMR) for cancers by sex, Canada, 2013
Deaths (2013 estimates)
All cancers
Lung
Colorectal
Breast
Pancreas
Prostate
Non-Hodgkin lymphoma
Leukemia
Bladder
Stomach
Brain
Esophagus
Kidney
Ovary
Multiple myeloma
Oral
Melanoma
Liver
Body of uterus
Larynx
Cervix
All other cancers
Deaths per 100,000
Total*
Males
Females
Total*
Males
Females
75,500
20,200
9,200
5,100
4,300
3,900
2,600
2,600
2,100
2,000
1,950
1,900
1,750
1,700
1,350
1,150
1,050
1,000
890
390
380
9,800
39,400
10,700
5,000
60
2,200
3,900
1,450
1,500
1,500
1,250
1,150
1,500
1,100
—
730
770
640
780
—
310
—
4,900
36,100
9,500
4,200
5,000
2,200
—
1,200
1,100
630
780
790
420
640
1,700
620
380
390
240
890
75
380
5,000
151.6
41.3
18.1
10.2
8.7
—
5.3
5.3
4.1
4.1
4.3
3.9
3.5
—
2.7
2.3
2.2
2.1
—
0.8
—
19.2
178.2
48.4
22.6
0.3
9.6
17.8
6.6
7.0
6.8
5.7
5.3
6.7
4.9
—
3.3
3.4
2.9
3.5
—
1.4
—
22.1
131.7
35.9
14.3
18.7
7.8
—
4.3
4.0
2.0
2.8
3.3
1.5
2.3
6.5
2.2
1.4
1.5
0.9
3.3
0.3
1.6
17.1
— Not applicable.
* Column totals may not sum to row totals due to rounding.
Note: “All other cancers” includes 420 deaths from non-melanoma skin
cancer (basal and squamous).
Analysis by: Chronic Disease Surveillance and Monitoring Division, CCDP, Public Health Agency of Canada
Data source: Canadian Vital Statistics Death database at Statistics Canada
Canadian Cancer Society
n
Canadian Cancer Statistics 2013
43
CHAPTER 3: Mortality: How many people in Canada die of cancer?
TABLE 3.3 Age-standardized mortality rates (ASMR) for selected* cancers, males, Canada, 1984–2013
Deaths per 100,000
Year
1984
1985
1986
1987
1988
1989
1990
1991
1992
1993
1994
1995
1996
1997
1998
1999
2000
2001
2002
2003
2004
2005
2006
2007
2008
2009
2010†
2011†
2012†
2013†
All cancers
Lung
Colorectal
Prostate
Pancreas
Non-Hodgkin
lymphoma
Stomach
Liver
Larynx
248.1
249.2
249.0
248.1
254.6
249.4
246.4
247.5
245.2
243.2
242.3
239.3
236.6
232.3
230.7
229.8
225.8
224.3
220.3
215.4
212.1
207.7
201.5
200.1
196.5
192.2
188.0
184.6
181.4
178.2
80.2
78.0
78.8
78.5
81.2
81.0
79.4
78.7
77.6
77.9
75.6
73.3
72.9
70.5
70.2
70.4
64.3
64.7
64.5
62.7
60.6
59.8
57.5
57.0
54.7
54.2
52.2
50.9
49.6
48.4
32.4
33.3
31.9
31.9
32.3
31.9
30.8
30.3
31.0
29.6
30.2
30.0
29.4
28.8
28.8
28.4
28.4
27.0
27.6
26.7
26.7
26.4
24.8
24.4
24.5
23.3
23.6
23.2
22.9
22.6
27.5
28.9
29.4
29.4
30.7
29.7
30.1
31.2
31.1
31.1
30.8
31.1
29.0
28.8
28.1
26.9
26.9
26.7
25.1
24.0
23.4
21.9
20.8
20.4
20.1
19.5
19.0
18.6
18.2
17.8
12.5
12.7
12.8
12.6
11.8
11.5
11.3
11.0
11.2
11.1
11.0
10.7
10.9
10.0
10.4
10.6
10.1
10.3
9.8
10.3
10.4
9.8
9.8
10.2
9.9
10.1
9.8
9.8
9.7
9.6
7.0
7.1
7.7
7.1
7.8
7.7
7.9
8.1
8.1
7.7
8.4
8.4
8.4
8.7
8.9
9.2
9.0
9.1
8.5
8.5
8.3
7.9
7.5
7.8
7.3
7.3
7.0
6.9
6.7
6.6
13.9
13.0
13.1
12.9
12.8
12.3
11.3
10.3
10.7
9.7
9.8
9.6
9.5
9.0
8.6
8.4
8.1
7.6
7.3
7.4
7.0
6.8
7.0
6.5
6.2
6.0
6.0
5.9
5.8
5.7
2.3
2.2
2.3
2.3
2.6
2.4
2.0
1.9
2.2
2.3
2.5
2.1
2.2
2.4
2.7
2.7
2.4
2.6
2.6
2.7
2.6
3.0
3.0
3.1
3.0
3.3
3.3
3.3
3.4
3.5
3.3
3.4
3.5
3.6
3.7
3.2
3.6
3.5
3.3
3.2
3.2
3.1
2.9
2.8
2.7
2.6
2.8
2.7
2.5
2.3
2.2
2.1
2.0
1.8
2.0
1.9
1.6
1.6
1.5
1.4
* Five most frequent causes of cancer death (both sexes combined)
and cancers with a statistically significant change in mortality rate of
at least 2% per year (see Table 3.5).
Rates for these years are estimated based on all provinces and
territories. Actual mortality data were available to 2009. These
estimates are based on long-term trends and may not reflect recent
changes in trends.
†
Note: Rates are age-standardized to the 1991 Canadian population.
Analysis by: Chronic Disease Surveillance and Monitoring Division, CCDP, Public Health Agency of Canada
Data source: Canadian Vital Statistics Death database at Statistics Canada
Canadian Cancer Society
n
Canadian Cancer Statistics 2013
44
CHAPTER 3: Mortality: How many people in Canada die of cancer?
TABLE 3.4 Age-standardized mortality rates (ASMR) for selected* cancers, females, Canada, 1984–2013
Deaths per 100,000
Year
1984
1985
1986
1987
1988
1989
1990
1991
1992
1993
1994
1995
1996
1997
1998
1999
2000
2001
2002
2003
2004
2005
2006
2007
2008
2009
2010†
2011†
2012†
2013†
All cancers
Lung
Breast
Colorectal
Pancreas
Ovary
Non-Hodgkin
lymphoma
Stomach
Cervix
Liver
Larynx
151.8
154.8
154.4
154.0
155.3
153.0
152.9
153.7
153.1
154.9
155.2
152.0
155.2
150.4
151.3
149.8
149.8
148.2
149.2
148.1
147.0
143.7
141.5
141.2
140.0
136.9
135.9
134.5
133.2
131.7
22.1
23.7
23.9
25.3
26.9
26.9
27.5
29.5
29.6
31.7
31.9
31.3
33.6
32.6
34.5
34.9
34.4
34.4
35.2
35.3
36.1
35.9
36.8
36.1
36.2
36.0
36.1
36.1
36.1
35.9
30.7
31.8
32.0
31.3
31.4
31.2
31.3
30.1
30.4
29.4
30.0
28.7
28.9
27.8
26.4
25.2
25.0
25.0
24.4
24.1
23.1
22.6
21.5
21.8
20.9
20.4
20.0
19.5
19.1
18.7
23.8
23.6
23.3
22.8
22.6
21.2
21.2
20.6
20.1
20.2
19.8
19.7
19.6
18.7
19.1
18.5
18.1
17.6
17.5
16.9
17.1
16.7
15.7
16.3
15.7
15.1
15.0
14.8
14.5
14.3
8.4
8.2
8.5
8.7
8.1
7.8
8.2
8.0
8.0
8.3
8.4
7.9
8.3
8.0
8.0
7.8
7.9
7.8
7.8
8.1
8.2
7.8
8.0
7.9
7.8
7.9
7.8
7.8
7.8
7.8
8.6
8.4
8.2
8.1
8.3
8.0
7.9
7.8
7.7
7.9
8.0
7.6
8.1
7.7
7.7
7.4
7.3
7.3
8.0
7.6
7.5
7.3
7.1
6.7
7.0
6.7
6.7
6.6
6.6
6.5
4.7
5.0
5.1
5.2
5.0
5.5
5.5
5.7
5.5
5.5
5.7
5.9
5.8
5.8
6.0
5.7
6.1
5.7
5.7
5.5
5.8
5.0
4.9
5.2
4.8
4.7
4.6
4.5
4.4
4.3
5.7
6.0
6.1
5.7
5.1
5.5
5.0
4.9
4.9
4.5
4.6
4.6
4.4
3.9
3.8
4.0
3.9
3.4
3.6
3.5
3.3
3.5
3.2
2.9
3.2
2.9
3.0
2.9
2.9
2.8
3.5
3.3
3.2
3.0
3.0
2.9
3.0
2.9
2.4
2.6
2.7
2.4
2.6
2.5
2.3
2.4
2.2
2.1
1.9
1.9
2.0
1.8
1.8
1.9
1.7
1.7
1.7
1.7
1.6
1.6
0.8
0.8
0.9
0.9
0.9
1.0
0.8
0.7
0.7
0.7
0.6
0.6
0.7
0.6
0.7
0.8
0.7
0.7
0.8
0.7
0.7
0.7
0.8
0.8
0.8
0.8
0.9
0.9
0.9
0.9
0.5
0.5
0.6
0.6
0.6
0.5
0.5
0.7
0.4
0.5
0.6
0.6
0.4
0.5
0.4
0.5
0.5
0.4
0.4
0.4
0.4
0.4
0.3
0.4
0.4
0.3
0.3
0.3
0.3
0.3
* Five most frequent causes of cancer death (both sexes combined)
and cancers with a statistically significant change in mortality rate of
at least 2% per year (see Table 3.5).
Rates for these years are estimated based on all provinces and
territories. Actual data were available to 2009. These estimates are
based on long-term trends and may not reflect recent changes in
trends.
†
Note: Rates are age-standardized to the 1991 Canadian population.
Analysis by: Chronic Disease Surveillance and Monitoring Division, CCDP, Public Health Agency of Canada
Data source: Canadian Vital Statistics Death database at Statistics Canada
Canadian Cancer Society
n
Canadian Cancer Statistics 2013
45
CHAPTER 3: Mortality: How many people in Canada die of cancer?
TABLE 3.5 Annual percent change (APC) in age-standardized mortality rates (ASMR) for selected cancers, by sex, Canada, 2000–2009
Males
APC
†
All cancers
Prostate
Lung
Breast
Colorectal
Non-Hodgkin lymphoma
Bladder
Melanoma
Thyroid
Leukemia
Kidney
Body of uterus
Pancreas
Oral
Stomach
Brain
Ovary
Multiple myeloma
Liver
Esophagus
Cervix
Larynx
Hodgkin lymphoma
Testis
–1.9**
–3.9**
–2.2**
—
–2.7**
–2.5**
–0.7*
1.2
2.0
–1.3**
–0.3
—
–0.2
–1.7*
–3.0**
1.6
—
–1.4
3.2**
–0.1
—
–4.7**
–2.0
–1.4
Females
Changepoint
‡
2001
2001
2004
2005
APC
†
–1.2**
—
0.6**
–2.4**
–1.8**
–2.7**
0.6
0.9
0.4
–0.2
–0.6
2.7
0.0
–1.3
–2.7**
–0.1
–2.2*
–1.5*
2.0*
–1.1
–2.7**
–4.0**
–1.3
—
Changepoint‡
2002
2005
— Not applicable or small number of deaths.
2004
* Significant increase or decrease in APC, p<0.05
** Significant increase or decrease in APC, p<0.01
APC is calculated assuming a piecewise log linear model. The model
was fitted to the rates in 1986–2009. When there is no changepoint
in the most recent 10 years, the APC was obtained by running a
separate changepoint analysis on the most recent 10 years. If there is
a changepoint, the APC was taken from the last segment. For further
details, see Appendix II: Data sources and methods.
†
Changepoint indicates the baseline year for the APC shown, if the
slope of the trend changed after 2000.
‡
Analysis by: Chronic Disease Surveillance and Monitoring Division, CCDP, Public Health Agency of Canada
Data source: Canadian Vital Statistics Death database at Statistics Canada
Canadian Cancer Society
n
Canadian Cancer Statistics 2013
46
CHAPTER 4:
Mortality by sex, age and geography: Who dies of cancer in Canada?
Highlights
Mortality by sex
Trends over time
• Among people under the age of 55 years, females
account for a greater proportion of cancer deaths.
Around age 55, the mortality rate for males surpasses
that for females.
• In 2013, almost all cancer deaths in Canada (95%)
will occur in people over the age of 50 years. Most of
these cancer deaths (61%) will occur in people aged
70 years and over.
• The mortality rate has been decreasing to varying
degrees for all age groups in males and for the under
70 age groups in females.
• Mortality rates are highest in the Atlantic provinces
and Quebec. They decline moving west across
Canada.
• Variations in mortality rates across different regions
may reflect a number of factors, such as differences
in access to and outcomes of cancer control activities
(e.g., screening, diagnosis, treatment and follow-up).
These differences may apply at regional and
demographic (age and sex) levels.
In 2013, it is estimated that 52% of all cancer deaths
will occur among males and 48% among females.
However, the distribution of cancer deaths between the
sexes differs according to age. Among people aged
30–49 years and over 80 years, females represent a
larger proportion of total cancer deaths than males
(Table 4.1). This is mainly due to the varying age
distributions of deaths from breast versus lung and
colorectal cancer (Table 4.2).
Figure 4.1 shows the long-term trend in mortality rates
by sex. The mortality rate for all cancers combined has
been decreasing for males and females since 1988.
Introduction
300
300
200
200
100
100
As with new diagnoses of cancer, cancer deaths are not
distributed equally across sexes, ages and provinces or
territories. Examining deaths of cancer by sex, age or
geographic region provides a better sense of who is
dying from cancer and can help direct cancer control
services to address the needs of specific populations.
The decrease in mortality rate in males is largely due to
reductions in lung cancer deaths (closely linked to
decreases in smoking). The decrease in cancer deaths
in females is attributed to declines in breast cancer
mortality (most likely due to improvements in early
detection and screening as well as improvements in
treatment outcomes).
FIGURE 4.1 Age-standardized incidence and mortality rates for all cancers combined, by sex, Canada, 1984–2013
Rate (per 100,000)
600
600
500
500
400
400
Males
Mortality
Incidence
Females
0
1984
1989
1994
1999
2004
2009
2013
0
Mortality
Incidence
Note: Rates are agestandardized to the 1991
Canadian population. Actual
data for mortality were available
to 2009. Actual incidence data
were available to 2010 except
for Quebec (2007).
Analysis by: Chronic Disease Surveillance and Monitoring Division, CCDP, Public Health Agency of Canada
Data sources: Canadian Cancer Registry, National Cancer Incidence Reporting System and Canadian Vital Statistics Death databases at Statistics Canada
Canadian Cancer Society
n
Canadian Cancer Statistics 2013
47
CHAPTER 4: Mortality by sex, age and geography: Who dies of cancer in Canada?
Mortality by age
FIGURE 4.2 Distribution of cancer deaths for selected cancers by age group, both sexes combined, Canada, 2005–2009
In 2013, almost all (95%) cancer deaths in Canada will
occur in people over the age of 50 years, with the
median age range for cancer deaths estimated to be
70–74 years for both sexes (see Table 4.1).
100
90
In 2013, it is estimated that:
• While the majority of female cancer cases occur in
females under the age of 70, breast cancer deaths are
proportionately lower in that age group than in
females aged 70 years and older. This potentially
reflects the benefits that screening and treatment
have in prolonging life in middle-aged women. A
large number of females will also die of breast cancer
between the ages of 50 and 69 years.
• Similarly, prostate cancer will be diagnosed most
frequently in males aged 60–69 years, but most
prostate cancer deaths will occur in males aged 80
years and older. These mortality rates likely reflect
the benefits of early detection of prostate cancer and
the slow progression of the disease. A large number
of males will also die of prostate cancer between the
ages of 70 and 79 years.
• Unlike other cancers, where the number of deaths
increases with age, deaths for lung cancer peak in
people aged 70–79 years for both males and females.
This peak occurs because the largest proportion of
new cases is in the same age group (see Chapter 2)
Canadian Cancer Society
n
Canadian Cancer Statistics 2013
80
N=1,400
N=18,200
Leukemia
(17%)
Lung
(18%)
70
Bone
(11%)
Leukemia
(27%)
Connective
tissue (9%)
Non-Hodgkin
lymphoma (6%)
40
30
Neuroblastoma
and other PNC
(11%)
Lung
(25%)
Breast
(16%)
Malignant bone
(6%)
Renal tumours (4%)
Colorectal (9%)
Colorectal (11%)
Brain
(8%)
Breast
(8%)
Pancreas (4%)
Pancreas (6%)
Prostate
(7%)
Breast
(6%)
Pancreas (5%)
Colorectal (5%)
Hodgkin lymphoma(4%)
Melanoma (4%)
Soft tissue
(9%)
20
N=209,800
Colorectal (13%)
60
50
N=116,300
Lung
(31%)
CNS
(34%)
Brain
(15%)
% of cancer deaths
• Canadians aged 70 years or older will account for
about 46,200 cancer deaths (61% of all cancer deaths).
• Canadians aged 60–69 years will account for an
additional 16,900 deaths (22% of all cancer deaths).
• Canadians aged 50–59 years will account for 8,900
deaths (12% of all cancer deaths).
Older adults account for the largest proportion of
deaths from the most common cancers (see Table 4.2):
N=630
Other
(45%)
Other
(44%)
Other
(43%)
Other
(28%)
Note: Childhood cancers
(ages 0–14) are classified
according to ICCC-3(2) and young
adults (ages 15–29) and adult
cancers according to ICD-10.(3)
10
Other
(11%)
0
0–14
15–29
N is the total number of deaths
over 5 years (2005–2009) for each
age group; CNS=Central nervous
system; PNC=Peripheral nervous
cell tumours.
30–49
Age group (years)
50–69
70+
Analysis by: Chronic Disease Surveillance and Monitoring Division, CCDP, Public Health Agency of Canada
Data source: Canadian Vital Statistics Death database at Statistics Canada
and survival is poor, so that deaths typically occur
within a short period after diagnosis (see Chapter 5).
Figure 4.2 shows that the distribution of cancer deaths
is quite different in the older age groups than in
younger age groups.
• Between 2005 and 2009, the leading causes of
childhood cancer deaths were cancers of the
central nervous system (CNS) (34%), followed by
leukemia (27%).
• Cancer deaths among older adolescents and young
adults (aged 15–29 years) accounted for less than 1% of
all cancer deaths in Canada. The most common causes
of cancer deaths in this age group were leukemia
(17%), followed by brain cancer (15%).
48
CHAPTER 4: Mortality by sex, age and geography: Who dies of cancer in Canada?
Trends over time
Age-standardized mortality rate (ASMR)
Cancer mortality rates have decreased to varying
degrees over time for all age groups in males and for
the under-70 age groups in females (Figure 4.3).
The number of cancer deaths per 100,000 people, standardized to the age structure of the 1991 Canadian
population to account for changes in age distribution over time.
In this section, age standardization is used to adjust for differences in age distributions among the provinces and
territories, which allows for more accurate comparisons.
Province or territory
Refers to the province or territory of a person’s usual place of residence at the time of his/her death.
The most recent actual data for provinces and territories are available to 2009 (see Tables A5 and A6 in Appendix I:
Actual data for new cases and deaths).
FIGURE 4.3 Age-standardized mortality rates (ASMR) for all cancers, by age group, Canada, 1984–2013
900
Age groups 40 to 69
900
800
20
25
700
20
15
15
10
10
5
5
0
0
1984
1989
1994
1999
Females (0–19)
Females (20–29)
Females (30–39)
2004
2009 2013
Rate per 100,000
Estimated
Rate per 100,000
25
500
500
400
400
300
300
200
200
100
100
0
Males (0–19)
Males (20–29)
Males (30–39)
1989
1994
Females (40–49)
Females (50–59)
Females (60–69)
1999
2004
2009 2013
Males (40–49)
Males (50–59)
Males (60–69)
3,000
2,500
700
600
1984
Age groups 70 to 80+
800
600
0
3,000
2,500
Estimated
30
Rate per 100,000
Age groups 0 to 39
Estimated
30
2,000
2,000
1,500
1,500
1,000
1,000
500
500
1984
1989
1994
Females (70–79)
Females (80+)
1999
2004
Note: The range of rate scales
differs widely between the age
groups. Actual mortality data were
available up to 2009 for all
provinces and territories.
2009 2013
Males (70–79)
Males (80+)
Analysis by: Chronic Disease Surveillance and Monitoring Division, CCDP, Public Health Agency of Canada
Data source: Canadian Vital Statistics Death database at Statistics Canada
Canadian Cancer Society
n
Canadian Cancer Statistics 2013
49
CHAPTER 4: Mortality by sex, age and geography: Who dies of cancer in Canada?
Mortality by geographic region
The estimated number of cancer deaths for all cancers
and both sexes combined by province and territory are
shown in Table 4.3, with age-standardized mortality
rates (ASMR) shown in Figure 4.4. Similar to the
pattern for incidence rates, the mortality rate for all
cancers combined is highest in the Atlantic provinces
and Quebec and lowest in western Canada.
FIGURE 4.4 Geographic distribution of estimated cancer deaths and age-standardized mortality rates (ASMR) by province or territory, both sexes,
Canada, 2013
Estimated deaths (Table 4.4) and ASMR (Table 4.5)
for specific cancer types show that there are several
geographic differences:
• Lung cancer mortality rates for both males and
females are highest in Quebec and the Atlantic
provinces and lowest in British Columbia.
• Colorectal cancer mortality rates are highest in
Newfoundland and Labrador, particularly for males.
• The prostate cancer mortality rate is highest in
Prince Edward Island (although this may be due to
statistical variability associated with small
populations), Saskatchewan and Manitoba. The
mortality rate for prostate cancer is lowest in
Quebec.
Mortality rates reflect the incidence and survival rates
in a given region, which could reflect variation across
regions in risk factors, availability and use of screening
programs and diagnostic services, as well as differences
in treatment practices.
240.6 per 100,000
(80 deaths)
185.4 per 100,000
(60 deaths)
363.1 per 100,000
(55 deaths)
139.2 per 100,000
(9,700 deaths)
188.3 per 100,000
(1,500 deaths)
143.1 per 100,000
(6,300 deaths)
153.6 per 100,000
(2,700 deaths)
149.1 per 100,000
(2,300 deaths)
145.3 per 100,000
(27,700 deaths)
165.5 per 100,000
(20,200 deaths)
159.5 per 100,000
(1,950 deaths)
160.2 per 100,000
(360 deaths)
170.3 per 100,000
(2,600 deaths)
Analysis by: Chronic Disease Surveillance and Monitoring Division, CCDP, Public Health Agency of Canada
Data source: Canadian Cancer Registry database at Statistics Canada
Canadian Cancer Society
n
Canadian Cancer Statistics 2013
50
CHAPTER 4: Mortality by sex, age and geography: Who dies of cancer in Canada?
What do these statistics mean?
Differences in cancer mortality rates by age, sex and
geography can be driven by a broad range of factors.
These factors include those that are inherent to the
epidemiology of different cancers, particularly the age
at which they tend to occur in populations of males
versus females (e.g., prostate cancer deaths typically
occur in older males compared to breast cancer deaths
in females). Other factors, however, may be differences
in access to cancer control interventions (such as
screening and early detection) as well as variations in
practice patterns between provinces as well as within
age and sex groupings across provinces. There are
likely also age and sex differences in response rate to
cancer treatment,(1) which may contribute to variations
in the mortality rate.
For further information
Publications
• Navaneelan T, Janz T. Cancer in Canada: Focus on lung,
colorectal, breast and prostate. Health at a Glance, Statistics
Canada (Catalogue no. 82-624-X); 2011.
• Statistics Canada. Mortality, Summary List of Causes, 2009.
(Catalogue no. 84F0209X); 2012.
Databases
• Statistics Canada. Table 102-0552 — Deaths and mortality
rate, by selected grouped causes and sex, Canada, provinces
and territories, annual, CANSIM (database).
• Statistics Canada. Table 102-4309 — Mortality and potential
years of life lost, by selected causes of death and sex,
three-year average, Canada, provinces, territories, health
regions and peer groups, occasional (number unless
otherwise noted), CANSIM (database).
References
1. Schmetzer O, Flörcken A. Sex differences in the drug therapy for oncologic diseases.
Handbook of Experimental Pharmacology. 2012;(214):411–42.
2. Steliarova-Foucher E, Stiller CA, Lacour B, Kaatsch P. International classification of
childhood cancer. 3rd ed. Cancer. 2005;103:1457–1467.
3. World Health Organization. International Statistical Classification of Diseases and Related
Health Problems, Tenth Revision. Volumes 1 to 3. Geneva, Switzerland: World Health
Organization; 1992.
Canadian Cancer Society
n
Canadian Cancer Statistics 2013
51
CHAPTER 4: Mortality by sex, age and geography: Who dies of cancer in Canada?
TABLE 4.1 Estimated population and deaths for all cancers by age group and sex, Canada, 2013
Population (in thousands)
Deaths (2013 estimates)
Age
Total*
Males
Females
Total*
Males
Females
All ages
0–19
20–29
30–39
40–49
50–59
60–69
70–79
80+
35,318
7,907
4,897
4,796
4,994
5,248
3,839
2,183
1,454
17,521
4,058
2,495
2,401
2,515
2,613
1,871
1,016
552
17,796
3,849
2,403
2,395
2,479
2,635
1,968
1,166
902
75,500
160
190
610
2,500
8,900
16,900
20,700
25,500
39,400
90
100
250
1,100
4,500
9,300
11,500
12,600
36,100
75
85
370
1,400
4,400
7,600
9,200
13,000
* Column totals may not sum to row totals due to rounding.
Analysis by: Chronic Disease Surveillance and Monitoring Division, CCDP, Public Health Agency of Canada
Data sources: Canadian Vital Statistics Death database and Census and Demographics Branch at Statistics Canada
TABLE 4.2 Estimated deaths for the most common cancers by age group and sex, Canada, 2013
Lung
Colorectal
Prostate
Breast
Age
Total*
Males
Females
Total*
Males
Females
Males
Females
All ages
0–19
20–29
30–39
40–49
50–59
60–69
70–79
80+
20,200
—
5
40
450
2,600
5,400
6,400
5,400
10,700
—
5
15
200
1,300
2,900
3,500
2,800
9,500
—
5
25
250
1,300
2,500
2,900
2,600
9,200
—
15
60
260
940
1,900
2,400
3,600
5,000
—
10
30
140
570
1,200
1,450
1,650
4,200
—
5
30
120
370
700
970
1,950
3,900
—
—
—
10
130
510
1,050
2,200
5,000
—
5
95
390
870
1,100
1,000
1,550
— Fewer than 3 cases or deaths.
* Column totals may not sum to row totals due to rounding.
Analysis by: Chronic Disease Surveillance and Monitoring Division, CCDP, Public Health Agency of Canada
Data source: Canadian Vital Statistics Death database at Statistics Canada
Canadian Cancer Society
n
Canadian Cancer Statistics 2013
52
CHAPTER 4: Mortality by sex, age and geography: Who dies of cancer in Canada?
TABLE 4.3 Estimated population and deaths for all cancers by sex and geographic region, Canada, 2013
Population (in thousands)
CANADA
British Columbia (BC)
Alberta (AB)
Saskatchewan (SK)
Manitoba (MB)
Ontario (ON)
Quebec (QC)
New Brunswick (NB)
Nova Scotia (NS)
Prince Edward Island (PE)
Newfoundland and Labrador (NL)
Yukon (YT)
Northwest Territories (NT)
Nunavut (NU)
Deaths (2013 estimates)
Total*
Males
Females
Total*
Males
Females
35,318
4,744
3,893
1,055
1,274
13,775
8,089
763
957
146
509
34
45
34
17,521
2,352
1,982
525
635
6,795
4,013
375
466
71
249
17
23
17
17,796
2,391
1,910
530
639
6,981
4,076
388
492
75
260
17
22
16
75,500
9,700
6,300
2,300
2,700
27,700
20,200
1,950
2,600
360
1,500
80
60
55
39,400
5,200
3,400
1,200
1,400
14,300
10,300
1,000
1,400
180
830
45
30
30
36,100
4,500
2,900
1,100
1,300
13,400
9,900
930
1,150
180
660
35
30
25
* Column totals may not sum to row totals due to rounding.
Analysis by: Chronic Disease Surveillance and Monitoring Division, CCDP, Public Health Agency of Canada
Data sources: Canadian Vital Statistics Death database and Census and Demographics Branch at Statistics Canada
Canadian Cancer Society
n
Canadian Cancer Statistics 2013
53
CHAPTER 4: Mortality by sex, age and geography: Who dies of cancer in Canada?
TABLE 4.4 Estimated deaths for selected cancers by sex and province, Canada, 2013
Canada*
BC
AB
SK
MB
ON
QC
NB
NS
PE
NL
39,400
10,700
5,000
3,900
2,200
1,500
1,500
1,500
1,450
1,250
1,150
1,100
780
770
730
640
5,200
1,250
650
570
310
190
250
240
200
130
150
130
140
110
90
85
3,400
810
400
360
180
130
120
150
130
110
110
95
65
75
65
55
1,200
300
150
160
65
50
50
40
55
30
30
35
5
20
25
15
1,400
360
180
180
70
60
55
60
50
50
35
50
20
30
25
15
14,300
3,600
1,850
1,500
800
600
550
580
540
470
430
390
320
300
280
290
10,300
3,400
1,300
860
540
350
360
300
340
340
300
260
190
170
180
120
1,000
340
110
100
60
35
35
40
45
35
30
35
10
20
15
15
1,400
370
200
130
75
55
55
55
55
45
40
45
15
25
25
25
180
55
25
20
10
10
10
10
5
5
5
5
—
5
5
5
830
230
140
65
35
20
25
25
20
45
20
25
10
15
10
15
36,100
9,500
5,000
4,200
2,200
1,700
1,200
1,100
890
790
780
640
630
620
420
390
380
380
4,500
1,150
600
530
280
240
140
140
90
100
85
70
85
70
75
55
50
40
2,900
730
400
300
200
150
95
90
80
60
60
55
45
60
40
35
35
45
1,100
280
160
120
75
55
40
40
20
25
20
25
15
20
15
10
10
15
1,300
320
190
160
70
70
55
45
30
25
30
25
20
25
15
10
15
20
13,400
3,300
1,950
1,500
760
670
430
430
390
280
270
240
250
240
160
170
150
150
9,900
2,900
1,350
1,150
600
400
320
260
210
230
240
160
160
160
80
80
95
70
930
260
110
100
65
50
30
30
20
20
25
20
10
15
15
10
5
10
1,150
340
130
160
75
50
50
40
30
30
25
25
20
20
20
10
10
20
180
50
30
25
10
5
10
5
5
5
5
5
5
—
—
—
—
—
660
160
95
100
30
30
20
15
15
15
25
15
10
10
5
5
5
10
Males
All cancers
Lung
Colorectal
Prostate
Pancreas
Leukemia
Bladder
Esophagus
Non-Hodgkin lymphoma
Stomach
Brain
Kidney
Liver
Oral
Multiple myeloma
Melanoma
Females
All cancers
Lung
Breast
Colorectal
Pancreas
Ovary
Non-Hodgkin lymphoma
Leukemia
Body of uterus
Brain
Stomach
Kidney
Bladder
Multiple myeloma
Esophagus
Melanoma
Oral
Cervix
— Fewer than 3 deaths.
* Column totals may not sum to row totals due to rounding.
Canada totals include provincial and territorial estimates.
Territories are not listed separately due to small numbers.
Analysis by: Chronic Disease Surveillance and Monitoring Division, CCDP, Public Health Agency of Canada
Data source: Canadian Vital Statistics Death database at Statistics Canada
Canadian Cancer Society
n
Canadian Cancer Statistics 2013
54
CHAPTER 4: Mortality by sex, age and geography: Who dies of cancer in Canada?
TABLE 4.5 Estimated age-standardized mortality rates (ASMR) for selected cancers by sex and province, Canada, 2013
Deaths per 100,000
Canada*
BC
AB
SK
MB
ON
QC
NB
NS
PE
NL
178
48
23
18
10
7
7
7
7
6
5
5
3
3
3
3
163
39
20
17
10
6
8
8
6
4
5
4
4
4
3
3
172
41
20
19
9
7
6
7
7
5
5
5
3
3
3
3
173
44
22
22
10
8
7
6
8
5
5
5
1
3
3
3
180
47
23
22
9
8
7
8
7
7
5
6
3
4
4
2
169
43
22
17
9
7
6
7
6
6
5
5
4
3
3
4
194
63
24
16
10
7
7
5
6
6
6
5
4
3
3
2
189
62
21
19
12
7
6
8
9
7
6
7
2
4
3
3
213
55
30
20
11
9
8
8
8
7
6
7
2
4
4
4
180
57
23
23
10
9
8
8
7
4
5
7
—
5
4
3
235
64
39
20
10
6
8
7
6
13
5
7
2
4
3
4
132
36
19
14
8
6
4
4
3
3
3
2
2
2
2
2
1
1
120
32
16
13
7
6
4
4
2
3
2
2
2
2
1
1
2
1
121
32
17
12
8
6
4
4
3
3
2
2
3
2
2
2
2
1
132
34
20
13
9
7
5
5
3
3
2
3
2
2
2
1
2
1
135
34
20
16
7
8
5
5
3
3
3
3
2
2
2
1
2
1
127
32
19
13
7
7
4
4
4
3
3
2
2
2
2
2
1
1
146
44
21
16
9
6
5
4
3
4
3
2
2
2
1
1
1
1
138
40
17
14
9
7
5
5
3
4
3
3
2
1
1
1
2
1
138
41
15
18
9
6
6
4
3
4
3
3
2
2
2
2
2
1
146
40
23
18
7
5
6
5
3
3
3
5
—
3
—
—
—
—
153
39
22
22
7
7
4
4
3
4
6
4
2
2
2
1
1
1
Males
All cancers
Lung
Colorectal
Prostate
Pancreas
Leukemia
Bladder
Esophagus
Non-Hodgkin lymphoma
Stomach
Brain
Kidney
Liver
Oral
Multiple myeloma
Melanoma
Females
All cancers
Lung
Breast
Colorectal
Pancreas
Ovary
Non-Hodgkin lymphoma
Leukemia
Body of uterus
Brain
Stomach
Kidney
Multiple myeloma
Bladder
Cervix
Melanoma
Esophagus
Oral
— Fewer than 3 deaths.
* Canada totals include provincial and territorial estimates.
Territories are not listed separately due to small numbers.
Note: Rates are age-standardized to the 1991 Canadian population.
Analysis by: Chronic Disease Surveillance and Monitoring Division, CCDP, Public Health Agency of Canada
Data source: Canadian Vital Statistics Death database at Statistics Canada
Canadian Cancer Society
n
Canadian Cancer Statistics 2013
55
CHAPTER 5:
Relative survival: What is the likelihood of surviving cancer?
Highlights
• For 2006 to 2008, the five-year relative survival ratio
(RSR) for people diagnosed with cancer was 63%.
• Five-year RSRs are highest for thyroid (98%),
testicular (97%) and prostate (96%) cancers. They are
lowest for pancreatic (8%), esophageal (14%) and
lung (17%) cancers.
• Five-year relative survival generally decreases with
age.
• People diagnosed with cancer today have a better
five-year relative survival than they did just over a
decade ago. Between 1992 to 1994 and 2006 to 2008,
the five-year relative survival for all cancers
combined increased by seven percentage points from
56% to 63%.
• Five-year conditional RSRs demonstrate that survival
of people diagnosed with cancer generally improves
with time since diagnosis. Between 2006 and 2008,
the five-year RSR for all cancers combined increased
from 63% when measured from the date of diagnosis
to 81% when measured among those who survived
the first year after a cancer diagnosis.
• Differences in age-standardized five-year RSRs
across geographic regions and types of cancer help
point to areas where greater effort is required to
detect, diagnose and effectively treat cancer earlier.
Introduction
Five-year relative survival ratios (RSRs) provide a
measure of disease severity and prognosis. A person
diagnosed with a cancer that has a poor five-year
relative survival has a small probability of living until
Canadian Cancer Society
n
Canadian Cancer Statistics 2013
the fifth anniversary of his or her diagnosis. Relative
survival estimates, when examined across cancer types
and geographic regions, can be used to establish
priorities for improving prognosis. Examining these
estimates over time, and in conjunction with cancer
incidence and mortality trends, can also give
important information about progress in cancer
treatment and control.(1)
Confidence interval (CI)
A range of values that provides an indication of the
precision of an estimate. Confidence intervals are
usually 95%, which means that one can be 95%
confident the range contains the true value for the
estimate of interest.
Five-year relative survival ratio (RSR)
Several factors can work together to influence the
likelihood of surviving cancer. These factors include
stage of the cancer at diagnosis and aggressiveness of
the tumour, as well as the availability and quality of
early detection, diagnostic and treatment services. In
addition, factors such as age, sex, existence of other
health conditions, socio-economic status and lifestyle
can also affect survival.
A measure of the impact of cancer on life
expectancy that compares the survival of people
diagnosed with cancer to the survival of a
comparable group of people in the general
population. For example, a five-year RSR of 63%
means that the cancer reduces the likelihood of
surviving five years after a cancer diagnosis by 37%.
Five-year RSR is the preferred measure for assessing
population-based cancer survival.
The RSR is a useful “average” indicator of survival(2)
and does not reflect any individual’s prognosis. It is
based on the experiences of a group of people rather
than a specific person’s chance of surviving for a given
period of time. Moreover, confidence intervals around
survival estimates represent statistical variation rather
than the range of possible prognoses for individual
people with cancer.
RSRs can be measured over various timeframes,
such as 1, 3, 5 or 10 years. As is standard in other
reports, five years has been chosen as the primary
duration of analysis for this report.
It is also important to remember that survival ratios do
not distinguish among people who are free from
cancer, in a state of relapse or still undergoing
treatment. In addition, because survival statistics
describe the survival experience of people diagnosed
in the past, they do not reflect more recent advances in
detection and treatment that could lead to improved
Observed survival
The proportion of people with cancer who are alive
after a given period of time (e.g., five years) after diagnosis.
cancer survival. Finally, five-year RSRs are different
from five-year observed survival, which refers to the
proportion of people with cancer who are alive five
years after their diagnosis. The current estimate for
observed survival for all cancers combined is 56%
(Table 5.1).
56
CHAPTER 5: Relative survival: What is the likelihood of surviving cancer?
Five-year relative survival
Survival by province
Table 5.1 shows the five-year RSRs for people
diagnosed with selected cancers in Canada between
2006 and 2008.
Five-year RSRs are age-standardized to allow
comparisons across provinces. Table 5.2 shows
age-standardized five-year RSRs for the four most
common cancer types (prostate, breast, colorectal and
lung cancers). The following exceptions and caveats
should be considered when examining these data:
• For all cancers combined, the five-year RSR is 63%.
• The five-year RSRs are highest for thyroid (98%),
testicular (97%) and prostate (96%) cancers.
• The five-year RSRs are lowest for pancreatic (8%),
esophageal (14%) and lung (17%) cancers.
• For most of the cancers examined, the five-year RSRs
tend to be higher among females.
Other time periods commonly used to measure
relative survival include 1, 3 and 10 years. For
colorectal and lung cancers, RSRs demonstrate a
general pattern of substantial decline in the first year
after diagnosis (one-year RSR), a more gradual fall
over the next two years (three-year RSR) and then
smaller declines over the intervals from 3 to 5 years
and to 10 years (Figure 5.1).
• Cancer cases in Newfoundland and Labrador may be
under-reported due to incomplete linkage of cancer
incidence data with death data. Such underreporting is likely to result in overestimation of
survival because these missed cases tend to have less
favourable survival. Consequently, survival ratios for
Newfoundland and Labrador are not shown.
• Territorial estimates are not presented because there
were too few new cancer cases to calculate reliable
• RSRs for Prince Edward Island are imprecise because
of the relatively small number of cancer cases.
Despite these constraints, several patterns are worth
mentioning:
• The highest RSRs for prostate cancer are in Ontario
(97%), New Brunswick (95%) and Nova Scotia
(95%). The lowest RSRs for prostate cancer are in
Manitoba (90%), Saskatchewan (91%) and Alberta
(92%).
• There is little provincial variation in RSRs for breast
cancer.
• The RSRs for colorectal cancer range from 61% in
several provinces to 67% in Ontario.
FIGURE 5.1 One, three, five and ten-year relative survival ratios (RSR) for the most common cancers, Canada (excluding Quebec*), 2006–2008
100
Survival by sex
90
80
98
97
96
95
97
100
90
92
88
83
82
70
80
70
70
RSR (%)
Table 5.1 shows that the five-year RSR differed by more
than five percentage points for four of the cancers
examined. In all four cancer types, relative survival was
better for females than for males: melanoma (92% vs.
85%), breast (88% vs. 80%), oral (68% vs. 61%) and
lung (20% vs. 14%).
estimates. Territorial cases are, however, included in
the estimates for all of Canada.
65
60
61
50
40
50
40
40
30
30
20
20
22
17
10
0
60
13
1
3
5
10
10
0
Prostate
Female breast
Colorectal
Lung
*Data from Quebec were
excluded, in part, because its
method for ascertaining the
date of cancer diagnosis
differs from the method used
by other provinces and
territories and because of
issues in correctly
ascertaining the vital status
of cases.
Note: These data are based
on people aged 15–99 years
at diagnosis.
Relative survival period (years)
Analysis by: Health Statistics Division, Statistics Canada
Data sources: Canadian Cancer Registry and Canadian Vital Statistics Death databases and life tables at Statistics Canada
Canadian Cancer Society
n
Canadian Cancer Statistics 2013
57
CHAPTER 5: Relative survival: What is the likelihood of surviving cancer?
• The RSRs for lung cancer range from a low of 15% in
Alberta and Nova Scotia to a high of 21% in
Manitoba.
The variation across provinces may be related to
differences in the following factors:
• the availability and patterns of use of screening, early
detection and diagnostic services that affect how
early cancer is diagnosed
• the availability of and access to specialized cancer
treatments
• population attributes (such as socio-economic status
and lifestyle factors) that affect survival
• provincial resources available to ensure registration
of all cancers and up-to-date vital status information
on registered cases.
Age-standardized relative survival ratio
(RSR)
The RSR that would have occurred if the age
distribution of the group of people with cancer under
study had been the same as that of the standard
population (i.e., all people diagnosed with that cancer
in Canada between 1992 and 2001).
Canadian Cancer Society
n
Canadian Cancer Statistics 2013
Survival by age at diagnosis
Trends over time
Relative survival is generally poorer among those
diagnosed with cancer at an older age. Poorer survival
among older people may be because they receive less
therapy due to the presence of other diseases or
conditions that reduce the body’s ability to tolerate and
respond to cancer treatments. Older people may also
receive less aggressive treatment, independent of any
other conditions, due to their advanced age.(3)
Age-standardized RSRs are used to examine changes in
relative survival over time. Figure 5.2 shows that there
has been substantial improvement in the agestandardized five-year RSRs for selected cancers
diagnosed between 1992 to 1994 and 2006 to 2008.
Table 5.3 shows the five-year RSRs for the four most
common cancers by age group.
• RSRs for prostate cancer are consistently high
(>95%) among males diagnosed between the ages of
40 and 79 years, but the RSR is lower in males aged
80–99 years.
• The highest RSRs for breast cancer (88%–90%) are
among people diagnosed between the ages of 40 and
79 years. Lower RSRs are seen for people at both
younger (85%) and older (80%) ages.
• RSRs for colorectal cancer are consistent at 68%
among people diagnosed between the ages of 15 and
69 years, but the RSR is lower in people aged 70–99
years.
• For lung cancer, the RSR decreases with advancing
age. People aged 15–39 years at diagnosis have the
highest RSR at 45%, while people aged 80–99 years
have the lowest RSR at 10%.
• The RSR for all cancers combined has risen by seven
percentage points to 63% in 2006 to 2008 from 56%
in 1992 to 1994.
• The largest increases between the two time periods
are seen for non-Hodgkin lymphoma (16 percentage
points) and leukemia (14 percentage points).
• A few factors have contributed to the increased
relative survival for non-Hodgkin lymphoma. First is
the advance in therapy, particularly the introduction
of antibody therapy with rituximab. Second is the
recent decrease in the number of cases of nonHodgkin lymphoma related to human
immunodeficiency virus (HIV). The lower number
of cases related to HIV is a consequence of improved
treatment, specifically with highly active
antiretroviral therapy (HAART) developed in the
late 1990s.(4)
• The improvement in age-standardized RSR for
leukemia can be explained by multiple incremental
improvements in care. These improvements include
better and more specific diagnosis, advances in and
extension of the use of stem cell transplantation and
high-dose therapy, as well as improved supportive
care.(5) In 1960, the overall five-year relative survival
ratio for all leukemias was about 14%, while in 2006
to 2008 it was 58%.(5)
58
CHAPTER 5: Relative survival: What is the likelihood of surviving cancer?
• Age-standardized RSRs for prostate and colorectal
cancers each increased by nine percentage points.
Survival improvements in prostate and colorectal
cancers are due to increased use of screening and
early detection that have helped identify cancers at a
treatable stage.
• There has been little change (about one percentage
point) for cancers of the bladder and body of uterus
between 1992 to 1994 and 2006 to 2008.
Five-year conditional relative survival
Conditional relative survival is a useful measure for
predicting survival based on past survival. The
five-year conditional RSR for people with cancer who
have already survived 1–3 years after their diagnosis is
often more meaningful for clinical management and
prognosis than the five-year RSR measured from the
date of diagnosis. Since the risk of death due to cancer
is often greatest in the first few years after diagnosis,
prognosis can substantially improve among people
surviving one or more years. Thus, the five-year RSR
measured at diagnosis no longer applies.(6,7)
Table 5.4 presents five-year RSRs estimated from the
date of cancer diagnosis and five-year conditional RSRs
calculated using people who have survived the first,
second, third, fourth and fifth year after a cancer
diagnosis. Five-year conditional RSRs demonstrate
that the survival experience of people diagnosed with
cancer generally improves with time since diagnosis.
Conditional relative survival
The likelihood a person will survive an additional
number of years (i.e., 5 years) once he or she has
already survived a fixed number of years since
diagnosis, compared to the expected survival of
people with similar characteristics (age, sex and area
of residence) in the general population.
Canadian Cancer Society
n
Canadian Cancer Statistics 2013
FIGURE 5.2 Age-standardized five-year relative survival ratio (RSR) for selected cancers, both sexes combined, Canada (excluding Quebec*),
2006–2008 versus 1992–1994
All cancers
2006–08
63
56
1992–94
Thyroid
98
93
Prostate
95
86
Melanoma
85
Breast
82
89
88
84
83
Body of uterus
Excludes data from Ontario,
which does not report in situ
bladder cancers.
†
74
75
Bladder†
Kidney
Colorectal
65
56
Non-Hodgkin
lymphoma
67
51
Leukemia
44
Lung
14
Pancreas
5
0
Note: These data are based
on people aged 15–99 years
at diagnosis and exclude
non-melanoma skin cancers
and adolescent (aged 15–19
years) bone cancers, which are
dissimilar to those diagnosed
in older adults. Since estimates
are rounded to the nearest
whole percent, confidence
limits may be the same as the
five-year relative survival ratio.
Error bars refer to 95%
confidence interval.
67
60
58
18
8
20
40
60
* Data from Quebec were
excluded, in part, because its
method for ascertaining the
date of cancer diagnosis differs
from the method used by other
provinces and territories and
because of issues in correctly
ascertaining the vital status
of cases.
80
100
Five-year relative survival ratio (%)
Analysis by: Health Statistics Division, Statistics Canada
Data sources: Canadian Cancer Registry and Canadian Vital Statistics Death databases and life tables at Statistics Canada
• The five-year RSR for all cancers combined increased
from 63% when measured from the date of diagnosis
to 81% when measured among those who survived
the first year after a cancer diagnosis.
• Each additional year survived resulted in further,
although less dramatic, increases in the five-year
conditional RSR.
• The impact of time survived on the five-year
conditional RSR varied by type of cancer. Cancers
with low initial five-year RSRs (such as stomach,
brain, liver, lung, esophagus and pancreas cancers)
showed the most dramatic increases in five-year
conditional RSRs.
59
CHAPTER 5: Relative survival: What is the likelihood of surviving cancer?
• Conversely, since the potential for improvement is
limited for cancers that have an excellent prognosis
at diagnosis, cancers with high initial five-year RSRs
(such as thyroid, testicular, prostate, melanoma and
breast cancers) showed little improvement in
five-year conditional RSRs.
What do these statistics mean?
People diagnosed with cancer today have a better
chance of surviving the next five years after their
diagnosis than they did just over a decade ago. Despite
this improvement in survival, some cancers continue
to have lower RSRs than others because of the
aggressiveness of the disease, the late stage at which
they tend to be diagnosed or because of the lack of
effective treatment options.
Among the most common cancers, there is variation in
age-standardized five-year RSRs across provinces for
prostate, lung and colorectal cancers, while there is
little provincial variation for breast cancer. These
differences in five-year RSRs across geographic regions
and types of cancer help point to areas where greater
effort is required to detect, diagnose and treat cancer at
an early stage, or where more research is needed to
develop better treatments. Cancer stage at diagnosis is
an important prognostic indicator that is available for
the most common cancers from most provincial
cancer registries. It is anticipated that cancer stage at
diagnosis and its impact on survival will be reported in
this publication in future years.
For more information
Publications
• Ellison LF. Measuring the effect of including multiple cancers
in survival analyses using data from the Canadian Cancer
Registry. Cancer Epidemiology. 2010;34(5):550–5.
• Ellison LF, Gibbons L. Survival from cancer — Up-to-date
predictions using period analysis. Health Reports.
2006;17:19–30.
• Ellison LF, Pogany L, Mery LS. Childhood and adolescent
cancer survival: A period analysis of data from the Canadian
Cancer Registry. European Journal of Cancer.
2007;43(13):1967–75.
• Ellison LF, Wilkins K. An update on cancer survival. Health
Reports. 2010;21(3):55–60.
• Statistics Canada. Cancer Survival Statistics (Catalogue
82-226-x). Ottawa: Minister of Industry; 2012.
Databases
• Statistics Canada. Table 103-1559 — Five-year survival
estimates for all primary sites of cancer combined, ICD-O-3
(October 2011 CCR file), by age group and sex, population
aged 15 to 99, 1 year of cases, Canada (excluding Quebec),
annual (percent), 1992 to 2003, CANSIM (database).
• Statistics Canada. Table 103-1560 — Five-year survival
estimates for all primary sites of cancer combined, ICD-O-3
(October 2011 CCR file), by age group and sex, population
aged 15 to 99, 3 years of cases, Canada (excluding Quebec),
annual (percent), 1992/1994 to 2001/2003, CANSIM
(database).
• Statistics Canada. Table 103-1574 — Five-year survival
estimates for primary sites of cancer, ICD-O-3 (October 2011
CCR file), by sex, population aged 15 to 99, 3 years of cases,
selected provinces, annual (percent), 1992/1994 to
2001/2003, CANSIM (database).
• Statistics Canada. Table 103-1571 — Age-standardized
five-year survival estimates for primary sites of cancer,
ICD-O-3 (October 2011 CCR file), by sex, 1 year of cases,
Canada and selected provinces, annual (percent), 1992 to
2003, CANSIM (database).
• Statistics Canada. Table 103-1572 — Age-standardized
five-year survival estimates for primary sites of cancer,
ICD-O-3 (October 2011 CCR file), by sex, 3 years of cases,
Canada and selected provinces, annual (percent), 1992/1994
to 2001/2003, CANSIM (database).
References
1. Dickman PW, Adami HO. Interpreting trends in cancer patient survival. Journal of Internal
Medicine. 2006;260(2):103–17.
2. Black RJ, Sankaranarayanan R, Parkin DM. Interpretation of population-based cancer
survival data. IARC Scientific Publications. 1998;145:13–7.
3. Brenner H, Arndt V. Recent increase in cancer survival according to age: Higher survival
in all age groups, but widening age gradient. Cancer Causes & Control. 2004;15(9):
903–10.
4. Pulte D, Gondos A, Brenner H. Ongoing improvement in outcomes for patients diagnosed
as having Non-Hodgkin lymphoma from the 1990s to the early 21st century. Archives of
Internal Medicine. 2008;168(5):469–76.
5. Pulte D, Gondos A, Brenner H. Improvements in survival of adults diagnosed with acute
myeloblastic leukemia in the early 21st century. Haematologica. 2008;93(4):594–600.
6. Wang SJ, Emery R, Fuller CD, Kim JS, Sittig DF, Thomas CR. Conditional survival in gastric
cancer: a SEER database analysis. Gastric Cancer. 2007; 10(3):153–8.
7. Ellison LF, Bryant H, Lockwood G, Shack L. Conditional survival analyses across cancer
sites. Health Reports. 2011; 22(2):1–5.
• Statistics Canada. Table 103-1573 — Five-year survival
estimates for primary sites of cancer, ICD-O-3 (October 2011
CCR file), by sex, population aged 15 to 99, 1 year of cases,
selected provinces, annual (percent), 1992 to 2003, CANSIM
(database).
Canadian Cancer Society
n
Canadian Cancer Statistics 2013
60
CHAPTER 5: Relative survival: What is the likelihood of surviving cancer?
TABLE 5.1 Five-year relative survival ratios (RSRs) and observed survival for selected cancers by sex, Canada (excluding Quebec*), 2006–2008
Relative survival ratio (%) (95% CI)
All cancers
Thyroid
Testis
Prostate
Melanoma
Breast
Hodgkin lymphoma
Body of uterus
Bladder†
Cervix
Kidney
Non-Hodgkin lymphoma
Colorectal
Larynx
Oral
Leukemia
Ovary
Multiple myeloma
Stomach
Brain
Liver
Lung
Esophagus
Pancreas
Observed survival (%) (95% CI)
Both sexes
Males
Females
Both sexes
Males
Females
63 (63–64)
98 (98–99)
—
—
89 (88–89)
88 (88–88)
85 (83–87)
—
74 (72–75)
—
68 (67–69)
67 (66–67)
65 (64–65)
63 (61–66)
63 (62–64)
59 (58–60)
—
43 (41–44)
25 (24–26)
25 (24–27)
20 (18–22)
17 (17–17)
14 (13–15)
8 (7–8)
63 (62–63)
96 (94–97)
97 (96–98)
96 (96–96)
85 (84–86)
80 (74–86)
83 (81–85)
—
74 (73–76)
—
67 (65–68)
65 (64–66)
64 (63–65)
63 (61–66)
61 (60–63)
59 (58–61)
—
44 (42–47)
23 (22–24)
23 (22–25)
20 (18–22)
14 (14–15)
13 (12–15)
8 (7–9)
64 (64–64)
99 (99–100)
—
—
92 (91–93)
88 (88–88)
87 (85–90)
85 (84–86)
72 (69–74)
74 (72–75)
69 (67–71)
69 (67–70)
65 (64–66)
64 (58–69)
68 (66–70)
59 (57–61)
45 (44–46)
41 (38–43)
28 (27–30)
28 (26–30)
19 (16–22)
20 (19–21)
15 (13–18)
8 (7–9)
56 (55–56)
95 (95–96)
—
—
80 (79–80)
80 (80–81)
83 (81–84)
—
60 (59–61)
—
60 (59–61)
59 (58–60)
54 (54–55)
55 (53–57)
57 (55–58)
51 (50–52)
—
37 (35–38)
21 (20–22)
24 (23–26)
18 (17–19)
15 (15–15)
12 (11–13)
7 (6–7)
54 (53–54)
90 (89–92)
95 (94–96)
81 (81–82)
75 (74–76)
66 (62–71)
80 (78–83)
—
60 (58–61)
—
59 (58–60)
57 (56–58)
53 (53–54)
54 (52–57)
55 (53–56)
51 (50–52)
—
38 (36–40)
19 (18–20)
22 (21–24)
18 (17–20)
12 (12–13)
12 (10–13)
7 (6–8)
58 (58–58)
96 (96–97)
—
—
85 (84–86)
80 (80–81)
85 (83–87)
78 (77–79)
61 (59–63)
71 (70–73)
62 (61–64)
62 (60–63)
55 (54–56)
57 (52–61)
60 (59–62)
52 (50–53)
42 (41–43)
36 (33–38)
25 (23–26)
27 (25–29)
17 (15–20)
18 (17–18)
13 (11–15)
7 (6–8)
CI=confidence interval
— Not applicable.
* Data from Quebec were excluded, in part, because the method for
ascertaining the date of cancer diagnosis differs from the method
used by other provinces and territories and because of issues in
correctly ascertaining the vital status of cases.
Excludes data from Ontario, which does not currently report in situ
bladder cancers.
†
Note: These data are based on people aged 15–99 years at
diagnosis and exclude non-melanoma skin cancers and adolescent
(aged 15–19 years) bone cancers, which are dissimilar to those
diagnosed in older adults.
Analysis by: Health Statistics Division, Statistics Canada
Data sources: Canadian Cancer Registry and Canadian Vital Statistics Death databases and life tables at Statistics Canada
Canadian Cancer Society
n
Canadian Cancer Statistics 2013
61
CHAPTER 5: Relative survival: What is the likelihood of surviving cancer?
TABLE 5.2 Age-standardized five-year relative survival ratios (RSRs) for the most common cancers by province, Canada (excluding Quebec*),
2006–2008
Relative survival ratio (%) (95% CI)
Province
Canada*
British Columbia (BC)
Alberta (AB)
Saskatchewan (SK)
Manitoba (MB)
Ontario (ON)
New Brunswick (NB)
Nova Scotia (NS)
Prince Edward Island (PE)
Prostate
Breast
Colorectal
Lung
95 (95–95)
93 (92–94)
92 (90–93)
91 (89–92)
90 (88–92)
97 (97–98)
95 (92–97)
95 (93–97)
93 (88–97)
88 (87–88)
88 (87–89)
86 (85–87)
86 (85–88)
85 (83–87)
89 (88–89)
89 (87–91)
88 (86–89)
86 (81–90)
65 (64–65)
62 (60–63)
62 (60–64)
61 (59–64)
61 (58–63)
67 (67–68)
62 (59–65)
61 (59–63)
61 (55–67)
18 (17–18)
16 (15–17)
15 (14–16)
16 (14–18)
21 (19–23)
19 (19-20)
17 (15–18)
15 (13–16)
—
CI=confidence interval
— Estimate not shown due to small number of cases.
* Data from Quebec were excluded, in part, because the method for
ascertaining the date of cancer diagnosis differs from the method
used by other provinces and territories and because of issues in
correctly ascertaining the vital status of cases.
Note: These data are based on people aged 15–99 years at
diagnosis. Survival ratios for Newfoundland and Labrador are not
shown as they are artefactually high.
Analysis by: Health Statistics Division, Statistics Canada
Data sources: Canadian Cancer Registry and Canadian Vital Statistics Death databases and life tables at Statistics Canada
TABLE 5.3 Five-year relative survival ratios (RSRs) for the most common cancers by age group, Canada (excluding Quebec*), 2006–2008
Relative survival ratio (%) (95% CI)
Prostate
Breast
Colorectal
Lung
15–39
40–49
50–59
60–69
70–79
80–99
—
85 (84–87)
68 (64–71)
45 (39–51)
96 (94–97)
90 (89–90)
68 (67–70)
23 (21–25)
98 (97–98)
89 (88–90)
68 (67–69)
21 (20–22)
99 (98–99)
90 (90–91)
68 (67–69)
19 (18–20)
96 (96–97)
88 (87–89)
65 (64–66)
16 (15–17)
82 (80–84)
80 (78–82)
57 (56–59)
10 (10–11)
CI=confidence interval
— Estimate not shown due to small number of cases.
* Data from Quebec were excluded, in part, because the method for
ascertaining the date of cancer diagnosis differs from the method
used by other provinces and territories and because of issues in
correctly ascertaining the vital status of cases.
Analysis by: Health Statistics Division, Statistics Canada
Data sources: Canadian Cancer Registry and Canadian Vital Statistics Death databases and life tables at Statistics Canada
Canadian Cancer Society
n
Canadian Cancer Statistics 2013
62
CHAPTER 5: Relative survival: What is the likelihood of surviving cancer?
TABLE 5.4 Five-year relative survival ratios (RSRs), conditional on having survived the specified number of years, for selected cancers, Canada
(excluding Quebec*), 2006–2008
Conditional RSR (%) (95%CI)
All cancers
Thyroid
Testis
Prostate
Melanoma
Breast
Hodgkin lymphoma
Body of uterus
Bladder†
Cervix
Kidney
Non-Hodgkin lymphoma
Colorectal
Larynx
Oral
Leukemia
Ovary
Multiple myeloma
Stomach
Brain
Liver
Lung
Esophagus
Pancreas
0
1
2
3
4
5
63 (63–64)
98 (98–99)
97 (96–98)
96 (96–96)
89 (88–89)
88 (88–88)
85 (83–87)
85 (84–86)
74 (72–75)
74 (72–75)
68 (67–69)
67 (66–67)
65 (64–65)
63 (61–66)
63 (62–64)
59 (58–60)
45 (44–46)
43 (41–44)
25 (24–26)
25 (24–27)
20 (18–22)
17 (17–17)
14 (13–15)
8 (7–8)
81 (81–81)
100 (100–100)
98 (97–99)
97 (97–98)
91 (91–92)
89 (89–90)
93 (91–94)
91 (90–91)
82 (81–83)
82 (81–83)
82 (81–83)
82 (81–83)
77 (76–77)
71 (69–74)
75 (74–76)
80 (78–81)
57 (55–58)
52 (50–54)
51 (49–53)
49 (47–51)
42 (39–45)
39 (38–40)
34 (31–36)
30 (28–33)
87 (87–87)
100 (100–101)
99 (99–100)
98 (98–99)
93 (92–94)
91 (90–91)
95 (93–96)
94 (94–95)
86 (84–87)
88 (87–90)
87 (86–88)
85(84–86)
83 (82–84)
77 (75–80)
83 (81–84)
83 (82–85)
65 (63–67)
54 (52–56)
72 (69–74)
65 (63–67)
55 (51–59)
56 (55–57)
55 (50–59)
53 (49–57)
90 (90–90)
100 (99–100)
100 (99–100)
99 (98–99)
95 (94–96)
92 (91–92)
95 (93–96)
96 (96–97)
88 (87–90)
92 (91–93)
89 (88–91)
87 (86–88)
88 (88–89)
81 (78–83)
86 (85–87)
85 (83–86)
72 (70–74)
56 (53–58)
84 (81–86)
73 (70–75)
67 (62–71)
65 (64–67)
69 (64–74)
68 (63–72)
92 (92–93)
100 (99–100)
100 (99–100)
99 (98–99)
96 (95–97)
93 (93–93)
96 (94–97)
99 (98–99)
90 (88–91)
94 (93–95)
91 (90–93)
88 (87–89)
92 (91–93)
83 (80–85)
88 (86–89)
86 (84–87)
80 (78–82)
59 (56–62)
92 (89–94)
76 (74–79)
77 (72–82)
71 (69–72)
75 (70–81)
78 (73–83)
94 (94–94)
99 (99–100)
100 (99–101)
99 (98–99)
98 (97–99)
94 (94–94)
96 (95–97)
100 (99–100)
90 (89–92)
97 (96–98)
93 (92–94)
89 (88–90)
95 (94–96)
84 (81–87)
89 (88–91)
85 (83–87)
86 (84–88)
62 (58–65)
95 (92–98)
80 (77–82)
83 (78–88)
75 (74–76)
81 (75–86)
83 (77–88)
CI=confidence interval
* Data from Quebec were excluded, in part, because the method for
ascertaining the date of cancer diagnosis differs from the method
used by other provinces and territories and because of issues in
correctly ascertaining the vital status of cases.
Excludes data from Ontario, which does not currently report in situ
bladder cancers.
†
Note: These data are based on people aged 15–99 years at
diagnosis and exclude non-melanoma skin cancers and adolescent
(aged 15–19 years) bone cancers, which are dissimilar to those
diagnosed in older adults.
Analysis by: Health Statistics Division, Statistics Canada
Data sources: Canadian Cancer Registry and Canadian Vital Statistics Death databases and life tables at Statistics Canada
Canadian Cancer Society
n
Canadian Cancer Statistics 2013
63
CHAPTER 6:
Prevalence: How many people diagnosed with cancer are alive today?
Highlights
Introduction
• A substantial number of Canadians have been
diagnosed with cancer within the 10 years prior to
2009. There were 838,724 people diagnosed with
cancer alive at the beginning of 2009 (10-year
person-based prevalence). Among these people,
839,291 cancers were recorded (10-year tumourbased prevalence).
• Breast and prostate cancer accounted for 40% of the
10-year tumour-based prevalent cases.
• The 10-year tumour-based prevalence peaked among
males aged 70–79 years and females aged 60–69
years. This sex difference is due to the high
prevalence of prostate and breast cancers in each of
these age groups.
• The majority of 10-year tumour-based prevalent
cases were diagnosed in the previous five years,
which means that the individuals affected were either
undergoing treatment, recovering from its effects or
still dealing with the physical and emotional
consequences of cancer. This has significant
implications for the planning and development of
interdisciplinary healthcare services.
The ongoing rise in the annual number of new cancer
diagnoses (due to a growing and aging population),
combined with an improving survival rate for most
types of cancer, has meant that a substantial number of
people are living with and beyond their cancer
diagnosis. This prevalent population of people with
cancer and cancer survivors is likely to have unique
healthcare needs during the course of their cancer
journey. Thus, prevalence statistics are required to
estimate the needs for ongoing healthcare(1) and
support services that improve the quality of life for
people with cancer, cancer survivors and their families.
Canadian Cancer Society
n
Canadian Cancer Statistics 2013
Recent diagnoses of cancer (within the past two years)
include individuals who are either receiving primary
treatment or recovering from its effects. People
diagnosed in the more distant past (beyond two years)
have likely completed their treatment but may still
need clinical follow-up and supportive care.
Population-based cancer prevalence can be measured
by the total number of tumours or by the number of
individuals with cancer.
Prevalence
The number of people with a new or previous
cancer diagnosis in a given population who are
alive on a specific date (known as the index date).
Person-based estimates of prevalence are intuitively
easier to understand than tumour-based estimates,
although they may underestimate the true impact of
cancer because one person can have more than a single
diagnosis of a primary cancer.
It is also possible to examine limited-duration
prevalence. In limited-duration prevalence, tumour- or
person-based prevalence estimates are limited to,
respectively, cancers or persons diagnosed within a
specified period prior to the index date. Limitedduration prevalence is generally measured in two-,
five- or 10-year periods prior to an index date. This
publication uses these periods for limited-duration
prevalence.
• Tumour-based estimates refer to the number of
cancers diagnosed among individuals living with or
beyond cancer on a specified date (index date).
• Person-based estimates refer to the number of
individuals living with or beyond cancer on an index
date.
64
CHAPTER 6: Prevalence: How many people diagnosed with cancer are alive today?
Tumour-based prevalence
Among Canadians alive on January 1, 2009, close to
840,000 cancers had been diagnosed in the previous
10 years (Table 6.1). These cases can be analyzed
according to the type of cancer, the sex and age of the
person and the amount of time since diagnosis.
Prevalence by type of cancer
Figure 6.1 shows that prostate and breast cancers
together accounted for 40% of all 10-year prevalent
cancers. Other common cancers included colorectal
cancer (13% of all 10-year prevalent cases), lung cancer
(5%), melanoma (5%), non-Hodgkin lymphoma (4%)
and bladder cancer (4%).
Prevalence reflects both the frequency of occurrence
and prognosis for particular cancers. For example,
even though the colorectal cancer incidence rate is
lower than that of lung cancer, the colorectal 10-year
cancer prevalence is 2.7 times greater, reflecting the
poorer prognosis for lung cancer. Similarly, despite
having an average incidence rate compared to other
cancer types, melanoma represents 5% of all 10-year
prevalent cancer cases because of its high survival.
Canadian Cancer Society
n
Canadian Cancer Statistics 2013
FIGURE 6.1 Distribution of 10-year tumour-based prevalence for selected cancers, Canada*, January 1, 2009
All other
cancers
19.5%
Kidney 2.9%
Prostate
21.0%
Thyroid 3.7%
Breast
18.9%
Body of uterus 3.8%
Colorectal
12.5%
Bladder 4.1%
Non-Hodgkin lymphoma 4.3%
Melanoma 4.7%
* During the estimation process, cases from Quebec were excluded because
of issues in correctly ascertaining the vital status of cases. The presented
estimates, however, are for all of Canada, including Quebec. These
estimates assume that sex- and age-specific tumour-based prevalence
proportions in Quebec are similar to the rest of Canada. Estimates for lung
may be lower than in previous editions of this publication because of the
different method used to estimate Quebec’s prevalence. For further details,
see Appendix II: Data sources and methods.
Note: ”All other cancers” excludes non-melanoma skin cancers.
Lung 4.7%
Analysis by: Health Statistics Division, Statistics Canada
Data sources: Canadian Cancer Registry and Canadian Vital Statistics Death databases at Statistics Canada
Prevalence by sex
Prevalence by age
Table 6.1 shows that several types of cancer account for
similar proportions of 10-year tumour-based
prevalence in both sexes, including lung, colorectal,
non-Hodgkin lymphoma, melanoma, pancreas, brain,
multiple myeloma and Hodgkin lymphoma. On the
other hand, large differences were seen between the
sexes for other types of cancer, including bladder,
thyroid, oral, stomach, liver, esophagus and larynx.
These sex differences primarily result from differences
in cancer incidence rather than relative survival.
While the 10-year prevalence for all cancers peaked in
people aged 70–79 years for both sexes combined, it
peaked at a lower age group (60–69 years) for females
alone (Table 6.2). This difference is primarily due to
female breast cancer prevalence peaking in females
aged 60–69 years rather than in females aged 70–79
years. The other exception to this pattern is the
prevalence of colorectal cancer, which peaks in females
aged 80 years or older.
65
CHAPTER 6: Prevalence: How many people diagnosed with cancer are alive today?
Prevalence by duration
Of the 839,291 10-year prevalent cancer cases at the
beginning of 2009, 246,874 (29%) had been diagnosed
within the previous two years (2007 to 2008) and
272,183 (32%) had been diagnosed within the previous
two to five years. An additional 320,234 (38%) had
been diagnosed in the previous five to 10 years (Table
6.1). These data have implications for planning
healthcare and supportive services.
• Prevalent cases diagnosed in the past two years (2007
to 2008) include individuals likely to be currently
receiving or recovering from treatment for their cancer.
• Prevalent cases diagnosed between two and five
years ago (2004 to 2006) include individuals in the
third to fifth year after their diagnosis, a period that
typically requires close clinical follow-up for
recurrence and supportive care.
• Prevalent cases diagnosed between five and 10 years
ago (1999 to 2003) include individuals likely to have
completed their treatment, some of whom may
require clinical monitoring.
Figure 6.2 shows that the prevalence of certain types of
cancer depends on the length of the period considered.
For example:
• The prevalence of breast cancer and prostate cancer
rises with longer duration compared to other
common cancers, such as colorectal and lung
cancers.
• The poor prognosis for lung cancer cases means that
fewer individuals with this cancer are alive beyond
two years after diagnosis.
Person-based prevalence
Among Canadians alive on January 1, 2009, 838,724
had been diagnosed with cancer in the previous 10
years (Table 6.3). This number represents
approximately 1 in 40 Canadians or 2.5% of the
Canadian population (Table 6.4). More specifically, in
the 10 years prior to January 1, 2009 among those
alive:
• 1 in 94 males had been diagnosed with prostate
cancer.
• 1 in 107 females had been diagnosed with breast
cancer.
• 1 in 294 males and 1 in 348 females had been
diagnosed with colorectal cancer.
• 1 in 907 males and 1 in 813 females had been
diagnosed with lung cancer.
FIGURE 6.2 Tumour-based prevalence for the most common cancers by duration, Canada*, January 1, 2009
200,000
Number of prevalent cases
180,000
N=158,428
160,000
140,000
71,178
(40%)
120,000
67,743
(43%)
100,000
80,000
58,888
(33%)
60,000
0
N=105,194
37,975
(36%)
50,991
(32%)
40,000
20,000
0 to 2 years
>2 to 5 years
>5 to 10 years
N=176,361
34,609
(33%)
N=39,351
9,429 (24%)
11,167 (28%)
46,295
(26%)
39,694
(25%)
32,610
(31%)
18,755 (48%)
Prostate
Breast
Colorectal
Lung
*During the estimation process, cases from Quebec were excluded because of issues in correctly
ascertaining the vital status of cases. The presented estimates, however, are for all of Canada, including
Quebec. These estimates assume that sex- and age-specific tumour-based prevalence proportions in
Quebec are similar to the rest of Canada. Estimates for lung cancer may be lower than in previous
editions of this publication because of the different method used to estimate Quebec’s prevalence. For
further details, see Appendix II: Data sources and methods.
Note: N is the total number of prevalent tumour cases for each cancer type. In the legend, 0 to 2 years
refers to those diagnosed in 2007 and 2008; >2 to 5 years refers to those diagnosed between 2004 and
2006; >5 to 10 years refers to those diagnosed between 1999 and 2003.
Analysis by: Health Statistics Division, Statistics Canada
Data sources: Canadian Cancer Registry and Canadian Vital Statistics Death databases at Statistics Canada
Canadian Cancer Society
n
Canadian Cancer Statistics 2013
66
CHAPTER 6: Prevalence: How many people diagnosed with cancer are alive today?
Some of the individuals included in these numbers
were cancer free, while others were newly or recently
diagnosed and were undergoing treatment.
What do these statistics mean?
Knowing the prevalence of cancer is important for
estimating and planning healthcare services for cancer.
For example, those diagnosed with cancer within the
past two years have different needs than those
diagnosed between two and five, five and 10 or more
than 10 years ago.(1, 2)
Earlier chapters and other sources(3) have shown
ongoing increases in the number of newly diagnosed
cancer cases in Canada and increases in survival from
cancer.(4, 5) The combined result of these factors is a rise
in the number of people living with or beyond a cancer
diagnosis. Long after the need for cancer treatment has
passed, individuals may still require rehabilitation and
supportive care services to address the physical,
emotional and spiritual consequences of cancer. The
growing demand for such services and the increased
complexity of survivors’ health needs are just two
factors that need to be considered when planning and
developing interdisciplinary healthcare.
Canadian Cancer Society
n
Canadian Cancer Statistics 2013
For more information
Publications
• Ellison LF, Wilkins K. Cancer prevalence in the Canadian
population. Health Reports. 2009;20(1):7–19.
• Ellison LF, Wilkins K. Canadian trends in cancer prevalence.
Health Reports. 2012;23(1):7–16.
References
1. De Angelis R, Grande E, Inghelmann R, Francisci S, Micheli A, Baili P, et al. Cancer
prevalence estimates in Italy from 1970 to 2010. Tumori. 2007;93(4):392–7.
2. Micheli A, Mugno E, Krogh V, Quinn MJ, Coleman M, Hakulinen T, et al. Cancer prevalence
in European registry areas. Annals of Oncology : Official Journal of the European Society
for Medical Oncology / ESMO. 2002;13(6):840–65.
3. Statistics Canada.Table 103-0550 – New cases for ICD-O-3 primary sites of cancer
(based on the July 2011 CCR tabulation file), by age group and sex, Canada, provinces
and territories. CANSIM (database). Retrieved December 17, 2012, from http://www5.
statcan.gc.ca/cansim/a26?lang=eng&retrLang=eng&id=1030550&paSer=&pattern=&st
ByVal=1&p1=1&p2=-1&tabMode=dataTable&csid=.
4. Ellison LF, Wilkins K. An update on cancer survival. Health Rep. 2010;21(3):55–60.
5. Statistics Canada. Cancer Survival Statistics (Catalogue 82-226-x). Ottawa, ON: Minister
of Industry; 2012.
67
CHAPTER 6: Prevalence: How many people diagnosed with cancer are alive today?
TABLE 6.1 Tumour-based prevalence for selected cancers by duration and sex, Canada*, January 1, 2009
2-year (diagnosed since 2007)
All cancers
Prostate
Lung†
Breast
Colorectal
Non-Hodgkin lymphoma
Bladder†
Melanoma
Thyroid
Leukemia
Kidney
Body of uterus
Pancreas
Oral
Stomach
Brain
Ovary
Multiple myeloma
Liver
Esophagus
Cervix
Larynx†
Hodgkin lymphoma
Testis
5-year (diagnosed since 2004)
10-year (diagnosed since 1999)
Total
Males
Females
Total
Males
Females
Total
Males
Females
246,874
46,295
18,755
39,694
32,610
10,760
9,941
10,639
8,626
7,153
7,481
8,451
2,321
5,957
3,048
2,737
3,537
2,886
1,451
1,489
2,480
1,647
1,683
1,758
127,539
46,295
9,103
285
18,129
5,896
7,534
5,530
1,934
4,182
4,498
—
1,167
4,005
1,955
1,580
—
1,562
1,079
1,131
—
1,371
900
1,758
119,335
—
9,652
39,409
14,481
4,864
2,407
5,109
6,692
2,971
2,983
8,451
1,154
1,952
1,093
1,157
3,537
1,324
372
358
2,480
276
783
—
519,057
105,183
29,922
90,685
67,219
23,144
21,127
23,362
19,243
14,620
15,198
18,541
3,138
12,148
5,170
4,788
7,028
5,617
2,298
2,166
5,501
3,415
3,904
4,212
265,665
105,183
14,169
636
36,860
12,440
15,947
11,984
4,122
8,502
9,203
—
1,561
8,068
3,247
2,679
—
3,111
1,723
1,612
—
2,829
2,099
4,212
253,392
—
15,753
90,049
30,359
10,704
5,180
11,378
15,121
6,118
5,995
18,541
1,577
4,080
1,923
2,109
7,028
2,506
575
554
5,501
586
1,805
—
839,291
176,361
39,351
158,428
105,194
36,222
34,259
39,494
30,926
22,514
24,176
31,611
3,754
19,511
7,419
7,382
10,695
7,461
2,985
2,742
10,201
5,577
7,161
7,936
422,914
176,361
18,433
1,048
56,648
19,140
25,651
19,895
6,517
13,044
14,434
—
1,846
12,836
4,626
4,013
—
4,103
2,242
2,034
—
4,623
3,890
7,936
416,377
—
20,918
157,380
48,546
17,082
8,608
19,599
24,409
9,470
9,742
31,611
1,908
6,675
2,793
3,369
10,695
3,358
743
708
10,201
954
3,271
—
— Not applicable.
* During the estimation process, cases from Quebec were excluded because
of issues in correctly ascertaining the vital status of cases. The presented
estimates, however, are for all of Canada, including Quebec. These
estimates assume that sex- and age-specific tumour-based prevalence
proportions in Quebec are similar to the rest of Canada.
Prevalence estimates for lung, bladder and larynx cancers may be lower
than in previous editions of this publication because a different method
was used to estimate Quebec’s prevalence. For further details, see
Appendix II: Data sources and methods.
†
Analysis by: Health Statistics Division, Statistics Canada
Data sources: Canadian Cancer Registry and Canadian Vital Statistics Death databases at Statistics Canada
Canadian Cancer Society
n
Canadian Cancer Statistics 2013
68
CHAPTER 6: Prevalence: How many people diagnosed with cancer are alive today?
TABLE 6.2 Age distribution for 10-year tumour-based prevalence for the most common cancers by sex, Canada*, January 1, 2009
All cancers
Age (years)
0–19
20–29
30–39
40–49
50–59
60–69
70–79
80+
Lung†
Prostate
Breast
Total
N=839,291
Males
N=422,914
Females
N=416,377
Total
N=39,351
Males
N=18,433
Females
N=20,918
Total
N=105,194
Males
N=56,648
Females
N=48,546
Males
N=176,361
Females
N=157,380
%
%
%
%
%
%
%
%
%
%
%
0.9
1.3
3.0
8.0
17.1
25.9
26.3
17.4
1.0
1.2
2.2
5.0
13.9
27.8
31.4
17.7
0.8
1.3
3.9
11.1
20.5
24.0
21.2
17.2
0.1
0.2
0.5
3.3
13.8
29.7
33.7
18.6
0.1
0.2
0.5
2.7
12.0
30.1
35.7
18.8
0.1
0.2
0.6
3.9
15.5
29.4
31.9
18.4
0.0
0.2
0.8
4.1
13.1
24.4
30.7
26.6
0.0
0.2
0.8
3.9
13.5
27.0
32.6
21.8
0.0
0.2
0.9
4.3
12.6
21.4
28.4
32.1
0.0
0.0
0.0
0.7
10.2
31.8
38.5
18.8
0.0
0.2
2.0
11.9
24.3
26.1
20.4
15.2
Analysis by: Health Statistics Division, Statistics Canada
Data sources: Canadian Cancer Registry and Canadian Vital Statistics Death databases at Statistics Canada
Canadian Cancer Society
n
Canadian Cancer Statistics 2013
Colorectal
N is the total number of prevalent tumour cases for each
cancer type by sex.
* During the estimation process, cases from Quebec were
excluded because of issues in correctly ascertaining the
vital status of cases. The presented estimates, however, are
for all of Canada, including Quebec. These estimates
assume that sex- and age-specific tumour-based
prevalence proportions in Quebec are similar to the rest of
Canada.
Prevalence estimates for lung cancer may be lower than
in previous editions of this publication because a different
method was used to estimate Quebec’s prevalence. For
further details, see Appendix II: Data sources and methods.
†
Note: Due to rounding, columns may not total 100%.
69
CHAPTER 6: Prevalence: How many people diagnosed with cancer are alive today?
TABLE 6.3 Person-based prevalence for selected cancers by duration and sex, Canada*, January 1, 2009
2-year (diagnosed since 2007)
All cancers
Prostate
Lung†
Breast
Colorectal
Non-Hodgkin lymphoma
Bladder
Melanoma
Thyroid
Leukemia
Kidney
Body of uterus
Pancreas
Oral
Stomach
Brain
Ovary
Multiple myeloma
Liver
Esophagus
Cervix
Larynx
Hodgkin lymphoma
Testis
5-year (diagnosed since 2004)
10-year (diagnosed since 1999)
Total
Males
Females
Total
Males
Females
Total
Males
Females
246,700
46,293
18,681
39,693
32,592
10,722
9,938
10,639
8,608
7,152
7,478
8,449
2,321
5,953
3,045
2,737
3,534
2,883
1,451
1,489
2,480
1,647
1,683
1,758
127,448
46,293
9,067
285
18,119
5,873
7,531
5,530
1,928
4,181
4,495
—
1,167
4,002
1,954
1,580
—
1,561
1,079
1,131
—
1,371
900
1,758
119,252
—
9,614
39,408
14,473
4,849
2,407
5,109
6,680
2,971
2,983
8,449
1,154
1,951
1,091
1,157
3,534
1,322
372
358
2,480
276
783
—
518,705
105,179
29,780
90,677
67,173
23,097
21,118
23,362
19,186
14,618
15,193
18,537
3,138
12,140
5,166
4,788
7,025
5,614
2,298
2,166
5,495
3,415
3,904
4,212
265,500
105,179
14,108
636
36,829
12,412
15,939
11,984
4,104
8,500
9,199
—
1,561
8,065
3,244
2,679
—
3,109
1,723
1,612
—
2,829
2,099
4,212
253,205
—
15,672
90,041
30,344
10,685
5,179
11,378
15,082
6,118
5,994
18,537
1,577
4,075
1,922
2,109
7,025
2,505
575
554
5,495
586
1,805
—
838,724
176,353
39,114
158,407
105,117
36,173
34,245
39,494
30,845
22,512
24,164
31,603
3,754
19,490
7,415
7,382
10,690
7,458
2,985
2,742
10,190
5,577
7,161
7,936
422,670
176,353
18,335
1,048
56,600
19,111
25,639
19,895
6,498
13,042
14,423
—
1,846
12,829
4,623
4,013
—
4,101
2,242
2,034
—
4,623
3,890
7,936
416,054
—
20,779
157,359
48,517
17,062
8,606
19,599
24,347
9,470
9,741
31,603
1,908
6,661
2,792
3,369
10,690
3,357
743
708
10,190
954
3,271
—
— Not applicable.
* During the estimation process, cases from Quebec were excluded because
of issues in correctly ascertaining the vital status of cases. The presented
estimates, however, are for all of Canada, including Quebec. These
estimates assume that sex- and age-specific person-based prevalence
proportions in Quebec are similar to the rest of Canada.
Prevalence estimates for lung cancer may be lower than previous editions
of this publication because a different method was used to estimate
Quebec’s prevalence. For further details, see Appendix II: Data sources and
methods.
†
Analysis by: Health Statistics Division, Statistics Canada
Data sources: Canadian Cancer Registry and Canadian Vital Statistics Death databases at Statistics Canada
Canadian Cancer Society
n
Canadian Cancer Statistics 2013
70
CHAPTER 6: Prevalence: How many people diagnosed with cancer are alive today?
TABLE 6.4 Ten-year person-based prevalence proportions for the most common cancers by sex, Canada*, January 1, 2009
Percentage of Canadian population
All cancers
Prostate
Lung†
Female breast
Colorectal
— Not applicable.
One in:
Total
Males
Females
Total
Males
Females
2.5
—
0.1
—
0.3
2.5
1.1
0.1
—
0.3
2.5
—
0.1
0.9
0.3
40
—
857
—
319
39
94
907
—
294
41
—
813
107
348
* During the estimation process, cases from Quebec were excluded because
of issues in correctly ascertaining the vital status of cases. The presented
estimates, however, are for all of Canada, including Quebec. These
estimates assume that sex- and age-specific person-based prevalence
proportions in Quebec are similar to the rest of Canada.
“One in:” estimates for lung cancer indicate a lower prevalence
proportion for males than in previous editions of this publication because a
different method was used to estimate Quebec’s prevalence. For further
details, see Appendix II: Data sources and methods.
†
Analysis by: Health Statistics Division, Statistics Canada
Data sources: Canadian Cancer Registry and Canadian Vital Statistics Death databases and Population and Demography Branch at Statistics Canada
Canadian Cancer Society
n
Canadian Cancer Statistics 2013
71
CHAPTER 7:
Special topic: Liver cancer
Led by members of the
Canadian Cancer Statistics Advisory Committee:
Dr Prithwish De, Canadian Cancer Society, Toronto
Dr Hannah K. Weir, Centers for Disease Control and Prevention, Atlanta
Dr Dianne Zakaria, Statistics Canada, Ottawa
with contributions from:
Dr Morris Sherman, Toronto General Hospital, Toronto
Dr Hla-Hla Thein, Dalla Lana School of Public Health,
University of Toronto, Toronto
reviewed by:
Dr Sean Cleary, Toronto General Hospital, Toronto
Dr Dagny Dryer, PEI Cancer Treatment Centre, Charlottetown
Ms Judy Heck, Canadian Cancer Society, Regina
Dr Mayoni Ranasinghe, Canadian Cancer Society, Toronto
Statistics at a glance
Incidence (estimates for 2013)
Males
Females
Number of new cases
Age-standardized rates (per 100,000)
% of all cancers
1,550
6.9
1.6
490
1.9
0.5
780
3.5
2.0
240
0.9
0.7
20
19
2,242
743
11,200
3,500
Mortality (estimates for 2013)
Number of deaths
Age-standardized rates (per 100,000)
% of all cancers
Survival (2006–2008)
Five-year relative survival (%)
Prevalence
10-year person-based prevalence
(as of Jan 1, 2009)
Potential years of life lost (2009)
Number of years of life lost
Note: Rates are age-standardized to the 1991 Canadian population.
Canadian Cancer Society
n
Canadian Cancer Statistics 2013
Highlights
• Liver cancer is one of the fastest rising cancers in
Canada. In 2013, over 2,000 Canadians are expected
to develop primary liver cancer and about 1,000 will
die of this disease.
• Between 1970 and 2007, the incidence rate of liver
cancer in Canadian males increased by an average of
3.6% per year. In Canadian females, the rate
increased by 2.6% per year between 1986 and 2007.
• The main subtype of liver cancer is hepatocellular
carcinoma (HCC).
• The predominant risk factor for liver cancer in
Canada is chronic viral hepatitis infection with
hepatitis B virus (HBV) or hepatitis C virus (HCV).
Alcohol abuse, obesity, diabetes and smoking are
also associated with a higher risk and may play an
increasingly important role in the growing incidence
of liver cancer in Canada.
• The five-year relative survival ratio (RSR) for
primary liver cancer is 20%.
• As of January 1, 2009, it is estimated that there were
2,985 Canadians (2,242 males and 743 females) who
had been diagnosed with primary liver cancer in the
previous 10 years and were still alive on that date.
• Liver cancer is associated with high costs for
treatment and managing the disease presents both
clinical and financial challenges.
• Several measures can be taken to reduce liver cancer
risk, including:
preventing infection with HBV and HCV,
reducing alcohol intake, and avoiding obesity and
smoking
identifying and treating cirrhosis and chronic
infection with HBV or HCV
implementing public education about risk
reduction and who should be screened, as well as
removing stigma from screening
educating healthcare providers about who to
screen, screening protocols and how to test and
treat the disease
n
n
n
Epidemiology of liver cancer
In 2013, over 2,000 Canadians are expected to develop
primary liver cancer and about 1,000 will die of this
disease. While it remains relatively uncommon
(accounting for an estimated 1% of all new cancer
diagnoses and deaths in 2013), the morbidity and
mortality associated with liver cancer have been rising
in Canada. In 2009, premature death from liver cancer
caused 14,700 potential years of life lost (PYLL), which
represented 1.3% (2.1% in males and 0.6% in females)
of all PYLL due to cancer in Canada.
Potential years of life lost (PYLL)
An estimate of the number of years of life lost due
to premature death. It provides an alternative
measure to death rates by taking into account
average life expectancy and giving more weight to
deaths that occur among younger people.
n
72
CHAPTER 7: Special topic: Liver cancer
The liver performs many functions. It produces bile,
processes nutrients and drugs, and filters blood from
the stomach and intestines. Other liver functions
include removing and excreting body waste, synthesizing
plasma proteins and helping the body fight infection.
Age and sex differences in incidence and
mortality rates
Primary liver cancer originates in cells of the liver
(hepatocytes), bile ducts or blood vessels or connective
tissue of the liver. However, the liver is also a frequent
site for metastatic cancer. Metastatic cancer in the liver
occurs when cancer cells from tumours in other parts
of the body, such as the lung, breast, pancreas,
gastrointestinal tract or lymphatic system, travel to the
liver through the blood or lymph fluid. These cancer
cells can establish tumours in the liver. Histopathology
and the radiologic characteristics of a tumour can help
determine whether cancer in the liver is primary or
metastatic. This chapter focuses on primary (i.e.,
non-metastatic) liver cancer.
• The incidence rate is higher in males. Between 1970
and 2007, this rate tripled from 2.0 to 6.3 per
100,000. This represents an average annual percent
change (AAPC) of 3.6% per year.
• Between 1970 and 2007, the incidence rate in
females doubled from 0.9 to 1.8 per 100,000. The
fastest increase occurred between 1986 and 2007,
where the incidence rate increased by an annual
percent change (APC) of 2.6% per year.
Hepatocellular carcinoma (HCC) and
cholangiocarcinoma are the two main morphologic
types of liver cancer in adults. As shown in Table 7.1:
• HCC develops from hepatocytes and accounts for
the majority (71.9%) of liver cancers in males and
females in Canada.
• Cholangiocarcinoma develops from the epithelial
lining of the intrahepatic bile ducts. It is less
common than HCC, accounting for 4.1% of liver
cancers in Canada.
• In children, hepatoblastoma is the most common
hepatic tumour, accounting for 1.1% of all new liver
cancer cases.
• A large proportion of liver cancer diagnoses are
classified as “unspecified” and some of these are
likely to be HCC.
Because most adult liver cancer cases are HCC, the
majority of this chapter focuses on this morphologic
type.
Canadian Cancer Society
n
Canadian Cancer Statistics 2013
Age-standardized incidence rates (ASIR) for primary
liver cancer for both males and females in Canada have
increased in the past four decades (Figure 7.1).
• Between 1970 and 2009, age-standardized mortality
rates (ASMR) for liver cancer also increased from
1.8 to 3.3 per 100,000 in males and 0.7 to 0.8 per
100,000 in females. APCs in the most recent period
were 2.5% per year in males since 1991 and 1.8% per
year in females since 1994. The increase in incidence
and mortality rates have occurred for all groups aged
40 years and older.(1)
• Among Canadian provinces, age-standardized
incidence and mortality rates for liver cancer are
highest in British Columbia, Alberta, Ontario and
Quebec (see Chapters 2 and 4).
FIGURE 7.1 Age-standardized incidence rates (1970–2007) and mortality rates (1970–2009) for primary liver cancer, Canada
Rate per 100,000
7
Males
6
5
4
Year range
7
Males
6
Incidence
Mortality
Females
APC
Year range
APC
Incidence
1970–2007
3.6*
Mortality
1970–1982
1982–1988
1988–1991
1991–2009
Incidence
1970–1986
1986–2007
0.5
2.6*
0.2
7.2*
–7.7
2.5*
Mortality
1970–1989
1989–1994
1994–2009
1.2*
–6.2
1.8*
AAPC=3.6% per year*
5
4
AAPC=1.7% per year
3
2
2
AAPC=1.7% per year*
1
AAPC=0.4% per year
1970
1975
1980
1985
1990
1995
2000
2005
Incidence
Mortality
3
1
0
Females
2009
0
APC=annual percent change;
AAPC=average annual percent
change
* Statistically significantly
different from zero (two-sided
p<0.05)
Year of diagnosis or death
Analysis by: Chronic Disease Surveillance and Monitoring Division, CCDP, Public Health Agency of Canada
Data sources: Canadian Cancer Registry and Canadian Vital Statistics Death databases at Statistics Canada
73
CHAPTER 7: Special topic: Liver cancer
International differences in incidence and
mortality rates
• Much of the information on the global distribution
of cancer comes from the GLOBOCAN 2008
database.(2) This database is a repository of data from
cancer registries and other sources and is maintained
by the International Agency for Research on Cancer.
Worldwide, liver cancer was the sixth most common
cancer and accounted for 5.9% of all new cancers in
2008.
• Because HCC is the predominant type of liver cancer
in most countries, the global variations in the disease
generally reflect trends in HCC incidence and the
prevalence of risk factors for HCC. The incidence of
HCC is high in Asia, southern Europe and subSaharan Africa. The incidence of HCC is lower, but
increasing, in North America and parts of Europe.
• As in Canada, the worldwide incidence rate of liver
cancer is higher in males than in females. Liver
cancer has a very poor prognosis and ranks third
in cancer mortality worldwide, accounting for
about 700,000 or 9.2% of all cancer-related deaths
annually.(2)
Risk factors
HCC is often preceded by cirrhosis (scarring) of the
liver. Cirrhosis can be caused by chronic hepatitis
infection, excessive and prolonged use of alcohol,
aflatoxin exposure, diabetes, obesity and metabolic
disorders that cause liver damage (such as alpha-1
antitrypsin deficiency or hereditary tyrosinemia).
Some people with liver cancer have no known risk
factors. Trends in liver cancer in Canada strongly
reflect the historical and ongoing trends in hepatitis B
virus (HBV) and hepatitis C virus (HCV) infections,
which are the major risk factors for the disease in this
country.
Canadian Cancer Society
n
Canadian Cancer Statistics 2013
Age-standardized incidence rate (ASIR)
The number of new cases of cancer per 100,000
people, standardized to the age structure of the
1991 Canadian population to account for changes
in age distribution over time.
Age-standardized mortality rate (ASMR)
The number of cancer deaths per 100,000 people,
standardized to the age structure of the 1991
Canadian population to account for changes in age
distribution over time.
Annual percent change (APC)
The estimated change in the rate of new cases or
deaths from one year to the next over a defined
period of time, reported as a percentage. Along with
the changepoint (the year in which the APC
changed), the APC is useful for examining trends.
Average annual percent change (AAPC)
The average rate of change in a rate over the full
period of time being examined. It is a weighted
average of the APCs for the full period.
Hepatitis B
HBV infection accounts for approximately 23% of all
HCC cases in developed countries. The percentage of
HCC cases related to HBV infection is much higher in
the developing world, including in Asia and subSaharan Africa.(3) The Public Health Agency of Canada
has estimated that chronic carriers of HBV, represent
0.7% to 0.9% of the Canadian population.(4) HBV
infection in Canada is linked to increasing
immigration from areas of the world where HBV
infection is endemic,(5) which is in part reflected by
the higher rates of HCC in provinces where most
immigrants settle. Most infections in the developing
world are transmitted from mother to child at birth.
Worldwide, the virus is also commonly passed through
exposure to contaminated blood or body fluids
between sexual partners and injecting drug users or
through other contact with infected individuals.(6) As
an oncogenic virus, HBV can lead to HCC without the
development of cirrhosis.
Hepatitis C
Chronic HCV infection accounts for approximately
30% to 50% of HCC cases in North America.(7) Based
on statistical models,(8) the prevalence of HCV in
Canada is estimated to be 0.7%, but it could be even
higher. HCV infection is believed to be associated with
exposure to contaminated blood. Individuals at high
risk for HCV infection include former or current drug
users, immigrants from HCV-endemic regions
(e.g., Egypt, Japan, Italy, Pakistan, Bangladesh and
Somalia),(9) people occupationally exposed to
contaminated blood, Aboriginal people and recipients
of transfused blood products prior to the implementation
of enhanced blood screening for HCV in Canada in
the early 1990s.(10) The majority of immigrants likely
acquire HCV infection through unsafe injections or
medical procedures in their countries of origin.(11) In
the US, baby boomers born in North America between
1945 and 1965 have also been identified as a group at
higher than average risk for HCV infection because of
the potential for past exposures to HCV.(12)
74
CHAPTER 7: Special topic: Liver cancer
Alcohol, obesity, smoking, diabetes and other
factors
In the US and northern Europe, more than half of
HCC cases are not linked to HBV or HCV,(13) implying
that other risk factors may play a role. These risk
factors include alcohol-related cirrhosis of the liver,(14)
fatty liver disease (steatohepatitis) associated with
obesity,(15) smoking(16) and diabetes.(17) Some of these
risk factors appear to work as cofactors with liver
disease to increase the risk of cancer. For example, in
the presence of liver disease, the attributable risk of
smoking ranges up to 47%.(18) Alcoholic cirrhosis is
thought to be a major risk factor for HCC in areas
where prevalence of HBV and HCV is low.(19)
Less common risks include metabolic diseases that
cause abnormal liver deposits (e.g., hereditary
hemochromatosis, alpha-1 antitrypsin deficiency),
primary biliary cirrhosis and autoimmune hepatitis.(20)
Oral contraceptive use was previously linked to a
higher risk of liver cancer, but the risk associated with
newer, low-dose formulations is unclear. In
occupational settings, exposure to polychlorinated
biphenyls (PCBs)(21) or vinyl chloride(22) has been
linked to a higher risk of liver cancer, but exposure to
these chemicals is now strictly regulated.
Diagnosis, treatment, survival and prevalence
Diagnosis
In most cases, HCC does not cause any symptoms
until very late in the course of disease. Although HCC
causes bleeding in some cases, it does not cause
bleeding into a hollow organ, like colorectal or cervical
cancer. Furthermore, it does not present with a
palpable mass, such as breast cancer. Diagnosing and
caring for people with HCC may also be complicated
by the presence of an underlying cirrhosis. Thus,
people with liver cancer frequently present with large,
late-stage tumours that are often beyond the reach of
curative therapy. People with liver cancer may present
with acute liver failure, jaundice, ascites, variceal
bleeding or hepatic encephalopathy. They may also
present with constitutional symptoms of cancer, such
as weight loss, night sweats and fatigue. Alternatively,
the presentation may be abdominal pain.
Routine screening with ultrasound in people with
chronic viral hepatitis, cirrhosis or both may identify
asymptomatic, early-stage liver cancer that is amenable
to treatment. Early treatment can lead to improved
survival.
Treatment
Several treatment modalities have proven effective
against HCC. Many other treatments for which proof
of efficacy is lacking are nonetheless used. Resection,
radiofrequency ablation (RFA) and liver
transplantation are considered potentially curative
treatments. All other forms of treatment are considered
palliative. HCC is a very uncommon tumour in
children and there are no specific strategies for
treatment in this age group. Most approaches applied
to adults are also applicable to younger people with
liver cancer.
Canadian Cancer Society
n
Canadian Cancer Statistics 2013
The Canadian Association for Study of the Liver,(23) the
American Association for Study of Liver Disease(24) and
the European Association for Study of the Liver(25) all
have similar practice guidelines for managing HCC. As
shown in Table 7.2, treatment of HCC depends on the
stage of the disease and the health of the liver.(26) In
addition to stage and liver status, the selection of
treatment is based on the availability of healthcare
resources and the level of practitioner expertise.(27)
Observed survival
The proportion of people with cancer who are alive
after a given period of time (e.g., five years) after
diagnosis.
Very early stage HCC is currently difficult to diagnose
because it is a single, asymptomatic lesion measuring
less than 2 cm in diameter, with no vascular or distant
metastases.(27) Surgical resection is considered for very
early stage HCC because it is associated with an overall
observed survival rate of 90%.(28) RFA is also offered
— typically to people whose liver disease or general
health precludes surgery — but it has a lower five-year
observed survival than surgical resection.
The most appropriate treatment for people with early
stage HCC may include either liver resection or liver
transplantation, depending on individual and tumour
factors, as well as on the status of the underlying liver
disease. People with solitary early HCC and wellpreserved liver function (Child-Pugh class A) may be
treated with liver resection or liver transplantation,
although liver resection is favoured in many centres
due to the scarcity of donor organs. Liver
transplantation is the favoured treatment modality for
people with solitary HCC and poor liver function or
75
CHAPTER 7: Special topic: Liver cancer
multifocal HCC. Liver transplantation is a recognized
treatment for people with HCC, but many factors are
associated with an increased risk of post-transplant
recurrence, including large or multiple lesions,
vascular invasion, poorly differentiated histology and
an elevated alpha-fetoprotein (over 400 ng/mL). People
with early stage HCC who are not candidates for or
decline transplant may be offered resection or RFA,
depending on the number and size of tumours and
liver function status.
For intermediate stage HCC, transarterial
chemoembolization (TACE) improves two-year
observed survival rate by 20% to 25% compared to
more conservative therapy.(28)
For advanced stage HCC with well-preserved liver
function (Child-Pugh class A), the primary treatment
option is chemotherapy with sorafenib, an oral
molecular targeted agent.(28) Unfortunately, many
people with advanced HCC and poor liver function are
not suitable candidates for any active treatment.
Survival
Table 7.3 shows that the five-year relative survival ratio
(RSR) for liver cancer is 20%, but it differs according to
age and stage at diagnosis. As with most other cancer
types, survival decreases with advancing age at
diagnosis. The greatest difference in survival between
the sexes is in people aged 15 to 59 years, where
females had better five-year RSRs. Survival data for
liver cancer by stage are not currently available for all
of Canada. However, data from the US Surveillance
Epidemiology and End Results program from 2002 to
2008 indicate that the five-year RSR for liver and
intrahepatic bile duct cancer improves dramatically
when it is diagnosed at an earlier stage. This program
reported the following RSRs by stage: localized stage
was 27.7%; regional stage was 10.1%; distant stage was
2.7%; and unknown stage was 6.0%.(29)
In spite of the low RSR compared to other cancer
types, the age-standardized five-year RSR for both
sexes combined increased from 10% between 1992 and
1994 to 17% between 2001 and 2003 (Figure 7.2). A
similar trend occurred in the US, where the increasing
RSR is thought to be due to more people being
diagnosed at earlier stages as a result of increasing
awareness and screening in people at risk for liver
cancer.(30) Improvements in diagnosis may also be
attributed to the widespread use of ultrasound and
measurement of alpha-fetoprotein since the 1980s.(31)
Despite advances in liver cancer treatment,(32)
improvements in survival worldwide have not been
equally distributed among all social classes. Studies in
Korea,(33) the United States(34) and Canada(35) have
shown that people with a higher socio-economic status
(SES) have better survival outcomes compared to those
FIGURE 7.2 Age-standardized five-year relative survival ratios (RSRs) by sex, Canada, 1992–2003
25
RSR (%)
25
Males
Five-year relative survival ratio (RSR)
A measure of the impact of cancer on life
expectancy that compares the survival of people
diagnosed with cancer to the survival of a
comparable group of people in the general
population. For example, a five-year RSR of 20%
means that the cancer reduces the likelihood of
surviving five years after a cancer diagnosis by 80%.
Five-year RSR is the preferred measure for assessing
population-based cancer survival.
20
20
Females
15
15
10
10
5
5
0
0 confidence interval.
Both sexes
Note: Error bars refer to 95%
1992-94
1993-95
1994-96
1995-97
1996-98
1997-99 1998-2000 1999-2001 2000-02
2001-03
Analysis by: Health Statistics Division, Statistics Canada
Data sources: Canadian Cancer Registry and Canadian Vital Statistics Death databases and life tables at Statistics Canada
Canadian Cancer Society
n
Canadian Cancer Statistics 2013
76
CHAPTER 7: Special topic: Liver cancer
with the lowest SES. This association is most likely due
to lower income groups being less likely to receive
potentially curative treatment.(35) People in lower
income groups may also be more likely to present with
more advanced disease, which precludes curative
therapy. This explanation would be more in keeping
with data on other cancers for which effective
treatment relies on early diagnosis.
income quintile vs. 30.5% to 32.6% for higher income
quintiles).(35) As shown in Table 7.4, the median
survival durations among those receiving potentially
curative therapy, non-curative therapy, palliative
therapy and no treatment were 44.4, 21.4, 8.8 and
4.2 months, respectively. The median survival
durations for income quintiles 1 to 5 were 8.5, 8.9,
10.5, 10.4 and 8.8 months, respectively.
In Ontario between 1990 and 2009, for example,
people from the lowest income quintile were less likely
to receive curative treatment (25.3% for the lowest
Adjusted hazard ratios suggested that a 10% HCC
survival advantage exists for the higher SES groups.
This association between SES and HCC survival most
FIGURE 7.3 Person-based prevalence of primary liver cancer by duration and sex, Canada*, January 1, 2009
Number of people
3,200
3,200
N=2,985
Males
0 to 2 years
2,800
2,800
687
>2 to 5 years
>5 to 10 years
(23%)
2,400
N=2,242
2,000
519
2,400
Females
0 to 2 years
>2 to 5 years
847
2,000
(23%)
(28%)
Prevalence
As of January 1, 2009, it is estimated that 2,985
Canadians (2,242 males and 743 females) had been
diagnosed with primary liver cancer in the previous
10 years and were still alive on that date. Figure 7.3
shows the recency of their diagnosis (i.e., within the
past 2 years, between 2 and 5 years ago and between
5 and 10 years ago). The relatively small percentage of
people diagnosed between 5 and 10 years ago reflects
the poor survival associated with this cancer.
One study estimated that the prevalence proportion of
liver cancer cases among Canadian males was highest
among those aged 70–79 years, followed by males aged
60–69 years and 80 years and older.(36) These patterns
in prevalence reflect the late age at diagnosis of most
cases. The prevalence proportion of liver cancer cases
has been increasing in Canada. Between 2002 and
2008, the APC was 8.5%, more than double that of any
other cancer type examined except thyroid.(37)
Both sexes
1,600
1,600
0 to 2 years
>2 to 5 years
644
>5 to 10 years
(29%)
1,200
1,200
800
>5 to 10 years
likely reflects a lack of access to care for low SES
groups, revealing inequities in the Canadian healthcare
system.
N=743
1,451
(49%)
1,079
(48%)
400
N is the total number of people with the cancer.
800
168 (23%)
203 (27%)
400
372 (50%)
0
0
Both sexes
Males
Females
* During the estimation process, cases from Quebec were excluded because
of issues in correctly ascertaining the vital status of cases. The presented
estimates, however, are for all of Canada, including Quebec. These
estimates assume that sex- and age-specific person-based prevalence
proportions in Quebec are similar to the rest of Canada.
Note: In the legend, 0 to 2 years refers to those diagnosed in 2007 and
2008; >2 to 5 years refers to those diagnosed between 2004 and 2006;
>5 to 10 years refers to those diagnosed between 1999 and 2003.
Analysis by: Health Statistics Division, Statistics Canada
Data sources: Canadian Cancer Registry and Canadian Vital Statistics Death databases at Statistics Canada
Canadian Cancer Society
n
Canadian Cancer Statistics 2013
77
CHAPTER 7: Special topic: Liver cancer
Prevalence
The number of people with a new or previous cancer
diagnosis in a given population who are alive on a
specific date (known as the index date).
Prevention and control
Important risk factors for HCC are smoking, alcoholrelated cirrhosis and fatty liver disease, which means
that ongoing efforts should be made to address tobacco
use, alcohol abuse and excess body weight. However,
large strides in the control of liver cancer will also be
achieved by addressing viral hepatitis infection.
Currently neither HBV nor HCV infections are well
recognized by the public as threats to health, even
though they pose the greatest risk for liver cancer.(38)
According to the Public Health Agency of Canada,
approximately 600,000 Canadians are infected with
HBV or HCV.
There is strong evidence that implementing universal
vaccination against hepatitis B results in a decrease in
HCC.(39) All provinces in Canada now offer universal
vaccination against hepatitis B, although the strategies
vary from province to province. Some offer universal
vaccination to newborns and others to adolescents.(40)
All medical bodies that have opinions on hepatitis B
vaccination recommend neonatal vaccination. This is
because infection in infancy often leads to life-long
chronic infection with the virus, whereas infection in
adults results in chronic infection in less than 1% of
cases. The incidence of childhood hepatitis B is either
Canadian Cancer Society
n
Canadian Cancer Statistics 2013
stable or rising in provinces where adolescent
vaccination is offered, but it is falling in British
Columbia where neonatal vaccination is offered.(41) In
Canada, most cases of HBV infection are in adult
immigrants from countries where universal
vaccination is either not offered or was introduced
only recently.
In the absence of randomized trials, the role that
treatment for hepatitis B plays in reducing the
incidence of HCC is unclear. Recent studies suggest
that treatment with lamivudine can reduce HCC
incidence in the presence and absence of cirrhosis.(42–44)
Currently, however, only a very small proportion of
people with chronic hepatitis B are receiving
treatment. This is in part because of the poor
recognition of the severity of hepatitis B consequences
by infected people and family practitioners and
because of the restricted access to hepatitis B antiviral
agents through provincial drug reimbursement plans.
One randomized controlled trial showed that
screening of people with hepatitis B can reduce
HCC-related mortality by 37%.(45) Other studies also
strongly suggest that screening reduces HCC-related
mortality,(46–49) which supports the recommendation by
all major international hepatology associations for the
regular screening of HBV-infected people at risk for
HCC. Modelling studies also suggest that screening
immigrants for hepatitis B is cost effective and will
reduce the incidence of complications of hepatitis B.(50)
As with hepatitis B, there is some evidence that
treating HCV reduces HCC incidence,(46–49, 51) although
the evidence is not strong. Despite low cure rates in the
past, HCV treatment today is thought to cure the
infection in 65% to 70% of people. However, less than
3% of chronically infected people receive treatment
each year. It is estimated that only about 80,000
HCV-positive people in Canada have been treated over
the last 15 to 20 years.(52, 53) As with HBV, the limited
number of people treated for HCV is due to the lack of
awareness among primary care physicians and because
of restrictive drug reimbursement policies.
Population-level initiatives
Governments in many other Western countries
(including the US, Australia, France, Germany and
New Zealand) have developed concerted strategies to
identify and offer treatment to individuals infected
with HBV or HCV. For example, in 2008 the US
Centers for Disease Control and Prevention (CDC)
published updated guidelines for HBV screening,
which broadened screening to all individuals in the US
who lived in or were born in world regions with
intermediate or high HBV prevalence (>2%).(54)
Recommendations by the US Institute of Medicine
were also updated to reflect expanded communitybased programs for HBV screening, testing and
vaccination services for immigrants.(55)
78
CHAPTER 7: Special topic: Liver cancer
More recently, the CDC recommended at least a
one-time blood test for HCV for all individuals born
in North America between 1945 and 1965.(12) This
recommendation is supported by statistical modelling
of sequelae and studying the cost-effectiveness of
treatment. There is no similar recommendation in
Canada, but the Public Health Agency of Canada is
examining the issue. In Canada, other options (such as
a catch-up immunization program) could be
considered for children and young adults from at-risk
regions who have not been vaccinated against HBV.
Other approaches could include screening and
treatment for HBV and HCV in immigrants from high
prevalence world regions,(11) public education among
at-risk populations to reduce stigma and raise
awareness of the prevalence of and testing for hepatitis
infection, and greater implementation of safe injection
sites and needle exchange programs for drug users.(56)
Healthcare professional initiatives
Healthcare professionals must also recognize people
who would benefit from increased monitoring or
screening for risk factors and to whom they should
offer treatment. Barriers to effective care may be
related to low rates of community surveillance for
people with cirrhosis or those at high risk of HCC.(57, 58)
These low rates of surveillance may be due to the
difficulty in implementing regular surveillance,
complicated diagnostic evaluation, limited access to
specialized multidisciplinary care and the high cost of
potentially curative therapy.(28, 59) Surveillance with liver
ultrasound and measurement of serum alphafetoprotein levels every 6 to 12 months in people with
cirrhosis or advanced hepatic fibrosis, irrespective of
Canadian Cancer Society
n
Canadian Cancer Statistics 2013
the cause, improves diagnosis of HCC at early stages
when the tumour might be curable by surgical
resection, liver transplantation or RFA. Using these
measures to diagnose liver cancer at an early stage also
means that a five-year survival higher than 50% can be
achieved.(28, 60)
Offering testing and counselling to HIV-positive
people would also be beneficial as these individuals are
at greater risk of HBV or HCV co-infection due to
common risk factors.(61)
Individual-level initiatives
People may be unaware that they are infected with
hepatitis B or C, which can be an impediment to the
control of liver cancer.(5) Initiatives to raise awareness
about viral hepatitis should consider the heterogeneous
nature of the demographic profile, language, cultural
perceptions of disease, health literacy and frequency of
contact with medical care of the targeted at-risk
communities.
Testing for HBV or HCV can mean that treatment is
started sooner, which can help clear the virus, lessen
the damage to the liver and prevent further spread of
the infection to others. Risk reduction involves
practising safe sex, not sharing needles or other
drug-related equipment, effective sterilizing of
tattooing and body piercing equipment and not
sharing personal hygiene materials that can come into
contact with blood (such as razors and toothbrushes).
Costs associated with liver cancer care
The increase in HCC incidence creates a greater
demand for screening, diagnosis, care and treatment.
Representative cost data are needed to create policy
decision models. They are designed to explicitly
include resource consequences and health outcomes in
a health economic evaluation framework to evaluate
whether particular healthcare technologies should be
provided within the context of an organized healthcare
system.
Net costs of care represent the difference between the
mean costs for people with HCC compared to people
with similar characteristics without HCC.(62) Net costs
can be calculated by phase of disease where the initial
phase of HCC is defined as the first 12 months after
diagnosis and includes diagnostic services and curative
treatments.(65) The terminal phase is the final 12
months of life and involves care received at the end of
life.(65) The continuing care phase is all months between
the initial and terminal phases of care. This care phase
includes surveillance activities for detecting
recurrences, medications to prevent cancer recurrence
and treatment of complications from the initial
therapy. For people who survive less than 24 months
after diagnosis, the final 12 months of observation and
costs of care were allocated first to the terminal phase,
consistent with other studies.(63, 64)
Between 1990 and 2009, the estimated average net cost
of HCC care per 30 patient-days in Ontario was $7,134
(in 2010 Canadian dollars) in the initial phase of the
disease. This cost represents 92% of the total costs of
care in this phase (Table 7.5). In the continuing care
phase, the cost is $1,159, which represents 58% of the
total costs of care in this phase. In the terminal phase,
the cost is $10,265, which represents 72% of the total
costs of care in this phase.
79
CHAPTER 7: Special topic: Liver cancer
Estimates of five-year net costs of HCC care
The mean five-year net costs of HCC care were
estimated using an incidence approach that applied
phase-specific net costs of care due to HCC to survival
probabilities (from the date of diagnosis to death) and
by aggregating the costs of the three phases.(63, 66, 67)
When undiscounted, the five-year net costs of HCC
are estimated to be $126,406 (95% CI, $94,646–
$158,166). With a 3% discount, the estimate was
$79,516 ($59,934–$99,098), and it was $70,170
($53,062–$87,278) with a 5% discount.
Discounting
The process of converting future values (e.g., costs
or health effects) to their present values to reflect
the fact that individuals and society generally prefer
to receive benefits sooner rather than later and pay
costs later rather than sooner.
Aggregate five-year net costs of HCC care in
the Canadian population
When the mean five-year net costs were applied to the
newly diagnosed cases of HCC in the Canadian
population in 2009, the five-year aggregate net costs of
care were approximately $174 million (95% CI,
$130 million–$217 million) when undiscounted. With
a 3% discount the five-year aggregate net costs of care
were $109 million ($82 million–$136 million) and
they were $96 million ($73 million–$120 million) with
a 5% discount.
Canadian Cancer Society
n
Canadian Cancer Statistics 2013
New developments in liver cancer
management and research
Treatments
Based on available evidence(42,43,49,68,69), eradicating
hepatitis C and controlling hepatitis B replication
appear to be associated with a lower risk for and less
disease progression of HCC. However, there are
currently no randomized controlled trials that
convincingly show how treating viral hepatitis affects
liver cancer mortality. The biggest limitation to treating
HCC is the function of the underlying liver. Unless
liver function is normal (or near normal), none of the
usual treatments are possible. People with Child-Pugh
class B cirrhosis are not candidates for any form of
therapy.(26) These limitations extend to all the newer
therapies currently being developed. The most recent
development in the management of HCC is the
introduction of sorafenib,(70) the first agent to be
licensed for the treatment of HCC. The introduction of
this drug has led to investigations into other agents,
including brivanib, sunitinib, tivantinib and
regorafenib. Tivantinib and regorafenib are still under
investigation, while brivanib and sunitinib have failed
phase III trials and are no longer being developed for
HCC. The success of sorafenib in treating advanced
disease also prompted investigation of its utility in
earlier stage disease. While these studies are not yet
complete, it is thought that sorafenib does not enhance
the effect of chemoembolization.
Standard chemotherapy has not been shown to be
effective in treating HCC, in part due to the severity of
the underlying liver disease. People with advanced
liver disease do not tolerate chemotherapy well. The
experimental approaches include different methods to
deliver therapeutic agents to the tumour. The most
advanced of these approaches is radio-embolization,
which has shown impressive tumour necrosis.(71, 72) To
date there are no direct comparisons between radioembolization and other treatments applied to the same
person with HCC. However, studies comparing
survival of people treated with radio-embolization to
people not treated by this method suggest an
improvement in survival.(73)
Another experimental approach to delivering local
chemotherapy involves the use of biodegradable
microspheres loaded with a chemotherapeutic agent.(74)
Compared to standard chemoembolization, this
approach appears to be safer, but it does not appear to
improve survival. Other researchers have combined
RFA with local chemotherapy. This technique is still
under investigation.
Traditionally, radiation therapy has not been used for
HCC because of concerns that the liver was
radiosensitive. However, researchers are currently
studying a number of techniques using external beam
radiation therapy, such as intensity-modulated
radiation therapy (IMRT), image-guided radiation
therapy, 3-dimensional conformal radiation,
4-dimensional conformal radiation and charged
particle therapy.(75–77)
80
CHAPTER 7: Special topic: Liver cancer
Genetic studies
As with other cancers, researchers have attempted to
identify pathways that lead to the development of
HCC, but so far they have not identified a “driver”
genetic alteration. However, researchers have identified
different sets of genes that are over- or under-expressed
in HCC. Although there has been some attempt to
classify these diverse results into four main
genotypes,(78) many HCCs do not fit into this
classification method.
Researchers have identified gene signatures that
predict better or worse prognosis for HCC,(79–81) but to
date they have not identified gene expression that can
be used as a target for drug intervention. Most notable
is the finding that a gene signature in the healthy
portion of liver that is removed with the tumour
during surgery predicts recurrence two years or more
after surgery.(82) This finding suggests that the whole
liver or large parts of it consist of a clonal population of
cells, which means that it may be possible to biopsy a
liver without cancer in a person at risk for HCC and
predict whether it will or will not develop HCC.
What do these statistics mean?
The burden of liver cancer in Canada is expected to
grow as a result of an aging population and the
ongoing trend in immigration from countries where
HBV and HCV infections are endemic. The control of
HCV infection continues to pose a challenge in
Canada, particularly in marginalized populations.
Researchers have shown that screening for HCC can
increase the chance of being successfully treated for
this cancer. Yet most people with HCC have not
undergone proper screening and it appears that the
vast majority of at-risk people are not undergoing
screening. All people at risk for HCC should be made
Canadian Cancer Society
n
Canadian Cancer Statistics 2013
aware of their need for screening and healthcare
providers need to be educated about who to screen and
which tests to use.
Greater efforts are needed to prevent liver cancer.
These efforts should include public and healthcare
provider education, early identification of individuals
at risk of the disease, increasing the use of hepatitis
screening among at-risk individuals and policies to
facilitate treatment of people with liver cancer. Control
of more widespread risk factors, such as smoking,
alcohol abuse and excess weight, can help reduce
incidence of liver and other cancers.
Recommendations to improve the control of liver
cancer in Canada include:
• Healthcare providers should identify, offer testing to
and counsel people at risk for liver cancer based on
their hepatitis, alcohol, weight and diabetes profiles.
Healthcare providers should aim to identify people
early in the course of chronic HBV or HCV
infection. They should also offer testing and
counselling for HIV-positive people because they are
at greater risk of HBV or HCV co-infection due to
common risk factors.
• Canadians need easier access to HBV and HCV
treatments to reduce the chance of progression to
liver cancer.
• Public health messages should aim to raise the
profile of this rapidly rising disease and emphasize
the ways to prevent it. Public health efforts should
not be limited to clinic visits; outreach should be
done to increase risk-reduction education, provide
support for people with HCC and offer catch-up
HBV vaccination. Education on risk reduction for
HCC should encompass not only testing for and
treating viral hepatitis, but also the impact of alcohol
abuse, obesity and smoking.
• More Canadian data are needed to understand the
best strategies for HBV and HCV screening and
treatment, as well as the best ways to improve
community engagement in promoting screening for
populations that are hard to reach.
• The approaches to HBV and HCV testing strategies
undertaken in other countries should be considered
for the Canadian context.
• The higher risk of the disease in lower income
populations and barriers to access to healthcare,
early detection and treatment need to be investigated
further to reduce the impact on this population.
As liver cancer incidence increases, access to
potentially curative therapies and the costs associated
with them will present new challenges to the
healthcare system. Further research is needed to find
the most effective means of educating the public about
the disease, screening for people at risk for HBV and
HCV infection and understanding the needs of people
with and survivors of liver cancer. In addition, current
and future interventions can benefit from an
understanding of their cost-effectiveness, barriers to
implementation and impact on future rates of the
disease.
81
CHAPTER 7: Special topic: Liver cancer
For further information
Databases
References
Publications
• Statistics Canada. Table 103-0550 — New cases for ICD-O-3
primary sites of cancer (based on the July 2011 CCR
tabulation file), by age group and sex, Canada, provinces
and territories, annual, CANSIM (database).
1. De P, Dryer D, Otterstatter M, Semenciw R. Canadian trends in liver cancer: A brief clinical
and epidemiological overview. Current Oncology. 2012;20(1):e40-3.
2. Ferlay J, Shin HR, Bray F, Forman D, Mathers C, Parkin DM. GLOBOCAN 2008 v2.0: Cancer
Incidence and Mortality Worldwide: IARC CancerBase No. 10 [Internet]. Lyon, France.
International Agency for Research on Cancer; 2010; Available at: http://globocan.iarc.fr.
[Accessed June 1, 2012].
3. Parkin DM. The global health burden of infection-associated cancers in the year 2002.
International Journal of Cancer / Journal International du Cancer. 2006;118(12):3030–
44.
4. Public Health Agency of Canada. Hepatitis B – Get the Facts. Available at: http://www.
phac-aspc.gc.ca/hcai-iamss/bbp-pts/hepatitis/hep_b-eng.php. [Accessed Nov 20, 2012].
5. Burak K, Coffin C, Myers R. Hepatitis B awareness and education: A failing grade.
Canadian Journal of Gastroenterology / Journal Canadien de Gastroenterologie.
2011;25(3):125–6.
6. Lee WM. Hepatitis B virus infection. The New England Journal of Medicine.
1997;337(24):1733–45.
7. El-Serag HB, Rudolph KL. Hepatocellular carcinoma: Epidemiology and molecular
carcinogenesis. Gastroenterology. 2007;132(7):2557–76.
8. Remis R, for the Public Health Agency of Canada. Modeling the Incidence and Prevalence
of Hepatitis C Infection and its Sequelae in Canada, 2007. Unpublished data; 2009.
9. Lavanchy D, McMahon B. Worldwide prevalence and prevention of hepatitis C. In: Liang
TJ, Hoofnagle JH, editors. Hepatitis. C. San Diego: Academic Press; 2000: 185–202.
10.Public Health Agency of Canada. Epidemiology of Acute Hepatitis C Infection in Canada:
Results from the Enhanced Hepatitis Strain Surveillance System (EHSSS). 2009.
Available at: http://www.phac-aspc.gc.ca/sti-its-surv-epi/pdf/epi_update-eng.pdf.
[Accessed Nov 20, 2012].
11.Pottie K, Greenaway C, Feightner J, Welch V, Swinkels H, Rashid M, et al. Evidence-based
clinical guidelines for immigrants and refugees. CMAJ 2011;183(12):E824–925.
12.Rein D, Smith B, Wittenborn J, Lesesne S, Wagner L, Roblin D, et al. The cost-effectiveness
of birth-cohort screening for hepatitis C antibody in U.S. primary care settings. Annals of
Internal Medicine. 2012;156(4):263–70.
13.El-Serag HB, Mason AC. Risk factors for the rising rates of primary liver cancer in the
United States. Archives of Internal Medicine. 2000;160(21):3227–30.
14.Corrao G, Bagnardi V, Zambon A, La Vecchia C. A meta-analysis of alcohol consumption
and the risk of 15 diseases. Preventive Medicine. 2004;38(5):613–9.
15.Larsson SC, Wolk A. Overweight, obesity and risk of liver cancer: a meta-analysis of
cohort studies. British Journal of Cancer. 2007;97(7):1005–8.
16.Gandini S, Botteri E, Iodice S, Boniol M, Lowenfels AB, Maisonneuve P, et al. Tobacco
smoking and cancer: A meta-analysis. International Journal of Cancer / Journal
International du Cancer. 2008;122(1):155–64.
17.El-Serag HB, Hampel H, Javadi F. The association between diabetes and hepatocellular
carcinoma: A systematic review of epidemiologic evidence. Clinical Gastroenterology and
Hepatology: The Official Clinical Practice Journal of the American Gastroenterological
Association. 2006;4(3):369–80.
18.Trichopoulos D, Bamia C, Lagiou P, Fedirko V, Trepo E, Jenab M, et al. Hepatocellular
carcinoma risk factors and disease burden in a European cohort: A nested case-control
study. Journal of the National Cancer Institute. 2011;103(22):1686–95.
19.La Vecchia C. Alcohol and liver cancer. European Journal of Cancer Prevention: The
Official Journal of the European Cancer Prevention Organisation. 2007;16(6):495–7.
20.Blonski W, Kotlyar DS, Forde KA. Non-viral causes of hepatocellular carcinoma. World
Journal of Gastroenterology: WJG. 2010;16(29):3603–15.
• Kachuri L, De P, Ellison LF, Semenciw R. Cancer incidence,
mortality and survival trends in Canada, 1970–2007. Chronic
Diseases and Injuries in Canada. 2013;33(2):69–80.
• Jiang X, Pan SY, de Groh M, Liu S, Morrison H. Increasing
incidence in liver cancer in Canada, 1972–2006: Age-periodcohort analysis. Journal of Gastrointestinal Oncology.
2011;2(4):223–31.
• Pocobelli G, Cook LS, Brant R, Lee SS. Hepatocellular
carcinoma incidence trends in Canada: Analysis by birth
cohort and period of diagnosis. Liver International.
2008;28(9):1272–9.
• ElSaadany S, Giulivi A. Epidemiology of hepatocellular
carcinoma in Canada, 1995: Analysis of death certificates.
Chronic Diseases in Canada. 2006;27(3):125–9.
• Dyer Z, Peltekian K, van Zanten SV. Review article: The
changing epidemiology of hepatocellular carcinoma in
Canada. Alimentary Pharmacology and Therapeutics.
2005;22(1):17–22.
• elSaadany S, Tepper M, Mao Y, Semenciw R, Giulivi A. An
epidemiologic study of hepatocellular carcinoma in Canada.
Canadian Journal of Public Health. 2002;93(6):443–6.
• Statistics Canada. Table 103-0553 — New cases and
age-standardized rate for ICD-O-3 primary sites of cancer
(based on the July 2011 CCR tabulation file), by sex, Canada,
provinces and territories, annual, CANSIM (database).
• Statistics Canada. Table 102-0552 — Deaths and mortality
rate, by selected grouped causes and sex, Canada, provinces
and territories, annual, CANSIM (database).
• Statistics Canada. Table 102-4309 — Mortality and potential
years of life lost, by selected causes of death and sex,
three-year average, Canada, provinces, territories, health
regions and peer groups, occasional (number unless
otherwise noted), CANSIM (database).
• Statistics Canada. Table 103-1574 — Five-year survival
estimates for primary sites of cancer, ICD-O-3 (October 2011
CCR file), by sex, population aged 15 to 99, 3 years of cases,
selected provinces, annual (percent), 1992/1994 to
2001/2003, CANSIM (database).
• Statistics Canada. Table 103-1572 — Age-standardized
five-year survival estimates for primary sites of cancer,
ICD-O-3 (October 2011 CCR file), by sex, 3 years of cases,
Canada and selected provinces, annual (percent), 1992/1994
to 2001/2003, CANSIM (database).
• Public Health Agency of Canada. Chronic Disease Infobase
Cubes. Ottawa, Canada.
Canadian Cancer Society
n
Canadian Cancer Statistics 2013
82
CHAPTER 7: Special topic: Liver cancer
21.Johnson B, Hicks H, Cibulas W, Faroon O, Ashizawa A, De Rosa C. Public Health
Implications of Exposure to Polychlorinated Biphenyls (PCBs). Agency for Toxic Substances
and Disease Registry, 1999. Available at: http://www.atsdr.cdc.gov/DT/pcb007.html.
[Accessed Jan 20, 2013].
22.International Agency for Research on Cancer. A review of human carcinogens. Volume
100F: Chemical agents and related occupations. Lyon, France: IARC Working Group on
the Evaluation of Carcinogenic Risks to Humans; 2012.
23.Sherman M, Burak K, Maroun J, Metrakos P, Knox JJ, Myers RP, et al. Multidisciplinary
Canadian consensus recommendations for the management and treatment of
hepatocellular carcinoma. Current Oncology. 2011;18(5):228–40.
24.Bruix J, Sherman M, American Association for the Study of Liver Diseases. Management
of hepatocellular carcinoma: An update. Hepatology. 2011;53(3):1020–2.
25.European Association For The Study Of The Liver, European Organisation For Research and
Treatment of Cancer EASL-EORTC clinical practice guidelines: Management of
hepatocellular carcinoma. Journal of Hepatology. 2012;56(4):908–43.
26.Forner A, Reig ME, de Lope CR, Bruix J. Current strategy for staging and treatment: The
BCLC update and future prospects. Seminars in Liver Disease. 2010;30(1):61–74.
27.Livraghi T, Meloni F, Di Stasi M, Rolle E, Solbiati L, Tinelli C, et al. Sustained complete
response and complications rates after radiofrequency ablation of very early
hepatocellular carcinoma in cirrhosis: Is resection still the treatment of choice?
Hepatology. 2008;47(1):82–9.
28.El-Serag HB. Hepatocellular carcinoma. The New England Journal of Medicine.
2011;365(12):1118–27.
29.Howlader N, Noone AM, Krapcho M, Neyman N, Aminou R, Altekruse SF, et al. SEER
Cancer Statistcs Review, 1975–2009 (Vintage 2009 Populations). Bethesda, MD: National
Cancer Institute; 2012. Available at: http://seer.cancer.gov/csr/1975_2009_pops09/,
based on November 2011 SEER data submission, posted to the SEER web site, 2012.
(Accessed Jan 20, 2013).
30.Altekruse SF, McGlynn KA, Reichman ME. Hepatocellular carcinoma incidence, mortality,
and survival trends in the United States from 1975 to 2005. Journal of Clinical Oncology:
The Official journal of the American Society of Clinical Oncology. 2009;27(9):1485–91.
31.Chuang SC, La Vecchia C, Boffetta P. Liver cancer: Descriptive epidemiology and risk
factors other than HBV and HCV infection. Cancer Letters. 2009;286(1):9–14.
32.El-Serag HB, Marrero JA, Rudolph L, Reddy KR. Diagnosis and treatment of hepatocellular
carcinoma. Gastroenterology. 2008;134(6):1752–63.
33.Yun EH, Lim MK, Oh JK, Park JH, Shin A, Sung J, et al. Combined effect of socioeconomic
status, viral hepatitis, and lifestyles on hepatocelluar carcinoma risk in Korea. British
Journal of Cancer. 2010;103(5):741–6.
34.Artinyan A, Mailey B, Sanchez-Luege N, Khalili J, Sun CL, Bhatia S, et al. Race, ethnicity,
and socioeconomic status influence the survival of patients with hepatocellular carcinoma
in the United States. Cancer. 2010;116(5):1367–77.
35.Jembere N, Campitelli MA, Sherman M, Feld JJ, Lou W, Peacock S, et al. Influence of
socioeconomic status on survival of hepatocellular carcinoma in the Ontario population:
A population-based study, 1990–2009. PloS One. 2012;7(7):e40917.
36.Ellison LF, Wilkins K. Cancer prevalence in the Canadian population. Health Reports.
2009;20(1):7–19.
37.Ellison LF, Wilkins K. Canadian trends in cancer prevalence. Health Reports.
2012;23(1):7–16.
38.Li D, Tang T, Patterson M, Ho M, Heathcote J, Shah H. The impact of hepatitis B
knowledge and stigma on screening in Canadian Chinese persons. Canadian Journal of
Gastroenterology / Journal Canadien de Gastroenterologie. 2012;26(9):597–602.
39.Chang MH, You SL, Chen CJ, Liu CJ, Lee CM, Lin SM, et al. Decreased incidence of
hepatocellular carcinoma in hepatitis B vaccinees: A 20-year follow-up study. Journal of
the National Cancer Institute. 2009;101(19):1348–55.
40.Public Health Agency of Canada. Canadian Immunization Guide. 10th ed. Ottawa,ON;
2012.
41.Mackie CO, Buxton JA, Tadwalkar S, Patrick DM. Hepatitis B immunization strategies:
Timing is everything. CMAJ. 2009;180(2):196–202.
Canadian Cancer Society
n
Canadian Cancer Statistics 2013
42.Liaw YF, Sung JJ, Chow WC, Farrell G, Lee CZ, Yuen H, et al. Lamivudine for patients with
chronic hepatitis B and advanced liver disease. The New England Journal of Medicine.
2004;351(15):1521–31.
43.Yuen MF, Seto WK, Chow DH, Tsui K, Wong DK, Ngai VW, et al. Long-term lamivudine
therapy reduces the risk of long-term complications of chronic hepatitis B infection even
in patients without advanced disease. Antiviral Therapy. 2007;12(8):1295–303.
44.Di Marco V, Marzano A, Lampertico P, Andreone P, Santantonio T, Almasio PL, et al.
Clinical outcome of HBeAg-negative chronic hepatitis B in relation to virological response
to lamivudine. Hepatology. 2004;40(4):883–91.
45.Zhang BH, Yang BH, Tang ZY. Randomized controlled trial of screening for hepatocellular
carcinoma. Journal of Cancer Research and Clinical Oncology. 2004;130(7):417–22.
46.Trevisani F, Cantarini MC, Labate AM, De Notariis S, Rapaccini G, Farinati F, et al.
Surveillance for hepatocellular carcinoma in elderly Italian patients with cirrhosis: Effects
on cancer staging and patient survival. The American Journal of Gastroenterology.
2004;99(8):1470–6.
47.Zoli M, Magalotti D, Bianchi G, Gueli C, Marchesini G, Pisi E. Efficacy of a surveillance
program for early detection of hepatocellular carcinoma. Cancer. 1996;78(5):977–85.
48.Chen TH, Chen CJ, Yen MF, Lu SN, Sun CA, Huang GT, et al. Ultrasound screening and risk
factors for death from hepatocellular carcinoma in a high risk group in Taiwan.
International Journal of Cancer / Journal International du Cancer. 2002;98(2):257–61.
49.Backus LI, Boothroyd DB, Phillips BR, Belperio P, Halloran J, Mole LA. A sustained virologic
response reduces risk of all-cause mortality in patients with hepatitis C. Clinical
Gastroenterology and Hepatology: The Official Clinical Practice Journal of the American
Gastroenterological Association. 2011;9(6):509–16 e1.
50.Wong WW, Woo G, Jenny Heathcote E, Krahn M. Cost effectiveness of screening
immigrants for hepatitis B. Liver International: The Official Journal of the International
Association for the Study of the Liver. 2011;31(8):1179–90.
51.Morgan TR, Ghany MG, Kim HY, Snow KK, Shiffman ML, De Santo JL, et al. Outcome of
sustained virological responders with histologically advanced chronic hepatitis C.
Hepatology. 2010;52(3):833–44.
52.Fried MW, Shiffman ML, Reddy KR, Smith C, Marinos G, Goncales FL, Jr., et al.
Peginterferon alfa-2a plus ribavirin for chronic hepatitis C virus infection. The New
England Journal of Medicine. 2002;347(13):975–82.
53.Hadziyannis SJ, Sette H, Jr., Morgan TR, Balan V, Diago M, Marcellin P, et al. Peginterferonalpha2a and ribavirin combination therapy in chronic hepatitis C: A randomized study of
treatment duration and ribavirin dose. Annals of Internal Medicine. 2004;140(5):346–55.
54.Weinbaum CM, Williams I, Mast EE, Wang SA, Finelli L, Wasley A, et al. Recommendations
for identification and public health management of persons with chronic hepatitis B virus
infection. MMWR Recommendations and Reports. 2008;57(RR-8):1–20.
55.Mitchell AE, Colvin HM, Palmer Beasley R. Institute of Medicine recommendations for the
prevention and control of hepatitis B and C. Hepatology. 2010;51(3):729–33.
56.Wright NM, Tompkins CN. A review of the evidence for the effectiveness of primary
prevention interventions for hepatitis C among injecting drug users. Harm Reduction
Journal. 2006;3:27.
57.Davila JA, Henderson L, Kramer JR, Kanwal F, Richardson PA, Duan Z, et al. Utilization of
surveillance for hepatocellular carcinoma among hepatitis C virus-infected veterans in the
United States. Annals of Internal Medicine. 2011;154(2):85–93.
58.Davila JA, Morgan RO, Richardson PA, Du XL, McGlynn KA, El-Serag HB. Use of
surveillance for hepatocellular carcinoma among patients with cirrhosis in the United
States. Hepatology. 2010;52(1):132–41.
59.El-Serag HB, Siegel AB, Davila JA, Shaib YH, Cayton-Woody M, McBride R, et al. Treatment
and outcomes of treating of hepatocellular carcinoma among Medicare recipients in the
United States: A population-based study. Journal of Hepatology. 2006;44(1):158–66.
60.Forner A, Llovet JM, Bruix J. Hepatocellular carcinoma. Lancet. 2012;379(9822):1245–55.
61.Soriano V, Vispo E, Labarga P, Medrano J, Barreiro P. Viral hepatitis and HIV co-infection.
Antiviral Research. 2005;85:303–15.
62.Taplin SH, Barlow W, Urban N, Mandelson MT, Timlin DJ, Ichikawa L, et al. Stage, age,
comorbidity, and direct costs of colon, prostate, and breast cancer care. Journal of the
National Cancer Institute. 1995;87(6):417–26.
63.Yabroff KR, Lamont EB, Mariotto A, Warren JL, Topor M, Meekins A, et al. Cost of care for
elderly cancer patients in the United States. Journal of the National Cancer Institute.
2008;100(9):630–41.
64.Brown ML, Riley GF, Potosky AL, Etzioni RD. Obtaining long-term disease specific costs of
care: Application to Medicare enrollees diagnosed with colorectal cancer. Medical Care.
1999;37(12):1249–59.
65.Baker MS, Kessler LG, Urban N, Smucker RC. Estimating the treatment costs of breast and
lung cancer. Medical Care. 1991;29(1):40–9.
66.Hartunian NS, Smart CN, Thompson MS. The incidence and economic costs of cancer,
motor vehicle injuries, coronary heart disease, and stroke: A comparative analysis.
American Journal of Public Health. 1980;70(12):1249–60.
67.Brown ML, Riley GF, Schussler N, Etzioni R. Estimating health care costs related to cancer
treatment from SEER-Medicare data. Medical Care. 2002;40(8 Suppl):IV-104–17.
68.Zhang QQ, An X, Liu YH, Li SY, Zhong Q, Wang J, et al. Long-term nucleos(t)ide analogues
therapy for adults with chronic hepatitis B reduces the risk of long-term complications:
a meta-analysis. Virology Journal. 2011;8:72.
69.Liaw YF, Sheen IS, Lee CM, Akarca US, Papatheodoridis GV, Suet-Hing Wong F, et al.
Tenofovir disoproxil fumarate (TDF), emtricitabine/TDF, and entecavir in patients with
decompensated chronic hepatitis B liver disease. Hepatology. 2011;53(1):62–72.
70.Llovet JM, Ricci S, Mazzaferro V, Hilgard P, Gane E, Blanc JF, et al. Sorafenib in advanced
hepatocellular carcinoma. The New England Journal of Medicine. 2008;359(4):378–90.
71.Salem R, Lewandowski RJ, Kulik L, Wang E, Riaz A, Ryu RK, et al. Radioembolization
results in longer time-to-progression and reduced toxicity compared with
chemoembolization in patients with hepatocellular carcinoma. Gastroenterology.
2011;140(2):497–507 e2.
72.Sangro B, Carpanese L, Cianni R, Golfieri R, Gasparini D, Ezziddin S, et al. Survival after
yttrium-90 resin microsphere radioembolization of hepatocellular carcinoma across
Barcelona clinic liver cancer stages: A European evaluation. Hepatology. 2011;54(3):
868–78.
73.Memon K, Kulik L, Lewandowski RJ, Wang E, Riaz A, Ryu RK, et al. Radiographic response
to locoregional therapy in hepatocellular carcinoma predicts patient survival times.
Gastroenterology. 2011;141(2):526–35, 35 e1-2.
74.Lammer J, Malagari K, Vogl T, Pilleul F, Denys A, Watkinson A, et al. Prospective
randomized study of doxorubicin-eluting-bead embolization in the treatment of
hepatocellular carcinoma: Results of the PRECISION V study. Cardiovascular and
Interventional Radiology. 2010;33(1):41–52.
75.Ben-Josef E, Normolle D, Ensminger WD, Walker S, Tatro D, Ten Haken RK, et al. Phase II
trial of high-dose conformal radiation therapy with concurrent hepatic artery floxuridine
for unresectable intrahepatic malignancies. Journal of Clinical Oncology: The Official
Journal of the American Society of Clinical Oncology. 2005;23(34):8739–47.
76.Han KH, Seong J, Kim JK, Ahn SH, Lee do Y, Chon CY. Pilot clinical trial of localized
concurrent chemoradiation therapy for locally advanced hepatocellular carcinoma with
portal vein thrombosis. Cancer. 2008;113(5):995–1003.
77.Robertson JM, Lawrence TS, Dworzanin LM, Andrews JC, Walker S, Kessler ML, et al.
Treatment of primary hepatobiliary cancers with conformal radiation therapy and regional
chemotherapy. Journal of Clinical Oncology: The Official Journal of the American Society
of Clinical Oncology. 1993;11(7):1286–93.
78.Hoshida Y, Nijman SM, Kobayashi M, Chan JA, Brunet JP, Chiang DY, et al. Integrative
transcriptome analysis reveals common molecular subclasses of human hepatocellular
carcinoma. Cancer Research. 2009;69(18):7385–92.
79.Roessler S, Long EL, Budhu A, Chen Y, Zhao X, Ji J, et al. Integrative genomic identification
of genes on 8p associated with hepatocellular carcinoma progression and patient
survival. Gastroenterology. 2012;142(4):957-66 e12.
80.Schroder PC, Segura V, Riezu JI, Sangro B, Mato JM, Prieto J, et al. A signature of six
genes highlights defects on cell growth and specific metabolic pathways in murine and
human hepatocellular carcinoma. Functional & Integrative Genomics. 2011;11(3):
419–29.
83
CHAPTER 7: Special topic: Liver cancer
81.Guichard C, Amaddeo G, Imbeaud S, Ladeiro Y, Pelletier L, Maad IB, et al. Integrated
analysis of somatic mutations and focal copy-number changes identifies key genes and
pathways in hepatocellular carcinoma. Nature Genetics. 2012;44(6):694–8.
82.Hoshida Y, Villanueva A, Kobayashi M, Peix J, Chiang DY, Camargo A, et al. Gene
expression in fixed tissues and outcome in hepatocellular carcinoma. The New England
Journal of Medicine. 2008;359(19):1995–2004.
83.Yamamoto J, Kosuge T, Saiura A, Sakamoto Y, Shimada K, Sano T, et al. Effectiveness of
hepatic resection for early-stage hepatocellular carcinoma in cirrhotic patients: Subgroup
analysis according to Milan criteria. Japanese Journal of Clinical Oncology.
2007;37(4):287–95.
84.Vitale A, Morales RR, Zanus G, Farinati F, Burra P, Angeli P, et al. Barcelona Clinic Liver
Cancer staging and transplant survival benefit for patients with hepatocellular carcinoma:
a multicentre, cohort study. The Lancet Oncology. 2011;12(7):654–62.
85.Mazzaferro V, Regalia E, Doci R, Andreola S, Pulvirenti A, Bozzetti F, et al. Liver
transplantation for the treatment of small hepatocellular carcinomas in patients with
cirrhosis. The New England Journal of Medicine. 1996;334(11):693–9.
86.Llovet JM, Real MI, Montana X, Planas R, Coll S, Aponte J, et al. Arterial embolisation or
chemoembolisation versus symptomatic treatment in patients with unresectable
hepatocellular carcinoma: A randomised controlled trial. Lancet. 2002;359(9319):
1734–9.
87.Lo CM, Ngan H, Tso WK, Liu CL, Lam CM, Poon RT, et al. Randomized controlled trial of
transarterial lipiodol chemoembolization for unresectable hepatocellular carcinoma.
Hepatology. 2002;35(5):1164–71.
88.Cheng AL, Kang YK, Chen Z, Tsao CJ, Qin S, Kim JS, et al. Efficacy and safety of sorafenib
in patients in the Asia-Pacific region with advanced hepatocellular carcinoma: A phase III
randomised, double-blind, placebo-controlled trial. The Lancet Oncology. 2009;10(1):
25–34.
89.Thein HH, Isaranuwatchai W, Campitelli MA, Feld JJ, Yoshida E, Sherman M, et al.
Healthcare costs associated with hepatocellular carcinoma: A population-based study.
Hepatology. (e-pub Jan 8, 2013).
Canadian Cancer Society
n
Canadian Cancer Statistics 2013
84
CHAPTER 7: Special topic: Liver cancer
TABLE 7.1 New cases and percent distribution for liver cancer by morphology, Canada*, 1992–2010
Total
New cases
All liver cancers
Morphology
Carcinoma
Hepatocellular carcinoma (HCC)
Cholangiocarcinoma
Other specific carcinoma
Unspecified, carcinoma
Hepatoblastoma
Sarcoma
Other specific types
Unspecified
Males
%
New cases
Females
%
New cases
%
20,368
100
15,063
100
5,305
100
16,354
14,650
833
347
524
220
136
31
3,627
80.3
71.9
4.1
1.7
2.6
1.1
0.7
0.2
17.8
12,358
11,328
479
221
330
132
84
17
2,472
82.0
75.2
3.2
1.5
2.2
0.9
0.6
0.1
16.4
3,996
3,322
354
126
194
88
52
14
1,155
75.3
62.6
6.7
2.4
3.7
1.7
1.0
0.3
21.8
* Actual incidence data were available up to 2010 for all provinces and
territories except for Quebec (2007).
Analysis by: Chronic Disease Surveillance and Monitoring Division, CCDP, Public Health Agency of Canada
Data source: Canadian Cancer Registry database at Statistics Canada
TABLE 7.2 HCC treatment strategies by stage* of disease
Stage
Definition
Very early
Single, asymptomatic lesion measuring less than 2 cm in
diameter, with no vascular or distant metastases
Early
Single lesion or fewer than 3 lesions (each smaller than 3 cm)
Intermediate
Multinodular disease (either >3 nodules or 2–3 nodules with
at least 1 nodule >5 cm)
Spread beyond the liver to local nodes or distant sites, or
invasion of portal vein or hepatic vein by tumour
Advanced
Canadian Cancer Society
n
Canadian Cancer Statistics 2013
Option
• Local ablation with radiofrequency ablation (RFA) or
resection(27, 83)
• Resection can only be offered to people with no or
minimal evidence of liver failure or of portal hypertension.
• RFA can be offered to people with more advanced liver
disease, but those with the most advanced liver disease
can only benefit from liver transplantation,(84) but then
only if the cancer is at an early stage.
• Resection, liver function allowing
• People with early stage disease are also candidates for
liver transplantation.(85)
• Chemoembolization has also been offered to people with
early stage disease, but the benefit of chemoembolization
in these people has not yet been demonstrated.
• Chemoembolization(86, 87)
• Sorafenib, an oral multikinase inhibitor(70, 88)
• The role of transarterial chemoembolization (TACE)
remains to be defined.
HCC=hepatocellular carcinoma
* Based on the Barcelona Clinic Liver Cancer (BCLC) staging system.(26)
85
CHAPTER 7: Special topic: Liver cancer
TABLE 7.3 Five-year relative survival ratios (RSRs) for primary liver cancer by sex and age group, Canada (excluding Quebec*), 2006–2008
Both sexes
Males
Females
RSR (%)
(95% CI)
RSR (%)
(95% CI)
RSR (%)
(95% CI)
20
38
23
22
15
7
(18–22)
(32–43)
(20–26)
(18–25)
(12–18)
(4–11)
20
34
22
22
16
6
(18–22)
(27–40)
(19–25)
(18–26)
(12–19)
(3–11)
19
46
28
21
12
7
(16–22)
(32–58)
(20–36)
(15–28)
(7–18)
(3–13)
All ages (15–99 years)
15–49
50–59
60–69
70–79
80–99
CI=confidence interval
* Data from Quebec were excluded, in part, because the method for
ascertaining the date of cancer diagnosis differs from the method used by
other provinces and territories and because of issues in correctly
ascertaining the vital status of cases.
Analysis by: Health Statistics Division, Statistics Canada
Data sources: Canadian Cancer Registry and Canadian Vital Statistics Death databases and life tables at Statistics Canada
TABLE 7.4 Observed survival of people diagnosed with HCC, by income quintile and treatment, Ontario, 1990–2009
Cases
Events
Survival (months)
1-year survival
2-year survival
5-year survival
Characteristics
N (%)
N
Median (95 % CI)
(%) (95% CI)
(%) (95% CI)
(%) (95% CI)
Overall
Income quintile
1 (lowest)
2
3
4
5 (highest)
HCC treatment*
Curative
Non-curative
Palliative
No treatment
5,481 (100)
4,181
9.2 (8.7–10.0)
45.2 (43.9–46.6)
29.8 (28.5–31.2)
13.2 (12.0–14.3)
1,323 (24.1)
1,196 (21.8)
1,030 (18.8)
915 (16.7)
893 (16.3)
1,024
905
776
692
667
8.5 (7.3–9.9)
8.9 (7.9–11.1)
10.5 (8.8–12.2)
10.4 (9.1–12.2)
8.8 (7.8–10.6)
43.5 (40.7–46.3)
44.9 (42.0–47.9)
47.2 (44.0–50.4)
46.7 (43.3–50.1)
45.4 (42.0–48.8)
29.0 (26.3–31.7)
29.4 (26.5–32.2)
31.1 (28.0–34.2)
30.6 (27.3–33.9)
30.9 (27.6–34.2)
11.9 (9.7–14.1)
12.6 (10.2–14.9)
13.8 (11.2–16.5)
12.9 (10.1–15.7)
15.3 (12.3–18.2)
1,637 (29.9)
890 (16.2)
1,906 (34.8)
2,034 (37.1)
766
627
1,755
1,765
44.4 (40.4–46.9)
21.4 (19.1–23.0)
8.8 (8.1–9.7)
4.2 (3.7–4.6)
82.1 (80.1–84.1)
65.6 (62.4–68.9)
42.7 (40.4–45.0)
27.6 (25.6–29.6)
68.1 (65.5–70.7)
45.1 (41.5–48.6)
24.3 (22.3–26.3)
15.4 (13.7–17.1)
40.4 (37.2–43.6)
19.9 (16.8–23.2)
7.8 (6.5–9.1)
3.7 (2.7–4.7)
HCC=hepatocellular carcinoma;
CI=confidence interval
* Included multiple treatments for
some people.
Adapted from: Jembere N, et al.(35)
Canadian Cancer Society
n
Canadian Cancer Statistics 2013
86
CHAPTER 7: Special topic: Liver cancer
TABLE 7.5 Mean net costs* of care for HCC (per 30 patient-days) by cost category and disease phase, Ontario, 1990–2009
Disease phase
Initial
Continuing care
Terminal
Cost category
Mean
(95% CI)
Mean
(95% CI)
Mean
(95% CI)
Total net costs
Outpatient visits
Emergency room visits
Same-day surgery
Acute inpatient care
Medications
Home care
Continuing care
Long-term care
7,134
3,815
150
59
2,734
232
139
19
–24
(5,644, 8,623)
(2,960, 4,670)
(96, 203)
(19, 99)
(1,990, 3,478)
(125, 339)
(93, 184)
(–26 ,63)
(–40, –7)
1,159
422
43
4
332
294
93
3
–42
(942, 1,376)
(306, 538)
(15, 71)
(–2, 10)
(245, 419)
(240, 349)
(17, 169)
(–32, 39)
(–67, –17)
10,265
2,927
430
36
6,725
67
294
208
–420
(7,990, 12,540)
(1,687, 4,167)
(269, 590)
(17, 54)
(5,597, 7,853)
(37, 97)
(215, 374)
(–197, 613)
(–486, –355)
HCC=hepatocellular carcinoma;
CI=confidence interval
*2010 Canadian dollars
Note: Categories are assigned as
initial phase (12 months after the
diagnosis), continuing care phase
(intermediate observation time) and
terminal phase (12 months prior to
death). Negative costs refer to no
increase in the net costs of
long-term care due to HCC.
Columns may not add to total.
Analysis based on: Thein HH, et al.(89)
Canadian Cancer Society
n
Canadian Cancer Statistics 2013
87
APPENDIX I: Actual data for new cases and deaths
TABLE A1 Actual data for new cases of cancer, Canada, 2007 (based on September 2012 CCR file; see Statistics Canada CANSIM Table 103-0553 for
availability of later data releases)
Cancer
All cancers
Oral (buccal cavity and pharynx)
Lip
Tongue
Salivary gland
Mouth
Nasopharynx
Oropharynx
Other and unspecified
Digestive organs
Esophagus
Stomach
Small intestine
Large intestine
Rectum
Anus
Liver
Gallbladder
Pancreas
Other and unspecified
Respiratory system
Larynx
Lung
Other and unspecified
Bone
Soft tissue (including heart)
Skin (melanoma)
Breast
Genital organs
Cervix
Body of uterus
Uterus, part unspecified
Ovary
Prostate
Testis
Other and unspecified
Urinary organs
Bladder
Kidney
Other urinary
Eye
Brain and central nervous system
Endocrine glands
Thyroid
Other endocrine
Hodgkin lymphoma†
Non-Hodgkin lymphoma†
Multiple myeloma†
Leukemia†
Mesothelioma†
All other and unspecified cancers
ICD-O-3 Site/Type*
Total
Males
Females
All invasive sites
C00–C14
C00
C01–C02
C07–C08
C03–C06
C11
C10
C09,C12–C14
C15–C26,C48
C15
C16
C17
C18,C26.0
C19–C20
C21
C22.0
C23
C25
C22.1,C24,C26.8–.9,C48
C30–C34,C38.1–.9,C39
C32
C34
C30–31,C33,C38.1–.9,C39
C40–C41
C38.0,C47,C49
C44 Type 8720–8790
C50
C51–C63
C53
C54
C55
C56
C61
C62
C51–52,C57,C58,C60,C63
C64–C68
C67
C64–C65
C66,C68
C69
C70–C72
C37,C73–C75
C73
C37,C74–C75
Type 9650–9667
See Table A7
Type 9731,9732,9734
See Table A7
Type 9050–9055
See Table A7
164,999
3,675
338
936
419
712
259
165
846
34,144
1,585
3,076
614
13,865
6,763
558
1,610
463
3,979
1,631
24,714
1,116
23,246
352
349
1,118
4,843
21,311
33,567
1,405
4,369
150
2,463
23,364
828
988
12,055
6,744
4,837
474
290
2,591
4,462
4,181
281
922
6,789
2,011
4,848
515
6,795
86,198
2,497
254
648
230
402
183
116
664
19,121
1,194
1,960
341
7,112
4,147
231
1,217
152
1,989
778
13,792
906
12,677
209
195
619
2,565
165
24,382
—
—
—
—
23,364
828
190
8,152
4,939
2,883
330
161
1,468
1,069
944
125
505
3,770
1,081
2,784
420
3,452
78,801
1,178
84
288
189
310
76
49
182
15,023
391
1,116
273
6,753
2,616
327
393
311
1,990
853
10,922
210
10,569
143
154
499
2,278
21,146
9,185
1,405
4,369
150
2,463
—
—
798
3,903
1,805
1,954
144
129
1,123
3,393
3,237
156
417
3,019
930
2,064
95
3,343
— Not applicable.
* Fritz A, Percy C, Jack A, Shanmugaratnam K, Sobin L, Parkin D, et al.
Editors. International Classification of Diseases for Oncology, Third Edition.
Geneva: World Health Organization; 2000.
ICD-O-3 histology types 9590–9992 (leukemia, lymphoma and multiple
myeloma), 9050–9055 (mesothelioma) and 9140 (Kaposi sarcoma) are
excluded from other specific organ sites.
†
Note: Numbers are for invasive cancers and in situ bladder cancers (except
for Ontario) but exclude non-melanoma skin cancer (basal and squamous).
Analysis by: Chronic Disease Surveillance and Monitoring Division, CCDP, Public Health Agency of Canada
Data source: Canadian Cancer Registry database at Statistics Canada
Canadian Cancer Society
n
Canadian Cancer Statistics 2013
88
APPENDIX I: Actual data for new cases and deaths
TABLE A2 Actual data for cancer deaths, Canada, 2009 (see Statistics Canada CANSIM Table 102-0552 for availability of later data releases)
All cancers
Oral (buccal cavity and pharynx)
Lip
Tongue
Salivary gland
Mouth
Nasopharynx
Oropharynx
Other and unspecified
Digestive organs
Esophagus
Stomach
Small intestine
Large intestine
Rectum
Anus
Liver
Gallbladder
Pancreas
Other and unspecified
Respiratory system
Larynx
Lung
Other and unspecified
Bone
Soft tissue (including heart)
Skin (melanoma)
Breast
Genital organs
Cervix
Body of uterus
Uterus, part unspecified
Ovary
Prostate
Testis
Other and unspecified
Urinary organs
Bladder
Kidney
Other urinary
Eye
Brain and central nervous system
Endocrine glands
Thyroid
Other endocrine
Hodgkin lymphoma
Non-Hodgkin lymphoma
Multiple myeloma
Leukemia
Mesothelioma
All other and unspecified cancers
ICD-10*
Total
Males
Females
C00–C97
C00–C14
C00
C01–C02
C07–C08
C03–C06
C11
C10
C09,C12–C14
C15–C25,C26.0,C26.8–.9,C48
C15
C16
C17
C18,C26.0
C19–C20
C21
C22.0,C22.2–.7
C23
C25
C22.1,C22.9,C24,C26.8–.9,C48
C30–C34,C38.1–.9,C39
C32
C34
C30–31,C33,C38.1–.9,C39
C40–C41
C38.0,C47,C49
C43
C50
C51–C63
C53
C54
C55
C56
C61
C62
C51–52,C57,C58,C60,C63
C64–C68
C67
C64–C65
C66,C68
C69
C70–C72
C37,C73–C75
C73
C37,C74–C75
C81
C82–C85,C96.3
C90.0, C90.2
C91–C95, C90.1
C45
See Table A7
71,125
1,065
17
259
107
173
92
104
313
19,115
1,685
1,911
175
6,599
2,008
89
841
238
3,981
1,677
19,670
439
19,106
125
147
471
1,019
4,990
6,873
370
504
358
1,597
3,745
29
270
3,633
1,910
1,547
176
30
1,867
306
182
124
126
2,597
1,289
2,473
421
5,033
37,452
721
9
169
68
97
58
80
240
10,704
1,264
1,177
92
3,422
1,175
38
647
75
1,985
867
11,016
368
10,567
81
80
228
634
46
3,803
—
—
—
—
3,745
29
29
2,409
1,330
974
105
14
1,102
146
86
60
71
1,419
699
1,394
355
2,611
33,673
344
8
90
39
76
34
24
73
8,411
421
734
83
3,177
833
51
194
163
1,996
810
8,654
71
8,539
44
67
243
385
4,944
3,070
370
504
358
1,597
—
—
241
1,224
580
573
71
16
765
160
96
64
55
1,178
590
1,079
66
2,422
Analysis by: Chronic Disease Surveillance and Monitoring Division, CCDP, Public Health Agency of Canada
Data source: Canadian Vital Statistics Death database at Statistics Canada
Canadian Cancer Society
n
Canadian Cancer Statistics 2013
— Not applicable.
*World Health Organization. International Statistical Classification of
Diseases and Related Health Problems, Tenth Revision. Volumes 1 to 3.
Geneva, Switzerland: World Health Organization; 1992.
89
APPENDIX I: Actual data for new cases and deaths
TABLE A3 Actual data for new cases for the most common cancers by sex and geographic region, Canada, most recent year* (based on September 2012 CCR file;
see Statistics Canada CANSIM Table 103-0553 for availability of later data releases)
New cases
Canada
BC
AB
SK
MB
ON
QC‡
NB
NS
PE
NL‡
YT
NT
NU
86,200
23,400
12,700
11,300
4,900
3,800
2,900
2,800
2,600
2,500
2,000
1,950
1,450
1,200
1,200
1,100
940
11,000
2,900
1,350
1,400
760
550
280
350
430
370
240
220
190
200
180
180
100
7,700
2,100
910
1,000
500
330
260
300
270
250
180
160
120
110
120
110
100
2,500
610
350
360
190
130
95
100
60
80
50
60
35
20
40
40
20
3,000
730
390
450
190
130
150
120
90
110
90
70
40
30
45
40
30
33,700
9,300
4,400
4,000
1,550
1,500
1,150
1,200
1,400
1,050
680
710
570
510
560
520
490
21,400
4,300
4,100
2,900
1,650
860
730
630
350
610
540
480
390
330
280
280
200
2,400
670
370
300
180
95
120
90
65
50
40
50
30
15
40
30
30
2,900
720
430
440
210
140
110
55
130
75
60
55
55
30
55
35
30
420
130
75
55
15
15
20
10
25
10
10
10
5
—
5
5
5
1,650
480
220
280
100
60
75
35
45
35
20
65
30
15
15
20
20
50
15
5
10
5
—
—
—
—
5
—
—
—
—
—
—
—
60
15
10
10
—
—
—
—
—
5
—
—
—
—
—
—
—
25
—
10
5
—
—
—
—
—
—
—
—
—
—
—
—
—
78,800
21,100
10,600
9,400
4,500
3,200
3,000
2,500
2,300
2,100
2,000
1,950
1,800
1,400
1,200
1,100
1,100
930
10,200
3,000
1,300
1,150
670
240
430
280
390
250
220
140
210
180
150
120
130
140
7,000
2,100
870
770
440
320
290
170
230
190
150
160
150
150
100
80
85
75
2,400
650
350
340
150
60
100
65
70
70
65
65
65
45
30
25
30
35
3,000
790
420
400
220
90
130
90
75
75
80
70
60
40
60
35
40
35
33,000
8,900
3,900
3,600
2,100
2,000
1,300
1,050
1,150
960
760
700
510
580
490
480
460
420
20,500
5,400
3,100
2,500
1,100
740
720
650
270
450
560
490
630
300
270
310
300
220
1,950
530
270
250
130
95
75
55
55
55
55
55
60
25
25
15
20
25
2,700
720
420
380
160
85
95
70
120
45
60
85
75
35
45
30
25
30
380
120
50
40
15
10
15
15
10
5
10
10
10
5
5
5
—
5
1,300
340
150
210
100
45
60
35
25
10
25
40
35
40
15
20
20
20
55
15
10
5
5
—
—
—
—
—
—
—
—
—
—
—
—
—
55
20
5
10
—
—
—
—
—
—
—
—
—
—
—
—
—
—
25
5
10
5
—
—
—
—
—
—
—
—
—
—
—
—
—
—
†
Males
All cancers
Prostate
Lung
Colorectal
Bladder§
Non-Hodgkin lymphoma
Kidney
Leukemia
Melanoma
Oral
Pancreas
Stomach
Brain
Liver
Esophagus
Multiple myeloma
Thyroid
Females
All cancers
Breast
Lung
Colorectal
Body of uterus
Thyroid
Non-Hodgkin lymphoma
Ovary
Melanoma
Leukemia
Pancreas
Kidney
Bladder§
Cervix
Oral
Brain
Stomach
Multiple myeloma
— Fewer than 3 cases per year.
* 2007 for Canada, Quebec; 2010
for British Columbia, Alberta,
Saskatchewan, Manitoba, Ontario,
New Brunswick, Nova Scotia, Prince
Edward Island, Newfoundland and
Labrador; 2006–2010 average for
Yukon, Northwest Territories,
Nunavut. The numbers of cases
from death certificate only for
Ontario and Newfoundland and
Labrador in 2008–2010 are
estimated.
Row totals may not equal the
total for Canada due to rounding
and difference in the most recent
year of data presented. Canada
totals include provincial and
territorial estimates.
†
The number of cases for some
cancers used to calculate the
overall 2013 estimates for this
province was underestimated.
‡
Ontario does not report in situ
bladder cases. If Ontario in situ
cases were included, it is estimated
that the total number of Ontario
bladder cancers would be 2,400
among men and 830 among
women.
§
Note: “All cancers” excludes the
estimated new cases of nonmelanoma skin cancer (basal and
squamous).
Analysis by: Chronic Disease Surveillance and Monitoring Division, CCDP, Public Health Agency of Canada
Data source: Canadian Cancer Registry database at Statistics Canada
Canadian Cancer Society
n
Canadian Cancer Statistics 2013
90
APPENDIX I: Actual data for new cases and deaths
TABLE A4 Actual age-standardized incidence rates (ASIR) for the most common cancers by sex and geographic region, Canada, most recent year*
(based on September 2012 CCR file; see Statistics Canada CANSIM Table 103-0553 for availability of later data releases)
Cases per 100,000
Canada
BC
AB
SK
MB
ON
QC‡
NB
NS
PE
NL‡
YT
NT
NU
467
126
69
61
27
20
16
15
14
13
11
11
8
6
6
6
5
386
102
47
49
26
19
13
10
15
12
8
8
7
6
7
6
4
417
112
52
56
28
18
17
13
14
12
10
9
6
6
6
6
5
406
97
56
58
30
22
17
16
10
12
8
10
7
7
4
6
4
435
105
57
63
27
19
17
20
12
15
12
9
6
6
4
6
5
441
121
57
52
21
20
16
15
18
13
9
9
8
7
7
7
7
479
95
92
65
37
19
15
16
8
13
12
11
9
6
7
6
4
477
130
74
59
36
20
19
24
13
10
7
10
6
7
3
6
7
471
113
69
71
34
22
9
18
22
11
9
9
10
9
5
6
5
455
131
82
56
17
17
8
21
29
9
9
13
5
5
—
3
7
493
135
65
83
30
19
12
21
13
11
6
21
10
4
4
5
6
330
92
46
46
25
—
—
—
—
11
—
—
—
—
—
—
—
403
97
67
80
—
—
—
—
—
23
—
—
—
—
—
—
—
382
—
170
60
—
—
—
—
—
—
—
—
—
—
—
—
—
365
99
48
41
21
18
14
11
11
10
9
8
8
8
6
5
5
4
324
98
40
33
21
9
14
9
14
8
5
7
6
7
4
5
4
4
342
100
44
37
21
16
14
8
11
9
8
7
7
8
4
5
4
4
348
95
48
45
22
11
15
10
11
10
9
8
9
8
3
4
4
5
369
100
50
45
27
14
16
12
10
9
8
9
7
6
5
7
4
4
376
103
43
38
24
27
15
12
14
11
8
8
5
8
6
6
5
5
377
102
56
43
20
17
13
12
6
9
9
10
11
7
6
5
5
4
351
96
45
42
22
20
13
10
10
12
9
9
10
7
3
5
3
4
386
103
56
50
22
15
13
9
19
6
11
8
10
6
4
6
3
4
364
115
45
38
15
11
15
13
13
8
8
9
6
9
4
7
—
4
360
90
38
55
29
17
16
9
7
3
11
6
8
15
6
3
5
6
335
91
65
45
22
—
—
—
—
—
—
—
—
—
—
—
—
—
386
96
60
89
—
—
—
—
—
—
—
—
—
—
—
—
—
—
375
53
152
76
—
—
—
—
—
—
—
—
—
—
—
—
—
—
†
Males
All cancers
Prostate
Lung
Colorectal
Bladder§
Non-Hodgkin lymphoma
Leukemia
Kidney
Melanoma
Oral
Pancreas
Stomach
Brain
Esophagus
Liver
Multiple myeloma
Thyroid
Females
All cancers
Breast
Lung
Colorectal
Body of uterus
Thyroid
Non-Hodgkin lymphoma
Ovary
Melanoma
Leukemia
Kidney
Pancreas
Bladder§
Cervix
Brain
Oral
Stomach
Multiple myeloma
— Fewer than 3 cases per year.
* 2007 for Canada, Quebec; 2010
for British Columbia, Alberta,
Saskatchewan, Manitoba, Ontario,
New Brunswick, Nova Scotia, Prince
Edward Island, Newfoundland and
Labrador; 2006–2010 average for
Yukon, Northwest Territories,
Nunavut. The numbers of cases
from death certificate only for
Ontario and Newfoundland and
Labrador in 2008–2010 are
estimated.
Canada totals include provincial
and territorial estimates.
†
The number of cases for some
cancers used to calculate the
overall 2013 estimates for this
province was underestimated.
‡
Ontario does not currently report
in situ bladder cancers.
§
Note: Rates for “All cancers”
excludes non-melanoma skin
cancer (basal and squamous).
Rates are age-standardized to the
1991 Canadian population.
Analysis by: Chronic Disease Surveillance and Monitoring Division, CCDP, Public Health Agency of Canada
Data source: Canadian Cancer Registry database at Statistics Canada
Canadian Cancer Society
n
Canadian Cancer Statistics 2013
91
APPENDIX I: Actual data for new cases and deaths
TABLE A5 Actual data for cancer deaths for the most common cancers by sex and geographic region, Canada, 2009*
(see Statistics Canada CANSIM Table 102-0522 and CANSIM Table 102-0552 for availability of later data releases)
Deaths
Canada
BC
AB
SK
MB
ON
QC
NB
NS
PE
NL
YT
NT
NU
37,500
10,600
4,600
3,700
2,000
1,400
1,400
1,350
1,250
1,200
1,100
970
720
700
650
630
4,800
1,200
570
550
310
210
160
200
190
120
140
130
110
80
110
75
3,100
790
380
370
170
100
130
100
120
90
95
95
60
70
55
55
1,200
300
140
180
65
50
50
50
40
30
35
35
15
25
10
15
1,350
390
160
170
60
40
60
50
55
35
25
50
25
25
15
15
13,700
3,500
1,650
1,400
720
550
540
500
520
480
440
330
280
260
260
290
10,000
3,400
1,150
780
500
350
370
330
230
310
270
240
170
180
160
130
1,000
340
110
90
55
40
25
30
35
30
25
30
20
15
10
15
1,300
350
190
120
65
55
45
35
50
25
45
25
20
25
20
30
180
40
20
25
10
5
5
10
10
5
5
5
5
5
5
—
770
230
130
65
25
20
10
20
20
45
15
25
10
15
5
15
35
10
5
5
—
—
—
—
—
—
—
—
—
—
—
—
25
5
5
—
—
—
—
—
—
—
—
—
—
—
—
—
20
10
5
—
—
—
—
—
—
—
—
—
—
—
—
—
33,700
8,500
4,900
4,000
2,000
1,600
1,200
1,100
860
770
730
590
580
570
420
390
370
340
4,200
1,050
590
490
240
230
160
120
85
85
80
65
85
65
65
55
30
50
2,700
650
400
280
170
140
95
95
60
65
55
55
35
50
40
30
40
35
1,000
270
140
110
65
45
40
30
20
20
25
25
15
20
15
10
25
10
1,300
310
190
180
70
60
45
35
40
20
25
15
25
30
15
10
20
20
12,400
2,900
1,900
1,450
750
610
450
430
370
290
270
240
230
200
160
170
140
130
9,100
2,500
1,350
1,050
540
390
300
270
220
210
220
160
150
150
80
80
80
90
920
240
130
120
60
45
25
35
10
20
25
15
10
15
10
10
10
5
1,200
310
150
160
70
45
40
35
40
30
20
5
20
20
25
10
10
10
180
50
25
20
10
5
5
5
5
5
0
5
5
10
—
5
5
—
610
140
75
90
30
25
15
15
10
15
15
10
10
15
10
10
10
—
30
5
5
5
—
—
—
—
—
—
—
—
—
—
—
—
—
—
20
5
5
5
—
—
—
—
—
—
—
—
—
—
—
—
—
—
20
5
—
5
—
—
—
—
—
—
—
—
—
—
—
—
—
—
†
Males
All cancers
Lung
Colorectal
Prostate
Pancreas
Non-Hodgkin lymphoma
Leukemia
Bladder
Esophagus
Stomach
Brain
Kidney
Oral
Multiple myeloma
Liver
Melanoma
Females
All cancers
Lung
Breast
Colorectal
Pancreas
Ovary
Non-Hodgkin lymphoma
Leukemia
Body of uterus
Brain
Stomach
Multiple myeloma
Bladder
Kidney
Esophagus
Melanoma
Cervix
Oral
— Fewer than 3 deaths per year.
* 2005–2009 average for Yukon,
Northwest Territories, Nunavut.
Row totals may not equal the total
for Canada due to rounding. Canada
totals include provincial and
territorial estimates.
†
Analysis by: Chronic Disease Surveillance and Monitoring Division, CCDP, Public Health Agency of Canada
Data source: Canadian Vital Statistics Death database at Statistics Canada
Canadian Cancer Society
n
Canadian Cancer Statistics 2013
92
APPENDIX I: Actual data for new cases and deaths
TABLE A6 Actual age-standardized mortality rates (ASMR) for the most common cancers by sex and geographic region, Canada, 2009*
(see Statistics Canada CANSIM Table 102-0522 and CANSIM Table 102-0552 for availability of later data releases)
Deaths per 100,000
Canada
BC
AB
SK
MB
ON
QC
NB
NS
PE
NL
YT
NT
NU
192
54
23
19
10
7
7
7
6
6
6
5
4
4
3
3
170
42
20
19
11
8
6
7
7
4
5
4
4
3
4
3
182
47
23
22
10
6
8
6
6
5
5
6
3
4
3
3
188
49
21
26
10
8
8
8
7
5
5
6
2
4
2
2
192
55
23
23
8
6
8
7
8
5
4
7
3
3
2
2
185
48
22
19
10
7
8
7
7
6
6
4
4
4
3
4
213
71
25
17
11
7
8
7
5
6
6
5
4
4
3
3
213
71
23
20
11
9
6
6
7
6
5
6
4
3
2
3
214
58
32
21
11
10
7
6
8
5
7
4
4
4
3
5
210
45
25
26
13
5
4
10
12
7
6
5
7
4
5
—
244
74
42
22
8
6
4
6
7
15
5
8
3
4
1
5
268
64
38
29
—
—
—
—
—
—
—
—
—
—
—
—
203
50
38
—
—
—
—
—
—
—
—
—
—
—
—
—
391
185
81
—
—
—
—
—
—
—
—
—
—
—
—
—
137
36
20
15
8
7
5
4
4
3
3
2
2
2
2
2
2
1
123
33
18
14
7
7
5
3
3
3
2
2
2
2
1
2
2
1
130
33
19
13
8
7
4
5
3
3
3
3
2
1
2
2
1
2
131
37
18
12
8
6
5
4
3
3
3
3
3
1
4
2
1
1
150
37
22
19
7
7
5
4
4
3
3
1
3
2
3
2
1
2
132
32
20
14
8
7
5
4
4
3
3
2
2
2
2
2
2
1
148
43
22
16
9
6
5
4
4
4
3
3
2
2
1
1
1
1
151
42
22
17
9
8
4
6
2
4
4
2
2
2
2
2
2
1
151
41
20
19
9
5
5
4
5
4
2
1
2
2
1
3
2
1
164
48
24
18
6
5
5
4
4
4
1
6
8
4
5
—
3
—
161
38
19
23
8
7
3
5
3
4
3
3
4
3
2
2
2
—
214
54
19
28
—
—
—
—
—
—
—
—
—
—
—
—
—
—
174
49
20
30
—
—
—
—
—
—
—
—
—
—
—
—
—
—
330
156
—
52
—
—
—
—
—
—
—
—
—
—
—
—
—
—
†
Males
All cancers
Lung
Colorectal
Prostate
Pancreas
Non-Hodgkin lymphoma
Leukemia
Bladder
Esophagus
Stomach
Brain
Kidney
Oral
Multiple myeloma
Liver
Melanoma
Females
All cancers
Lung
Breast
Colorectal
Pancreas
Ovary
Non-Hodgkin lymphoma
Leukemia
Body of uterus
Brain
Stomach
Multiple myeloma
Kidney
Bladder
Cervix
Esophagus
Melanoma
Oral
— Fewer than 3 deaths per year.
* 2005–2009 average for Yukon,
Northwest Territories, Nunavut.
Canada totals include provincial
and territorial estimates.
†
Note: Rates are age-standardized
to the 1991 Canadian population.
Analysis by: Chronic Disease Surveillance and Monitoring Division, CCDP, Public Health Agency of Canada
Data source: Canadian Vital Statistics Death database at Statistics Canada
Canadian Cancer Society
n
Canadian Cancer Statistics 2013
93
APPENDIX II: Data sources and methods
Data sources
Incidence data: The Canadian Cancer Registry
(CCR)
Actual cancer incidence data used in this publication
cover the period of 1984 to 2010 (except for Quebec,
for which data from the CCR were available for 1983 to
2007 in time for this publication). Data for 1992 to
2010 were obtained from the CCR(1) (September 2012
CCR Tabulation Master File), while data for earlier
years were retrieved from its predecessor, the National
Cancer Incidence Reporting System (NCIRS). The
NCIRS is a fixed, tumour-oriented database containing
cases diagnosed as far back as 1969.
• Incidence data originate with the provincial and
territorial cancer registries, which provide data
annually to Statistics Canada for inclusion in the
CCR.
• The CCR is a person-oriented database that includes
clinical and demographic information about
residents of Canada newly diagnosed with cancer.
• The Health Statistics Division at Statistics Canada
maintains the CCR. It links data internally to
identify duplicate person and tumour records. The
Health Statistics Division also links cancer data with
mortality data (described below) to ensure the
completeness and correctness of vital status
information and capture missed cancer cases. Both
linking procedures optimize the accuracy of
incidence, prevalence and survival statistics.
•
Canadian Cancer Society
n
Canadian Cancer Statistics 2013
• Cancer diagnoses are classified according to the
International Classification of Diseases for Oncology,
Third Edition (ICD-O-3).(2)
• Chapter 7: Special topic: Liver cancer uses incidence
data from 1970 onwards.
Mortality data: The Canadian Vital Statistics
— Death database (CVS: D)
• The actual cancer mortality data cover the period of
1984 to 2009 and were obtained from the CVS: D.(3)
• Death records originate with the provincial and
territorial registrars of vital statistics and are
provided regularly to Statistics Canada for inclusion
in the CVS: D.
• The CVS: D includes demographic and cause of
death information for all residents who died in
Canada between 1950 and 2009.
• Data are also included for Canadian residents who
died in some states of the United States, as Canada
currently receives abstracted death data from
approximately 10 states.
• The Health Statistics Division at Statistics Canada
maintains the CVS: D.
• Cause of death is classified according to the
International Statistical Classification of Diseases and
Related Health Problems, Tenth Revision (ICD-10).(4)
• Cancer deaths are those for which some form of
cancer, as certified by a physician, is the underlying
cause of death.
• Chapter 7: Special topic: Liver cancer uses mortality
data from 1970 onwards.
Population data: The Census of Canada
• Population estimates for Canada and the provinces
and territories are based on censuses conducted
every five years from 1981 through to 2006.
• Intercensal estimates prepared by Statistics Canada
are used for the years between these censuses, and
postcensal estimates are used for 2006 to 2011.(5)
• Projected population estimates are used for 2012 and
2013, as prepared by Statistics Canada under
assumptions of medium growth (scenario M1).(6) The
scenario M1 incorporates medium-growth and
historical trends (1981 to 2008) of interprovincial
migration.
• All population estimates include non-permanent
residents and are adjusted for net census undercoverage and Canadians returning from abroad.
Life tables
• Life tables are required to estimate relative survival.
Sex-specific provincial life tables are produced by
Statistics Canada.
• Data from the 1990 to 1992 life tables(7) were used for
follow-up in 1992 and 1993. Data from 1995 to 1997
life tables(8) were used for follow-up from 1994 to
1998. Data from the 2000 to 2002 life tables(9) were
used for follow-up from 1999 to 2003. Data from the
2005 to 2007 life tables were used for follow-up from
2004 to 2008.(10)
94
APPENDIX II: Data sources and methods
• Complete life tables were not available for Prince
Edward Island or the territories, so expected survival
proportions for these areas were derived from
abridged life tables for Canada, Prince Edward Island
and the territories using a method suggested by
Dickman et al. (11) Where this was not possible (i.e.,
for the territories from 1990 to 1992), complete
Canadian life table values were used.
• The method of Dickman et al. was also used to
extend, by single year of age, the 1990 to 1992 set of
provincial life tables for people aged 85–99 years.
Cancer definitions
• Cancers are generally defined according to the
groupings of ICD-O-3(2) for incidence and ICD-10(4)
for mortality (Table A7).
• Some definitions have changed slightly over time;
changes occurring since the 2004 edition of this
publication are outlined in Tables A8-1 and A8-2.
• For children and youth aged 0–14 years, cancers
were classified and reported according to the
International Classification of Childhood Cancer,
Third Edition (ICCC-3).(12) This system is most
appropriate for reporting childhood cancers because
it acknowledges the major differences between
cancers that develop during childhood and those
that occur later in life.
• The category “intracranial and intraspinal” excludes
non-malignant tumours.
• Bladder cancer includes bladder in situ carcinomas,
which are considered invasive for the purpose of
incidence reporting and are included for provinces
and territories except Ontario.
Canadian Cancer Society
n
Canadian Cancer Statistics 2013
Methods
Incidence and mortality rates
Records from each province or territory were extracted
from the relevant incidence or mortality files and then
classified by year of diagnosis or death and by sex,
five-year age group (0–4, 5–9,…, 80–84 and 85+ years)
and cancer type.
• Rates for each category were calculated by dividing
the number of cases or deaths in each category (i.e.,
province or territory, year, sex, age group, cancer
type) by the corresponding provincial or territorial
population figure. These formed the basis for
calculations of age-standardized rates and for
estimates beyond the most recent year of actual data.
• For the section Incidence and mortality by age and
sex, age-specific rates were computed for broader age
groups (0–19, 20–29, …, 70–79 and 80+ years) in the
same way.
• Age-standardized incidence rates (ASIR) and
mortality rates (ASMR) were calculated using the
direct method, which involves weighting the
age-specific rates for each five-year age group
according to the age distribution of the 1991
Canadian population:
1991 Canadian standard population
Age group
Population (per 100,000)
0–4
5–9
10–14
15–19
20–24
25–29
30–34
35–39
40–44
45–49
50–54
55–59
60–64
65–69
70–74
75–79
80–84
85+
Total
6,946.4
6,945.4
6,803.4
6,849.5
7,501.6
8,994.4
9,240.0
8,338.8
7,606.3
5,953.6
4,764.9
4,404.1
4,232.6
3,857.0
2,965.9
2,212.7
1,359.5
1,023.7
100,000
Figure B (Introduction) shows the number of deaths
avoided since the mortality rate for all cancers
combined peaked in 1988.
• The year 1988 was chosen as the baseline year when
the overall cancer mortality rate was at its highest for
Canadian men and women.
• The age-specific cancer mortality rates from 1988 for
males and females in each five-year age group were
applied to the age-specific populations for each of
the subsequent years up to 2007 to obtain the
expected number of deaths for each of those years if
the 1988 death rates prevailed.
• To obtain the excess deaths that would have
occurred, the expected deaths for each year were
summed and then the observed number of deaths
for each year was subtracted from this total.
95
APPENDIX II: Data sources and methods
Figure C (Introduction) shows the relative
contributions to the changes in the total number of
new cases and deaths that can be attributed to changes
in cancer risk and cancer control practices, population
size and aging of the population.
• The lowest solid line represents the total number of
new cancer cases (or deaths) that would have
occurred each year if the population size and age
structure had remained the same as they were in
1984. This line reflects the impact of changes in
cancer risk and cancer control practices.
• The middle line represents the number of new cases
(or deaths) that would have occurred if the age
structure of the population had remained the same
as it was in 1984. This line reflects the impact of
changes in cancer risk and population growth.
• The top line represents the number of new cases (or
deaths) that actually occurred and thus reflects the
combined impact of changes in risk, population
growth and aging of the population.
The series shown in Figure C were calculated as
follows:
• Uppermost series: the annual number of Canadian
cancer cases or deaths, for males or females
• Next-to-uppermost series: annual total population
multiplied by the annual age-standardized rate, using
the 1984 population distribution for males or
females as the standard weights
• Next-to-baseline series: the 1984 total population
multiplied by the annual age-standardized rate, using
the 1984 population distribution for males or
females as the standard weights
• Baseline (dotted line): the observed number of
Canadian cancer cases or deaths during 1984, for
males or females.
Canadian Cancer Society
n
Canadian Cancer Statistics 2013
Estimation of incidence (new cases) and
mortality (deaths) for 2013
Two methods were used to estimate incidence and
mortality data: the Nordpred Power5 regression model
and five-year averaging.
Nordpred Power5 modelling
The Nordpred Power5 regression model was the
primary method for estimating the number of new
cases and deaths in 2013 for each cancer type by sex
(except new cases of prostate cancer and nonmelanoma skin cancer; see Prostate cancer incidence
and Non-melanoma skin cancer incidence below)
reported in Tables 1.2 and 3.2. Nordpred is based on an
age-period-cohort Poisson regression model but has
enhancements that overcome difficulties in the
standard Poisson model and improve projection
accuracy.(13) Nordpred was developed into a software
package(14) and is now one of the most frequently used
methods for cancer projections worldwide.(15–19)
The Nordpred Power5 regression model was used
when the average annual number of cases for a type of
cancer for the most recent five years was greater than
50. The assumption underlying the Nordpred Power5
regression model is that the annual number of new
cases and deaths are independent Poisson random
variables with mean values equal to the product of the
population size for a particular year and the (true)
annual rate.
• A separate Nordpred Power5 regression model was
fit for each province, sex and type of cancer for the
period of 1986 to 2010 (1983 to 2007 for Quebec) for
incidence and 1985 to 2009 for mortality.
• The Nordpred Power5 regression model is Rap = (Aa
+ D∙p + Pp + Cc)5 where a, p and c represent age,
period and cohort, respectively, in five-year groups.
Input data were aggregated into five-year calendar
periods and 18 five-year age groups (described
above); cohorts were created synthetically by
subtracting age from period. Rap is the incidence/
mortality rate in age group a in calendar period p, Aa
is the age component for age group a, D is the common
linear drift parameter of period and cohort.(20) Pp is
the nonlinear period component of period p, and
Cc is the nonlinear cohort component of cohort c.
• Nordpred uses a goodness of fit test to choose the
number of five-year periods to be included in the
dataset used for calculating future values (projection
base).
• The software determines whether the average trend
across all observed values, or the slope for the last
10 years of observed values, is used for projection,
based on a significance test for departure from linear
trend. This approach serves as an approximate way of
looking for significant changes in the observed trend.
The software also allows the user to make this
selection.
• For each age group, a minimum of five cases in each
five-year period was required; for age groups below
this limit, the average number of cases in the last two
periods is used to calculate future rates.
• To allow for a damping of the impact of current
trends in the future time periods, a “cut-trend”
option is used, which is a vector of proportions
indicating how much to cut the trend estimate for
each five-year projection period. A gradual reduction
in the drift parameter of 25% and 50% in the second
and third five-year period, respectively, was used as
the default in this publication.
96
APPENDIX II: Data sources and methods
• Age was included in all models as a factor. Agespecific incidence rate trends were then extrapolated
to 2013. The predicted numbers of cancer cases in
2013 were calculated by multiplying these
extrapolated incidence rates by the sex-, age- and
province-specific population projections for the
same year.
• The Nordpred “recent” and “cut-trend” options were
modified from the default values for selected types of
cancer, including thyroid cancer incidence and
prostate cancer mortality, since recent trends are not
expected to continue with as large an annual percent
change. The values were chosen so that estimates
were consistent with the most recent data available to
the provincial cancer registries.
Five-year averaging
New cases and deaths in 2013 for each type of cancer
were also estimated based on the average of the five
most recent years of data. This method may be more
realistic for cancers for which there are recent changes
in trend (the Nordpred Power5 regression model
results in poor estimates for these cancers because it is
based on a medium or longer term trend) or when
frequencies are low and result in unstable estimates
using the Nordpred model. The average of rates for the
most recent five years was calculated for each sex,
five-year age group, cancer type and province. The
predicted numbers were then obtained by multiplying
these rates by the corresponding projected population
sizes.
Canadian Cancer Society
n
Canadian Cancer Statistics 2013
Selection of “best” estimates
Estimates from the two methods were compared for
each sex, cancer type and geographic region for all ages
combined. The “best” estimate for each category was
selected in consultation with individual provincial or
territorial cancer registries, according to the following
guidelines:
• The Nordpred model was preferred except when
frequencies were low.
• Five-year average estimates were used when the
average annual number of cases during the most
recent five years was less than or equal to 50.
• Five-year average estimates were used for the
territories and are reported only for “all cancers”
because of small sample sizes.
• The absolute value of the difference between the
age-standardized rates estimated by the two methods
was calculated and expressed relative to the five-year
average estimate. For example, if the Nordpred
Power5 regression model estimated a rate of 4.0 and
the five-year average estimated a rate of 4.5, the
relative difference would be |4.0 – 4.5| ÷ 4.5, or
11.1%.
• Provinces closely examined estimates for cancers
where the absolute value of the relative difference
exceeded 15%. Such situations may be indicative of
important deviations from the long-term trend.
• Provinces provided feedback based on the
availability of in-house projections, knowledge of
local trends or access to more current data, which
permitted an assessment of the estimates produced
by the two different estimation methods.
• Estimates for Canada as a whole were computed as
sums of the estimates for the individual provinces
and territories.
Tables A9 and A10 indicate the cancer types that were
reported according to the five-year average method for
2013. In these situations, the age-standardized rates for
2013 reported in this publication were calculated using
the most recent five years of actual data.
All cancers combined
Provincial estimates of incidence counts for “all
cancers” for males were computed as the sum of the
“best” estimates for prostate cancer and all cancers
excluding prostate, as estimated by the Nordpred
modelling.
Prostate cancer incidence
The results of the Nordpred Power5 regression model
are not satisfactory for prostate cancer. An annual
age-specific trend Power5 projection model was fitted
to a minimum of seven and a maximum of nine years
of data, as selected by a goodness of fit test. The model
is Rap = (Aa + Da∙p)5, where a is age, p is period, Aa is
the age effect of age group a, Da is the slope parameter
at the ath age group, which takes the differentiation in
trend from different 10-year age groups into
consideration.
New cases of prostate cancer in 2013 were also
estimated based on the most recent year of data
available. This method may be more realistic when
there are recent changes in trend (the age-specific
trend model results in poor estimates for prostate
cancers because it is based on a medium-term trend).
The predicted numbers were then obtained by
multiplying these rates by the corresponding projected
population sizes.
97
APPENDIX II: Data sources and methods
Non-melanoma skin cancer incidence
Rounding for reporting
Only a few provinces routinely collect data on the
incidence of basal cell and squamous cell carcinoma of
the skin (generally referred to as non-melanoma skin
cancer, or NMSC). The numbers of NMSC in all of
Canada, by sex, were estimated using these data.
• Estimates of incidence and mortality presented in
this publication have been rounded as follows:
• Numbers between 0 and 99 were rounded to the
nearest 5.
• Numbers between 100 and 999 were rounded to
the nearest 10.
• Numbers between 1,000 and 1,999 were rounded
to the nearest 50.
• Numbers greater or equal to 2,000 were rounded
to the nearest 100.
• Percentages, age-standardized rates and age-specific
rates were rounded to the nearest 10th, except in
Tables 2.5, 4.5, A4 and A6, where space restrictions
forced rounding to the nearest whole number.
• Age-specific and sex-specific numbers or rates were
combined before rounding, so it is possible that the
totals in the tables do not add up. However, any such
discrepancies are within the precision of the
rounding units described above.
• Pathology laboratories in British Columbia send all
diagnostic reports of NMSC to the provincial
registry. The age- and sex-specific incidence rates in
British Columbia for 1992 to 1994 and 2003 were
projected to 2013 by the British Columbia Cancer
Registry and applied to the projected Canadian
population estimates to generate an estimate of the
number of cases for Canada as a whole.
• Counts of NMSC for 1992 to 2010 by year, sex and
age group were provided by the Manitoba Cancer
Registry and by the New Brunswick Cancer Registry.
Linear regressions using a logarithmic
transformation of the annual rates for each province
and age group (0–39, 40–59, 60–79 and 80+ years)
were conducted and projected to 2013. The predicted
numbers of NMSC cases for all of Canada were
calculated by multiplying the projected incidence
rates for each of Manitoba and New Brunswick by
the sex- and age-specific Canadian population
projections for 2013.
• Reported new cases of NMSC for all of Canada are
the average of 2013 estimates from British Columbia,
Manitoba and New Brunswick registries.
Canadian Cancer Society
n
Canadian Cancer Statistics 2013
Precision of 2013 estimates
Estimates of precision (standard errors, coefficients of
variation and confidence limits) for 2013 counts and
rates are available on request from the Chronic Disease
Surveillance and Monitoring Division (Centre for
Chronic Disease Prevention, Public Health Agency of
Canada). The precision of an estimate depends
primarily on the number of observed cases and the
population size for each combination of cancer type,
age, sex and province or territory.
Annual percent change (APC) in cancer
incidence and mortality rates
The estimated APC was calculated for each cancer type
by fitting a piecewise linear regression model,
assuming a constant rate of change in the logarithm of
the annual ASIR or ASMR in each segment. The
models incorporated estimated standard errors of the
ASIR or ASMR. The tests of significance used a Monte
Carlo Permutation method. The estimated slope from
this model was then transformed back to represent an
annual percentage increase or decrease in the rate.
• Joinpoint analysis was applied to annual agestandardized rates over the period of 1986 to 2007
(for incidence) and 1986 to 2009 (for mortality) to
determine years in which the APC changed
significantly; such years are referred to as
changepoints.
• A minimum of five years of data before and after a
changepoint was required for a new trend to be
identified. Thus, the most recent possible
changepoint is 2003 for incidence and 2005 for
mortality.
• If no changepoint was detected within the periods of
1998 to 2007 (for incidence) or 2000 to 2009 (for
mortality), then the APC was estimated by fitting a
model within these time periods, in the same way as
described above.
• If a changepoint was detected within these decades,
then the APC was estimated from the trend in the
last segment. Both the changepoint year and the
APC for the years beyond the changepoint are
indicated in Tables 1.5 and 3.5.
• Changepoints in incidence rates for 1970 to 2007
and mortality rates for 1970 to 2009 for liver cancer
are reported in Chapter 7: Special topic: Liver cancer.
98
APPENDIX II: Data sources and methods
Probability of developing or dying from cancer
Probabilities of developing or dying from cancer were
calculated according to the age- and sex-specific cancer
incidence and mortality rates for Canada in 2007 and
life tables based on all-cause mortality rates from 2006
to 2008. The methodology used was that of Zdeb(21)
and Seidman et al.(22)
• The method used for the probability of developing
cancer assumes that current age-specific incidence
rates will prevail throughout the future lifetime of a
person as he or she advances in age. Since this
assumption may not be true, the probabilities should
be regarded only as approximations.
• The probability of dying from cancer represents the
proportion of people who die of cancer in a cohort
subjected to the mortality conditions prevailing in
the population at large in 2007. It was estimated by
determining the proportion of deaths attributed to
specific types of cancer for each sex and age group,
multiplying this proportion by the corresponding
number of deaths in the life table and summing the
life table deaths over all sex and age groups to obtain
the probability of dying from each cause.
Relative survival
Five-year relative survival ratios (RSRs) were estimated
by comparing the actual survival experience of persons
diagnosed with cancer to that expected in the general
population of Canadians of the same age, sex, province
of residence and time period. It is computed as a ratio
and expressed as a percentage.
Canadian Cancer Society
n
Canadian Cancer Statistics 2013
• Deaths of people diagnosed with cancer are
identified through record linkage of the CCR to the
CVS: D, and from information reported by
provincial or territorial cancer registries. For deaths
reported by a registry but not confirmed by record
linkage, it was assumed that the individual died on
the date submitted by the reporting province or
territory. At the time of the analysis, registration of
new cases and follow-up for vital status were
complete through December 31, 2008.
• Analyses were based on all primary cancers. The
effect of including multiple cancers in survival
analyses has been studied both internationally(23,24)
and in Canada.(25)
• Analyses were based on those individuals aged
15–99 years at diagnosis.
• Persons whose diagnosis was established through
death certificate only or autopsy only were excluded.
• Analyses were based on a publicly available
algorithm,(26) with some minor adaptations. Expected
survival proportions were derived, using the Ederer
II approach,(27) from sex-specific provincial life tables
produced by Statistics Canada.
• Survival analyses were conducted using both period
(2006 to 2008) and cohort (1992 to 1994) analysis
methods.(28) The period approach to survival analysis
provides up-to-date predictions of cancer survival.(29)
With this method, follow-up data do not relate to a
fixed cohort of people with cancer. Rather, estimates
of period survival are based on the assumption that
persons diagnosed in the period of interest will
experience the most recently observed conditional
probabilities of survival. When survival is generally
improving, a period estimate tends to be a
conservative prediction of the survival that is
eventually observed.
• Conditional five-year relative survival expresses the
probability of surviving five years into the future at
various points since the time of diagnosis, relative to
the expected survival of a comparable group in the
general population.(30,31) It is calculated as per
five-year RSRs, except conditional RSRs are
estimated using people who have survived certain
amounts of time after the date of cancer diagnosis.
• As an indication of the level of statistical uncertainty
in the survival estimates, confidence intervals
formed from standard errors estimated using
Greenwood’s method(32) are provided. To avoid
implausible lower limits less than zero or upper
limits greater than one for observed survival
estimates, asymmetric confidence intervals based on
the log (–log) transformation were constructed. RSR
confidence limits were derived by dividing the
observed survival limits by the corresponding
expected survival proportion.
• Age-standardized estimates were calculated using
the direct method by weighting age-specific
estimates for a given cancer to the age distribution of
persons diagnosed with that cancer from 1992 to
2001. Confidence intervals for age-standardized
RSRs were formed by multiplying the corresponding
age-standardized observed upper and lower limits by
the ratio of the age-standardized relative survival
point estimate to the age-standardized observed
survival point estimate.
99
APPENDIX II: Data sources and methods
Prevalence
The primary type of prevalence reported in this
publication is tumour based. Two-, five- and 10-year
limited duration prevalences are estimated by the
numbers of cancers diagnosed in the previous two, five
and 10 years among people with cancer who are alive.
Estimating prevalence requires current, accurate
information about both the incidence and vital status
of cases. Because of issues in correctly ascertaining the
vital status of persons diagnosed while residing in
Quebec, the following approach was used:
• Cancer site-, sex- and age-specific limited duration
prevalences for all of Canada, excluding Quebec,
were determined directly using the counting
method.(33,34) Specifically, all primary invasive cancers
(including in situ bladder cancers) diagnosed among
persons residing outside of Quebec in the relevant
time period and alive on January 1, 2009, were
counted, regardless of whether they were first or
subsequent primaries.
• Sex- and age-specific population estimates for
January 1, 2009, were derived by averaging the 2008
and 2009 mid-year population estimates for all of
Canada, excluding Quebec.
• Cancer site-, sex- and age-specific limited duration
prevalence proportions for all of Canada, excluding
Quebec, were then estimated by dividing counts by
the appropriate population estimates.
• Cancer site-, sex- and age-specific counts for all of
Canada, including Quebec, were then obtained by
applying the prevalence proportions to Canadian
sex- and age-specific population estimates, which
included Quebec, and then summing across the
strata.
Canadian Cancer Society
n
Canadian Cancer Statistics 2013
• Person-based limited duration prevalences are
estimated as the number of individuals represented
in the tumour-based limited duration prevalences.
• Age-specific prevalence estimates were obtained
using the age attained as of January 1, 2009.
The above approach for estimating cancer prevalence
in Canada is different from that employed in previous
versions of this publication. The current approach’s
primary assumption is that sex- and age-specific
limited duration cancer prevalence proportions,
calculated using cancer cases and population estimates
from all of Canada excluding Quebec, are an accurate
estimate of cancer prevalence proportions within
Quebec.
Data and methods issues
Incidence
Although the Canadian Council of Cancer Registries
and its Standing Committee on Data Quality make
every effort to achieve uniformity in defining and
classifying new cancer cases, reporting procedures and
completeness still vary across the country. The
standardization of case-finding procedures, including
linkage to provincial or territorial mortality files, has
improved the registration of cancer cases and
comparability of data across the country. Some specific
issues remain:
• Benign tumours and carcinomas in situ are not
routinely captured or reported except for in situ
carcinomas of the bladder; all cancer registries
except Ontario report in situ bladder cancers to the
CCR.
• There may be under-reporting of cancer cases in
Newfoundland and Labrador due to incomplete
linkage of cancer data with death data. This underreporting could result in death counts or rates
exceeding those for incidence in a specific year; this
especially affects highly fatal cancers. The number of
“death certificate only” (DCO) cases for 2008 to 2010
in Newfoundland and Labrador was estimated from
2007 data.
• In Quebec, cases diagnosed through DCO are
incompletely captured prior to 2000. In addition,
because of the registry’s dependence on hospital data
for the period included in the present report, the
numbers of cases of some cancers are
underestimated, particularly for those where
pathology reports represent the main source of
diagnostic information. Prostate cancer, melanoma
and bladder cancer are affected in particular.(35) The
2013 estimates for these sites may be an
underestimate because an increase in cases in the
registry is expected with the inclusion of pathology
reports starting with 2011 data.
• The number of DCO cases for 2008, 2009 and 2010
in Ontario was estimated from the average of 2003 to
2007 data.
• The number of DCO cases is less than 2% of total
cases.
• Non-melanoma skin cancers are excluded since most
provincial and territorial cancer registries do not
collect information on these cases. These cancers are
difficult to register completely because they may be
diagnosed and treated in a variety of settings and are
very numerous. Estimates based on the three
registries that include these cancers (see Nonmelanoma skin cancer incidence above) are therefore
likely to be underestimates.
100
APPENDIX II: Data sources and methods
Mortality
Prevalence
Although procedures for registering and allocating
cause of death have been standardized both nationally
and internationally, some lack of specificity and
uniformity is inevitable. The description of cancer type
provided on the death certificate is usually less
accurate than that obtained by the cancer registries
from hospital and pathology records.
Because of issues in correctly ascertaining the vital
status of persons diagnosed while residing in Quebec,
prevalence data for this province were determined
indirectly (see the Methods section above). Prevalence
estimates were derived using the corresponding
observed prevalence proportion calculated for the rest
of Canada, stratified on age group, sex and cancer type.
Although there have been numerous small changes in
definitions over the years (see Tables A8-1 and A8-2),
there is one major earlier change of note:
• In the versions of this publication published before
2003, mortality due to colorectal cancer was based
on the International Classification of Diseases, Ninth
Revision (ICD-9),(36) codes 153–154, to be consistent
with other publications. However, this
underestimates colorectal cancer mortality by about
10% because most deaths registered as ICD-9 code
159.0 (intestine not otherwise specified) are cases of
colorectal cancer.
• Commencing with the 2003 edition, these deaths
were included in the definition of colorectal cancer.
As a consequence, mortality figures for colorectal
cancer appearing in this publication cannot be
directly compared with those appearing in
publications prior to 2003.
Survival
Cases diagnosed in the province of Quebec were
excluded from survival analyses, in part because the
method of ascertaining the date of diagnosis of cancer
cases in this province clearly differed from that of the
other provincial cancer registries,(37) and because of
issues in correctly ascertaining the vital status of cases.
Canadian Cancer Society
n
Canadian Cancer Statistics 2013
References
1. Statistics Canada. Canadian Cancer Registry. Available at: http://www23.statcan.gc.ca/
imdb/p2SV.pl?Function=getSurvey&SDDS=3207&lang=en&db=imdb&adm=8&dis=2
(Accessed Nov 19, 2012).
2. Fritz A, Percy C, Jack A, Shanmugaratnam K, Sobin L, Parkin D, et al., eds. International
Classification of Diseases for Oncology. 3rd ed. Geneva, Switerland: World Health
Organization; 2000.
3. Statistics Canada. Causes of death, 2009. Catalogue no. 84-208-X. Ottawa, ON: Minister
of Industry; 2012. Available at: http://www.statcan.gc.ca/pub/84-208-x/84-208x2012001-eng.htm (Accessed Nov 9, 2012).
4. World Health Organization. International Statistical Classification of Disease and Related
Health Problems, Tenth Revision. Volumes 1 to 3. Geneva, Switzerland: World Health
Organization; 1992.
5. Statistics Canada. Demographic Estimates Compendium 2011. Ottawa: Minister of
Industry; 2011. CANSIM table 051-0001 released on September 28, 2011.
6. Statistics Canada. Population Projections for Canada, Provinces and Territories 2009 to
2036. Catalogue no. 91-520-X. Ottawa, ON: Minister of Industry; 2010. Available at:
http://www.statcan.gc.ca/pub/91-520-x/91-520-x2010001-eng.htm (Accessed Nov 9,
2012).
7. Millar WJ, David P. Life Tables, Canada and the Provinces, 1990–1992. Ottawa, ON:
Ministry of Industry; 1995.
8. Duchesne D, Tully P, Thomas B, Bourbeau R. Life Tables, Canada, Provinces and Territories,
1995–1997. Ottawa, ON: Minister of Industry; 2002.
9. Statistics Canada. Life Tables, Canada, Provinces and Territories, 2000–2002. Ottawa, ON:
Minister of Industry; 2006.
10. Statistics Canada. Special request tabulation completed by Demography Division.
Statistics Canada; 2012.
11.Dickman PW, Auvinen A, Voutilainen ET, Hakulinen T. Measuring social class differences in
cancer patient survival: Is it necessary to control for social class differences in general
population mortality? A Finnish population-based study. Journal of Epidemiology and
Community Health. 1998;52(11):727–34.
12.Steliarova-Foucher E, Stiller C, Lacour B, Kaatsch P. International classifiaction of
childhood cancer, third edition. Cancer. 2005;103:1457–67.
13.Møller B, Fekjær H, Hakulinen T, et al. Prediction of cancer incidence in the Nordic
countries: empirical comparison of different approaches. Statistics in Medicine.
2003;22:2751–2766.
14.Fekjær H, Møller B. Nordpred software package. Available at:
http://www.kreftregisteret.no/software/nordpred (Accessed Dec 30, 2011).
15.Coupland VH, Okello C, Davies EA, et al. The future burden of cancer in London compared
with England. Journal of Public Health: Oxford Journals. 2010;32(1):83–89.
16.Aitken R, Morrell S, Barraclough H, et al. Cancer Incidence and Mortality Projections in
New South Wales, 2007 to 2011. Eveleigh, Australia: Cancer Institute NSW; 2008.
Available at: http://www.cancerinstitute.org.au/media/27770/2007-04_cancer_
incidence_mortality_projections_2007-2011.pdf (Accessed Dec 30, 2011).
17.Olsen AH, Parkin DM, Sasieni P. Cancer mortality in the United Kingdom: Projections to
the year 2025. British Journal of Cancer. 2008;99(9):1549–1554.
18.Møller H, Fairley L, Coupland V, et al. The future burden of cancer in England: Incidence
and numbers of new patients in 2020. British Journal of Cancer. 2007;96(9):1484–1488.
19.Møller B, Fekjær H, Hakulinen T, et al. Prediction of cancer incidence in the Nordic
countries up to the year 2020. European Journal of Cancer Prevention. 2002;11
Suppl 1:S1–96.
20.Clayton D, Schifflers E. Models for temporal variation in cancer rates. II: Age-period-cohort
models. Statistics in Medicine. 1987;6(4):469–481.
21.Zdeb MS. The probability of developing cancer. American Journal of Epidemiology.
1977;106(1):6–16.
22.Seidman H, Silverberg E, Bodden A. Probabilities of eventually developing and of dying of
cancer (risk among persons previously undiagnosed with the cancer). CA: A Cancer
Journal for Clinicians. 1978;28(1):33–46.
23.Brenner H, Hakulinen T. Patients with previous cancer should not be excluded in
international comparative cancer survival studies. International Journal of Cancer / Journal
International du Cancer. 2007;121(10):2274–8.
24.Rosso S, De Angelis R, Ciccolallo L, Carrani E, Soerjomataram I, Grande E, et al. Multiple
tumours in survival estimates. European Journal of Cancer. 2009;45(6):1080–94.
25.Ellison LF. Measuring the effect of including multiple cancers in survival analyses using
data from the Canadian Cancer Registry. Cancer Epidemiology. 2010;34(5):550–5.
26.Dickman PW. Population-based cancer survival analysis. 2000. Available at: http://www.
pauldickman.com/book/chapter1.pdf. (Accessed Jan 4, 2011).
27.Ederer F, Heise H. The effect of eliminating deaths from cancer on general population
survival rates, methodological note 11, End Results Evaluation section. National Cancer
Institute. 1959 (August).
28.Ellison LF, Gibbons L. Survival from cancer: Up-to-date predictions using period analysis.
Health Reports. 2006;17(2):19–30.
29.Ellison LF. An empirical evaluation of period survival analysis using data from the
Canadian Cancer Registry. Annals of Epidemiology. 2006;16(3):191–6.
30.Ellison LF, Bryant H, Lockwood G, Shack L. Conditional survival analyses across cancer
sites. Health Reports. 2011;22(2):21–5.
31.Henson DE, Ries LA. On the estimation of survival. Seminars in Surgical Oncology.
1994;10(1):2–6.
32 Greenwood M. The Errors of Sampling of the Survivorship Table, Volume 33 of Reports
on Public Health and Medical Subjects. London, UK: Her Majesty’s Stationery Office;
1926.
33.Feldman AR, Kessler L, Myers MH, Naughton MD. The prevalence of cancer. Estimates
based upon the Connecticut Tumor Registry. The New England Journal of Medicine.
1986;315:1394–7.
34.Gail MH, Kessler L, Midthune D, Scoppa S. Two approaches for estimating disease
prevalence from population-based registries of incidence and total mortality. Biometrics.
1999;55(4):1137–44.
35.Brisson J, Major D, Pelletier E. Evaluation of the completeness of the Fichier des tumeurs
du Québec. Institut national de la santé publique du Québec; 2003.
36.World Health Organization. International Classification of Diseases, Ninth revision.
Volumes 1 and 2, Geneva, Switzerland: World Health Organization; 1977.
37.Ellison LF, Gibbons L, Canadian Cancer Survival Analysis Group. Five-year relative survival
from prostate, breast, colorectal and lung cancer. Health Reports. 2001;13(1):23–34.
101
APPENDIX II: Data sources and methods
TABLE A7 Cancer definitions
Cancer
ICD-O-3 Site/Type (incidence)
Oral
Esophagus
Stomach
Colorectal
Liver
Pancreas
Larynx
Lung
Melanoma
Breast
Cervix
Body of uterus
Ovary
Prostate
Testis
Bladder (including in situ)
Kidney
Brain
Thyroid
Hodgkin lymphoma*
Non-Hodgkin lymphoma*
C00–C14
C15
C16
C18–C20, C26.0
C22.0
C25
C32
C34
C44 (Type 8720–8790)
C50
C53
C54–C55
C56.9
C61.9
C62
C67
C64.9, C65.9
C70–C72
C73.9
Type 9650–9667
Type 9590–9597, 9670–9719, 9724–9729, 9735, 9737, 9738
Type 9811–9818, 9823, 9827, 9837 all sites except C42.0,.1,.4
Type 9731, 9732, 9734
Type 9733, 9742, 9800–9801, 9805–9809, 9820, 9826,
9831–9836, 9840, 9860–9861, 9863, 9865–9867, 9869–9876,
9891, 9895–9898, 9910, 9911, 9920, 9930–9931, 9940,
9945–9946, 9948, 9963–9964
Type 9811–9818, 9823, 9827, 9837 sites C42.0,.1,.4
All sites C00–C80, C97 not listed above
Multiple myeloma*
Leukemia*
All other cancers
All other and unspecified cancers
(grouping used only in Tables A1 and A2)
All cancers
Canadian Cancer Society
n
Type 9140, 9740, 9741, 9750–9759, 9760–9769, 9950–9962,
9966, 9970–9989, 9991, 9992
C76.0–C76.8 (type 8000–9592)
C80.9 (type 8000–9592)
C42.0–C42.4 (type 8000–9592)
C77.0–C77.9 (type 8000–9592)
C44.0–C44.9 excluding type 8050–8084, 8090–8110,
8720–8790, 9590–9992
All invasive sites
Canadian Cancer Statistics 2013
ICD-10 (mortality)
C00–C14
C15
C16
C18–C20, C26.0
C22.0, C22.2–C22.7
C25
C32
C34
C43
C50
C53
C54–C55
C56
C61
C62
C67
C64–C65
C70–C72
C73
C81
C82–C85, C96.3
C90.0, C90.2
C91–C95, C90.1
All sites C00–C80, C97 not listed
above
C26.1, C44, C46, C76–C80, C88,
C96.0–.2, C96.7–.9, C97
* Histology types 9590–9992 (leukemia, lymphoma and multiple myeloma),
9050–9055 (mesothelioma) and 9140 (Kaposi sarcoma) are excluded from
other specific organ sites.
All invasive sites
Note: ICD-O-3 refers to the International Classification of Diseases for
Oncology, Third Edition.(2) ICD-10 refers to the International Statistical
Classification of Diseases and Related Health Problems, Tenth Revision.(4)
102
APPENDIX II: Data sources and methods
TABLE A8-1 Recent cancer definition changes in incidence
New definition
Bladder
Colorectal
Kidney
Lung
ICD-O-3 C67 (including in situ cancers, except
for Ontario since this province does not report
in situ bladder cancer)
ICD-O-3 C18–C20, C26.0
ICD-O-3 C64–C65
ICD-O-3 C34
Year changed
2006
ICD-O-3, C67 (not including in situ cancers)
2011
2008
ICD-O-3 C18–C21, C26.0
ICD-O-3 C64–C66, C68
ICD-O-3 C33-C34 (before 2006)
ICD-O-3 C34 (in 2006)
ICD-O-3 C33–C34 (in 2007)
ICD-O-3 C56, C57.0–C57.4
2008
Ovary
ICD-O-3 C56
Old definitions
2006
Note: According to ICD-O-3, incidence for bladder, colorectal, kidney, lung
and ovary cancers excludes histology types 9590–9992 (leukemia,
lymphoma and multiple myeloma), 9050–9055 (mesothelioma) and 9140
(Kaposi sarcoma). ICD-O-3 refers to the International Classification of
Diseases for Oncology, Third Edition.(2)
TABLE A8-2 Recent cancer definition changes in mortality
New definition
Colorectal
Kidney
Leukemia
Liver
ICD-10 C18–C20, C26.0
ICD-10 C64–C65
ICD-10 C91–C95, C90.1
ICD-10 C22.0, C22.2–C22.7
Lung
ICD-10 C34
Year changed
2012
2008
2008
2007
2008
Multiple myeloma
ICD-10 C90.0, C90.2
Ovary
All other and
unspecified cancers
ICD-10 C56
ICD-10 C44, C46, C76–C80, C88,C96.0–C96.2,
C96.7–C96.9, C97
Canadian Cancer Society
n
Canadian Cancer Statistics 2013
2008
2006
2007
Old definitions
ICD-10 C18–C21, C26.0
ICD-10 C64–C66, C68
ICD-10 C91–C95
ICD-10 C22 (before 2006)
ICD-10 C22.0, C22.2–C22.9 (in 2006)
ICD-10 C33–C34 (before 2006)
ICD-10 C34 (in 2006)
ICD-10 C33–C34 (in 2007)
ICD-10 C88, C90 (before 2007)
ICD-10 C90 (in 2007)
ICD-10 C56, C57.0–C57.4
ICD-10 C44, C46, C76–C80,C96.0–C96.2,
C96.7–C96.9, C97
Note: ICD-10 refers to the International Statistical Classification of Diseases
and Related Health Problems, Tenth Revision.(4)
103
APPENDIX II: Data sources and methods
TABLE A9 Use of five-year average method* for incidence projection by cancer type, sex and province, 2013
BC
M
AB
F
M
SK
F
All cancers
Lung
Breast
Colorectal
Prostate†
Bladder
Non-Hodgkin lymphoma
Melanoma
Kidney
Leukemia
Thyroid
Body of uterus
Pancreas
M
MB
F
M
ON
F
M
QC
F
M
NB
F
M
NS
F
M
PE
F
M
NL
F
M
F
l
l
n
n
n
n
n
n
l
l
n
l
n
n
n
n
l
n
l
l
n
l
n
l
n
l
n
l
n
l
n
l
n
l
l
l
Oral
Stomach
Brain
Ovary
Multiple myeloma
Liver
Esophagus
Cervix
Larynx
Hodgkin lymphoma
Testis
n
l
n
l
l
l
l
l
n
l
n
l
l
l
l
l
n
l
l
l
n
l
n
l
n
l
n
l
n
n
n
l
n
l
n
l
n
l
n
l
n
l
l
n
l
n
l
n
l
n
l
n
l
n
l
l
n
l
n
l
n
l
n
l
n
l
n
l
l
l
l
l
n
l
l
l
l
l
l
l
l
n
l
n
l
n
l
n
l
n
l
n
l
l
n
l
n
l
n
l
n
l
n
l
n
l
n
n
n
n
n
n
* Nordpred Power5 regression
model is the default for all provinces
except when the average annual
cases for the most recent five years
is less than or equal to 50, when
the five-year average estimate is the
default.
An annual age-specific trend
Power5 projection model is the
default for prostate cancer. In place
of the five-year average as an
alternative, the last available year of
data was used for prostate cancer
to better capture recent changes
observed for this cancer.
†
Note: For territories (not shown),
five-year average method was used
for “All cancers” because of small
numbers.
M = males; F = females. BC = British Columbia; AB = Alberta; SK = Saskatchewan; MB = Manitoba; ON = Ontario; QC = Quebec; NB = New Brunswick; NS = Nova Scotia; PE = Prince Edward Island; NL = Newfoundland and Labrador.
Canadian Cancer Society
n
Canadian Cancer Statistics 2013
104
APPENDIX II: Data sources and methods
TABLE A10 Use of five-year average method* for mortality projection by cancer type, sex and province, 2013
BC
M
AB
F
M
SK
F
All cancers
Lung
Colorectal
Breast
Pancreas
Prostate
Non-Hodgkin lymphoma
Leukemia
M
MB
F
M
ON
F
M
QC
F
M
NB
F
M
NS
F
M
PE
F
NL
M
F
M
F
n
l
n
l
l
n
l
l
n
n
n
l
l
Bladder
Stomach
Brain
Esophagus
Kidney
Ovary
Multiple myeloma
Oral
Melanoma
Liver
Body of uterus
Larynx
Cervix
n
l
n
l
n
l
n
l
l
n
l
n
l
n
l
n
l
l
n
l
n
l
n
l
n
l
n
l
n
l
l
n
l
n
l
n
l
n
l
n
l
n
l
n
l
n
l
n
l
n
l
n
l
n
l
l
n
l
l
n
l
n
l
n
l
n
l
l
n
l
l
n
l
n
l
n
l
n
l
n
l
l
n
n
l
n
l
n
l
n
l
n
l
n
l
n
l
l
n
l
n
l
n
l
n
l
n
l
n
l
l
n
l
n
l
n
l
n
l
n
l
n
l
l
n
l
n
l
n
l
n
l
n
l
n
l
l
l
l
l
n
l
l
l
l
n
l
l
l
l
l
n
l
l
l
n
l
l
l
n
l
l
l
n
l
l
* Nordpred Power5 regression
model is the default for all provinces
except when the average annual
deaths for the most recent five
years is less than or equal to 50,
when the five-year average estimate
is the default.
Note: For territories (not shown),
five-year average method was used
for “All cancers” because of small
numbers.
M = males; F = females. BC = British Columbia; AB = Alberta; SK = Saskatchewan; MB = Manitoba; ON = Ontario; QC = Quebec; NB = New Brunswick; NS = Nova Scotia; PE = Prince Edward Island; NL = Newfoundland and Labrador.
Canadian Cancer Society
n
Canadian Cancer Statistics 2013
105
APPENDIX III: Previous special topics, abbreviations and indices
Previous special topics
Special topics are related to current or ongoing issues in cancer surveillance or cancer control. In particular, they aim to provide an in-depth look at the Canadian context.
The following previous special topics are available at www.cancer.ca/statistics:
2011
Colorectal cancer
1998 International comparisons
2010 End-of-life care
Cancer in depth: Esophagus cancer
Cancer in depth: Kidney cancer
1997 Ten years of Canadian cancer statistics
1996 Prostate cancer
Direct costs of cancer in Canada, 1993
Evaluation of cancer estimates: 1987–1991
2009 Cancer in adolescents and young adults
(15–29 years)
2008 Childhood cancer (ages 0–14)
1995 Prevalence of cancer
Colorectal cancer
2007 Breast cancer
1993 Female breast cancer
2006 Progress in cancer control: screening
1991 Smoking and lung cancer
Cancer among the Inuit and Indians
2005 Progress in cancer prevention: modifiable risk factors
2004 International variation in cancer incidence,
1993–1997
Economic burden of cancer in Canada, 1998
2003 Non-Hodgkin’s lymphoma
2002 Cancer incidence in young adults
Five-year relative cancer survival in Canada, 1992
2001 Colorectal cancer
2000 Progress in cancer control
1999 Factors contributing to the population burden
of cancer incidence and mortality
A new national cancer surveillance system
for Canada
Canadian Cancer Society
n
Canadian Cancer Statistics 2013
1990 Cancer of the female breast and genital organs –
recent trends
Hodgkin’s disease and cancer of the testis
Cancer mortality by income quintile
Economic cost of illness in Canada
Cancer control
1989 Cancer incidence and mortality: an international
comparison
1988 Tobacco consumption from smoking and mortality
from lung cancer
Cancer mortality: an international comparison
106
APPENDIX III: Previous special topics, abbreviations and indices
Abbreviations
AAPC
Average annual percent change
APC
Annual percent change
ASIR
Age-standardized incidence rate
ASMR
Age-standardized mortality rate
CCR
Canadian Cancer Registry
CCS
Canadian Cancer Society
CI
Confidence interval
CVS: D Canadian Vital Statistics – Death database
DCO
Death certificate only
HBV
Hepatitis B virus
HCC
Hepatocellular carcinoma
HCV
Hepatitis C virus
Canadian Cancer Society
n
Canadian Cancer Statistics 2013
ICCC-3 International Classification of Childhood Cancer,
Third Edition
ICD-10 International Statistical Classification of Diseases and
Related Health Problems, Tenth Revision
ICD-O-3 International Classification of Diseases for Oncology,
Third Edition
NCIRS
National Cancer Incidence Reporting System
NMSC
Non-melanoma skin cancer
PHAC
Public Health Agency of Canada
PSA
Prostate-specific antigen
PYLL
Potential years of life lost
RSR
Relative survival ratio
107
APPENDIX III: Previous special topics, abbreviations and indices
Index of tables and figures
Tables
1.1 Lifetime probability of developing cancer overall and
by age group, Canada, 2007 . . . . . . . . . . . . . . . . . 21
3.3 Age-standardized mortality rates (ASMR) for selected
cancers, males, Canada, 1984–2013 . . . . . . . . . . . 44
1.2 Estimated new cases and age-standardized incidence
rates (ASIR) for cancers by sex, Canada, 2013 . . . . . 22
3.4 Age-standardized mortality rates (ASMR) for selected
cancers, females, Canada, 1984–2013 . . . . . . . . . . 45
5.4 Five-year relative survival ratios (RSRs), conditional
on having survived the specified number of years,
for selected cancers, Canada (excluding Quebec),
2006–2008 . . . . . . . . . . . . . . . . . . . . . . . . . . . . . . . 63
1.3 Age-standardized incidence rates (ASIR) for selected
cancers, males, Canada, 1984–2013 . . . . . . . . . . . 23
3.5 Annual percent change (APC) in age-standardized
mortality rates (ASMR) for selected cancers, by sex,
Canada, 2000–2009 . . . . . . . . . . . . . . . . . . . . . . . 46
6.1 Tumour-based prevalence for selected cancers by
duration and sex, Canada, January 1, 2009 . . . . . . . 68
1.5 Annual percent change (APC) in age-standardized
incidence rates for selected cancers, by sex, Canada,
1998–2007 . . . . . . . . . . . . . . . . . . . . . . . . . . . . . 25
4.1 Estimated population and deaths for all cancers
by age group and sex, Canada, 2013 . . . . . . . . . . . 52
6.2 Age distribution for 10-year tumour-based prevalence
for the most common cancers by sex, Canada,
January 1, 2009 . . . . . . . . . . . . . . . . . . . . . . . . . . 69
4.2 Estimated deaths for the most common cancers
by age group and sex, Canada, 2013 . . . . . . . . . . . 52
6.3 Person-based prevalence for selected cancers by
duration and sex, Canada, January 1, 2009 . . . . . . . 70
2.1 Estimated population and new cases for all cancers
by age group and sex, Canada, 2013 . . . . . . . . . . . 31
4.3 Estimated population and deaths for all cancers
by sex and geographic region, Canada, 2013 . . . . . 53
2.2 Estimated new cases for the most common cancers
by age group and sex, Canada, 2013 . . . . . . . . . . . 31
4.4 Estimated deaths for selected cancers by sex and
province, Canada, 2013 . . . . . . . . . . . . . . . . . . . . 54
6.4 Ten-year person-based prevalence proportions for
the most common cancers by sex, Canada,
January 1, 2009 . . . . . . . . . . . . . . . . . . . . . . . . . . 71
2.3 Estimated population and new cases for all cancers
by sex and geographic region, Canada, 2013 . . . . . 32
4.5 Estimated age-standardized mortality rates (ASMR)
for selected cancers by sex and province, Canada,
2013 . . . . . . . . . . . . . . . . . . . . . . . . . . . . . . . . . . 55
1.4 Age-standardized incidence rates (ASIR) for selected
cancers, females, Canada, 1984–2013 . . . . . . . . . . 24
2.4 Estimated new cases for selected cancers by sex and
province, Canada, 2013 . . . . . . . . . . . . . . . . . . . . 33
2.5 Estimated age-standardized incidence rates (ASIR)
for selected cancers by sex and province, Canada,
2013 . . . . . . . . . . . . . . . . . . . . . . . . . . . . . . . . . . 34
5.1 Five-year relative survival ratios (RSRs) and observed
survival for selected cancers by sex, Canada
(excluding Quebec), 2006–2008 . . . . . . . . . . . . . . 61
3.1 Lifetime probability of dying from cancer, Canada,
2007 . . . . . . . . . . . . . . . . . . . . . . . . . . . . . . . . . . 42
5.2 Age-standardized five-year relative survival ratios (RSRs)
for the most common cancers by province, Canada
(excluding Quebec), 2006–2008 . . . . . . . . . . . . . . . . 62
3.2 Estimated deaths and age-standardized mortality
rates (ASMR) for cancers by sex, Canada, 2013 . . . . 43
Canadian Cancer Society
n
Canadian Cancer Statistics 2013
5.3 Five-year relative survival ratios (RSRs) for the most
common cancers by age group, Canada (excluding
Quebec), 2006–2008 . . . . . . . . . . . . . . . . . . . . . . 62
7.1 New cases and percent distribution for liver cancer
by morphology, Canada, 1992–2010 . . . . . . . . . . . 85
7.2 HCC treatment strategies by stage of disease . . . . . 85
7.3 Five-year relative survival ratios (RSRs) for primary
liver cancer by sex and age group, Canada
(excluding Quebec), 2006–2008 . . . . . . . . . . . . . . 86
7.4 Observed survival of people diagnosed with HCC,
by income quintile and treatment, Ontario,
1990–2009 . . . . . . . . . . . . . . . . . . . . . . . . . . . . . 86
7.5 Mean net costs of care for HCC (per 30 patient-days)
by cost category and disease phase, Ontario,
1990–2009 . . . . . . . . . . . . . . . . . . . . . . . . . . . . . 87
108
Index of tables and figures
Appendix tables
Figures
A1
Actual data for new cases of cancer, Canada, 2007 . 88
A2
Actual data for cancer deaths, Canada, 2009 . . . . . 89
A
Proportion of deaths due to cancer and other causes,
Canada, 2009 . . . . . . . . . . . . . . . . . . . . . . . . . . . 10
A3 Actual data for new cases for the most common
cancers by sex and geographic region, Canada,
most recent year . . . . . . . . . . . . . . . . . . . . . . . . . 90
B
Number of cancer deaths avoided (1989–2007)
since the cancer mortality rate peaked in Canada
in 1988 . . . . . . . . . . . . . . . . . . . . . . . . . . . . . . . . 11
A4
Actual age-standardized incidence rates (ASIR) for
the most common cancers by sex and geographic
region, Canada, most recent year . . . . . . . . . . . . . 91
C
A5
Actual data for cancer deaths for the most common
cancers by sex and geographic region, Canada,
2009 . . . . . . . . . . . . . . . . . . . . . . . . . . . . . . . . . 92
Trends in new cases and deaths for all cancers and
ages, attributed to cancer risk, population growth
and aging population, both sexes, Canada,
1984–2013 . . . . . . . . . . . . . . . . . . . . . . . . . . . . . 12
A6
A7
Actual age-standardized mortality rates (ASMR) for
the most common cancers by sex and geographic
region, Canada, 2009 . . . . . . . . . . . . . . . . . . . . . . 93
Cancer definitions . . . . . . . . . . . . . . . . . . . . . . . . 102
A8-1 Recent cancer definition changes in incidence . . . . 103
A8-2 Recent cancer definition changes in mortality . . . . 103
A9
Use of five-year average method for incidence
projection by cancer type, sex and province, 2013 . 104
A10 Use of five-year average method for mortality
projection by cancer type, sex and province, 2013 . 105
1.1 Lifetime probability of developing cancer, Canada,
2007 . . . . . . . . . . . . . . . . . . . . . . . . . . . . . . . . . . 14
1.2 Percent distribution of estimated new cancer cases,
by sex, Canada, 2013 . . . . . . . . . . . . . . . . . . . . . . 15
1.3 New cases and age-standardized incidence rates
(ASIR) for all cancers, Canada, 1984–2013 . . . . . . . 16
1.4 Age-standardized incidence rates (ASIR) for selected
cancers, males, Canada, 1984–2013 . . . . . . . . . . . 17
1.5 Age-standardized incidence rates (ASIR) for selected
cancers, females, Canada, 1984–2013 . . . . . . . . . . 18
2.1 Age-standardized incidence and mortality rates for
all cancers combined, by sex, Canada, 1984–2013 . 26
2.2 Distribution of new cancer cases for selected cancers
by age group, both sexes combined, Canada,
2003–2007 . . . . . . . . . . . . . . . . . . . . . . . . . . . . . 27
2.3 Age-standardized incidence rates (ASIR) for all
cancers, by age group, Canada 1984–2013 . . . . . . . 28
2.4 Geographic distribution of estimated new cancer
cases and age-standardized incidence rates (ASIR)
by province or territory, both sexes, Canada, 2013 . . 29
Canadian Cancer Society
n
Canadian Cancer Statistics 2013
3.3 Deaths and age-standardized mortality rates
(ASMR) for all cancers, Canada, 1984–2013 . . . . . . 37
3.4 Age-standardized mortality rates (ASMR) for selected
cancers, males, Canada, 1984–2013 . . . . . . . . . . . 38
3.5 Age-standardized mortality rates (ASMR) for selected
cancers, females, Canada, 1984–2013 . . . . . . . . . . 39
4.1 Age-standardized incidence and mortality rates for all
cancers combined, by sex, Canada, 1984–2013 . . . . 47
4.2 Distribution of cancer deaths for selected cancers
by age group, both sexes combined, Canada,
2005–2009 . . . . . . . . . . . . . . . . . . . . . . . . . . . . . 48
4.3 Age-standardized mortality rates (ASMR) for all
cancers, by age group, Canada 1984–2013 . . . . . . . 49
4.4 Geographic distribution of estimated cancer deaths
and age-standardized mortality rates (ASMR) by
province or territory, both sexes, Canada, 2013 . . . . 50
5.1 One, three, five and ten-year relative survival ratios
(RSR) for the most common cancers, Canada
(excluding Quebec), 2006–2008 . . . . . . . . . . . . . . 57
5.2 Age-standardized five-year relative survival ratio
(RSR) for selected cancers, both sexes combined,
Canada (excluding Quebec), 2006–2008 versus
1992–1994 . . . . . . . . . . . . . . . . . . . . . . . . . . . . . 59
6.1 Distribution of 10-year tumour-based prevalence for
selected cancers, Canada, January 1, 2009 . . . . . . . 65
6.2 Tumour-based prevalence for the most common
cancers by duration, Canada, January 1, 2009 . . . . . 66
7.1 Age-standardized incidence rates (1970–2007) and
mortality rates (1970–2009) for primary liver cancer,
Canada . . . . . . . . . . . . . . . . . . . . . . . . . . . . . . . . 73
3.1 Lifetime probability of dying from cancer, Canada,
2007 . . . . . . . . . . . . . . . . . . . . . . . . . . . . . . . . . . 35
7.2 Age-standardized five-year relative survival ratios
(RSRs) by sex, Canada, 1992–2003 . . . . . . . . . . . . 76
3.2 Percent distribution of estimated cancer deaths,
by sex, Canada, 2013 . . . . . . . . . . . . . . . . . . . . . . 36
7.3 Person-based prevalence of primary liver cancer by
duration and sex, Canada, January 1, 2009 . . . . . . . 77
109
For further information
Partner organizations
Canadian Council of Cancer Registries
Statistics Canada
Cancer incidence data are supplied to Statistics Canada
by provincial and territorial cancer registries. Detailed
information regarding the statistics for each province
or territory is available from the relevant registry.
www.statcan.gc.ca (search “cancer”)
Public Health Agency of Canada
www.phac-aspc.gc.ca (select “surveillance”)
More detailed information on the methodology used
in this publication is available from the Chronic
Disease Surveillance and Monitoring Division,
CCDP, Public Health Agency of Canada,
785 Carling Avenue, Ottawa, Ontario, K1A 0K9.
Tel: (613) 952-5176, Fax: (613) 941-2057.
Chronic Disease Infobase Cubes (www.infobase.
phac-aspc.gc.ca) is an interactive online tool for easy
access to cancer surveillance data. It allows you to
generate tables, chart and maps according to a choice
of parameters, such as cancer type, geographic area
and time period.
More detailed information on the methodology used
in this publication regarding survival and prevalence is
available from the Health Statistics Division, Statistics
Canada, National Enquiries Line (1-800-263-1136) or
the Health Statistics Division: (613) 952-5176. Custom
tabulations are available on a cost recovery basis upon
request. Analytical articles appear regularly in Health
Reports, Statistics Canada, Catalogue no. 82-003.
Detailed standard tables are available on the Statistics
Canada website (www.statcan.gc.ca).
Canadian Cancer Society
www.cancer.ca
For general information about cancer (such as cancer
prevention, screening, diagnosis, treatment or care),
contact the Canadian Cancer Society’s Cancer
Information Service at 1-888-939-3333 or the
Canadian Cancer Society, National Office or divisional
offices.
For information about research funded by the
Canadian Cancer Society, visit www.cancer.ca/research
or contact the Canadian Cancer Society Research
Institute, National Office, at [email protected].
Canadian Cancer Society
n
Canadian Cancer Statistics 2013
110
For further information
Canadian Council of Cancer Registries
NEWFOUNDLAND AND LABRADOR
NEW BRUNSWICK
MANITOBA
Elaine Warren
Director, Cancer Care Program
Eastern Health
Dr H. Bliss Murphy Cancer Centre
300 Prince Philip Drive
St. John’s, NL A1B 3V6
Dr Eshwar Kumar
Co-Chief Executive Officer
New Brunswick Cancer Network
Department of Health
Place Carleton Place, 2nd floor
520 King Street, PO Box 5100
Fredericton, NB E3B 5G8
Tel: (506) 453-5521
Fax: (506) 453-5522
Gail Noonan
Manager
Manitoba Cancer Registry
CancerCare Manitoba
675 McDermot Avenue, Room ON4025
Winnipeg, MB R3E 0V9
Tel: (709) 777-6521
Fax: (709) 753-0927
www.easternhealth.ca
PRINCE EDWARD ISLAND
Kim Vriends
Director, PEI Cancer Registry
PEI Cancer Treatment Centre
Riverside Drive
Charlottetown, PE C1A 8T5
Tel: (902) 894-2167
Fax: (902) 894-2187
NOVA SCOTIA
Maureen MacIntyre
Director
Surveillance and Epidemiology Unit
Cancer Care Nova Scotia
1276 South Park Street
Bethune Building, Room 569
Halifax, NS B3H 2Y9
Tel: (902) 473-6084
Fax: (902) 473-4425
www.cancercare.ns.ca
Canadian Cancer Society
n
Canadian Cancer Statistics 2013
www.gnb.ca/0051/cancer/index-e.asp
QUEBEC
Rabiâ Louchini
Pilote d’orientation du Fichier des tumeurs du Québec
Ministère de la Santé et Services sociaux
1075, Chemin Ste-Foy, 12e étage
Québec, QC G1S 2M1
Tel: (418) 266-6713
Fax: (418) 266-6779
http://msssa4.msss.gouv.qc.ca/santpub/
tumeurs.nsf/cat?OpenView
ONTARIO
Mary Jane King
Manager, Corporate Data Quality
Informatics Centre of Excellence
Cancer Care Ontario
620 University Avenue
Toronto, ON M5G 2L7
Tel: (416) 217-1260
Fax: (416) 217-1304
www.cancercare.on.ca
Tel: (204) 787-2573
Fax: (204) 786-0629
www.cancercare.mb.ca
SASKATCHEWAN
Heather Stuart-Panko
Provincial Leader Cancer Registry
Saskatchewan Cancer Agency
Parliament Place
400-2631 28th Avenue
Regina, SK S4S 6X3
Tel: (306) 359-5883
Fax: (306) 359-5604
www.saskcancer.ca
ALBERTA
Carol Russell
Director, Alberta Cancer Registry
Cross Cancer Institute
11560 University Avenue
Edmonton, AB T6G 1Z2
Tel: (780) 432-8781
Fax: (780) 432-8659
www.albertahealthservices.ca
111
For further information
YUKON
NORTHWEST TERRITORIES
Shauna Demers
Acting Director
Insured Health and Hearing Services
Box 2703 (H-2)
Whitehorse, YK Y1A 2C6
Heather Hannah
Epidemiologist
Disease Registries
Office of the Chief Public Health Officer
Department of Health and Social Services
Government of the NWT
Box 1320, 5022 49th Street
Centre Square Tower, 6th Floor
Yellowknife, NT X1A 2L9
Tel: (867) 667-5202
Fax: (867) 393-6486
www.hss.gov.yk.ca/insured_services.php
BRITISH COLUMBIA
Ryan Woods
Scientific Director, BC Cancer Registry
BC Cancer Agency
Cancer Control Research Unit
#2 – 116 – 675 West 10th Avenue
Vancouver, BC V5Z 1L3
Tel: (604) 675-8070
Fax: (604) 675-8180
www.bccancer.bc.ca
Tel: (867) 920-3241
Fax: (867) 873-0122
www.gov.nt.ca
STATISTICS CANADA
Josée Bégin
Director, Health Statistics Division
Main Building, Room 2200
Tunney’s Pasture
Ottawa, ON K1A 0T6
Tel: (613) 951-4041
Fax: (613) 951-0792
NUNAVUT
Mike Ruta
Territorial Epidemiologist
Acting Manager, Population Health Information
Nunavut Cancer Registry
Department of Health and Social Services
Box 1000, Station 1000
Iqaluit, NU X0A 0H0
www.statcan.gc.ca
Tel: (867) 975-5774 or 5700
Fax: (867) 975-5755 or 5780
Canadian Cancer Society
n
Canadian Cancer Statistics 2013
112
For further information
Canadian Cancer Society offices
NATIONAL
MANITOBA
ONTARIO
55 St. Clair Avenue West, Suite 300
Toronto, ON M4V 2Y7
193 Sherbrook Street
Winnipeg, MB R3C 2B7
55 St. Clair Avenue West, Suite 500
Toronto, ON M4V 2Y7
Tel: (416) 961-7223
Fax: (416) 961-4189
[email protected]
Toll-free: 1 888 532 6982
Tel: (204) 774-7483
Fax: (204) 774-7500
[email protected]
Toll-free: 1 800 268 8874
Tel: (416) 488-5400
Fax: (416) 488-2872
[email protected]
NEW BRUNSWICK
PRINCE EDWARD ISLAND
PO Box 2089
133 Prince William Street
Saint John, NB E2L 3T5
1 Rochford Street, Suite 1
Charlottetown, PE C1A 9L2
For more information about cancer:
[email protected]
1 888 939-3333
ALBERTA AND NORTHWEST TERRITORIES
325 Manning Road NE, Suite 200
Calgary, AB T2E 2P5
Toll-free: 1 800 661 2262
Tel: (403) 205-3966
Fax: (403) 205-3979
[email protected]
Tel: (506) 634-6272
Fax: (506) 634-3808
[email protected]
NEWFOUNDLAND AND LABRADOR
BRITISH COLUMBIA AND YUKON
565 West 10th Avenue
Vancouver, BC V5Z 4J4
PO Box 8921
Daffodil Place
70 Ropewalk Lane
St. John’s, NL A1B 3R9
Toll-free: 1 888 753 6520
Tel: (709) 753-6520
Fax: (709) 753-9314
[email protected]
Toll-free: 1 800 663 2524
Tel: (604) 872-4400
Fax: (604) 872-4113
[email protected]
NOVA SCOTIA
5826 South Street, Suite 1
Halifax, NS B3H 1S6
Toll-free: 1 800 639 0222
Tel: (902) 423-6183
Fax: (902) 429-6563
[email protected]
Canadian Cancer Society
n
Canadian Cancer Statistics 2013
Tel: (902) 566-4007
Fax: (902) 628-8281
[email protected]
QUEBEC
5151 de l’Assomption Blvd.
Montreal, QC H1T 4A9
Tel: (514) 255-5151
Fax: (514) 255-2808
[email protected]
SASKATCHEWAN
1910 McIntyre Street
Regina, SK S4P 2R3
Toll-free: 1 877 977 4673
Tel: (306) 790-5822
Fax: (306) 569-2133
[email protected]
113
Questions about cancer?
When you want to know more about cancer call
the Canadian Cancer Society’s Cancer Information Service
1-888-939-3333 Monday to Friday, 9 a.m. – 6 p.m.
cancer.ca


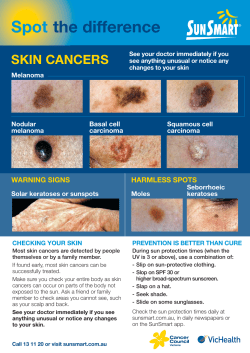


© Copyright 2026