
Systems Agronomic and Economic Evaluation of Cotton Varieties in
2014 Final Report submitted to Plains Cotton Growers Plains Cotton Improvement Program Systems Agronomic and Economic Evaluation of Cotton Varieties in the Texas High Plains Dr. Mark Kelley, Extension Agronomist—Cotton Ms. Kristie Keys, Extension Assistant—Cotton Texas A&M AgriLife Research and Extension Center Lubbock, Tx Systems Agronomic and Economic Evaluation of Cotton Varieties in the Texas High Plains 2014 Final Report Submitted to Plains Cotton Growers Plains Cotton Improvement Program Dr. Mark Kelley Extension Agronomist-Cotton Ms. Kristie Keys Extension Assistant Texas A&M AgriLife Extension Service Texas A&M AgriLife Research and Extension Center Lubbock, TX March, 2015 Trade names of commercial products used in this report are included only for better understanding and clarity. Reference to commercial products or trade names is made with the understanding that no discrimination is intended and no endorsement by the Texas A&M System is implied. Readers should realize that results from one experiment do not represent conclusive evidence that the same response would occur where conditions vary. Extension programs serve all people regardless of socioeconomic level, race, color, sex, religion, disability, or national origin. The Texas A&M System, U.S. Department of Agriculture, and the County Commissioners Courts of Texas Cooperating. i ACKNOWLEDGMENTS The authors thank the following for their support of this project: Plains Cotton Growers - Plains Cotton Improvement Program and Cotton Incorporated - Texas State Support Committee for funding Systems Variety Test Producer-Cooperators: Mark and David Appling - Blanco Rickey Bearden - Plains Mark and Ryan Williams- Farwell Texas A&M AgriLife Extension Service Cotton Program Student Workers: Mr. Tyler Higgins Ms. Britni Parker Ms. Emily Buchanan Ms. Kinzie Mathis Ms. Kendra Pennington Ms. Krysta Mathis Mr. Kevin Norman Mr. Chance Rollins Mr. Corbin Henzler Texas A&M AgriLife Extension Service Specialists and Assistants: Dr. Jourden Bell - Extension Agronomist, Amarillo Dr. Jason Woodward - Extension Pathologist, Lubbock Mr. Travis Brown- Research Assistant Mr. Preston Sirmon - Extension Assistant USDA-ARS Researcher: Dr. John Wanjura - USDA-ARS, Lubbock Companies: Americot/NexGen, Bayer CropScience (FiberMax and Stoneville), Delta and Pine Land/Monsanto, PhytoGen, Croplan, Syngenta, Chemtura, NuFarm Americas Inc., Nichino America ii Texas A&M AgriLife Extension Service Agents: Curtis Preston, CEA-AG/NR, Bailey County Jody Bradford, CEA-AG/NR, Carson County Nancy Anderson, CEA-AG/NR, Castro County Kerry Siders, EA-IPM, Cochran/Hockley Counties Caitlin Jackson, CEA-AG/NR, Crosby County Gary Roschetzky, CEA-AG/NR, Dawson County Tommy Doederlein, EA-IPM, Dawson/Lynn Counties Cristen Brooks, CEA-AG/NR, Floyd County Brandon McGinty, former CEA-AG/RF, Gray County Blayne Reed, EA-IPM, Hale/Swisher Counties Josh Brooks, CEA-AG/NR, Hall County Logan Newsom, former CEA-AG/NR, Lamb County Mark Brown, CEA-AG/NR, Lubbock County Marcel Fischbacher, CEA-AG/NR, Moore County Alexa Reed, CEA-AG/NR, Sherman County John Villalba, EA-AG/NR, Swisher County JW Wagner, former CEA-AG/NR, Yoakum County Texas A&M AgriLife Research: Dr. Jane Dever Dr. Terry Wheeler Dr. Wayne Keeling Dr. Peter Dotray Mr. Jim Bordovsky Mr. Casey Hardin Dr. Danny Carmichael Fiber and Biopolymer Research Institute - Texas Tech University: Dr. Eric Hequet Ms. Kathy Martin Texas Department of Agriculture - Fiber Initiative For funding of HVI analyses iii Table of Contents Title page. . . . . . . . . . . . . . . . . . . . . . . . . . . . . . . . . . . . . . . . . . . . . . . . . . . . . . . . . . . . . . . . . . i Acknowledgments.. . . . . . . . . . . . . . . . . . . . . . . . . . . . . . . . . . . . . . . . . . . . . . . . . . . . . . . . . . . ii Agronomic and Economic Evaluation of Cotton Varieties. . . . . . . . . . . . . . . . . . . . . . . . . . . . . . . . . . . . . . . . . . . . . . . . . 1 Summary. . . . . . . . . . . . . . . . . . . . . . . . . . . . . . . . . . . . . . . . . . . . . . . . . . . . . . . . . . . . . 1 Introduction. . . . . . . . . . . . . . . . . . . . . . . . . . . . . . . . . . . . . . . . . . . . . . . . . . . . . . . . . . . 2 Materials and Methods. . . . . . . . . . . . . . . . . . . . . . . . . . . . . . . . . . . . . . . . . . . . . . . . . . 2 Site Information. . . . . . . . . . . . . . . . . . . . . . . . . . . . . . . . . . . . . . . . . . . . . . . . . . . . . . . . 3 Results. . . . . . . . . . . . . . . . . . . . . . . . . . . . . . . . . . . . . . . . . . . . . . . . . . . . . . . . . . . . . . 5 Summary and Conclusions. . . . . . . . . . . . . . . . . . . . . . . . . . . . . . . . . . . . . . . . . . . . . . . 6 Acknowledgments. . . . . . . . . . . . . . . . . . . . . . . . . . . . . . . . . . . . . . . . . . . . . . . . . . . . . . 8 Tables. . . . . . . . . . . . . . . . . . . . . . . . . . . . . . . . . . . . . . . . . . . . . . . . . . . . . . . . . . . . . . . 9 Additional Replicated Irrigated Large Plot Variety Trials.. . . . . . . . . . . . . . . . . . . . . . . . . . 15 Replicated Sub-surface Drip Irrigated RACE Variety Trial Lonnie & Lloyd Arthur, Cone, TX - 2014. . . . . . . . . . . . . . . . . . . . . . . . . . . . . . 16 Replicated LEPA Irrigated RACE Variety Trial AGCARES/Lamesa Cotton Growers, Lamesa, TX - 2014. . . . . . . . . . . . . . . . . 22 Replicated LESA Irrigated RACE Variety Trial Terry Lindsey, Memphis, TX - 2014. . . . . . . . . . . . . . . . . . . . . . . . . . . . . . . . . . 28 Replicated Sub-surface Drip Irrigated RACE Variety Trial Cory Ayers, Levelland, TX - 2014 . . . . . . . . . . . . . . . . . . . . . . . . . . . . . . . . . . . 34 Replicated Sub-surface Drip Irrigated RACE Variety Trial Jeff Edwards, Amherst, TX - 2014 . . . . . . . . . . . . . . . . . . . . . . . . . . . . . . . . . . 40 Replicated Sub-surface Drip Irrigated RACE Variety and Harvest Method Trial Rhett Mimms, Acuff, TX - 2014 . . . . . . . . . . . . . . . . . . . . . . . . . . . . . . . . . . . . . 46 Replicated LESA Irrigated RACE Variety Trial Keith Harrison, Brownfield, TX - 2014. . . . . . . . . . . . . . . . . . . . . . . . . . . . . . . . 55 iv Texas Panhandle Cotton Variety Trials. . . . . . . . . . . . . . . . . . . . . . . . . . . . . . . . . . . . . . . . . 61 Introduction. . . . . . . . . . . . . . . . . . . . . . . . . . . . . . . . . . . . . . . . . . . . . . . . . . . . . . . . . . 61 Variety Characteristics.. . . . . . . . . . . . . . . . . . . . . . . . . . . . . . . . . . . . . . . . . . . . . . . . . 61 Materials and Methods. . . . . . . . . . . . . . . . . . . . . . . . . . . . . . . . . . . . . . . . . . . . . . . . . 62 Site Information. . . . . . . . . . . . . . . . . . . . . . . . . . . . . . . . . . . . . . . . . . . . . . . . . . . . . . . 63 Results. . . . . . . . . . . . . . . . . . . . . . . . . . . . . . . . . . . . . . . . . . . . . . . . . . . . . . . . . . . . . 64 Summary and Conclusions. . . . . . . . . . . . . . . . . . . . . . . . . . . . . . . . . . . . . . . . . . . . . . 65 Acknowledgments. . . . . . . . . . . . . . . . . . . . . . . . . . . . . . . . . . . . . . . . . . . . . . . . . . . . . 66 Tables. . . . . . . . . . . . . . . . . . . . . . . . . . . . . . . . . . . . . . . . . . . . . . . . . . . . . . . . . . . . . . 67 Additional Replicated Dryland Large Plot Variety Trials. . . . . . . . . . . . . . . . . . . . . . . . . . . 74 Replicated Dryland RACE Variety Trial AGCARES/Lamesa Cotton Growers, Lamesa, TX - 2014. . . . . . . . . . . . . . . . . 75 Replicated Dryland RACE Variety Trial Gary Nixon, Floydada, TX - 2014.. . . . . . . . . . . . . . . . . . . . . . . . . . . . . . . . . . . 81 Disease and Root-know Nematode Management.. . . . . . . . . . . . . . . . . . . . . . . . . . . . . . . . 86 Response of Commercially Available Cotton Cultivars to Verticilliam Wilt, Bacterial Blight, Root-knot Nematodes, and Fusarium Wilt Drs. Terry Wheeler and Jason Woodward. . . . . . . . . . . . . . . . . . . . . . . . . . . . . 87 2014 Sites Planted but Lost Due to Weather.. . . . . . . . . . . . . . . . . . . . . . . . . . . . . . . . . . . . 89 Farwell Irrigated Systems Variety Trial Mark and Ryan Williams, Farwell, TX 2014. . . . . . . . . . . . . . . . . . . . . . . . . . . . 90 Plains Dryland Systems Variety Trial Rickey Bearden, Plains, TX 2014.. . . . . . . . . . . . . . . . . . . . . . . . . . . . . . . . . . . 91 Replicated LESA Irrigated RACE Variety Trial Ray Haseloff, Bailey County, TX - 2014.. . . . . . . . . . . . . . . . . . . . . . . . . . . . . . 92 Replicated Dryland RACE Variety Trial Ronald Groves, Hale Center, TX - 2014. . . . . . . . . . . . . . . . . . . . . . . . . . . . . . 93 Replicated LESA Irrigated RACE Variety Trial Luke Steelman, Bovina, TX - 2014. . . . . . . . . . . . . . . . . . . . . . . . . . . . . . . . . . 94 V 2014 Lubbock Weather and Crop Information. . . . . . . . . . . . . . . . . . . . . . . . . . . . . . . . . . . 95 Evaluating Field Trial Data. . . . . . . . . . . . . . . . . . . . . . . . . . . . . . . . . . . . . . . . . . . . . . . . . . 103 vi 2014 Systems Agronomic and Economic Evaluation of Cotton Varieties March 2015 Dr. Mark Kelley, Extension Agronomist - Cotton Ms. Kristie Keys, Extension Assistant - Cotton Texas A&M AgriLife Extension Service Lubbock, TX Characteristics commonly evaluated in small-plot testing include lint yield, turnout percentages, fiber quality, and earliness. Current small-plot variety testing programs are inadequate in scale and design to investigate the economic impact of new transgenic varieties with value-added traits. The objective of this project was to evaluate the profitability of cotton varieties in producers' fields in the Texas High Plains. Three replications of each variety were included at all locations. In previous years, plots were of sufficient size to enable the combining of all replications of each individual variety into a single module at harvest. Variety modules would then be followed through the commercial ginning process. After several years of comparing results from commercial ginning and ginning of grab samples, a strong relationship was observed. Therefore, the decision was made by Extension personnel and the producers to forgo moduling and utilize grab samples from each plot at each location. Plot weights were determined at harvest using either a West Texas Lee Weigh Wagaon with integral electronic scales, or a Forage Systems flat-bed scale trailer, and bur cotton yields per acre were subsequently calculated by plot. After grab samples from each location and each plot were ginned, lint and seed turnout values were applied to bur cotton yields to determine lint and seed yield/acre. Lint samples resulting from the grab samples from each location were submitted to the Texas Tech University - Fiber and Biopolymer Research Institute for HVI fiber analyses and CCC lint loan values were calculated. In 2014, yields were relatively low compared to 2013 mostly due to delayed crop from early season cool temperatures across the Texas High Plains region. A total of three irrigated locations were initiated in 2014 at Farwell (15 varieties), Plains (20 varieties) and Mt. Blanco (15 varieties), and two dryland locations at Plains (10 varieties) and Mt. Blanco (15 varieties). All locations were well maintained by the cooperating producers, however, delayed planting at Plains, coupled with lower rainfall in July and August, resulted in lower lint yields. Lint yields at Plains ranged from 650 lb/acre to a low of 416 lb/acre for FiberMax 2011GT and Deltapine 1219B2RF, respectively. Loan values were low and values averaged $0.4473/lb across all varieties. Lint values averaged $235.73 across all varieties and net values ranged from a high of $300.95/acre (FiberMax 2011GT) to a low of $165.65/acre (Croplan 3787B2RF), a difference of $135.30. At the Mt. Blanco irrigated location, lint yields averaged 921 lb/acre and Deltapine 1441RF had the highest with 1054 lb/acre. Loan values ranged from $0.5812 for Croplan 3787B2RF to $0.5155 for NexGen 1511B2RF resulting in lint values ranging from a high of $577.15 for Deltapine 1441B2RF to a low of $366.35 for FiberMax 2011GT. Final net value ranged from a high of $611.79/acre (Deltapine 1441RF) to a low of $366.28/acre (FiberMax 2011GT), a difference of $245.51/acre. The Mt. Blanco dryland location observed an average lint yield of 845 lb/acre and loan values ranged from $0.5642 (Deltapine 1321B2RF) to $0.4822 (Stoneville 4747GLB2). Resulting lint values ranged from a high of $511.63 (PhytoGen 333WRF) to a low of $378.21 (FiberMax 1830GLT). Net values ranged from a high of $524.21/acre (NexGen 1511B2RF) to a low of $354.89/acre (FiberMax 1830GLT), a difference of $169.32/acre. These data indicate that substantial differences can be observed in terms of net value/acre due to variety and technology selection. When comparing the top and bottom varieties at the Plains and Mt. Blanco locations, differences were approximately $135, $246, and $169, respectively. Additional multisite and multi-year applied research is needed to evaluate varieties across a series of environments. 1 2014 Systems Agronomic and Economic Evaluation of Cotton Varieties March 2015 Dr. Mark Kelley, Extension Agronomist - Cotton Ms. Kristie Keys, Extension Assistant - Cotton Texas A&M AgriLife Extension Service Lubbock, TX Introduction Small-plot cotton variety testing generally includes evaluation of genetic components but not genetics in concert with management programs. Characteristics commonly evaluated in smallplot testing include lint yield, turnout percentages, fiber quality, and earliness. Over the last several years, High Plains cotton producers have increased planted acreage of transgenic cotton (glyphosate- and glufosinate-herbicide tolerant and Bt insect-resistant types) from approximately 300 thousand in 1997 to approximately 3 million in 2010. Industry continues to increase the number of herbicide-tolerant, insect-resistant, and "stacked gene" varieties. LibertyLink Ignite herbicide-tolerant varieties (from Bayer CropScience) were first marketed in 2004. The first commercial "stacked Bt gene" system (Bollgard II from Monsanto) was launched in 2004. Varieties containing Monsanto=s Roundup Ready Flex gene system were commercialized in 2006. Widestrike "stacked Bt gene" technology from Dow AgroSciences was available in some PhytoGen varieties in 2005, with additional Roundup Ready Flex "stacked" types in the market in 2006. LibertyLink with Bollgard II types were also commercialized in 2006. In 2011, Bayer CropScience made GlyTol and GlyTol stacked with LibertyLink available to producers in limited quantities. Furthermore, in 2012, Bayer introduced several GlyTol/LibertyLink varities stacked with Bollgard II technology. Finally, for 2014, Bayer introduced new varieties containing TwinLink technology. Additional cotton biotechnologies are also anticipated in 2015 and 2016. These technologies include Xtendflex from Monsanto/Deltapine and Enlist from Dow AgroSciences/PhytoGen. Xtendflex technology will impart resistance to three herbicide molecules, dicamba, glyphosate, and glufosinate. Varieties with Enlist technology will be resistant to a new, low-volatility, formulation of the 2,4-D herbicide. New transgenic varieties continue to be marketed in the High Plains by All-Tex, Americot/NexGen, Croplan, Delta and Pine Land/Monsanto, Dyna-Gro, the Bayer CropScience FiberMax/Stoneville brands, and the Dow AgroSciences PhytoGen brand. More transgenic varieties are expected to be released by these companies in the future. The proliferation of transgenic varieties in the marketplace is expected to continue over the next several years. Current small-plot variety testing programs are inadequate in scale and design to investigate the economic impact of new transgenic varieties with value-added traits. The objective of this project was to evaluate the profitability of cotton varieties in producers' fields in the Texas High Plains. Materials and Methods For scientific validity, three replications of each variety were included at all locations. In previous years, plots were of sufficient size to enable the combining of all replications of each individual variety into a single module at harvest. Variety modules would then be followed through the commercial ginning process. After several years of comparing results from commercial ginning and ginning of grab samples, a strong relationship was observed. Therefore, the decision was made by Extension personnel and the producers to forgo moduling and utilize grab samples 2 from each plot at each location. A randomized complete block design was used at all three locations. Weed and insect control measures, if needed, and harvest aid applications were performed commercially or by cooperating producers. Plots were harvested with commercial harvesters by producers with assistance provided by program personnel at all locations. Individual location information was as follows: Location 1: Farwell, TX – Parmer County At the Farwell location, fifteen varieties were planted to 30” straight rows on the flat to strip-till rows on 6-May with a seeding rate of approximately 45,000 seed per acre. This location was under a Low Elevation Spray Application (LESA) center pivot irrigation system and the previous crop was sorghum silage. Plot size was 8 rows by variable length due to center pivot. Unfortunately, this location was lost early in the season due to inclement weather event that took out several cotton fields in the area. Varieties planted at Farwell (LESA irrigation system): 1. Croplan 3006B2RF 2. Deltapine 1212B2RF 3. Deltapine 1321B2RF 4. Deltapine 1410B2RF 5. FiberMax 1320GL 6. FiberMax 1830GLT 7. FiberMax 2011GT 8. FiberMax 2322GL 9. NexGen 1511B2RF 10. NexGen 3306B2RF 11. NexGen 4111RF 12. PhytoGen 222WRF 13. PhytoGen 333WRF 14. PhytoGen 339WRF 15. Stoneville 4747GLB2 Location 2: Plains, TX – Yoakum County Twenty commercially available varieties were included at the Plains location. Varieties planted on 2-June contained Roundup Ready Flex herbicide technology, alone or stacked with, Bollgard II or Widestrike insect technologies, or GlyTol, and/or LibertyLink technology alone or stacked with Bollgard II or TwinLink insect technologies. Plots were variable length due to LESA center pivot irrigation and included 6 – 40” rows. The seeding rate at Plains was approximately 39,000 seeds/acre. Harvesting of plots was performed on and 19-December using producer provided equipment. Plot weights were taken using weigh trailers with integral digital scale systems. During harvest, grab samples were taken by plot for ginning at the Texas A&M AgriLife Research and Extension Center near Lubbock. Lint samples were collected during ginning and submitted to the Texas Tech University – Fiber and Biopolymer Research Institute for HVI fiber analysis. After lint quality determination, CCC loan values were calculated for each plot. It should be noted that this location was planted late and remained developmentally behind throughout the growing season. Therefore, yields and fiber quality were observed to be well below what has come to be expected from this location (See below). Varieties planted at Plains (LESA irrigation system): 1. 2. 3. 4. Croplan 3787B2RF Deltapine 1212B2RF Deltapine 1219B2RF Deltapine 1321B2RF 3 5. Deltapine 1410B2RF 6. Deltapine 1441B2RF 7. FiberMax 1320GL 8. FiberMax 1830GLT 9. FiberMax 2011GT 10. FiberMax 2322GL 11. FiberMax 2334GLT 12. FiberMax 2484B2F 13. NexGen 1511B2RF 14. NexGen 3306B2RF 15. NexGen 4111RF 16. PhytoGen 333WRF 17. PhytoGen Y 339WRF 18. PhytoGen 367WRF 19. Stoneville 4747GLB2 20. Stoneville 4946GLB2 Location 3: Mt Blanco, TX – Crosby County Fifteen varieties were planted to 40” raised bed rows on 8 and 9-May with an approximate seeding rate of 42,000 seed per acre. This was a 210 acre center pivot irrigated location, however, only ½ of the pivot was fully irrigated, the other half was considered dryland (sprinkler irrigated for stand establishment only). All varieties were planted to both the irrigated and dryland sides of the pivot. The rows were circular due to center pivot LEPA irrigation system. Plot sizes were 8 rows wide by variable length due to circular rows. Varieties planted to both irrigated and dryland contained Roundup Ready Flex herbicide technology, alone or stacked with Bollgard II or Widestrike insect technologies, or GlyTol, and/or LibertyLink technology, alone or stacked with Bollgard II or TwinLink insect technologies. Both the irrigated and dryland sides of the variety trial were harvested and analyzed separately. Harvest of both trials occurred on 15, 16 and 18-December using the producer/cooperator harvesting equipment. Harvest material was weighed by plot using a Forage Systems flat-bed scale trailer. Gin turnouts, HVI fiber quality and CCC lint loan values were determined from grab samples taken at harvest. Varieties planted at Mt. Blanco (LEPA irrigation system and dryland): 1. 2. 3. 4. 5. 6. 7. 8. 9. 10. 11. 12. 13. 14. 15. Croplan 3787B2RF Deltapine 1219B2RF Deltapine 1321B2RF Deltapine 1441B2RF FiberMax 1830GLT FiberMax 2011GT FiberMax 2334GLT FiberMax 2484B2F NexGen 1511B2RF NexGen 3306B2RF NexGen 4111RF PhytoGen 333WRF PhytoGen 339WRF Stoneville 4747GLB2 Stoneville 4946GLB2 4 Yield and HVI Results Agronomic and economic results by variety for the Plains and Mt. Blanco locations are included in tables 1 - 6. Location 1 - Farwell As stated above, this location was lost due to inclement weather and no data were collected. The field was planted back to sorghum following the loss. Location 2 – Plains Data from the Plains location indicated significant differences among varieties for most yield and economic parameters measured (Table 1). Lint turnout of field-cleaned bur cotton ranged from a high of 31.5% for FiberMax 2334GLT to a low of 27.3% for Deltapine 1219B2RF. Seed turnout averaged 47.6% across all varieties and differences were not significant. Bur cotton yields were relatively low due to the delayed planting and maturity, and averaged 1768 lb/acre. Differences in lint yield were observed among varieties, and values ranged from a high of 650 lb/acre to a low of 416 lb/acre for FiberMax 2011GT and Deltapine 1219B2RF, respectively. Seed yields averaged 841 lbs/acre across all varieties and Stoneville 4747GLB2 had the highest with 1018 lbs/acre. Loan values were low due to delayed maturity resulting in lower than usual micronaire values, color grade, and higher leaf values. Values averaged $0.4473/lb across all varieties and no differences were observed. After applying lint loan values to lint yield, lint values ($/acre) averaged $235.73 across all varieties and FiberMax 2011GT had the highest with $292.56/acre. After subtracting ginning and seed/technology fee costs from total value, net values ranged from a high of $300.95/acre (FiberMax 2011GT) to a low of $165.65/acre (Croplan 3787B2RF), a difference of $135.30. At this location, 8 varieties were in the statistical upper tier for net value. These included FiberMax 2011GT ($300.95/acre), FiberMax 2322GL ($297.76/acre), Stoneville 4747GLB2 ($289.80/acre), FiberMax 2334GLT ($266.63/acre), FiberMax 1830GLT ($266.10/acre), Deltapine 1212B2RF ($259.56/acre), NexGen 3306B2RF ($259.02/acre), and NexGen 4111RF ($255.81/acre). Classing data derived from grab samples are reported in Table 2. Micronaire values were considerably lower than usual and averaged 2.7. No differences were observed among varieties for micronaire. Staple length was highest for FiberMax 1830GLT (37.0) and lowest for NexGen 1511B2RF (33.8). The highest uniformity value of 82.3% was observed in both FiberMax 1830GLT and Deltapine 1212B2RF, and the test average was 81.3%. Strength values ranged from a high of 30.6 g/tex for NexGen 3306B2RF to a low of 27.2 g/tex for Croplan Genetics 3787B2RF and PhytoGen 333WF. Leaf grades were mostly 3, and color grades were mostly 31 across all varieties. Location 3 B Mt. Blanco (Irrigated) At the Mt. Blanco irrigated location, lint turnouts of field-cleaned bur cotton ranged from a high of 33.7% for FiberMax 1830GLT to a low of 30.4% for NexGen 4111RF (Table 3). Seed turnout averaged 45.4% across all varieties. An average bur cotton yield of 2837 lb/acre was also observed. Lint yields averaged 921 lb/acre and Deltapine 1441RF had the highest with 1054 lb/acre. Seed yields averaged 1288 lb/acre across varieties. Loan values derived from grab samples ranged from $0.5812 for Croplan 3787B2RF to $0.5155 for NexGen 1511B2RF. After applying lint loan values to lint yield, lint values 5 ($/acre) ranged from a high of $577.15 for Deltapine 1441B2RF to a low of $366.35 for FiberMax 2011GT. After subtracting ginning and seed/technology costs from total value (lint value + seed value), net value ranged from a high of $611.79/acre (Deltapine 1441RF) to a low of $366.28/acre (FiberMax 2011GT) and averaged $515.52/acre across all varieties. Seven varieties were included in the statistical upper tier with Deltapine 1441RF. These varieties included Deltapine 1219B2RF, PhytoGen 333WRF, Stoneville 4946GLB2, NexGen 4111RF, NexGen 3306B2RF, PhytoGen 339WRF, and Deltapine 1321B2RF, with net values of $596.01/acre, $585.21/acre, $568.10/acre, $554.77/acre, $543.83/acre, $529.91/acre, and $524.79/acre, respectively. Classing data derived from grab samples are reported in Table 4. Micronaire values were not significantly different and averaged 4.4 across all varieties. Staple length averaged 36.1 and was highest for NexGen 3306B2RF (37.9) and lowest for NexGen 1511B2RF (34.8). Uniformity averaged 82.2% and no differences were observed among varieties. Strength values averaged 31.3 g/tex and ranged from a high of 32.6 g/tex for NexGen 3306B2RF to a low of 29.3 g/tex for Stoneville 4747GLB2. Location 3 B Mt. Blanco (Dryland) At the Mt. Blanco dryland location, lint turnouts of field-cleaned bur cotton ranged from a high of 36.3% for NexGen 1511B2RF to a low of 28.8% for PhytoGen 339WRF (Table 5). Seed turnout averaged 43.9% across all varieties. An average bur cotton yield of 2690 lb/acre was also observed. Lint yields averaged 845 lb/acre and NexGen 1511B2RF had the highest with 924 lb/acre. Seed yields averaged 1184 lb/acre across varieties. Loan values derived from grab samples ranged from $0.5642 for Deltapine 1321B2RF to $0.4822 for Stoneville 4747GLB2. After applying lint loan values to lint yield, lint values ($/acre) ranged from a high of $511.63 for PhytoGen 333WRF to a low of $378.21 for FiberMax 1830GLT. After subtracting ginning and seed/technology costs from total value (lint value + seed value), net value ranged from a high of $524.21/acre (NexGen 1511B2RF) to a low of $354.89/acre (FiberMax 1830GLT) and averaged $453.84/acre across all varieties. Eight varieties were included in the statistical upper tier with NexGen 1511B2RF. These varieties included PhytoGen 333WRF ($519.59/acre), Deltapine 1219B2RF ($511.97/acre), FiberMax 2484B2F ($511.53/acre), Deltapine 1441RF ($492.67/acre), FiberMax 2334GLT ($483.47/acre), PhytoGen 339WRF ($467.52/acre), Deltapine 1321B2RF ($446.17/acre), and Stoneville 4946GLB2 ($438.34/acre). Classing data derived from grab samples are reported in Table 6. Micronaire values averaged 4.6 across varieties and ranged from a high of 5.3 (Stoneville 4946GLB2) to a low of 4.0 (Croplan 3787B2RF). Staple length averaged 35.5 and was highest for Deltapine 1321B2RF (36.9) and lowest for Stoneville 4747GLB2 (33.7). Uniformity averaged 81.5% and values ranged from a high of 82.5% for FiberMax 2484B2F to a low of 79.6% for Stoneville 4747GLB2. Strength values ranged from a high of 33.1 g/tex for NexGen 3306B2RF to a low of 28.4 g/tex for Stoneville 4747GLB2 and averaged 31.1 g/tex. Summary and Conclusions Characteristics commonly evaluated in small-plot testing include lint yield, turnout percentages, fiber quality, and earliness. Current small-plot variety testing programs are inadequate in scale and design to investigate the economic impact of new transgenic varieties with value-added traits. The objective of this project was to evaluate the 6 profitability of cotton varieties in producers' fields in the Texas High Plains. Three replications of each variety were included at all locations. In previous years, plots were of sufficient size to enable the combining of all replications of each individual variety into a single module at harvest. Variety modules would then be followed through the commercial ginning process. After several years of comparing results from commercial ginning and ginning of grab samples, a strong relationship was observed. Therefore, the decision was made by Extension personnel and the producers to forgo moduling and utilize grab samples from each plot at each location. Plot weights were determined at harvest using a West Texas Lee Weigh Wagaon with integral electronic scales, or a Forage Systems flat-bed scale trailer, and bur cotton yields per acre were subsequently calculated by plot. After grab samples from each location and each plot were ginned (Plains, Mt. Blanco Irrigated, and Mt. Blanco Dryland), lint and seed turnout values were applied to bur cotton yields to determine lint and seed yeilds/acre. Lint samples resulting from the grab samples from the Plains and Blanco locations were submitted to the Texas Tech University - Fiber and Biopolymer Research Institute for HVI fiber analyses and CCC lint loan values were calculated. In 2014, yields were relatively low compared to 2013 mostly due to delayed crop from early season cool temperatures across the Texas High Plains region. A total of three irrigated locations were initiated in 2014 at Farwell (15 varieties), Plains (20 varieties) and Mt. Blanco (15 varieties), and two dryland locations at Plains (10 varieties) and Mt. Blanco (15 varieties). All locations were well maintained by the cooperating producers, however, delayed planting at Plains, coupled with lower rainfall in July and August, resulted in lower lint yields. Lint yields averaged 525 lb/acre, 921 lb/acre, and 845 lb/acre at Plains, Mt. Blanco Irrigated and Mt. Blanco Dryland, respectively. Lint yields at Plains ranged from 650 lb/acre to a low of 416 lb/acre for FiberMax 2011GT and Deltapine 1219B2RF, respectively, and seed yields averaged 841 lb/acre. Loan values were low due to delayed maturity resulting in lower than usual micronaire values, color grade, and higher leaf values. Values averaged $0.4473/lb across all varieties and no differences were observed. After applying lint loan values to lint yield, lint values ($/acre) averaged $235.73 across all varieties. After subtracting ginning and seed/technology fee costs from total value, net values ranged from a high of $300.95/acre (FiberMax 2011GT) to a low of $165.65/acre (Croplan 3787B2RF), a difference of $135.30. At the Mt. Blanco irrigated location, lint yields averaged 921 lb/acre and Deltapine 1441RF had the highest with 1054 lb/acre. Loan values derived from grab samples ranged from $0.5812 for Croplan 3787B2RF to $0.5155 for NexGen 1511B2RF. Lint values ($/acre) ranged from a high of $577.15 for Deltapine 1441B2RF to a low of $366.35 for FiberMax 2011GT. After subtracting ginning and seed/technology costs, net value ranged from a high of $611.79/acre (Deltapine 1441RF) to a low of $366.28/acre (FiberMax 2011GT), a difference of $245.51/acre. At the Mt. Blanco dryland location, lint yields averaged 845 lb/acre and NexGen 1511B2RF had the highest with 924 lb/acre, and seed yields averaged 1184 lb/acre across varieties. Lint loan values ranged from $0.5642 for Deltapine 1321B2RF to $0.4822 for Stoneville 4747GLB2, resulting in lint values ($/acre) ranging from a high of $511.63 for PhytoGen 333WRF, to a low of $378.21 for FiberMax 1830GLT. After subtracting ginning and seed/technology costs, net value ranged from a high of $524.21/acre (NexGen 1511B2RF) to a low of $354.89/acre (FiberMax 1830GLT), a difference of $169.32/acre. 7 These data indicate that substantial differences can be observed in terms of net value/acre due to variety and technology selection. When comparing the top and bottom varieties at the Plains and Mt. Blanco Irrigated and Dryland locations, differences were approximately $135, $246, and $169, respectively. Additional multi-site and multi-year applied research is needed to evaluate varieties across a series of environments. Acknowledgments We wish to express our appreciation to the producer-cooperators: Mark and Ryan Williams of Farwell, Mark and David Appling of Mt. Blanco, and Rickey Bearden of Plains for providing the land, equipment and time to conduct these projects. Furthermore, we thank Dr. Jane Dever and Ms. Valerie Morgan – Texas A&M AgriLife Research for use of the ginning facilities at the Lubbock Center, and Dr. Eric Hequet – Texas Tech University Fiber and Biopolymer Research Institure for HVI fiber quality analyses. And finally, our deepest gratitude to Plains Cotton Growers – Plains Cotton Improvement Program and Cotton Incorporated – Texas State Support Committee for their generocity in funding for this and other research projects. 8 9 Seed turnout 1 841 985 992 1018 858 852 881 910 897 897 823 776 741 845 801 766 813 776 791 687 709 0.4473 0.4500 0.4545 0.4548 0.4870 0.4867 0.4682 0.4703 0.4617 0.4373 0.4707 0.4493 0.4467 0.4245 0.4235 0.4365 0.4305 0.4198 0.4217 0.4340 0.4185 235.73 292.56 292.36 288.54 274.88 276.21 261.10 255.10 241.71 251.02 247.34 234.57 215.23 209.66 214.93 214.65 205.06 192.32 189.28 180.41 177.66 123.15 124.00 127.31 107.27 106.44 110.08 113.73 112.10 112.15 102.88 96.98 92.69 105.59 100.10 95.77 101.68 96.98 98.87 85.82 88.68 - Seed/technology cost does not include any rebates that may be available from seed companies based on quantities purchased. Assumes: $3.00/cwt ginning cost. $250/ton for seed. Value for lint based on CCC loan value from grab samples and FBRI HVI results. 525 650 643 634 564 568 558 542 524 574 526 522 482 494 507 492 476 458 449 416 425 Seed value Total value Ginning cost Seed/technology 1 cost Net value 415.71 416.36 415.85 382.15 382.65 371.18 368.83 353.81 363.18 350.21 331.55 307.92 315.25 315.02 310.42 306.74 289.31 288.15 266.22 266.34 11.8 0.0057 10.37 53.05 64.24 64.71 64.41 53.83 54.86 53.69 54.06 53.79 57.87 51.15 50.56 48.24 51.10 50.79 48.86 50.80 49.81 48.72 45.61 43.92 ---- 56.38 50.52 53.89 61.64 61.69 61.69 57.93 55.75 44.22 58.84 53.89 55.75 48.21 57.62 59.80 61.64 57.93 57.62 57.62 54.65 56.77 a ab ab abc abc abcd abcde abcdef bcdefg bcdefg cdefgh defghi efghi fghi ghi ghi hi hi i i 13.8 <0.0001 52.67 231.41 300.95 297.76 289.80 266.63 266.10 259.56 259.02 255.81 246.47 245.17 225.23 211.47 206.53 204.43 199.92 198.01 181.88 181.81 165.96 165.65 ------------------------------------------------- $/acre ------------------------------------------------- Lint value 11.2 <0.0001 62.93 1768 2141 2157 2147 1794 1829 1790 1802 1793 1929 1705 1685 1608 1703 1693 1629 1693 1660 1624 1520 1464 $/lb Lint loan value CV, % 5.0 5.1 11.8 11.3 11.5 9.0 11.1 11.5 OSL 0.0325 0.3693 0.0058 0.0002 0.0048 0.6225 <0.0001 0.0047 LSD 2.5 NS 346 98 160 NS 43.23 19.95 For net value/acre, means within a column with the same letter are not significantly different at the 0.05 probability level. CV - coefficient of variation. OSL - observed significance level, or probability of a greater F value. LSD - least significant difference at the 0.05 level, NS - not significant. Note: some columns may not add up due to rounding error. 47.6 Seed yield 340.84 29.7 Test average 46.0 46.0 47.4 47.8 46.6 49.2 50.5 50.0 46.5 48.3 46.0 46.1 49.6 47.3 47.0 48.0 46.7 48.7 45.2 48.5 Lint yield ------------- lb/acre ------------- Bur cotton yield 105.11 30.4 29.8 29.5 31.5 31.0 31.2 30.1 29.2 29.8 30.8 31.0 30.0 29.0 30.0 30.2 28.1 27.6 27.6 27.3 29.0 -------- % -------- Lint turnout FiberMax 2011GT FiberMax 2322GL Stoneville 4747GLB2 FiberMax 2334GLT FiberMax 1830GLT Deltapine 1212B2RF NexGen 3306B2RF NexGen 4111RF FiberMax 2484B2F FiberMax 1320GL NexGen 1511B2RF Deltapine 1441RF PhytoGen 339WRF Deltapine 1321B2RF Stoneville 4946GLB2 Deltapine 1410B2RF PhytoGen 333WRF PhytoGen 367WRF Deltapine 1219B2RF Croplan 3787B2RF Entry Table 1. Harvest results from the Plains Irrigated Systems Cotton Variety Trial, Rickey Bearden Farm, Plains, TX, 2014. 10 35.2 81.3 80.5 82.3 80.6 81.1 81.0 81.6 81.4 82.3 81.6 81.7 82.1 81.2 81.4 81.8 82.0 80.0 80.2 81.5 81.6 80.3 CV, % 11.1 2.1 1.2 OSL 0.2099 0.0002 0.1445 LSD NS 1.2 NS CV - coefficient of variation. OSL - observed significance level, or probability of a greater F value. LSD - least significant difference at the 0.05 level, NS - not significant 2.7 Test average 34.3 35.7 35.3 34.7 36.3 34.9 34.5 37.0 35.3 36.2 36.2 35.7 33.8 35.5 34.6 35.0 34.0 35.3 35.4 34.9 % 32nds inch units 2.5 3.2 2.5 2.6 2.4 2.6 2.7 2.7 2.7 2.7 2.7 2.6 2.8 2.8 2.9 2.4 2.5 2.4 2.8 2.5 Uniformity Staple Micronaire Croplan 3787B2RF Deltapine 1212B2RF Deltapine 1219B2RF Deltapine 1321B2RF Deltapine 1410B2RF Deltapine 1441RF FiberMax 1320GL FiberMax 1830GLT FiberMax 2011GT FiberMax 2322GL FiberMax 2334GLT FiberMax 2484B2F NexGen 1511B2RF NexGen 3306B2RF NexGen 4111RF PhytoGen 333WRF PhytoGen 339WRF PhytoGen 367WRF Stoneville 4747GLB2 Stoneville 4946GLB2 Entry 4.1 0.0471 2.0 29.0 27.2 29.6 28.5 29.2 29.0 29.4 29.7 29.4 29.3 30.2 29.2 28.9 29.8 30.6 30.1 27.2 27.8 28.8 28.0 28.7 g/tex Strength 6.9 <0.0001 0.9 8.0 8.7 8.3 7.5 9.2 7.4 8.9 8.5 7.1 7.2 7.3 7.2 7.0 9.2 8.8 8.5 7.6 8.8 8.1 7.1 8.2 % Elongation 34.7 0.4065 NS 3.3 3.3 3.7 2.7 4.7 3.7 3.0 3.0 2.0 3.7 4.0 2.3 2.3 3.0 3.0 2.7 4.0 3.7 4.0 3.7 3.0 grade Leaf 3.0 0.5165 NS 72.8 73.3 73.0 71.4 71.1 73.0 73.2 75.0 75.1 72.6 72.5 75.3 72.9 72.1 73.4 71.8 71.4 73.0 72.7 71.2 71.7 reflectance Rd +b 8.0 0.2602 NS 9.7 9.7 9.5 10.8 9.9 9.4 10.2 9.5 8.9 9.0 9.4 9.9 10.3 9.8 9.7 10.5 9.6 9.2 9.7 8.9 10.0 yellowness Table 2. HVI fiber property results from the Plains Irrigated Systems Cotton Variety Trial, Rickey Bearden Farm, Plains, TX, 2014. ---- 3.2 3.0 3.7 3.0 3.3 3.7 2.7 2.7 3.3 3.7 3.7 2.3 3.0 3.0 3.0 3.0 3.3 3.3 3.0 4.0 3.7 color 1 ---- 1.9 2.0 2.0 2.7 2.0 1.7 2.3 1.3 1.3 1.7 1.7 1.7 2.3 2.0 2.0 2.7 2.0 1.7 2.0 1.7 2.0 color 2 Color grade 11 Seed turnout 1 1288 1458 1452 1418 1434 1408 1387 1347 1284 1300 1329 1123 1202 1108 1091 984 0.5447 0.5473 0.5452 0.5468 0.5508 0.5303 0.5650 0.5407 0.5445 0.5508 0.5275 0.5712 0.5155 0.5453 0.5695 0.5198 501.80 577.15 570.39 567.54 546.26 525.40 516.22 514.62 515.15 509.42 497.56 475.09 451.70 459.08 435.01 366.35 182.25 181.47 177.27 179.22 175.95 173.37 168.37 160.55 162.54 166.16 140.32 150.28 138.49 136.35 123.02 - Seed/technology cost does not include any rebates that may be available from seed companies based on quantities purchased. Assumes: $3.00/cwt ginning cost. $250/ton for seed. Value for lint based on CCC loan value from grab samples and FBRI HVI results. 921 1054 1046 1038 992 991 914 952 946 925 943 832 876 842 764 705 Seed value Total value Ginning cost Seed/technology 1 cost Net value 759.40 751.87 744.82 725.48 701.35 689.59 682.99 675.70 671.96 663.72 615.41 601.98 597.57 571.36 489.36 9.7 0.0006 13.77 85.10 94.45 95.60 96.08 89.41 97.83 84.29 89.55 84.97 87.68 89.24 74.36 80.36 75.00 70.28 67.38 ---- 62.22 53.16 60.26 63.53 67.96 48.76 61.47 63.53 65.94 68.02 67.96 62.59 61.47 68.02 64.87 55.70 a ab ab abc abc abcd abcd abcde bcde bcde cde de def ef f 10.5 0.0003 90.66 515.52 611.79 596.01 585.21 568.10 554.77 543.83 529.91 524.79 516.27 506.53 478.46 460.15 454.55 436.21 366.28 ------------------------------------------------- $/acre ------------------------------------------------- Lint value 9.4 0.0004 104.39 2837 3148 3187 3203 2980 3261 2810 2985 2832 2923 2975 2479 2679 2500 2343 2246 $/lb Lint loan value CV, % 6.2 4.6 9.7 9.6 9.5 5.1 9.4 9.5 0.0925† OSL 0.7916 0.0006 0.0008 0.0003 0.4345 0.0004 0.0003 LSD NS 2.9 459 147 206 NS 78.73 25.69 For net value/acre, means within a column with the same letter are not significantly different at the 0.05 probability level. CV - coefficient of variation. OSL - observed significance level, or probability of a greater F value. LSD - least significant difference at the 0.05 level, †indicates significance at the 0.10 level, NS - not significant. Note: some columns may not add up due to rounding error. 45.4 Seed yield 662.84 32.5 Test average 46.3 45.6 44.3 48.1 43.2 49.4 45.1 45.3 44.5 44.7 45.3 44.9 44.3 46.6 43.8 Lint yield ------------- lb/acre ------------- Bur cotton yield 161.04 33.5 32.8 32.4 33.3 30.4 32.5 31.9 33.4 31.6 31.7 33.6 32.7 33.7 32.6 31.4 -------- % -------- Lint turnout Deltapine 1441RF Deltapine 1219B2RF PhytoGen 333WRF Stoneville 4946GLB2 NexGen 4111RF NexGen 3306B2RF PhytoGen 339WRF Deltapine 1321B2RF FiberMax 2334GLT Stoneville 4747GLB2 Croplan 3787B2RF NexGen 1511B2RF FiberMax 1830GLT FiberMax 2484B2F FiberMax 2011GT Entry Table 3. Harvest results from the Mt. Blanco Irrigated Systems Variety Trial, Mark and David Appling Farm, Mt. Blanco, TX, 2014. 12 36.1 82.2 82.4 82.1 82.4 82.1 81.9 80.6 82.7 82.5 81.7 83.4 82.0 82.4 81.6 82.3 82.5 31.3 30.3 32.3 30.5 31.5 32.2 30.1 31.0 31.9 30.2 32.6 32.0 31.4 31.9 29.3 32.2 g/tex Strength 7.5 8.0 7.4 9.2 8.8 6.1 6.5 7.0 7.0 8.6 7.7 8.0 7.0 7.3 5.8 7.6 % Elongation 2.5 1.3 1.7 2.7 2.3 1.7 3.3 2.3 2.0 3.0 2.0 3.0 3.7 2.3 3.3 2.3 grade Leaf CV, % 8.7 3.0 1.3 4.0 10.5 32.1 0.0565† OSL 0.6936 0.0206 0.5163 0.0003 0.0324 LSD NS 1.8 NS 1.7 1.3 1.3 CV - coefficient of variation. OSL - observed significance level, or probability of a greater F value. LSD - least significant difference at the 0.05 level, †indicates significance at the 0.10 level, NS - not significant 4.4 Test average 35.6 36.3 35.1 35.6 37.7 34.9 37.2 36.4 34.8 37.9 35.3 35.9 36.2 36.9 35.7 % 32nds inch units 4.4 4.3 4.6 4.3 4.5 4.6 4.6 4.3 4.1 4.3 4.8 4.5 4.1 4.5 4.5 Uniformity Staple Micronaire Croplan 3787B2RF Deltapine 1219B2RF Deltapine 1321B2RF Deltapine 1441RF FiberMax 1830GLT FiberMax 2011GT FiberMax 2334GLT FiberMax 2484B2F NexGen 1511B2RF NexGen 3306B2RF NexGen 4111RF PhytoGen 333WRF PhytoGen 339WRF Stoneville 4747GLB2 Stoneville 4946GLB2 Entry 2.5 0.0046 3.2 75.7 78.4 75.1 74.5 76.2 77.8 72.3 77.3 77.3 73.1 77.2 73.1 74.6 75.0 74.8 77.8 reflectance Rd 8.4 0.0002 1.1 7.9 8.0 8.4 9.1 8.1 6.9 7.4 7.4 7.9 10.0 7.8 7.7 7.7 7.3 6.6 7.6 yellowness +b Table 4. HVI fiber property results from the Mt. Blanco Irrigated Systems Variety Trial, Mark and David Appling Farm, Mt. Blanco, TX, 2014. ---- 3.6 3.0 3.7 3.3 3.7 3.7 4.3 3.7 3.0 3.0 3.3 4.0 3.7 4.0 4.3 3.3 color 1 ---- 1.1 1.0 1.3 1.0 1.0 1.0 1.0 1.0 1.0 2.0 1.0 1.0 1.0 1.0 1.0 1.0 color 2 Color grade 13 Seed turnout 1 1184 1233 1257 1302 1316 1308 1188 1361 1144 1272 1186 1086 1139 976 1076 915 0.5304 0.5495 0.5597 0.5422 0.5422 0.5263 0.5547 0.5398 0.5642 0.4937 0.5235 0.5213 0.5220 0.5132 0.4822 0.5210 448.77 507.93 511.63 496.44 499.84 469.24 485.05 447.35 447.14 434.51 425.07 422.50 413.40 409.87 383.33 378.21 154.12 157.18 162.77 164.56 163.45 148.46 170.10 142.99 158.99 148.29 135.73 142.35 121.98 134.44 114.38 - Seed/technology cost does not include any rebates that may be available from seed companies based on quantities purchased. Assumes: $3.00/cwt ginning cost. $250/ton for seed. Value for lint based on CCC loan value from grab samples and FBRI HVI results. 845 924 914 916 922 892 874 829 793 880 812 810 792 799 795 726 Seed value Total value Ginning cost Seed/technology 1 cost Net value 662.05 668.81 659.20 664.40 632.69 633.51 617.46 590.13 593.50 573.36 558.23 555.75 531.84 517.78 492.59 10.0 0.0816† 11.20 80.70 76.37 85.69 86.97 88.00 86.86 82.02 86.41 78.03 87.20 80.74 74.09 80.04 69.14 79.19 69.68 ---- 62.22 61.47 63.53 60.26 64.87 53.16 68.02 63.53 65.94 67.96 61.47 55.70 48.76 62.59 67.96 68.02 a a ab ab ab abc abc abcd abcde bcde bcde bcde cde de e 11.4 0.0038 86.23 453.84 524.21 519.59 511.97 511.53 492.67 483.47 467.52 446.17 438.34 431.15 428.43 426.95 400.11 370.63 354.89 ------------------------------------------------- $/acre ------------------------------------------------- Lint value 10.0 0.0103 99.67 2690 2546 2856 2899 2933 2895 2734 2880 2601 2907 2691 2470 2668 2305 2640 2323 $/lb Lint loan value CV, % 6.7 6.7 10.0 10.0 9.9 6.6 10.0 9.9 0.0817† OSL 0.0186 0.1011 0.1457 0.0017 0.2621 0.0076 0.0017 LSD 3.6 NS 373 NS 196 NS 75.17 24.53 For net value/acre, means within a column with the same letter are not significantly different at the 0.05 probability level. CV - coefficient of variation. OSL - observed significance level, or probability of a greater F value. LSD - least significant difference at the 0.05 level, †indicates significance at the 0.10 level, NS - not significant. Note: some columns may not add up due to rounding error. 43.9 Seed yield 596.75 31.5 Test average 48.4 44.0 44.9 44.9 45.2 43.4 47.2 44.0 43.8 44.1 44.0 42.7 42.3 40.7 39.4 Lint yield ------------- lb/acre ------------- Bur cotton yield 147.99 36.3 32.0 31.6 31.4 30.8 32.0 28.8 30.5 30.3 30.2 32.8 29.7 34.7 30.1 31.3 -------- % -------- Lint turnout NexGen 1511B2RF PhytoGen 333WRF Deltapine 1219B2RF FiberMax 2484B2F Deltapine 1441RF FiberMax 2334GLT PhytoGen 339WRF Deltapine 1321B2RF Stoneville 4946GLB2 NexGen 3306B2RF FiberMax 2011GT NexGen 4111RF Croplan 3787B2RF Stoneville 4747GLB2 FiberMax 1830GLT Entry Table 5. Harvest results from the Mt. Blanco Dryland Systems Variety Trial, Mark and David Appling Farm, Mt. Blanco, TX, 2014. 14 35.5 81.5 80.7 81.6 82.0 81.8 82.0 81.5 82.5 82.5 82.3 81.9 81.7 81.4 80.7 79.6 80.5 31.1 30.0 30.9 32.5 30.4 30.2 29.5 31.6 31.7 31.4 33.1 32.7 32.8 30.5 28.4 30.6 g/tex Strength 7.4 8.2 7.6 6.1 8.1 7.2 6.5 7.8 7.0 8.1 8.2 7.4 6.4 7.5 7.0 8.2 % Elongation 2.8 1.3 2.0 1.3 2.7 4.0 3.7 2.3 2.3 2.7 3.7 3.7 2.3 3.0 4.0 2.7 grade Leaf CV, % 9.9 3.0 1.0 3.9 10.0 37.5 0.0901† OSL 0.0284 0.0087 0.0017 0.0094 0.0424 LSD 0.6 1.8 1.4 2.0 1.2 1.7 CV - coefficient of variation. OSL - observed significance level, or probability of a greater F value. LSD - least significant difference at the 0.05 level, †indicates significance at the 0.10 level, NS - not significant 4.6 Test average 35.0 35.3 36.9 35.0 35.5 35.5 36.3 36.7 36.1 35.6 35.7 36.6 34.8 33.7 34.0 % 32nds inch units 4.0 4.1 4.2 4.7 4.6 4.6 4.4 4.8 4.5 4.4 4.9 4.6 4.8 5.1 5.3 Uniformity Staple Micronaire Croplan 3787B2RF Deltapine 1219B2RF Deltapine 1321B2RF Deltapine 1441RF FiberMax 1830GLT FiberMax 2011GT FiberMax 2334GLT FiberMax 2484B2F NexGen 1511B2RF NexGen 3306B2RF NexGen 4111RF PhytoGen 333WRF PhytoGen 339WRF Stoneville 4747GLB2 Stoneville 4946GLB2 Entry 2.9 0.1559 NS 75.7 72.4 75.6 77.1 74.4 74.9 74.4 77.1 78.2 76.7 75.4 75.7 77.8 76.5 74.1 75.1 reflectance Rd 9.5 0.0481 1.3 8.0 9.5 9.0 8.1 8.4 7.9 7.6 7.9 7.0 7.8 8.2 7.4 7.4 8.0 8.0 8.5 yellowness +b Table 6. HVI fiber property results from the Mt. Blanco Dryland Systems Variety Trial, Mark and David Appling Farm, Mt. Blanco, TX, 2014. ---- 3.6 3.7 3.3 3.3 3.7 3.7 4.0 3.3 3.7 3.3 3.7 3.7 3.3 3.3 4.0 3.7 color 1 ---- 1.1 1.7 1.3 1.0 1.3 1.0 1.0 1.0 1.0 1.0 1.0 1.0 1.0 1.0 1.0 1.0 color 2 Color grade Additional Replicated Irrigated Large Plot Demonstrations 15 Replicated Sub-Surface Drip Irrigated RACE Variety Trial, Cone, TX - 2014 Cooperator: Lonnie and Lloyd Arthur Mark Kelley, Kristie Keys, and Caitlin Jackson, Extension Agronomist – Cotton, Extension Assistant – Cotton, and CEA-ANR Crosby County Crosby County Objective: The objective of this study is to compare agronomic characteristics, yields, gin turnout, fiber quality, and economic returns of transgenic cotton varieties under sub-surface drip irrigation on the Texas High Plains. Materials and Methods: Varieties: PhytoGen 339WRF, PhytoGen 333WRF, Croplan 3787B2RF, FiberMax 2484B2F, DeltaPine 1219B2RF, NexGen 3306B2RF, NexGen 1511B2RF, FiberMax 2011GT, Stoneville 4747GLB2 Experimental design: Randomized complete block with three (3) replications. Planting date: 16- May Seeding rate: Planted 3.7 seeds/row-ft, or 49,000 seed/A, to prepared, listed 40 inch rows using a commercial IH Planter LRA and MX 210 vacuum planter. Plot size: 12 rows Weed management: Treflan (Triflurex HEP at 30oz/A) was applied pre-plant and incorporated with a twelve-row lister on 26-Feb. Post-emergent foliar applications of glyphosate (RoundUp PowerMAX) at 42 oz/A, AMS (Vixen at 3.2 oz/A) and NIS (Voyager 90/10 at 3.2 oz/A) were made on 19-June and 10-Aug. Irrigation: From 3-May to 1-Sep. approximately 10.15 acre-inches of water were applied via sub-surface drip tape. 16 Rainfall: Based on the nearest Texas Tech University- West Texas Mesonet station at Ralls, rainfall amounts were: April: May: June: July: 0.26" 6.25" 3.81" 4.25" August: September: October: Total rainfall: 1.17" 5.41" 0.26” 21.41" Plant growth regulators: Plant growth regulators were not used in this study. Harvest aids: Foliar applications of ethephon (SuperBoll at 1.5 qt/A), pyraflufen ethyl (ETX at 1.3 oz/A), and crop oil concentrate at 12.8 oz/A, were made on 27-Oct and 31-Oct. Harvest: Plots were harvested on 1-Dec with a commercial eight-row John Deere 7460 cotton stripper with bur extractor. Harvested material was transferred to producer boll buggy and a Western Forage Systems flat-bed scale trailer was used to determine individual plot weights. Plot weights were subsequently converted to lb/acre. Gin turnout: Grab samples were taken from each plot harvested and ginned at the Texas A&M AgriLife Research and Extension Center at Lubbock to determine gin turnouts. Fiber analysis: Lint samples were submitted to the Texas Tech University – Fiber and Biopolymer Research Institute for HVI analysis and USDA Commodity Credit Corporation (CCC) loan values were determined for each variety by plot. Ginning cost and seed values: Seed and Technology fees: Ginning cost was based on $3.00 per cwt. of bur cotton and seed value/acre was based on $250/ton. Ginning cost did not include check-off. Seed and technology costs were calculated using the appropriate seeding rate (3.7 seed/row-ft) for the 40-inch row spacing and entries using the online Plains Cotton Growers Seed Cost Comparison Worksheet available at: http://plainscotton.org/Seed/PCGseed14.xls Results and Discussion: Agronomic data including plant population and nodes above white flower (NAWF) are included in Table 1. Significant differences were noted for most yield and economic parameters (Table 2). Lint turnout averaged 33.2% with a high of 34.8% and low of 31.1% for NexGen 1511B2RF and Deltapine 1219B2RF, respectively. Bur cotton yields averaged 4257 lb/acre. Lint yields averaged 1411 lb/acre and ranged from a high of 1539 lb/acre for NexGen 1511B2RF to a low of 1291 lb/acre for PhytoGen 339WRF. Lint loan values 17 ranged from a high of $0.5738 (Croplan 3787B2RF) to a low of $0.5307 (Stoneville 4747GLB2) with a test average of $0.5640/lb. After combining lint yield and loan value, lint values ($/acre) averaged $795.87/acre and ranged from a high of $863.73 for NexGen 1511B2RF to a low of $727.54 for PhytoGen 339WRF. When adding lint and seed value, total value ranged from a high of $1123.06/acre to a low of $958.65/acre for NexGen 3306B2RF and PhytoGen 339WRF, respectively. After subtracting ginning, seed costs and technology fees, net value/acre averaged $846.21/acre. Net values ranged from a high of $920.57/acre (NexGen 3306B2RF) to a low of $772.01/acre (PhytoGen 339WRF), a difference of $148.56. Significant differences were observed among varieties for all fiber quality parameters at this location (Table 3). Differences in micronaire values were significant with a test average of 3.9. Staple averaged 36.4 across all varieties with a high of 38.2 for NexGen 3306B2RF and a low of 35.4 for FiberMax 2011GT. Uniformity averaged 81.3% across varieties. Strength values ranged from a low of 28.2 g/tex for Croplan 3787B2RF to a high of 32.5 g/tex for NexGen 3306B2RF. Elongation averaged 8.0% across varieties with a high of 9.6% for Croplan Genetics 3787B2RF and a low of 6.3% for Stoneville 4747GLB2. Leaf grades were mostly 2 with a test average of 1.9. Color grade components of Rd (reflectance) and +b (yellowness) averaged 79.2 and 7.5, respectively. This resulted in color grades of mostly 21 and 31. These data indicate that substantial differences can be obtained in terms of net value/acre due to variety selection. Additional multi-site and multi-year applied research is needed to evaluate varieties across a series of environments. Acknowledgments: Appreciation is expressed to Lonnie and Lloyd Arthur for the use of their land, equipment and labor for this demonstration. Further assistance with this project was provided by Dr. Jane Dever and Ms. Valerie Morgan - Texas A&M AgriLife Research and Extension Center, Lubbock and Dr. Eric Hequet - Associate Director, Fiber and Biopolymer Research Institute, Texas Tech University. Furthermore, we greatly appreciate the Texas Department of Agriculture - Food and Fiber Research for funding of HVI testing. Disclaimer Clause: Trade names of commercial products used in this report are included only for better understanding and clarity. Reference to commercial products or trade names is made with the understanding that no discrimination is intended and no endorsement by the Texas A&M System is implied. Readers should realize that results from one experiment do not represent conclusive evidence that the same response would occur where conditions vary. 18 19 3.3 Test average 43,479 41,963 43,270 48,497 46,754 41,818 41,382 40,366 43,560 43,705 CV, % 4.8 4.7 OSL 0.0052 0.0035 LSD 0.3 3,566 For NAWF, numbers represent an average of 5 plants per variety per rep (15 plants per variety) CV - coefficient of variation. OSL - observed significance level, or probability of a greater F value. LSD - least significant difference at the 0.05 level, NS - not significant 3.2 3.3 3.7 3.6 3.2 3.2 3.1 3.3 3.3 plants/acre Plant population plants/row ft Croplan 3787B2RF Deltapine 1219B2RF FiberMax 2011GT FiberMax 2484B2F NexGen 1511B2RF NexGen 3306B2RF PhytoGen 333WRF PhytoGen 339WRF Stoneville 4747GLB2 Entry 8.6 0.2151 NS 6.4 7.1 6.5 6.0 5.9 6.3 6.6 6.5 6.6 5.9 31-Jul 11.5 0.0167 1.1 5.7 6.3 6.4 4.8 4.9 6.1 6.4 5.5 5.9 4.8 8-Aug Nodes Above White Flower (NAWF) for week of 15.5 0.0002 0.6 2.4 2.7 2.7 1.9 1.8 3.6 2.5 2.4 1.9 1.7 25-Aug Table 1. Inseason plant measurement results from the Crosby County Sub-surface Drip Irrigated RACE Variety Trial, Lonnie and Lloyd Arthur Farm, Ralls, TX, 2014. 20 Seed turnout 33.2 Test average 46.8 51.5 45.8 46.1 45.3 47.2 44.7 45.7 46.7 48.5 Lint yield Seed yield 4257 4415 4428 4424 4349 4145 4415 4056 4271 3808 1411 1468 1539 1448 1475 1401 1373 1328 1376 1291 1993 2273 2029 2039 1972 1957 1971 1853 1994 1849 ------------- lb/acre ------------- Bur cotton yield 0.5640 0.5715 0.5612 0.5737 0.5592 0.5713 0.5715 0.5738 0.5307 0.5635 $/lb Lint loan value 1 795.87 838.98 863.73 830.38 824.90 800.58 784.75 761.84 730.16 727.54 2.9 <0.0001 12.41 249.12 284.08 253.60 254.93 246.44 244.63 246.42 231.57 249.31 231.11 - Seed/technology cost does not include any rebates that may be available from seed companies based on quantities purchased. Assumes: $3.00/cwt ginning cost. $250/ton for seed. Value for lint based on CCC loan value from grab samples and FBRI HVI results. Seed value Total value Ginning cost Seed/technology 1 cost Net value 2.9 <0.0001 51.94 1044.99 1123.06 1117.33 1085.32 1071.34 1045.21 1031.17 993.40 979.47 958.65 2.9 <0.0001 6.35 127.70 132.44 132.83 132.73 130.48 124.35 132.44 121.68 128.14 114.25 ---- 71.08 70.05 70.05 73.92 63.48 72.39 68.67 71.33 77.44 72.39 a a ab ab bc cd de e e 3.1 <0.0001 45.60 846.21 920.57 914.45 878.66 877.38 848.47 830.06 800.40 773.89 772.01 ------------------------------------------------- $/acre ------------------------------------------------- Lint value CV, % 8.0 9.1 2.9 2.9 2.9 1.9 2.9 OSL 0.8393 0.6731 <0.0001 <0.0001 <0.0001 0.0029 <0.0001 LSD NS NS 212 70 99 0.0182 39.54 For net value/acre, means within a column with the same letter are not significantly different at the 0.05 probability level. CV - coefficient of variation. OSL - observed significance level, or probability of a greater F value. LSD - least significant difference at the 0.05 level, NS - not significant. Note: some columns may not add up due to rounding error. 33.3 34.8 32.7 33.9 33.8 31.1 32.7 32.2 33.9 -------- % -------- Lint turnout NexGen 3306B2RF NexGen 1511B2RF FiberMax 2484B2F FiberMax 2011GT PhytoGen 333WRF Deltapine 1219B2RF Croplan 3787B2RF Stoneville 4747GLB2 PhytoGen 339WRF Entry Table 2. Harvest results from the Crosby County Sub-surface Drip Irrigated RACE Variety Trial, Lonnie and Lloyd Arthur Farm, Ralls, TX, 2014. 21 36.4 81.3 81.6 80.5 80.9 80.4 81.8 82.3 82.2 82.0 80.1 CV, % 4.5 2.1 0.9 OSL 0.0378 0.0151 0.0123 LSD 0.3 1.3 1.3 CV - coefficient of variation. OSL - observed significance level, or probability of a greater F value. LSD - least significant difference at the 0.05 level. 3.9 Test average 35.6 36.4 35.4 36.8 36.2 38.2 36.8 36.4 36.1 % 32nds inch units 4.0 3.8 4.1 3.7 4.1 3.7 4.1 3.9 3.9 Uniformity Staple Micronaire Croplan 3787B2RF Deltapine 1219B2RF FiberMax 2011GT FiberMax 2484B2F NexGen 1511B2RF NexGen 3306B2RF PhytoGen 333WRF PhytoGen 339WRF Stoneville 4747GLB2 Entry 2.4 <0.0001 1.3 30.6 28.2 31.5 31.2 31.0 30.4 32.5 30.6 31.3 28.7 g/tex Strength 5.6 <0.0001 0.8 8.0 9.6 7.8 7.6 7.1 9.3 8.7 7.5 8.3 6.3 % Elongation 36.0 0.0053 1.2 1.9 1.3 1.0 2.0 1.3 2.7 1.7 2.3 1.3 3.7 grade Leaf 1.3 0.0011 1.8 79.2 80.4 80.1 78.5 81.7 78.6 79.2 77.8 79.5 76.8 reflectance Rd 3.1 <0.0001 0.4 7.5 8.2 7.7 7.3 6.8 8.1 7.8 7.8 7.1 6.6 yellowness +b ---- 3.0 2.0 3.0 3.3 2.7 3.0 2.7 3.0 3.3 4.0 color 1 ---- 1.0 1.0 1.0 1.0 1.0 1.0 1.0 1.0 1.0 1.0 color 2 Color grade Table 3. HVI fiber property results from the Crosby County Sub-surface Drip Irrigated RACE Variety Trial, Lonnie and Lloyd Arthur Farm, Ralls, TX, 2014. Replicated LEPA Irrigated RACE Variety Trial, Lamesa, TX - 2014 Cooperator: Lamesa Cotton Growers/Texas A&M AgriLife Research/ Texas A&M AgriLife Extension Mark Kelley, Kristie Keys, Tommy Doederlein and Gary Roschetzky Extension Agronomist – Cotton, Extension Assistant – Cotton, EA-IPM Dawson/Lynn Counties and CEA-ANR Dawson County Dawson County Objective: The objective of this study is to compare agronomic characteristics, yields, gin turnout, fiber quality, and economic returns of transgenic cotton varieties under LEPA irrigated production on the Texas High Plains. Materials and Methods: Varieties: NexGen 1511B2RF, FiberMax 2011GT, Stoneville 4946GLB2, PhytoGen 367WRF, NexGen 3306B2RF, PhytoGen 417WRF, FiberMax 2334GLT, PhytoGen 499WRF Planting date: 19-May Experimental design: Randomized complete block with three (3) replications. Seeding rate: Planted 4.0 seeds/row-ft, or 52,272 seed/A, into a terminated rye cover crop on prepared, listed 40 inch rows using a commercial John Deere MaxEmerge XP vacuum planter. Plot size: 4 rows by variable length (253-872 ft) Weed management: A burndown application of 2,4-D at 1 qt/A was made on 26-March. Pendimethalin (Prowl H20 at 3 pt/A) and glyphosate (RoundUp PowerMax at 32oz/A) were applied preplant and incorporated on 16-April. Post-emergent applications of glyphosate (RoundUp PowerMax at 32 oz/A) were made on 3-June and 1-Aug. The trial was cultivated with sweeps on 25-June and hoed by hand on 6-Aug. 22 Irrigation: 5" inches of irrigation were applied preplant, with 4.7” applied during the growing season for a total of 9.7” of irrigation applied. Rainfall: Based on the nearest Texas Tech University – West Texas Mesonet station at Lamesa, rainfall amounts were: April: May: June: July: 0.25" 1.26" 3.67" 1.24" August: September: October: Total rainfall: 0.45" 6.42" 0.02” 13.31" Fertility Management: A preplant application of 10-34-0 at a rate of 110 lb/A was made on 1-April. An additional 120 lb/A 32-0-0 was applied via fertigation throughout the growing season. Plant growth regulators: No PGR’s were used in this study. Harvest aids: An application of ethephon (Boll Buster at 1 qt/A) and pyraflufen ethyl (ETX at 1.25oz/A) with 1% v/v COC was made on 4-Oct. This was followed by an application of pyraflufen ethyl (ET at 3 oz/acre ) and 1% v/v COC on 18-Oct. Due to difficulties in terminating the crop and substantial regrowth, an additional application of pyraflufen ethyl (ETX at 1 oz/A) and paraquat (Gramoxone Inteon at 1 pt/A) and 1% v/v COC was made on 31-Oct. Harvest: Plots were harvested on 14-Nov using a commercial John Deere 7445 with burr extractor. Harvested material was transferred into a weigh wagon with integral electronic scales to determine individual plot weights. Plot yields were adjusted to lb/acre. Gin turnout: Grab samples were taken by plot and ginned at the Texas A&M AgriLife Research and Extension Center at Lubbock to determine gin turnouts. Fiber analysis: Lint samples were submitted to the Texas Tech University – Fiber and Biopolymer Research Institute for HVI analysis, and USDA Commodity Credit Corporation (CCC) loan values were determined for each variety by plot. Ginning cost and seed values: Seed and Technology fees: Ginning cost were based on $3.00 per cwt. of burr cotton and seed value/acre was based on $250/ton. Ginning cost did not include check-off. Seed and technology costs were calculated using the appropriate seeding rate (4.0 seed/row-ft) for the 40-inch row spacing and entries using the online Plains Cotton Growers Seed Cost Comparison Worksheet available at: http://plainscotton.org/Seed/PCGseed14.xls 23 Results and Discussion: Agronomic data including plant population and nodes above white flower (NAWF) are included in Table 1. Significant differences were observed for most yield and economic parameters measured except lint and seed turnouts (Table 2). Lint yields ranged from a low of 534 lb/acre for PhytoGen 499WRF to a high of 809 lb/acre PhytoGen 417WRF. Lint loan values averaged $0.4904/lb across varieties. Lint value averaged $333.63/acre and ranged from a high of $388.26/acre for PhytoGen 417WRF to a low of $260.72/acre for PhytoGen 499WRF. When subtracting ginning and seed and technology costs, the net value/acre averaged $315.50. Differences among varieties were observed for net value and values ranged from a high of $377.72/acre to a low of $226.90/acre for PhytoGen 417WRF and PhytoGen 499WRF, respectively. Significant differences were observed for most fiber quality parameters at this location (Table 3). Micronaire values averaged 4.6 with a high of 4.8 for both NexGen 1511B2RF and FiberMax 2334GLT and a low of 4.3 for FiberMax 2011GT. Staple averaged 32.7 with a high of 33.8 for FiberMax 2334GLT and NexGen 3306B2RF, and low of 31.5 for NexGen 1511B2RF. Differences in uniformity and strength values were not significant. Uniformity averaged 80.5% and strength averaged 28.8 g/tex. Elongation values were significantly different, with an average of 8.2%. Values ranged from a low of 6.6% (FiberMax 2334GLT) and a high of 9.4% (PhytoGen 499WRF). Leaf grades varied with most varieties averaging between 3 and 4. Finally, Rd or reflectance (avg. 71.4), and +b or yellowness (avg. 8.5) values resulted in color grades of mostly 41. These data indicate that substantial differences can be obtained in terms of net value/acre due to variety selection. Additional multi-site and multi-year applied research is needed to evaluate varieties across a series of environments. Acknowledgments: Appreciation is expressed to Drs. Wayne Keeling and Danny Carmichael, Texas A&M AgriLife Research Systems Agronomist - Lubbock and Research Associate - AGCARES, Lamesa. Further assistance with this project was provided by Dr. Jane Dever and Ms. Valerie Morgan - Texas A&M AgriLife Research and Extension Center, Lubbock, and Dr. Eric Hequet - Associate Director, Fiber and Biopolymer Research Institute, Texas Tech University. Furthermore, we greatly appreciate funding for HVI testing from the Cotton Fibers Initiative Fund. Disclaimer Clause: Trade names of commercial products used in this report are included only for better understanding and clarity. Reference to commercial products or trade names is made with the understanding that no discrimination is intended and no endorsement by the Texas A&M System is implied. Readers should realize that results from one experiment do not represent conclusive evidence that the same response would occur where conditions vary. 24 25 3.5 Test average 46,283 45,012 49,731 43,923 45,375 43,560 47,553 43,560 51,546 5.2 4.4 4.9 5.2 5.2 5.7 5.6 5.5 5.1 28-Jul 15.9 0.2264 NS 3.5 2.9 4.1 3.4 3.2 3.8 3.9 3.7 3.4 5-Aug Nodes Above White Flower (NAWF) for week of CV, % 10.5 10.3 10.3 OSL 0.4167 0.3603 0.1713 LSD NS NS NS For NAWF, numbers represent an average of 5 plants per variety per rep (15 plants per variety) For Final plant map, numbers represent and average of 6 plants per variety per rep (18 plants per variety) OSL - observed significance level, or probability of a greater F value. LSD - least significant difference at the 0.05 level, NS - not significant. 3.4 3.8 3.4 3.5 3.3 3.6 3.3 3.9 plants/acre Plant population plants/row ft FiberMax 2011GT FiberMax 2334GLT NexGen 1511B2RF NexGen 3306B2RF PhytoGen 367WRF PhytoGen 417WRF PhytoGen 499WRF Stoneville 4946GLB2 Entry Table 1. Inseason plant measurement results from the Dawson County LEPA Irrigated RACE Variety Trial, AGCARES Farm, Lamesa, TX, 2014. 26 Seed turnout 36.5 36.7 37.1 37.5 35.2 36.6 36.6 35.5 37.0 49.3 49.4 51.2 47.6 51.2 48.2 47.4 51.3 48.1 -------- % -------- Lint turnout Lint yield Seed yield 1865 2206 2064 1872 1861 1877 1860 1737 1443 681 809 765 702 655 686 680 617 534 920 1090 1058 890 952 905 882 891 693 ------------- lb/acre ------------- Bur cotton yield 0.4904 0.4802 0.4710 0.5222 0.5188 0.4870 0.4607 0.4953 0.4878 $/lb Lint loan value 1 333.63 388.26 360.32 366.71 340.04 334.31 313.29 305.41 260.72 11.6 0.0149 23.46 115.01 136.28 132.21 111.29 119.01 113.07 110.22 111.35 86.68 - Seed/technology cost does not include any rebates that may be available from seed companies based on quantities purchased. Assumes: $3.00/cwt ginning cost. $250/ton for seed. Value for lint based on CCC loan value from grab samples and FBRI HVI results. Seed value Total value Ginning cost Seed/technology 1 cost Net value 11.5 0.0273 90.48 448.65 524.54 492.53 478.00 459.05 447.38 423.50 416.76 347.41 11.6 0.0291 11.32 55.95 66.18 61.92 56.17 55.84 56.31 55.79 52.12 43.28 ---- 77.19 80.64 82.61 82.68 74.73 67.72 74.73 77.23 77.23 a ab ab ab ab bc bc c 14.3 0.0334 79.17 315.50 377.72 347.99 339.15 328.48 323.35 292.98 287.41 226.90 ------------------------------------------------- $/acre ------------------------------------------------- Lint value CV, % 7.6 6.0 11.6 11.6 11.6 3.4 11.5 OSL 0.9659 0.4731 0.0292 0.0234 0.0149 0.0046 0.0267 LSD NS NS 377 139 187 0.0288 67.06 For net value/acre, means within a column with the same letter are not significantly different at the 0.05 probability level. CV - coefficient of variation. OSL - observed significance level, or probability of a greater F value. LSD - least significant difference at the 0.05 level, NS - not significant. Note: some columns may not add up due to rounding error. Test average PhytoGen 417WRF Stoneville 4946GLB2 FiberMax 2334GLT NexGen 3306B2RF FiberMax 2011GT NexGen 1511B2RF PhytoGen 367WRF PhytoGen 499WRF Entry Table 2. Harvest results from the Dawson County LEPA Irrigated RACE Variety Trial, AGCARES Farm, Lamesa, TX, 2014. 27 32.7 80.5 79.9 80.2 79.4 81.7 81.0 80.3 80.5 81.0 28.8 27.9 27.8 28.1 29.8 29.2 29.0 29.9 29.0 g/tex Strength 8.2 6.8 6.6 9.2 8.5 8.4 8.7 9.4 8.2 % Elongation 3.4 4.0 2.0 3.7 2.3 3.3 4.3 3.7 3.7 grade Leaf CV, % 3.7 2.5 1.4 4.1 4.1 26.6 0.0753† OSL 0.0237 0.0318 0.3447 0.2802 <0.0001 LSD 0.3 1.4 NS NS 0.6 1.3 CV - coefficient of variation. OSL - observed significance level, or probability of a greater F value. † LSD - least significant difference at the 0.05 level, indicates significance at the 0.10 level, NS - not significant 4.6 Test average 32.2 33.8 31.5 33.8 33.3 32.5 32.2 32.4 % 32nds inch units 4.3 4.8 4.8 4.7 4.5 4.4 4.7 4.5 Uniformity Staple Micronaire FiberMax 2011GT FiberMax 2334GLT NexGen 1511B2RF NexGen 3306B2RF PhytoGen 367WRF PhytoGen 417WRF PhytoGen 499WRF Stoneville 4946GLB2 Entry 1.9 0.0211 2.4 71.4 72.3 73.6 69.7 72.0 71.1 70.8 72.4 69.0 reflectance Rd +b 3.6 0.0448 0.5 8.5 8.4 7.8 8.7 8.6 8.7 8.5 8.5 8.5 yellowness Table 3. HVI fiber property results from the Dawson County LEPA Irrigated RACE Variety Trial, AGCARES Farm, Lamesa, TX, 2014. ---- 4.2 4.0 4.0 4.7 4.0 4.0 4.0 4.0 4.7 color 1 ---- 1.3 1.0 1.0 1.7 1.3 1.7 1.3 1.0 1.7 color 2 Color grade Replicated LESA Irrigated RACE Variety Trial, Memphis, TX - 2014 Cooperator: Terry Lindsey Mark Kelley, Kristie Keys, and Josh Brooks Extension Agronomist – Cotton, Extension Assistant – Cotton and CEA-ANR Hall County Objective: The objective of this study is to compare agronomic characteristics, yields, gin turnout, fiber quality, and economic returns of transgenic cotton varieties under LESA irrigation on the Texas Rolling Plains. Materials and Methods: Varieties: FiberMax 2011GT, Deltapine 1410B2RF, NexGen 3306B2RF, Croplan 3787B2RF, Deltapine 1219B2RF, Deltapine 1321B2RF, NexGen 1511B2RF, FiberMax 1830GLT, Stoneville 4946GLB2, PhytoGen 222WRF, PhytoGen 333WRF Experimental design: Randomized complete block with three (3) replications. Planting date: 22-May Seeding rate: Planted 3.7 seeds/row-ft on flat ground in 40 inch row spacings. The trial was planted into a terminated rye cover crop. Plot size: 8 rows by variable length Weed management: Roundup PowerMax was applied at a rate of 26 oz/acre, 3 times during the season. Irrigation: Approximately 14 acre-inches of water were applied via LESA pivot over the course of the growing season. 28 Rainfall: Based on the nearest Texas Tech University- West Texas Mesonet station at Memphis, rainfall amounts were: April: May: June: July: August: September: October: 0.68” 4.11” 3.14” 2.79” Total rainfall: 3.43” 0.93” 1.03” 16.11” Fertilizer management: 50 lbs of N, P, and K were applied pre-plant. Black label was applied in furrow at the recommended rate and 100 lbs of N applied through the pivot using 32-0-0 during the growing season. Harvest aids: Crop was conditioned by freeze event. Harvest: Plots were harvested on 20-Nov. with a commercial eight-row John Deere 7445 cotton stripper with burr extractor. Harvested material was transferred to a weigh wagon with integral electronic scales to record individual plot weights. Plot weights were subsequently converted to lb/acre. Gin turnout: Grab samples were taken by plot and ginned at the Texas A&M AgriLife Research and Extension Center at Lubbock to determine gin turnouts. Fiber analysis: Lint samples were submitted to the Texas Tech University – Fiber and Biopolymer Research Institute for HVI analysis, and USDA Commodity Credit Corporation (CCC) loan values were determined for each variety by plot. Ginning cost and seed values: Seed and Technology fees: Ginning cost were based on $3.00 per cwt. of burr cotton and seed value/acre was based on $250/ton. Ginning cost did not include check-off. Seed and technology costs were calculated using the appropriate seeding rate (3.5 seed/row-ft) for the 40-inch row spacing and entries using the online Plains Cotton Growers Seed Cost Comparison Worksheet available at: http://www.plainscotton.org/Seed/PCGseed14.xls 29 Results and Discussion: Agronomic data including plant population, nodes above white flower (NAWF), boll storm resistance, and final plant map data are included in Table 1. Significant differences were noted for some yield and economic parameters (Table 2). Lint turnout averaged 33.2% did not vary significantly in this trial. Burr cotton yields averaged 2978 lb/acre across all varieties with a high of 3393 lb/acre for Stoneville 4946GLB2 and a low of 2632 lb/acre for FiberMax 1830GLT. Lint yields ranged from a low of 884 lb/acre (FiberMax 1830GLT) to a high of 1172 lb/acre (Stoneville 4946GLB2). Lint loan values averaged $0.5627/lb across all varieties and did not vary significantly. When adding lint and seed value, total value ranged from a high of $858.65/acre for Stoneville 4946GLB2 to a low of $669.49/acre for FiberMax 1830GLT. After subtracting ginning, seed costs and technology fees, the net value/acre among varieties ranged from a high of $694.63/acre (FiberMax 2011GT) to a low of $514.62/acre (FiberMax 1830GLT), a difference of $180.01/acre. Significant differences were observed among varieties for most fiber quality parameters at this location (Table 3). Micronaire averaged 3.8 and did not vary significantly in this trial. Staple averaged 36.6 across all varieties with a high of 37.4 for NexGen 3306B2RF and a low of 35.4 for Deltapine 1321B2RF. Uniformity ranged from a high of 84.4% for NexGen 3306B2RF to a low of 81.8% for Deltapine 1410B2RF with a test average of 82.9%. Strength averaged 32.3 g/tex across varieties with a low of 31.0 g/tex (Croplan Genetics 3787B2RF) and a high of 33.9 g/tex (NexGen 3306B2RF). Elongation averaged 8.1% across varieties and leaf grades were mostly 1 and 2. Color grade components of Rd (reflectance) and +b (yellowness) averaged 77.3 and 8.1, respectively. This resulted in color grades of mostly 31. These data indicate that substantial differences can be obtained in terms of net value/acre due to variety selection. Additional multi-site and multi-year applied research is needed to evaluate varieties across a series of environments. Acknowledgments: Appreciation is expressed to Matt Montgomery for the use of his land and equipment for this project. Further assistance with this project was provided by Dr. Jane Dever and Ms. Valerie Morgan - Texas A&M AgriLife Research and Extension Center, Lubbock, and Dr. Eric Hequet Associate Director, Fiber and Biopolymer Research Institute, Texas Tech University. Furthermore, we greatly appreciate the Fiber Initiative for funding of HVI testing. Disclaimer Clause: Trade names of commercial products used in this report are included only for better understanding and clarity. Reference to commercial products or trade names is made with the understanding that no discrimination is intended and no endorsement by the Texas A&M System is implied. Readers should realize that results from one experiment do not represent conclusive evidence that the same response would occur where conditions vary. 30 31 2.0 Test average 26,756 21,780 28,024 25,700 36,736 22,942 33,251 28,459 27,733 20,183 23,958 25,555 6.6 6.7 6.9 7.3 6.5 6.3 6.0 6.9 6.7 6.5 6.7 6.0 22-Jul 6.0 5.6 6.7 6.5 6.0 5.9 6.3 5.9 5.4 6.0 5.7 5.7 29-Jul 9.8 0.0903† 0.8 5.9 6.1 6.7 6.2 5.7 6.2 5.5 5.6 5.1 5.6 6.3 5.9 7-Aug Nodes Above White Flower (NAWF) for week of CV, % 18.3 17.9 8.0 7.7 OSL 0.0182 0.0140 0.1641 0.0728† LSD 0.6 8,153 NS 0.7 For NAWF, numbers represent an average of 5 plants per variety per rep (15 plants per variety) For Final plant map, numbers represent and average of 6 plants per variety per rep (18 plants per variety) CV - coefficient of variation. OSL - observed significance level, or probability of a greater F value. LSD - least significant difference at the 0.05 level, †indicates significance at the 0.10 level, NS - not significant 1.7 2.1 2.0 2.8 1.8 2.5 2.2 2.1 1.5 1.8 2.0 plants/acre Plant population plants/row ft Croplan 3787B2RF Deltapine 1219B2RF Deltapine 1321B2RF Deltapine 1410B2RF FiberMax 1830GLT FiberMax 2011GT NexGen 1511B2RF NexGen 3306B2RF PhytoGen 222WRF PhytoGen 333WRF Stoneville 4946GLB2 Entry Table 1. Inseason plant measurement results from the 2014 Hall County Irrigated RACE, Terry Lindsey Farm, Memphis, TX, 2014 32 Seed turnout 1 1497 1665 1695 1585 1574 1466 1454 1449 1401 1467 1403 1307 0.5627 0.5645 0.5517 0.5635 0.5725 0.5663 0.5633 0.5583 0.5733 0.5588 0.5450 0.5725 556.61 647.68 646.80 597.16 561.48 562.66 538.09 531.23 527.65 501.73 502.07 506.11 208.18 211.85 198.08 196.71 183.22 181.71 181.14 175.18 183.40 175.42 163.38 - Seed/technology cost does not include any rebates that may be available from seed companies based on quantities purchased. Assumes: $3.00/cwt ginning cost. $250/ton for seed. Value for lint based on CCC loan value from grab samples and FBRI HVI results. 989 1147 1172 1060 981 994 955 951 920 898 921 884 Seed value Total value Ginning cost Seed/technology cost Net value 855.86 858.65 795.24 758.18 745.88 719.79 712.37 702.83 685.13 677.49 669.49 4.4 <0.0001 6.62 89.34 99.06 101.78 94.93 90.31 88.94 87.14 86.95 84.09 85.93 84.68 78.95 ---- 70.46 62.18 75.86 70.91 68.62 69.87 68.62 73.60 70.91 67.27 71.30 75.93 a a b bc bcd cde cdef def ef ef f 4.9 <0.0001 49.05 583.92 694.63 681.01 629.39 599.26 587.08 564.03 551.82 547.82 531.93 521.51 514.62 ------------------------------------------------- $/acre ------------------------------------------------- Lint value 4.4 <0.0001 55.67 2978 3302 3393 3164 3010 2965 2905 2898 2803 2864 2823 2632 $/lb Lint loan value CV, % 4.9 3.7 4.4 4.4 4.3 2.2 4.4 4.3 OSL 0.4332 0.8035 <0.0001 <0.0001 <0.0001 0.2054 <0.0001 <0.0001 LSD NS NS 221 75 110 NS 41.92 13.75 For net value/acre, means within a column with the same letter are not significantly different at the 0.05 probability level. CV - coefficient of variation. OSL - observed significance level, or probability of a greater F value. LSD - least significant difference at the 0.05 level, NS - not significant. Note: some columns may not add up due to rounding error. 50.3 Seed yield 743.72 33.2 Test average 50.4 50.0 50.1 52.3 49.4 50.0 50.0 50.0 51.2 49.7 49.7 Lint yield ------------- lb/acre ------------- Bur cotton yield 187.12 34.7 34.6 33.5 32.6 33.5 32.9 32.8 32.8 31.3 32.6 33.6 -------- % -------- Lint turnout FiberMax 2011GT Stoneville 4946GLB2 PhytoGen 333WRF NexGen 3306B2RF Croplan 3787B2RF NexGen 1511B2RF Deltapine 1321B2RF PhytoGen 222WRF Deltapine 1219B2RF Deltapine 1410B2RF FiberMax 1830GLT Entry Table 2. Harvest results from the Hall County Irrigated RACE, Terry Lindsey Farm, Memphis, TX, 2014. 33 36.6 82.9 83.0 82.4 82.6 81.8 82.4 82.8 82.9 84.4 83.8 83.4 82.9 32.3 31.0 32.8 32.1 31.6 32.6 31.5 32.2 33.9 32.3 31.9 33.0 g/tex Strength 8.1 8.8 7.6 9.1 6.6 7.3 7.1 9.0 8.9 9.0 7.8 8.2 % Elongation 1.9 1.0 2.7 2.3 1.7 1.7 1.7 2.0 1.3 1.3 2.7 2.7 grade Leaf CV, % 7.2 1.5 0.7 2.3 5.1 29.1 OSL 0.5551 0.0019 0.0041 0.0085 <0.0001 0.0086 LSD NS 1.0 1.0 1.3 0.7 0.9 CV - coefficient of variation. OSL - observed significance level, or probability of a greater F value. LSD - least significant difference at the 0.05 level, †indicates significance at the 0.10 level, NS - not significant 3.8 Test average 36.6 37.3 35.4 36.9 37.2 36.4 35.5 37.4 36.6 37.2 36.4 % 32nds inch units 3.9 3.5 4.0 3.9 3.7 4.0 4.0 3.8 3.7 3.7 3.8 Uniformity Staple Micronaire Croplan 3787B2RF Deltapine 1219B2RF Deltapine 1321B2RF Deltapine 1410B2RF FiberMax 1830GLT FiberMax 2011GT NexGen 1511B2RF NexGen 3306B2RF PhytoGen 222WRF PhytoGen 333WRF Stoneville 4946GLB2 Entry Rd 1.6 0.0898† 1.7 77.3 77.3 78.1 76.2 76.1 79.3 77.9 77.8 77.6 77.6 76.2 76.4 reflectance Table 3. HVI fiber property results from the Hall County Irrigated RACE, Terry Lindsey Farm, Memphis, TX, 2014. 4.7 0.0003 0.7 8.1 8.5 8.2 8.4 6.8 7.9 7.5 8.4 8.6 8.6 8.3 7.9 yellowness +b ---- 3.2 3.0 3.0 3.3 4.0 3.0 3.3 3.0 2.7 3.0 3.3 3.7 color 1 ---- 1.0 1.0 1.0 1.0 1.0 1.0 1.0 1.0 1.0 1.0 1.0 1.0 color 2 Color grade Replicated Sub-Surface Drip Irrigated RACE Variety Trial, Levelland, TX - 2014 Cooperator: Cory Ayers Mark Kelley, Kristie Keys, Wes Utley, and Kerry Siders Extension Agronomist – Cotton, Extension Assistant – Cotton, EA-ANR, and EA-IPM Cochran/Hockley Counties. Hockley County Objective: The objective of this study is to compare agronomic characteristics, yields, gin turnout, fiber quality, and economic returns of transgenic cotton varieties under sub-surface drip irrigation on the Texas High Plains. Materials and Methods: Varieties: Croplan 3787B2RF, Deltapine 1212B2RF, Deltapine 1321B2RF, Deltapine 1410B2RF, FiberMax 1830GLT, FiberMax 2011GT, NexGen 1511B2RF, NexGen 3306B2RF, PhytoGen 367WRF, PhytoGen 417WRF, and Stoneville 4946GLB2 Experimental design: Randomized complete block with three (3) replications. Planting date: 29-May Seeding rate: Planted approximately 3.5 seeds/row-ft, or 46000 seed/acre, to prepared, listed 40-inch rows with a commercial John Deere MaxEmerge XP vacuum planter. Plot size: 8 rows by 1290 ft. Weed management: Trifluralin was applied pre-plant and incorporated at 2 pt/A across all varieties on 31-Jan. A pre-plant application of diuron (Direx at 24 oz/A) and pyrithiobac sodium (Staple at 1.7 oz/A) was made on 17-May. A post-emergent application of glyphosate (RoundUp PowerMax at 32oz/A) with AMS was made on 12-June. Irrigation: From 21-May to 10-Sep, a total of 17.82 acre-inches of water were applied via sub-surface drip tape. 34 Rainfall: Based on the nearest Texas Tech University- West Texas Mesonet station at Levelland, rainfall amounts were: April: May: June: July: 0.15” 3.15” 3.72” 2.59” August: September: October: Total rainfall: 0.99” 4.58” 0.31” 15.49” Insecticides: This location is in an active boll weevil eradication zone, but no applications were made by the Texas Boll Weevil Eradication Program. Fertilizer management: Fertilizers applied to this location included 230 lbs/ac 10-34-0, 150 lb/ac 32-0-0 applied using fertigation during the growing season and 275 lbs/ac N-pHuric acid. A foliar 10% zinc was also applied to this location. Plant growth regulators: An application of mepiquat pentaborate (Pentia at 10 oz/A) was made on 30-July. Harvest aids: An initial application of ethephon (Boll’d at 1 qt/A) and pyraflufen ethyl (ET at 2 oz/A) was made on 3-Oct. A sequential application of paraquat (Gramoxone Inteon at 6 oz/A) and 1% v/v NIS was made on 12-Oct. Harvest: Plots were harvested on 12-Nov using a 7460 John Deere stripper. Harvested material was transferred to producer boll buggy and a Western Forage Systems Flat-bed scale trailer was used to obtain individual plot weights. Plot weights were subsequently converted to lb/acre. Gin turnout: Grab samples were taken by plot and ginned at the Texas A&M AgriLife Research and Extension Center at Lubbock to determine gin turnouts. Fiber analysis: Lint samples were submitted to the Texas Tech University – Fiber and Biopolymer Research Institute for HVI analysis, and USDA Commodity Credit Corporation (CCC) loan values were determined for each variety by plot. Ginning cost and seed values: Seed and Technology fees: Ginning cost were based on $3.00 per cwt. of burr cotton and seed value/acre was based on $250/ton. Ginning cost did not include check-off. Seed and technology costs were calculated using the appropriate seeding rate (3.5 seed/row-ft) for the 40-inch row spacing and entries using the online Plains Cotton Growers Seed Cost Comparison Worksheet available at: http://www.plainscotton.org/Seed/PCGseed14.xls 35 Results and Discussion: Agronomic data including plant population and nodes above white flower (NAWF) are included in Table 1. Significant differences were observed for most yield and economic parameters (Table 2). Lint turnout averaged 31.4% with a high of 35.3% and low of 27.3% for NexGen 1511B2RF and NexGen 3306B2RF, respectively. Bur cotton yields averaged 4495 lb/acre across all varieties. Lint yields varied from a low of 1110 lb/acre (NexGen 3306B2RF) to a high of 1601 lb/acre (FiberMax 2011GT). Due to substantial variability within varieties for leaf grade, all leaf grade values were set to 3. This resulted in lint loan values averaging $0.5263/lb and differences among varieties were not significant. When adding lint and seed value, total value ranged from a high of $1134.01/acre for FiberMax 2011GT to a low of $817.03/acre for NexGen3306B2RF. After subtracting ginning, seed costs and technology fees, net value/acre among varieties ranged from a high of $934.29/acre (FiberMax 2011GT) to a low of $629.48/acre (NexGen 3306B2RF), a difference of $304.80. Significant differences were observed among varieties for all fiber quality parameters at this location (Table 3). Micronaire values ranged from a low of 2.7 for PhytoGen 367WRF to a high of 3.9 for NexGen 1511B2RF. Staple averaged 37.1 across all varieties with a high of 39.5 for FiberMax 1830GLT and a low of 35.8 for NexGen 1511B2RF. Uniformity ranged from a low of 80.1% for Deltapine 1410B2RF to a high of 82.0% for NexGen 3306B2RF with a test average of 81.2%. Strength ranged from a low of 28.1 g/tex for Croplan 3787B2RF to a high of 32.1 g/tex for Deltapine 1212B2RF. Elongation averaged 7.8% across all varieties. Color grade components of Rd (reflectance) and +b (yellowness) averaged 77.6 and 8.0, respectively and resulted in color grades of mostly 21 and 31. These data indicate that substantial differences can be obtained in terms of net value/acre due to variety selection. Additional multi-site and multi-year applied research is needed to evaluate varieties across a series of environments. Acknowledgments: Appreciation is expressed to Cory Ayers for the use of his land, equipment and labor for this demonstration. Further assistance with this project was provided by Dr. Jane Dever and Ms. Valerie Morgan - Texas A&M AgriLife Research and Extension Center, Lubbock, and Dr. Eric Hequet - Associate Director, Fiber and Biopolymer Research Institute, Texas Tech University. Furthermore, we greatly appreciate the Fiber Initiative for funding of HVI testing. Disclaimer Clause: Trade names of commercial products used in this report are included only for better understanding and clarity. Reference to commercial products or trade names is made with the understanding that no discrimination is intended and no endorsement by the Texas A&M System is implied. Readers should realize that results from one experiment do not represent conclusive evidence that the same response would occur where conditions vary. 36 37 2.8 Test average 36,416 36,482 37,208 36,119 37,752 30,855 37,752 31,763 33,759 44,649 38,297 35,937 plants/acre 5.9 6.3 5.7 5.7 5.5 5.5 5.7 6.0 5.3 5.8 7.2 5.9 28-Jul 12.4 0.0743† 0.8 4.6 5.3 4.3 4.6 4.0 4.5 4.9 4.7 3.8 4.6 5.1 5.3 6-Aug Nodes Above White Flower (NAWF) for week of CV, % 17.2 16.9 11.7 OSL 0.4214 0.4261 0.1558 LSD NS NS NS For NAWF, numbers represent an average of 5 plants per variety per rep (15 plants per variety) CV - coefficient of variation. OSL - observed significance level, or probability of a greater F value. LSD - least significant difference at the 0.05 level, †indicates significance at the 0.10 level, NS - not significant 2.8 2.8 2.8 2.9 2.4 2.9 2.4 2.6 3.4 2.9 2.8 plants/row ft Plant population Croplan 3787B2RF Deltapine 1212B2RF Deltapine 1321B2RF Deltapine 1410B2RF FiberMax 1830GLT FiberMax 2011GT NexGen 1511B2RF NexGen 3306B2RF PhytoGen 367WRF PhytoGen 417WRF Stoneville 4946GLB2 Entry 33.8 0.4483 NS 2.6 3.1 2.4 3.4 1.9 2.7 2.1 2.4 2.1 2.5 3.3 3.1 13-Aug Table 1. Inseason plant measurement results from the Hockley County Sub-surface Drip Irrigated RACE Variety Trial, Cory Ayers Farm, Levelland, TX, 2014. 38 Seed turnout 2147 2248 2078 2179 2264 2163 2327 2286 2062 1808 2185 2021 0.5263 0.5328 0.5507 0.5615 0.5402 0.5380 0.5188 0.5048 0.5183 0.5285 0.4878 0.5083 Total value Ginning cost Seed/technology 1 cost 745.90 853.03 860.13 829.19 819.04 763.81 747.58 746.29 687.49 707.15 626.84 564.38 280.97 259.69 272.40 283.06 270.36 290.92 285.78 257.74 226.04 273.15 252.65 1134.01 1119.82 1101.59 1102.10 1034.17 1038.50 1032.07 945.24 933.19 899.99 817.03 6.4 0.0611† 12.09 134.86 140.13 132.88 142.52 144.34 130.89 141.33 134.48 134.57 123.31 137.20 121.79 ---- 68.15 59.59 65.76 68.33 70.54 72.70 68.33 70.96 66.96 72.76 67.96 65.76 1 - Seed/technology cost does not include any rebates that may be available from seed companies based on quantities purchased. Assumes: $3.00/cwt ginning cost. $250/ton for seed. Value for lint based on CCC loan value from grab samples and FBRI HVI results. Due to significant variability within varieties, leaf grades were set at 3 for all varieties. 1414 1601 1562 1477 1516 1420 1441 1478 1326 1338 1285 1110 Seed value Net value a ab ab ab bc bc bc cd cd de e 7.0 <0.0001 96.38 811.33 934.29 921.17 890.74 887.22 830.58 828.84 826.63 743.71 737.11 694.83 629.48 ------------------------------------------------- $/acre ------------------------------------------------- Lint value 6.4 <0.0001 110.98 4495 4671 4429 4751 4811 4363 4711 4483 4486 4110 4573 4060 $/lb Lint loan value CV, % 6.7 4.7 6.4 6.4 6.5 5.5 6.4 6.5 0.0612† OSL 0.0037 0.0339 0.0001 0.0100 0.1625 <0.0001 0.0100 LSD 3.6 3.8 403 155 239 NS 81.19 29.87 For net value/acre, means within a column with the same letter are not significantly different at the 0.05 probability level. CV - coefficient of variation. OSL - observed significance level, or probability of a greater F value. LSD - least significant difference at the 0.05 level, †indicates significance at the 0.10 level, NS - not significant. Note: some columns may not add up due to rounding error. 47.8 Seed yield 1014.34 31.4 Test average 48.1 46.9 45.9 47.1 49.6 49.4 51.0 46.0 44.0 47.8 49.8 Lint yield ------------- lb/acre ------------- Bur cotton yield 268.43 34.3 35.3 31.1 31.5 32.5 30.6 33.0 29.6 32.6 28.1 27.3 -------- % -------- Lint turnout FiberMax 2011GT NexGen 1511B2RF Deltapine 1212B2RF Deltapine 1321B2RF Stoneville 4946GLB2 Deltapine 1410B2RF PhytoGen 417WRF Croplan 3787B2RF FiberMax 1830GLT PhytoGen 367WRF NexGen 3306B2RF Entry Table 2. Harvest results from the Hockley County Sub-surface Drip Irrigated RACE Variety Trial, Cory Ayers Farm, Levelland, TX, 2014. 39 37.1 81.2 81.1 81.2 81.8 80.1 81.6 81.2 81.4 82.0 81.1 80.7 81.3 30.6 28.1 32.1 30.0 30.9 30.7 31.6 30.3 30.7 30.7 29.6 31.8 g/tex Strength 7.8 8.6 8.0 8.5 6.4 6.5 7.1 8.6 7.6 8.1 8.5 7.8 % Elongation 77.6 80.2 76.2 77.2 76.2 80.0 79.4 77.2 78.3 76.1 76.8 76.5 reflectance Rd Leaf grades were set to 3 across all varieties at this location due to significant variability within varieties. CV, % 10.1 1.8 0.8 2.7 4.9 1.4 0.0659† OSL 0.0066 <0.0001 0.0007 <0.0001 0.0003 LSD 0.5 1.1 0.9 1.4 0.7 1.9 CV - coefficient of variation. OSL - observed significance level, or probability of a greater F value. LSD - least significant difference at the 0.05 level, †indicates significance at the 0.10 level, NS - not significant. 3.2 Test average 36.2 36.8 37.1 37.7 39.5 36.6 35.8 38.9 37.2 36.3 36.3 % 32nds inch units 3.1 3.5 3.3 3.2 3.0 3.2 3.9 2.8 2.7 2.9 3.3 Uniformity Staple Micronaire Croplan 3787B2RF Deltapine 1212B2RF Deltapine 1321B2RF Deltapine 1410B2RF FiberMax 1830GLT FiberMax 2011GT NexGen 1511B2RF NexGen 3306B2RF PhytoGen 367WRF PhytoGen 417WRF Stoneville 4946GLB2 Entry 2.5 <0.0001 0.3 8.0 8.6 8.2 8.1 7.3 7.5 7.2 8.2 8.3 8.5 8.2 8.1 yellowness +b ---- 3.1 2.0 3.0 3.0 4.0 2.7 3.3 3.3 2.7 3.3 3.3 3.3 color 1 ---- 1.0 1.0 1.0 1.0 1.0 1.0 1.0 1.0 1.0 1.0 1.0 1.0 color 2 Color grade Table 3. HVI fiber property results from the Hockley County Sub-surface Drip Irrigated RACE Variety Trial, Cory Ayers Farm, Levelland, TX, 2014. Replicated Sub-Surface Drip Irrigated RACE Variety Trial, Amherst, TX - 2014 Cooperator: Jeff Edwards Mark Kelley and Kristie Keys Extension Agronomist – Cotton and Extension Assistant – Cotton Lamb County Objective: The objective of this study is to compare agronomic characteristics, yields, gin turnout, fiber quality, and economic returns of transgenic cotton varieties under sub-surface drip irrigation on the Texas High Plains. Materials and Methods: Varieties: NexGen 1511B2RF, Croplan 3787B2RF, PhytoGen 222WRF, NexGen 3306B2RF, PhytoGen 339WRF, FiberMax 2011GT Experimental design: Randomized complete block with three (3) replications. Planting date: 21-May Seeding rate: Planted 3.2 seeds/row-ft in to prepared, listed 40 inch rows using a commercial John Deere MaxEmerge XP vacuum planter. Plot size: 8 rows by 1290 ft. Weed management: Trifluralin was applied pre-plant and incorporated at a rate of 1.5 pt/A on 12-Apr. Post-emergent applications of generic glyphosate at 1 qt/A were made 14-June and 21-July. Irrigation: A total of 17.82” of irrigation were applied beginning 21-May thru 10-September as per conversation with producer. Rainfall: Based on the nearest Texas Tech University- West Texas Mesonet station at Amherst, rainfall amounts were: April: 0.28” May: 4.09” August: September: 40 2.25” 7.82” June: 4.47” July: 2.47” October: Total rainfall: 0.14” 21.52” Insecticides: This location is in an active boll weevil eradication zone, but no applications were made by the Texas Boll Weevil Eradication Program. Fertilizer management: Fertilizers applied to this location include 230 lbs/ac 10-34-0, 150 lb/ac 32-0-0 applied using fertigation during the growing season and 275 lbs/ac N-pHuric acid. A foliar 10% zinc solution was also applied to this location. Plant growth regulators: Pentia was applied at 10 oz/ac on 30-July as well as an application of 12 oz/ac Mepiquat Chloride on 16-August. Harvest aids: Harvest aids included an initial application of ethephon (Boll’D at 1 qt/ac with 2 oz/ac ET) on 3-Oct. and a sequential application of 6 oz/ac paraquat with 1% v/v NIS on 12-Oct. Harvest: Plots were harvested on 22-Oct. using a John Deere stripper with burr extractor. Harvested material was transferred to a weigh wagon with integral electronic scales to record individual plot weights. Plot weights were subsequently converted to lb/A. Gin turnout: Grab samples were taken from bales by plot and ginned at the Texas A&M AgriLife Research and Extension Center at Lubbock to determine gin turnouts. Fiber analysis: Lint samples were submitted to the Texas Tech University – Fiber and Biopolymer Research Institute for HVI analysis, and USDA Commodity Credit Corporation (CCC) loan values were determined for each variety by plot. Ginning cost and seed values: Seed and Technology fees: Ginning cost were based on $3.00 per cwt. of burr cotton and seed value/acre was based on $250/ton. Ginning cost did not include check-off. Seed and technology costs were calculated using the appropriate seeding rate (3.2 seed/row-ft) for the 40-inch row spacing and entries using the online Plains Cotton Growers Seed Cost Comparison Worksheet available at: http://plainscotton.org/Seed/PCGseed14.xls 41 Results and Discussion: Agronomic data including plant population, nodes above white flower (NAWF), boll storm resistance, and final plant map data are included in Table 1. Significant differences were noted for most yield and economic parameters (Table 2). Lint turnout averaged 30.4% with a high of 33.9% and low of 28.8% for NexGen 1511B2RF and NexGen 3306B2RF, respectively. Bur cotton yields averaged 3394 lb/acre across varieties. Lint yields varied from a low of 905 lb/acre (Croplan Genetics 3787B2RF) to a high of 1221 lb/acre (NexGen 2011GT). Lint loan values averaged $0.5280/lb and did not vary significantly. When adding lint and seed value, total value ranged from a high of $881.88/acre for FiberMax 2011GT to a low of $655.78/acre for Croplan Genetics 3787B2RF. After subtracting ginning, seed costs and technology fees, net value/acre among varieties ranged from a high of $712.74/acre (FiberMax 2011GT) to a low of $505.17/acre (Croplan Genetics 3787B2RF), a difference of $207.57/acre. Significant differences were observed among varieties for most fiber quality parameters at this location (Table 3). Micronaire values ranged from a low of 2.9 for PhytoGen 339WRF to a high of 3.5 for PhytoGen 222WRF. Staple averaged 37.3 across all varieties with a high of 38.1 for NexGen 3306B2RF and a low of 36.4 for NexGen 1511B2RF. Uniformity averaged 82.9% and did not vary significantly in this trial. Strength ranged from a low of 28.7 g/tex for Croplan Genetics 3787B2RF to a high of 32.4 g/tex for NexGen 3306B2RF. Elongation averaged 8.5% across and leaf grades were mostly 1 and 2. Color grade components of Rd (reflectance) and +b (yellowness) averaged 75.8 and 8.1, respectively and resulted in color grades of mostly 31. These data indicate that substantial differences can be obtained in terms of net value/acre due to variety selection. Additional multi-site and multi-year applied research is needed to evaluate varieties across a series of environments. Acknowledgments: Appreciation is expressed to Jeff Edwards for the use of his land, equipment and labor for this demonstration. Further assistance with this project was provided by Dr. Jane Dever and Ms. Valerie Morgan - Texas A&M AgriLife Research and Extension Center, Lubbock, and Dr. Eric Hequet - Associate Director, Fiber and Biopolymer Research Institute, Texas Tech University. Furthermore, we greatly appreciate the Fiber Initiative for funding of HVI testing. Disclaimer Clause: Trade names of commercial products used in this report are included only for better understanding and clarity. Reference to commercial products or trade names is made with the understanding that no discrimination is intended and no endorsement by the Texas A&M System is implied. Readers should realize that results from one experiment do not represent conclusive evidence that the same response would occur where conditions vary. 42 43 2.2 Test average 28,375 25,592 29,222 28,677 29,040 29,040 28,677 5.3 0.1214 NS 7.8 7.7 7.6 7.9 8.3 7.2 7.9 7-Aug 7.1 0.3251 NS 7.2 7.3 6.8 7.5 7.2 6.9 7.7 20-Aug Nodes Above White Flower (NAWF) for week of CV, % 9.3 9.5 OSL 0.5923 0.5861 LSD NS NS For NAWF, numbers represent an average of 5 plants per variety per rep (15 plants per variety) CV - coefficient of variation. OSL - observed significance level, or probability of a greater F value. LSD - least significant difference at the 0.05 level, NS - not significant. 2.0 2.2 2.2 2.2 2.2 2.2 plants/acre Plant population plants/row ft Croplan 3787B2RF FiberMax 2011GT NexGen 1511B2RF NexGen 3306B2RF PhytoGen 222WRF PhytoGen 339WRF Entry Table 1. Inseason plant measurement results from the 2014 Lamb County Irrigated RACE, Jeff Edwards Farm, Amherst, TX, 2014. 44 Seed turnout Seed yield 1032 1221 1030 1038 1053 947 905 1631 1769 1779 1747 1433 1632 1428 0.5280 0.5410 0.5530 0.5028 0.5080 0.5358 0.5275 Seed value Total value 1 545.28 660.75 569.51 522.01 534.68 507.41 477.30 221.14 222.41 218.36 179.09 203.96 178.48 - Seed/technology cost does not include any rebates that may be available from seed companies based on quantities purchased. Assumes: $3.00/cwt ginning cost. $250/ton for seed. Value for lint based on CCC loan value from grab samples and FBRI HVI results. Ginning cost Seed/technology 1 cost Net value 881.88 791.92 740.37 713.77 711.37 655.78 8.1 0.0279 15.07 101.82 114.73 106.74 108.11 93.19 98.71 89.47 ---- 59.96 54.41 62.05 62.05 60.04 60.04 61.14 a ab bc bc bc c 9.1 0.0108 96.73 587.40 712.74 623.13 570.21 560.54 552.63 505.17 ------------------------------------------------- $/acre ------------------------------------------------- Lint value 8.2 0.0157 111.80 3394 3824 3558 3604 3106 3290 2982 $/lb Lint loan value CV, % 5.5 5.0 8.1 8.3 8.1 4.3 8.3 8.1 OSL 0.0198 0.3057 0.0279 0.0160 0.0187 0.1323 0.0076 0.0187 LSD 3.1 NS 503 156 240 NS 81.84 30.00 For net value/acre, means within a column with the same letter are not significantly different at the 0.05 probability level. CV - coefficient of variation. OSL - observed significance level, or probability of a greater F value. LSD - least significant difference at the 0.05 level, NS - not significant. Note: some columns may not add up due to rounding error. 48.1 46.3 50.0 48.5 46.1 49.6 47.9 Lint yield ------------- lb/acre ------------- Bur cotton yield 749.18 30.4 31.9 28.9 28.8 33.9 28.8 30.3 -------- % -------- Lint turnout 203.91 Test average FiberMax 2011GT PhytoGen 222WRF PhytoGen 339WRF NexGen 1511B2RF NexGen 3306B2RF Croplan 3787B2RF Entry Table 2. Harvest results from the Lamb County Irrigated RACE, Jeff Edwards Farm, Amherst, TX, 2014. 45 37.3 82.9 83.1 82.5 82.9 83.2 83.5 82.2 CV, % 6.1 0.9 0.8 OSL 0.0155 0.0012 0.2001 LSD 0.4 0.6 NS CV - coefficient of variation. OSL - observed significance level, or probability of a greater F value. LSD - least significant difference at the 0.05 level, NS - not significant 3.3 Test average 36.7 37.4 36.4 38.1 37.4 37.7 % 32nds inch units 3.1 3.4 3.5 3.2 3.5 2.9 Uniformity Staple Micronaire Croplan 3787B2RF FiberMax 2011GT NexGen 1511B2RF NexGen 3306B2RF PhytoGen 222WRF PhytoGen 339WRF Entry 1.6 <0.0001 0.9 30.4 28.7 29.7 31.0 32.4 29.6 30.7 g/tex Strength 3.7 0.0002 0.6 8.5 8.9 7.3 8.7 8.1 9.5 8.4 % Elongation 52.4 0.5266 NS 2.3 1.3 1.7 2.7 2.3 3.0 2.7 grade Leaf Rd 1.7 0.0027 2.4 75.8 76.2 77.8 71.7 75.4 76.8 76.9 reflectance Table 3. HVI fiber property results from the Lamb County Irrigated RACE, Jeff Edwards Farm, Amherst, TX, 2014. 3.7 <0.0001 0.6 8.1 9.0 7.0 9.0 8.6 7.6 7.6 yellowness +b ---- 3.4 3.0 3.7 4.0 3.0 3.3 3.7 color 1 ---- 1.2 1.0 1.0 2.0 1.0 1.0 1.0 color 2 Color grade Replicated Sub-Surface Drip Irrigated RACE Variety and Harvest Method Trial, Acuff, TX - 2014 Cooperator: Rhett Mimms Mark Kelley, Kristie Keys, Mark Brown, and John Wanjura Extension Agronomist – Cotton, Extension Assistant – Cotton, CEA-ANR Lubbock County, and Agricultural Engineer – USDA-ARS Lubbock County Objective: The objective of this study is to compare agronomic characteristics, yields, gin turnout, fiber quality, and economic returns of picker and stripper harvested, transgenic cotton varieties under sub-surface drip irrigation on the Texas High Plains. Materials and Methods: Varieties: Deltapine 1044B2RF, Deltapine 1321B2RF, FiberMax 2011GT, FiberMax 2484B2F, NexGen 1511B2RF, NexGen 3306B2RF, NexGen 4111RF, PhytoGen 367WRF, PhytoGen 417WRF, Stoneville 4946GLB2, and Stoneville 5458B2F Experimental design: Randomized complete block with three (3) replications. Planting date: 20-May Seeding rate: Planted 3.3 seeds/row-ft in to prepared, listed 40 inch rows using a commercial John Deere MaxEmerge XP vacuum planter. Plot size: 8 rows by 1427’ (4 rows Picker harvested and 4 rows Stripper harvested) Weed management: Roundup PowerMax was applied over-the-top on 15-June and 8-July at 28 oz/acre with AMS. An additional post-directed application of Roundup PowerMax at 28 oz/acre with Valor at 2 oz/acre and AMS was made on 15-Aug. Irrigation: The field had a 3.7 gpm/acre irrigation capacity. This provided for 0.19 acre-inches/day. From 25-June to 31-August a total of approximately 12 inches of irrigation were applied. 46 Rainfall: Based on the nearest Texas Tech University- West Texas Mesonet station at Lubbock, rainfall amounts were: April: May: June: July: 0.61” 4.74” 2.40” 1.69” August: September: October: Total rainfall: 1.98” 7.48” 0.30” 19.20” Fertilizer management: Producer side-dress applied 188 lb/A of liquid 32-0-0 (60 lb N/A) on 25-June. An additional 40 lb/A of nitrogen was applied via sub-surface drip irrigation over the course of the growing season. Insecticides: This location is in an active boll weevil eradication zone, but no applications were made by the Texas Boll Weevil Eradication Program. Plant growth regulators: No PGR’s were used in this study. Harvest aids: Harvest aids included an initial application of ethephon at 21 oz/acre with 1 oz/acre Aim on 21-Sep. and a sequential application of 24 oz/acre Gramoxone Inteon with 0.25% v/v non-ionic surfactant on 5-Oct. Harvest: Plots were stripped and picked on 15-Nov. using a commercial John Deere 7460 cotton stripper with bur extractor and a commercial John Deere 9996 cotton picker. Harvested material was transferred to a weigh wagon with integral electronic scales to record individual plot weights. Plot weights were subsequently converted to lb/acre basis. Gin turnout: 20 lb grab samples were taken by plot and ginned at the USDA-ARS Gin Lab at Lubbock to determine gin turnouts. Fiber analysis: Lint samples were submitted to the Texas Tech University – Fiber and Biopolymer Research Institute for HVI analysis, and USDA Commodity Credit Corporation (CCC) loan values were determined for each variety by plot. Ginning cost and seed values: Seed and Technology fees: Ginning cost were based on $3.00 per cwt. of burr cotton and seed value/acre was based on $250/ton. Ginning cost did not include check-off. Seed and technology costs were calculated using the appropriate seeding rate (3.3 seed/row-ft) for the 40-inch row spacing and entries using the online Plains Cotton Growers Seed Cost Comparison Worksheet available at: http://plainscotton.org/Seed/PCGseed14.xls 47 Results and Discussion - Stripped: Agronomic data including plant population and nodes above white flower (NAWF) data are included in Table 1. Significant differences were noted for most yield and economic parameters (Table 2). Lint turnout averaged 35.0% with a high of 36.6% for NexGen 1511B2RF and a low of 33.0% for Deltapine 1044B2RF. Bur cotton yield averaged 4734 lb/acre and ranged from a high of 5480 lb/acre for FiberMax 2484B2F to a low of 4277 lb/acre for Deltapine 1321B2RF. Lint yields varied from a low of 1469 lb/acre (NexGen 3306B2RF) to a high of 1951 lb/acre (FiberMax 2484B2F). Lint loan values averaged $0.5532/lb across varieties and ranged from a high of $0.5742 for NexGen 4111RF, to a low of $0.5063 for PhytoGen 417WRF. This resulted in an average lint value ($/acre) of $919.22. When adding lint and seed value, total values ranged from a high of $1452.73/acre for FiberMax 2484B2F to a low of $1046.13/acre for PhytoGen 417WRF. After subtracting ginning, seed costs and technology fees, the net value/acre among varieties ranged from a high of $1223.45/acre (FiberMax 2484B2F) to a low of $849.07/acre (PhytoGen 417WRF), a difference of $374.38/acre. Significant differences were observed among varieties for most fiber quality parameters measured at this location (Table 3). Micronaire values ranged from a low of 3.0 for PhytoGen 417WRF to a high of 4.2 for NexGen 4111RF. Staple averaged 36.4 across all varieties with a high of 38.4 for FiberMax 2484B2F and a low of 35.4 for PhytoGen 367WRF. Uniformity values averaged 82.0% and ranged from a high of 83.3% (NexGen 3306B2RF) to a low of 80.6% (Stoneville 5458B2RF). Strength values ranged from a low of 30.2 g/tex for PhytoGen 417WRF to a high of 33.1 g/tex for NexGen 3306B2RF. Elongation averaged 7.7% across varieties and leaf grades averaged 3.2. Color grade components of Rd (reflectance) and +b (yellowness) averaged 78.8 and 8.5, respectively and resulted in color grades of mostly 21 and 31. These data indicate that substantial differences can be obtained in terms of net value/acre due to variety selection. Additional multi-site and multi-year applied research is needed to evaluate varieties across a series of environments. Results and Discussion - Picked: Significant differences were noted for all yield and economic parameters (Table 4). Lint turnout averaged 39.1% with a high of 41.6% and low of 36.9% for NexGen 1511B2RF and Stoneville 5458B2RF, respectively. Seed cotton yield averaged 3916 lb/acre resulting in an average lint yield across all varieties of 1530 lb/acre. Lint yields ranged from a low of 1352 lb/acre for Deltapine 1321B2RF to a high of 1821 lb/acre for FiberMax 2484B2F. Lint loan values averaged $0.5721/lb with a high of $0.5792 and a low of $0.5558/lb for FiberMax 2484B2F and PhytoGen 417WRF, respectively. When adding lint and seed value, total value averaged $1142.05/acre. After subtracting ginning, seed costs and technology fees, the average net value/acre across varieties was $962.73/acre and ranged from a high of $1162.46/acre for FiberMax 2484B2F to a low of $826.46/acre for Deltapine 1321B2RF, a difference of $336.00 Significant differences were observed among varieties for all fiber quality parameters at this location (Table 5). Micronaire values ranged from a low of 3.4 for PhytoGen 417WRF and NexGen 3306B2RF to a high of 4.1 for Stoneville 4946GLB2 and FiberMax 2011GT. Staple averaged 36.5 across all varieties with a high of 38.2 for FiberMax 2484B2F and a low of 35.2 for PhytoGen 417WRF. Uniformity ranged from a high of 83.3% for NexGen 4111RF to a low of 80.8% for Stoneville 5458B2RF with a test average of 82.2%. Strength ranged from a low of 29.2 g/tex for PhytoGen 417WRF to a high of 32.5 g/tex for NexGen 3306B2RF. Elongation averaged 8.0% across varieties and leaf grades 48 averaged 1.9. Color grade components of Rd (reflectance) and +b (yellowness) averaged 80.4 and 8.2, respectively and resulted in color grades of mostly 21. These data indicate that substantial differences can be obtained in terms of net value/acre due to variety selection. Additional multi-site and multi-year applied research is needed to evaluate varieties across a series of environments. Acknowledgments: Appreciation is expressed to Rhett Mimms for the use of his land, equipment and labor for this demonstration. Further assistance with this project was provided by Dr. Jane Dever and Ms. Valerie Morgan - Texas A&M AgriLife Research and Extension Center, Lubbock, and Dr. Eric Hequet - Associate Director, Fiber and Biopolymer Research Institute, Texas Tech University. Furthermore, we greatly appreciate the Fiber Initiative for funding of HVI testing. Disclaimer Clause: Trade names of commercial products used in this report are included only for better understanding and clarity. Reference to commercial products or trade names is made with the understanding that no discrimination is intended and no endorsement by the Texas A&M System is implied. Readers should realize that results from one experiment do not represent conclusive evidence that the same response would occur where conditions vary. 49 50 2.4 Test average 31,838 30,347 30,637 33,396 32,234 34,558 32,089 33,686 31,799 31,799 31,654 28,024 CV, % 8.6 8.4 OSL 0.2538 0.2806 LSD NS NS For NAWF, numbers represent an average of 5 plants per variety per rep (15 plants per variety) CV - coefficient of variation. OSL - observed significance level, or probability of a greater F value. LSD - least significant difference at the 0.05 level, NS - not significant 2.3 2.3 2.6 2.5 2.6 2.5 2.6 2.4 2.4 2.4 2.1 plants/acre Plant population plants/row ft Deltapine 1044B2RF Deltapine 1321B2RF FiberMax 2011GT FiberMax 2484B2F NexGen 1511B2RF NexGen 3306B2RF NexGen 4111RF PhytoGen 367WRF PhytoGen 417WRF Stoneville 4946GLB2 Stoneville 5458B2F Entry 10.3 0.0273 0.9 5.4 5.1 6.1 4.7 5.3 5.8 5.8 5.1 4.5 6.1 5.4 5.5 7-Aug 14.9 0.2522 NS 2.7 2.8 2.7 2.2 3.0 3.1 2.4 2.7 2.4 2.6 2.9 2.6 25-Aug Nodes Above White Flower (NAWF) for week of Table 1. Inseason plant measurement results from the Lubbock County Sub-surface Drip Irrigated Cotton Race Trial, Rhett Mimms Farm, Acuff, TX, 2014. 51 Seed turnout 1 2531 2927 2833 2527 2582 2677 2467 2485 2293 2464 2260 2330 0.5532 0.5570 0.5742 0.5667 0.5715 0.5515 0.5592 0.5482 0.5392 0.5613 0.5505 0.5063 919.22 1086.83 1059.52 1020.37 986.61 891.75 901.27 869.29 872.44 824.68 843.77 754.85 365.90 354.14 315.87 322.73 334.67 308.36 310.64 286.57 308.05 282.47 291.28 - Seed/technology cost does not include any rebates that may be available from seed companies based on quantities purchased. Assumes: $3.00/cwt ginning cost. $250/ton for seed. Value for lint based on CCC loan value from grab samples and FBRI HVI results. 1659 1951 1845 1801 1726 1617 1612 1586 1618 1469 1533 1491 Seed value Total value Ginning cost Seed/technology 1 cost Net value 1452.73 1413.66 1336.24 1309.35 1226.43 1209.63 1179.93 1159.01 1132.74 1126.24 1046.13 3.8 <0.0001 9.13 142.03 164.41 154.34 148.47 145.87 147.02 139.02 139.01 132.74 132.38 128.32 130.73 ---- 61.84 64.87 48.76 55.70 67.96 60.26 63.53 63.89 61.47 61.47 65.94 66.33 a a b b c cd cde cde de e f 4.0 <0.0001 70.44 1031.78 1223.45 1210.56 1132.06 1095.52 1019.14 1007.08 977.02 964.80 938.88 931.99 849.07 ------------------------------------------------- $/acre ------------------------------------------------- Lint value 3.8 <0.0001 79.57 4734 5480 5145 4949 4862 4901 4634 4634 4425 4413 4277 4358 $/lb Lint loan value CV, % 1.5 2.3 3.8 3.8 3.7 2.7 3.8 3.7 OSL <0.0001 0.0057 <0.0001 <0.0001 <0.0001 0.0014 <0.0001 <0.0001 LSD 0.9 2.1 304 108 161 0.0252 59.51 20.09 For net value/acre, means within a column with the same letter are not significantly different at the 0.05 probability level. CV - coefficient of variation. OSL - observed significance level, or probability of a greater F value. LSD - least significant difference at the 0.05 level. Note: some columns may not add up due to rounding error. 53.5 Seed yield 1235.64 35.0 Test average 53.4 55.1 51.1 53.1 54.6 53.2 53.6 51.8 55.8 52.8 53.5 Lint yield ------------- lb/acre ------------- Bur cotton yield 316.43 35.6 35.9 36.4 35.5 33.0 34.8 34.2 36.6 33.3 35.8 34.2 -------- % -------- Lint turnout FiberMax 2484B2F NexGen 4111RF FiberMax 2011GT Stoneville 4946GLB2 Deltapine 1044B2RF PhytoGen 367WRF Stoneville 5458B2RF NexGen 1511B2RF NexGen 3306B2RF Deltapine 1321B2RF PhytoGen 417WRF Entry Table 2. Harvest results from the Lubbock County Stripper Harvested Sub-surface Drip Irrigated Cotton Race Trial, Rhett Mimms Farm, Acuff, TX, 2014. 52 36.4 82.0 81.6 82.5 81.7 82.2 81.9 83.3 83.0 81.4 81.7 82.5 80.6 CV, % 6.3 1.1 0.8 OSL 0.0009 <0.0001 0.0057 LSD 0.4 0.7 1.2 CV - coefficient of variation. OSL - observed significance level, or probability of a greater F value. LSD - least significant difference at the 0.05 level, NS - not significant 3.5 Test average 36.1 36.4 35.9 38.4 36.1 37.9 35.9 35.4 35.8 36.6 35.7 % 32nds inch units 3.4 3.5 3.7 3.4 3.4 3.5 4.2 3.6 3.0 3.7 3.5 Uniformity Staple Micronaire Deltapine 1044B2RF Deltapine 1321B2RF FiberMax 2011GT FiberMax 2484B2F NexGen 1511B2RF NexGen 3306B2RF NexGen 4111RF PhytoGen 367WRF PhytoGen 417WRF Stoneville 4946GLB2 Stoneville 5458B2RF Entry 1.9 0.0003 1.0 31.3 30.5 31.6 31.1 31.2 32.0 33.1 31.6 30.5 30.2 32.0 31.1 g/tex Strength 3.5 <0.0001 0.5 7.7 8.8 8.2 7.0 6.2 8.4 7.7 7.9 7.9 8.3 7.7 6.9 % Elongation 26.1 0.7225 NS 3.2 3.3 3.3 3.0 3.0 4.0 3.3 2.7 2.7 3.7 3.0 3.3 grade Leaf 1.1 0.0004 1.5 78.8 80.0 78.4 78.9 81.4 78.5 79.0 79.0 78.0 77.1 78.6 77.6 reflectance Rd 3.5 <0.0001 0.5 8.5 8.7 8.4 7.8 7.7 8.2 8.2 9.2 8.8 9.1 8.8 8.5 yellowness +b ---- 2.4 2.0 2.7 3.0 2.3 3.0 2.3 1.7 2.3 2.3 2.3 2.7 color 1 ---- 1.0 1.0 1.0 1.0 1.0 1.0 1.0 1.0 1.0 1.0 1.0 1.0 color 2 Color grade Table 3. HVI fiber property results from the Lubbock County Stripper Harvested Sub-surface Drip Irrigated Cotton Race Trial, Rhett Mimms Farm, Acuff, TX, 2014. 53 Seed turnout 1 2128 2491 2311 2305 2226 2140 2197 2127 1877 2051 1891 1796 0.5721 0.5792 0.5752 0.5790 0.5723 0.5772 0.5780 0.5717 0.5737 0.5595 0.5558 0.5712 875.99 1054.51 947.25 954.75 945.55 874.35 855.80 845.81 855.37 763.77 766.76 771.96 311.44 288.86 288.17 278.22 267.49 274.68 265.92 234.67 256.33 236.41 224.50 - Seed/technology cost does not include any rebates that may be available from seed companies based on quantities purchased. Assumes: $3.00/cwt ginning cost. $250/ton for seed. Value for lint based on CCC loan value from grab samples and FBRI HVI results. 1530 1821 1647 1649 1652 1515 1481 1480 1491 1365 1379 1352 Seed value Total value Ginning cost Seed/technology cost1 Net value 1365.94 1236.11 1242.93 1223.77 1141.84 1130.48 1111.73 1090.04 1020.10 1003.16 996.45 3.3 <0.0001 6.69 117.48 138.61 125.55 125.21 123.73 117.09 117.47 120.35 107.60 109.17 103.46 104.05 ---- 61.84 64.87 48.76 67.96 55.70 63.53 60.26 63.89 61.47 61.47 66.33 65.94 a b b b c c c c d d d 3.6 <0.0001 58.31 962.73 1162.46 1061.80 1049.76 1044.33 961.22 952.75 927.48 920.97 849.46 833.37 826.46 ------------------------------------------------- $/acre ------------------------------------------------- Lint value 3.3 <0.0001 64.99 3916 4620 4185 4174 4124 3903 3916 4012 3587 3639 3449 3468 $/lb Lint loan value CV, % 2.5 2.6 3.3 3.4 3.3 1.5 3.4 3.3 OSL 0.0005 0.0093 <0.0001 <0.0001 <0.0001 0.0489 <0.0001 <0.0001 LSD 1.6 2.4 223 88 118 0.0148 50.28 14.75 For net value/acre, means within a column with the same letter are not significantly different at the 0.05 probability level. CV - coefficient of variation. OSL - observed significance level, or probability of a greater F value. LSD - least significant difference at the 0.05 level. Note: some columns may not add up due to rounding error. 54.3 Seed yield 1142.05 39.1 Test average 53.9 55.2 55.2 54.0 54.8 56.1 53.0 52.3 56.3 54.8 51.8 Lint yield ------------- lb/acre ------------- Seed cotton yield 266.06 39.4 39.4 39.5 40.1 38.8 37.8 36.9 41.6 37.5 40.0 39.0 -------- % -------- Lint turnout FiberMax 2484B2F NexGen 4111RF Stoneville 4946GLB2 FiberMax 2011GT PhytoGen 367WRF Deltapine 1044B2RF Stoneville 5458B2RF NexGen 1511B2RF NexGen 3306B2RF PhytoGen 417WRF Deltapine 1321B2RF Entry Table 4. Harvest results from the Lubbock County Picker Harvested Sub-surface Drip Irrigated Cotton Race Trial, Rhett Mimms Farm, Acuff, TX, 2014. 54 36.5 82.2 82.1 82.7 82.3 81.6 82.7 83.1 83.3 81.6 81.4 82.9 80.8 CV, % 6.2 1.1 0.6 OSL 0.0065 <0.0001 <0.0001 LSD 0.4 0.7 0.8 CV - coefficient of variation. OSL - observed significance level, or probability of a greater F value. LSD - least significant difference at the 0.05 level, NS - not significant 3.8 Test average 35.9 36.4 36.5 38.2 35.8 38.0 36.5 35.9 35.2 36.6 36.1 % 32nds inch units 3.8 3.6 4.1 3.6 3.9 3.4 4.0 3.7 3.4 4.1 3.9 Uniformity Staple Micronaire Deltapine 1044B2RF Deltapine 1321B2RF FiberMax 2011GT FiberMax 2484B2F NexGen 1511B2RF NexGen 3306B2RF NexGen 4111RF PhytoGen 367WRF PhytoGen 417WRF Stoneville 4946GLB2 Stoneville 5458B2RF Entry 2.9 0.0047 1.5 30.4 29.7 30.9 29.8 30.1 30.5 32.5 31.9 29.9 29.2 30.2 29.6 g/tex Strength 3.2 <0.0001 0.4 8.0 8.9 8.9 7.0 6.4 8.9 8.2 8.3 8.0 8.9 8.3 6.6 % Elongation 41.3 0.5386 NS 1.9 2.0 2.3 1.7 1.7 2.7 2.7 2.0 1.3 1.7 1.7 1.7 grade Leaf 0.7 <0.0001 0.9 80.4 81.3 81.0 80.9 82.1 80.5 80.0 79.1 79.9 79.8 80.3 79.0 reflectance Rd 2.0 <0.0001 0.3 8.2 8.2 8.2 7.5 7.5 8.4 8.0 8.6 8.7 8.6 8.5 8.3 yellowness +b ---- 2.2 2.0 2.0 2.7 2.0 2.0 2.3 2.7 2.0 2.0 2.0 2.7 color 1 ---- 1.0 1.0 1.0 1.0 1.0 1.0 1.0 1.0 1.0 1.0 1.0 1.0 color 2 Color grade Table 5. HVI fiber property results from the Lubbock County Picker Harvested Sub-surface Drip Irrigated Cotton Race Trial, Rhett Mimms Farm, Acuff, TX, 2014. Replicated LESA Irrigated RACE Variety Trial, Brownfield, TX - 2014 Cooperator: Keith Harrison Mark Kelley and Kristie Keys Extension Agronomist – Cotton and Extension Assistant – Cotton Terry County Objective: The objective of this study is to compare agronomic characteristics, yields, gin turnout, fiber quality, and economic returns of transgenic cotton varieties under LESA irrigation on the Texas High Plains. Materials and Methods: Varieties: Deltapine 1454NR B2RF, FiberMax 1830GLT, NexGen 1511B2RF, PhytoGen 417WRF, Stoneville 4946GLB2, Deltapine 1321B2RF, FiberMax 2011GT, NexGen 3306B2RF, PhytoGen 367WRF Experimental design: Randomized complete block with four (4) replications. Planting date: 4-June Seeding rate: Planted 2.9 seeds/row-ft in to prepared, listed 40 inch rows with a John Deere 1700 vacuum planter. Plot size: 4 rows by variable length due to center pivot Weed management: Trifluralin (Treflan at 1.5pt/A) was applied pre-plant and incorporated across all varieties on 1-Apr. A 20” banded application of glyphosate (RoundUp PowerMax at 20 oz/A) was made on 13-July. Post-emergent broadcast applications of glyphosate (Roundup PowerMax at 48oz/A) and AMS were made on 27-June and 29-July. Irrigation: 3.0 acre-inches of water were applied via LESA irrigation prior to planting. 13.68 acre-inches of water were applied via LESA irrigation during the growing season for a total of 16.68”. 55 Rainfall: Based on the nearest Texas Tech University- West Texas Mesonet station at Brownfield, rainfall amounts were: April: May: June: July: 0.95” 2.01” 3.31” 1.31” August: September: October: Total rainfall: 0.18” 6.82” 0.10” 14.68” Fertilizer management: 10 gal/A 32-0-0 were side dress applied with a sweep on 10-July. Plant growth regulators: No PGR’s were used in this study. Harvest aids: No harvest aids were used in this study. Harvest: Plots were harvested on 21-Nov. using a commercial John Deere 7450 cotton stripper with burr extractor. Harvested material was transferred to a weigh wagon with integral electronic scales to record individual plot weights. Plot weights were subsequently converted to lb/acre. Gin turnout: Grab samples were taken by plot and ginned at the Texas A&M AgriLife Research and Extension Center at Lubbock to determine gin turnouts. Fiber analysis: Lint samples were submitted to the Texas Tech University – Fiber and Biopolymer Research Institute for HVI analysis, and USDA Commodity Credit Corporation (CCC) loan values were determined for each variety by plot. Ginning cost and seed values: Seed and Technology fees: Ginning cost were based on $3.00 per cwt. of burr cotton and seed value/acre was based on $250/ton. Ginning cost did not include check-off. Seed and technology costs were calculated using the appropriate seeding rate (2.9 seed/row-ft) for the 40-inch row spacing and entries using the online Plains Cotton Growers Seed Cost Comparison Worksheet available at: http://plainscotton.org/Seed/PCGseed14.xls Results and Discussion: Agronomic data including plant population, nodes above white flower (NAWF), and boll storm resistance are included in Table 1. Significant differences were noted for most yield and economic parameters (Table 2). Lint turnout averaged 37.4% with a high of 39.6% for Deltapine 1321B2RF and a low of 34.6% for PhytoGen 417WRF. Burr cotton yield averaged 1803 lb/acre and ranged from a high of 1894 lb/acre for FiberMax 1830GLT to a low of 1801 lb/acre for Deltapine 1321B2RF. Lint yields varied from a low of 743 lb/acre (NexGen 3306B2RF) to a high of 707 lb/acre (Deltapine 1454NR B2RF). Lint loan values averaged $.5509/lb across varieties with a high of $0.5655/lb for FiberMax 1830GLT and a low of $0.5252/lb for 56 NexGen 1511B2RF. When adding lint and seed value, total values ranged from a high of $512.21/acre for FiberMax 1830GLT to a low of $441.41/acre for Stoneville 4946GLB2. After subtracting ginning, seed costs and technology fees, the net value/acre among varieties ranged from a high of $393.70/acre (FiberMax 1830GLT) to a low of $328.76/acre (Stoneville 4946GLB2), a difference of $64.94/acre. Significant differences were observed among varieties for most fiber quality parameters measured at this location (Table 3). Micronaire values ranged from a low of 4.1 for PhytoGen 367WRF to a high of 5.0 for NexGen 1511B2RF. Staple averaged 35.2 across all varieties with a high of 37.4 for NexGen 3306B2RF and a low of 34.1 for PhytoGen 367WRF. Uniformity ranged from a high of 83.8% for FiberMax 1830GLT to a low of 81.9% for PhytoGen 367WRF with a test average of 82.8%. Strength ranged from a low of 28.9 g/tex for Stoneville 4946GLB2 to a high of 31.7 g/tex for FiberMax 1830GLT. Elongation averaged 8.4% across varieties and leaf grades did not vary significantly. Color grade components of Rd (reflectance) and +b (yellowness) averaged 76.4 and 8.4, respectively and resulted in a color grade of 31 for all varieties. Reflectance did not vary significantly in this trial. These data indicate that substantial differences can be obtained in terms of net value/acre due to variety selection. Additional multi-site and multi-year applied research is needed to evaluate varieties across a series of environments. Acknowledgments: Appreciation is expressed to Keith Harrison for the use of his land, equipment and labor for this demonstration. Further assistance with this project was provided by Dr. Jane Dever and Ms. Valerie Morgan - Texas A&M AgriLife Research and Extension Center, Lubbock, and Dr. Eric Hequet - Associate Director, Fiber and Biopolymer Research Institute, Texas Tech University. Furthermore, we greatly appreciate the Fiber Initiative for funding of HVI testing. Disclaimer Clause: Trade names of commercial products used in this report are included only for better understanding and clarity. Reference to commercial products or trade names is made with the understanding that no discrimination is intended and no endorsement by the Texas A&M System is implied. Readers should realize that results from one experiment do not represent conclusive evidence that the same response would occur where conditions vary. 57 58 3.0 Test average 38,768 41,092 35,719 38,914 41,963 39,349 34,703 40,075 39,640 37,462 plants/acre 5.4 5.9 5.3 4.8 5.7 5.7 5.6 5.5 5.1 5.1 5-Aug 4.5 4.3 4.6 4.5 4.1 5.1 4.9 4.7 4.8 4.0 13-Aug 21.0 0.1576 NS 4.1 4.1 5.1 3.8 3.8 4.5 2.7 3.9 4.4 4.3 20-Aug Nodes Above White Flower (NAWF) for week of CV, % 9.1 9.2 10.5 10.9 OSL 0.2622 0.2923 0.3409 0.2335 LSD NS NS NS NS For NAWF, numbers represent an average of 5 plants per variety per rep (15 plants per variety) For Final plant map, numbers represent and average of 6 plants per variety per rep (18 plants per variety) For Storm resistance, ratings based on a scale of 0-9 where 9 represents maximum storm resistance. CV - coefficient of variation. OSL - observed significance level, or probability of a greater F value. LSD - least significant difference at the 0.05 level, NS - not significant 3.1 2.7 3.0 3.2 3.0 2.7 3.1 3.0 2.9 plants/row ft Plant population Deltapine 1321B2RF Deltapine 1454NR B2RF FiberMax 1830GLT FiberMax 2011GT NexGen 1511B2RF NexGen 3306B2RF PhytoGen 367WRF PhytoGen 417WRF Stoneville 4946GLB2 Entry Table 1. Inseason plant measurement results from the 2014 Terry County Irrigated RACE, Farm, Meadow, TX, 2014. 59 Seed turnout 1 840 959 904 847 804 844 827 857 743 774 0.5509 0.5655 0.5643 0.5635 0.5313 0.5392 0.5252 0.5578 0.5632 0.5480 371.07 392.35 399.00 382.08 379.15 368.48 364.48 358.10 351.24 344.72 119.87 113.02 105.85 100.56 105.48 103.40 107.15 92.91 96.70 - Seed/technology cost does not include any rebates that may be available from seed companies based on quantities purchased. Assumes: $3.00/cwt ginning cost. $250/ton for seed. Value for lint based on CCC loan value from grab samples and FBRI HVI results. 674 694 707 678 714 683 694 642 624 629 Seed value Total value Ginning cost Seed/technology 1 cost Net value 512.21 512.02 487.94 479.71 473.96 467.88 465.25 444.16 441.41 5.9 0.1089 NS 54.10 56.83 56.99 54.13 54.03 54.24 55.05 55.62 49.02 51.02 ---- 58.52 61.69 63.70 50.52 59.80 57.62 55.75 60.16 55.75 61.64 a a ab abc abcd abcd bcd cd d 7.1 0.0716† 36.69 363.44 393.70 391.33 383.29 365.87 362.11 357.07 349.47 339.39 328.76 ------------------------------------------------- $/acre ------------------------------------------------- Lint value 6.1 0.0727† 41.21 1803 1894 1900 1804 1801 1808 1835 1854 1634 1701 $/lb Lint loan value CV, % 3.7 3.9 5.9 5.9 6.1 3.0 6.1 6.1 0.0865† OSL 0.0423 0.0330 0.1095 0.0039 0.0480 0.1097 0.0039 LSD 2.4 3.2 NS 56 89 0.0288 NS 11.18 For net value/acre, means within a column with the same letter are not significantly different at the 0.05 probability level. CV - coefficient of variation. OSL - observed significance level, or probability of a greater F value. LSD - least significant difference at the 0.05 level, †indicates significance at the 0.10 level, NS - not significant. Note: some columns may not add up due to rounding error. 46.5 Seed yield 476.06 37.4 Test average 50.6 47.6 46.9 44.7 46.7 45.1 46.2 45.5 45.5 Lint yield ------------- lb/acre ------------- Bur cotton yield 104.99 36.6 37.2 37.6 39.6 37.8 37.8 34.6 38.2 37.0 -------- % -------- Lint turnout FiberMax 1830GLT Deltapine 1454NR B2RF FiberMax 2011GT Deltapine 1321B2RF PhytoGen 367WRF NexGen 1511B2RF PhytoGen 417WRF NexGen 3306B2RF Stoneville 4946GLB2 Entry Table 2. Harvest results from the Terry County Irrigated RACE, Keith Harris Farm, Meadow, TX, 2014. 60 35.2 82.8 82.6 82.9 83.8 82.9 83.1 83.0 81.9 82.7 82.6 CV, % 4.2 1.5 0.5 OSL 0.0002 <0.0001 0.0092 LSD 0.3 0.9 0.7 CV - coefficient of variation. OSL - observed significance level, or probability of a greater F value. LSD - least significant difference at the 0.05 level, NS - not significant 4.5 Test average 34.3 35.1 35.9 35.2 35.0 37.4 34.1 34.8 35.0 % 32nds inch units 5.0 4.4 4.7 4.6 5.0 4.4 4.1 4.4 4.2 Uniformity Staple Micronaire Deltapine 1321B2RF Deltapine 1454NR B2RF FiberMax 1830GLT FiberMax 2011GT NexGen 1511B2RF NexGen 3306B2RF PhytoGen 367WRF PhytoGen 417WRF Stoneville 4946GLB2 Entry 1.6 <0.0001 0.9 30.6 30.2 31.5 31.7 31.0 30.8 31.2 30.1 29.9 28.9 g/tex Strength 4.7 <0.0001 0.7 8.4 9.4 8.1 8.4 7.5 9.4 6.4 9.7 8.5 7.9 % Elongation 49.9 0.3640 NS 1.6 2.0 2.0 1.0 1.7 2.3 1.0 1.0 1.7 2.0 grade Leaf Table 3. HVI fiber property results from the Terry County Irrigated RACE, Keith Harris Farm, Meadow, TX, 2014. 1.8 0.1048 NS 76.4 76.3 75.7 77.2 77.3 74.9 78.6 76.7 75.6 75.3 reflectance Rd 3.9 <0.0001 0.6 8.4 8.9 8.9 8.0 7.8 8.3 6.9 8.4 8.9 9.3 yellowness +b ---- 3.1 3.0 3.0 3.0 3.0 3.7 3.3 3.0 3.0 3.0 color 1 ---- 1.0 1.0 1.0 1.0 1.0 1.0 1.0 1.0 1.0 1.3 color 2 Color grade Texas Panhandle Cotton Variety Trials 07-947TX Submitted: March 2015 Dr. Jourdan Bell, Extension and Research Agronomist Texas A&M AgriLife Extension Service Amarillo, TX and Dr. Mark Kelley, Extension Agronomist – Cotton Texas A&M AgriLife Extension Service Lubbock, TX Introduction Planted cotton acreage in the Texas Panhandle increased by approximately 115,000 acres in 2014. As regional groundwater water levels decline across the Texas Panhandle, producers are unable to meet the water demand for many crops. Cotton is a sustainable alternative for limited irrigated conditions that is increasing in popularity among Panhandle producers. Cotton yields in the Texas Panhandle increased by approximately 80,000 bales in 2014 from 2013 production. Increased annual production is attributed to increased harvested acreage. While in-season precipitation was comparable to seasonal averages, heat unit accumulation was greatly reduced through July 2014 resulting in delayed reproductive growth and boll development across the central and northern Panhandle. In short-season cotton producing regions, variety selection is critical to avoid yield penalties due to the narrow production window between planting and maturity. Early and medium maturing varieties have a shorter bloom period and are generally more determinant than full season varieties. As a result, early maturing varieties are often unable to recover from in-season stress. The objective of this project was to evaluate the profitability of newer early and medium maturing cotton varieties grown in on-farm trials in the Texas Panhandle. Variety Characteristics In the 2014 Texas Panhandle Cotton Variety Trials, the following varieties were planted at 5 locations: Deltapine 1212B2RF: early maturating variety with excellent seed vigor. Well suited for limited irrigation. Medium to medium-short plant height. Deltapine 1410B2RF: early maturing, light hairy leaf and medium plant height. FiberMax 1320GL: an early maturing, short plant FiberMax 1830GLT: an early, medium maturing variety with a smooth leaf and moderate storm resistance FiberMax 2011GT: a short stature, early maturing variety NexGen 1511B2RF: a medium maturing with semi-smooth leaf. Plant height is medium to tall and labeled to be moderately storm tolerant. 61 NexGen 3306B2RF: an early-medium maturing variety with a semi-smooth leaf. Plant height is medium to tall and labeled to be very storm tolerant. PhytoGen 222WRF: a very early maturing variety with a smooth leaf, short plant height and excellent storm tolerance PhytoGen 333WRF: a medium to tall, early maturing variety with a hairy leaf type that is labeled to be very storm tolerant PhytoGen 339WRF: a tall, early maturing variety with fair storm tolerance that has fair storm tolerance Stoneville 4747GLB2: a very early maturing variety Materials and Methods Varieties were planted in a randomized complete block design with three replications at each of the five original locations. 2014 trials were located in the following counties: County Sherman Moore Hartley Gray Carson Location Sunray Dumas Dalhart Pampa White Deer Agent Marcel Fischbacher Marcel Fischbacher Michael Bragg Brandon McGinty Jody Bradford Cooperator Tommy Cartrite Stan Spain Mark and Ryan Williams Ryan Davis Dudley Pohnert All locations were under center pivot irrigation. Weed and insect control measures, if needed, and harvest aid applications were performed by cooperating producers. Plots were harvested with commercial harvesters by producers with assistance provided by program personnel at all locations. The Carson County location was lost in early June due to thrips and hail damage. The remaining locations were taken to harvest; however, the yield at the Sherman County location was reduced by a late storm. Plots were harvested using producer/cooperator equipment, and grab samples were taken by plot and ginned at the Texas A&M AgriLife Research and Extension Center at Lubbock. Resulting lint samples were submitted to the Texas Tech University – Fiber and Biopolymer Research Institute for HVI fiber analysis and CCC loan values were calculated for all locations except the Sunray, Sherman County location. At Sunray, plot conditions were poor and variable at the time of harvest; upper position bolls had been dropped and lower bolls were of varying condition. Lint was strung out from the bolls that were open, or lint remained tight in the bur. Lint samples were insufficient to be properly evaluated for HVI fiber quality. 62 63 Harvest Date Varieties Harvest Aid Date of Sequential Harvest Aid Application Harvest Aid County Location Latitude, Longitude Soil Type Irrigation Precipitation Previous Crop Fertilizer Planting Population Replications Date Planted Date of Initial Harvest Aid Application 1/20/2015 Deltapine 1212B2RF Deltapine 1410B2RF FiberMax 1320GL FiberMax 2011GT NexGen 1511B2RF NexGen 3306B2RF PhytoGen 222WRF PhytoGen 333WRF Stoneville 4747GLB2 Sherman Sunray 36.113855, -101.765726 Sherman Clay Loam N/A 10.8" Grain Sorghum N/A 56000 3 5/7/2014 2014 Agronomic Information for Each Location: 12/4/2014 Deltapine 1212B2RF Deltapine 1410B2RF FiberMax 1320GL FiberMax 2011GT NexGen 1511B2RF NexGen 3306B2RF PhytoGen 222WRF PhytoGen 333WRF PhytoGen 339WRF Stoneville 4747GLB2 12/3 & 4/2014 Deltapine 1212B2RF Deltapine 1410B2RF FiberMax 1320GL FiberMax 1830GLT FiberMax 2011GT NexGen 3306B2RF PhytoGen 222WRF Stoneville 4747GLB2 Gramoxone 28 oz/ac Sharpen 1 oz/ac Harvest Pro 16 oz/ac 11/1/2014 Ethephon 32 oz/ac Folex 12 oz/ac 10/31/2014 Folex 16 oz/ac Harvest Pro 32 oz/ac Moore Hartley Dumas Middlewater 35.929955, -102.135087 35.866343, -102.802080 Sherman Silt Loam Dallam Fine Sandy Loam 7.18" 18" 8.6" 5.5" Cotton Wheat N/A 30 units NPK 65000 55000 3 3 5/6/2014 5/8/2014 10/17/2014 10/20/2014 1/16/2015 Deltapine 1212B2RF Deltapine 1410B2RF FiberMax 1320GL FiberMax 2011GT NexGen 1511B2RF NexGen 3306B2RF PhytoGen 222WRF PhytoGen 333WRF PhytoGen 339WRF Stoneville 4747GLB2 Folex 16 oz/ac + MSO 4oz/ac Boll'd 32 oz/ac) Gray Pampa 35.604750, -100.951973 Pullman Clay Loam 10" (2" pre) 12.2" Wheat N/A 58000 3 5/23/2014 10/21/2014 Yield and HVI Results Location 1 – Sunray, Sherman County At the Sunray, Sherman County location, substantial field variability was observed and resulted in significant differences among varieties for lint and seed turnout (Table 1). Lint turnouts of field-cleaned bur cotton averaged 17.9% with a high of 22.5% for Stoneville 4747GLB2 and a low of 15.4% for PhytoGen 222WRF. Seed turnouts averaged 37.8% and ranged from a high of 45.3% for Stoneville 4747GLB2 to a low of 30.5% for NexGen1511B2RF. Bur cotton, lint and seed yields averaged 2300, 427, and 897 lb/acre, respectively. Stoneville 4747GLB2 had the highest lint yield of 925 lbs/acre. Lint samples were unable to be evaluated for HVI fiber analysis which prevented evaluation of economic parameters. Location 2 – Dumas, Moore County At the Dumas, Moore County location, lint turnouts of field-cleaned bur cotton averaged 28.7% (Table 2) with a high of 30.7% for FiberMax 1320GL. Bur cotton yields averaged 3398 lbs/acre and Stoneville 4747GLB2 was greatest with 4011 lbs/acre. Lint yields averaged 977 lbs/ac and ranged from a high of 1183 lb/acre for Stoneville 4747GLB2 to a low of 801 lbs/acre for NexGen1511B2RF. Seed yields averaged 1731 lbs/acre across all varieties. Loan values derived from grab samples averaged $0.4959, and ranged from a high of $0.5127 for Deltapine 1212B2RF to a low of $0.4517 for NexGen1511B2RF. After applying loan values to lint yields, the test average lint value was $485.50/acre. After subtracting ginning and seed/technology costs from total value (lint value + seed value), net value averaged $505.60/acre all across varieties. Net values ranged from a high of $620.47/acre to a low of $366.19/acre for Stoneville 4747GLB2 and NexGen1511B2RF, respectively. FiberMax 2011GT $597.37/acre), FiberMax 1320GL ($565.91/acre), and PhytoGen 333WRF ($552.36/acre) were included in the statistical upper tier for net value with Stoneville 4747GLB2. A difference of approximately $254/acre was observed between the highest and lowest performing varieties at this location. Classing data from grab samples are reported in Table 3. Micronaire values ranged from a high of 3.0 for FiberMax 1320GL to a low of 2.3 for NexGen1511B2RF. Staple was highest for Deltapine 1410B2RF (36.9) and lowest for NexGen 1511B2RF (34.6). The highest uniformity, 82.4%, was observed in NexGen 3306B2RF and NexGen 1511B2RF had the lowest with 80.5%. Fiber strength values ranged from a high of 30.4 g/tex for NexGen 3306B2RF to a low of 26.2 g/tex for Stoneville 4747GLB2. Elongation averaged 7.7% and leaf grades averaged 1.4 across varieties. Color grade components of Rd (reflectance) and +b (yellowness) averaged 80.5 and 8.2, respectively and resulted in average color grades of mostly 21. Location 3 – Middlewater, Hartley County Lint turnouts of field-cleaned bur cotton at the Middlewater, Hartley County location, averaged 31.9% (Table 4). Bur cotton yields averaged 4293 lbs/acre and lint yields ranged from a high of 1544 lbs/acre for FiberMax 2011GT to a low of 1205 lbs/acre for PhytoGen 222WRF. Seed yields averaged 1989 lbs/acre. Loan values derived from grab samples averaged $0.5710/lb across all varieties. After applying loan values to lint 64 yields, the test average lint value was $782.45/acre. After subtracting ginning and seed/technology costs from total value (lint value + seed value), net value averaged $821.67/acre across all varieties. Net values ranged from a high of $929.85/acre for FiberMax 2011GT to a low of $721.17/acre for PhytoGen 222WRF. A difference of approximately $209/acre was observed between the highest and lowest performing varieties at this location. Classing data from grab samples at Middlewater are reported in Table 5. Micronaire values at averaged 3.9. and ranged from a high of 4.3 for FiberMax 1320GL to a low of 3.6 for Deltapine 1410B2RF. Staple averaged 37.1 and uniformity averaged 82.1%. The highest staple was observed in FiberMax 1830GLT (38.5) and the greatest uniformity value of 83.6% was observed in NexGen 3306B2RF. Fiber strength values ranged from a high of 32.2 g/tex for NexGen 3306B2RF to a low of 28.0 g/tex for Stoneville 4747GLB2. Elongation and leaf grades averaged 8.2% and 1.3, respectively. Color grade components, reflectance (Rd) and yellow (+b) averaged 79.6 and 7.9 respectively. This resulted in color grades of mostly 21 and 31. Location 4 – Pampa, Gray County At the Pampa, Gray County location, lint turnouts of field-cleaned bur cotton averaged 27.3% (Table 6). Bur cotton yields averaged 4767 lbs/acre and PhytoGen 339WRF was greatest with 5374 lbs/acre. Lint yields ranged from a high of 1498 lbs/acre for PhytoGen 339WRF to a low of 1100 lbs/acre for Stoneville 4747GLB2. Seed yields averaged 2295 lbs/acre across all varieties. Loan values derived from grab samples averaged $0.5043/lb and ranged from $0.5377 for Deltapine 1212B2RF to $0.4900 for NexGen 3306B2RF. After applying loan values to lint yields, the test average lint value was $657.92/acre. After subtracting ginning and seed/technology costs from total value (lint value + seed value), net value averaged $721.97/acre across all varieties. Net values ranged from a high of $848.63/acre to a low of $583.05/acre for Deltapine 1212B2RF and Stoneville 4747GLB2, respectively. PhytoGen 339WRF ($830.92/acre), FiberMax 2011GT ($829.04/acre), and FiberMax 1320GL ($810.44/acre) were not statistically different from Deltapine 1212B2RF in terms of net value. A difference of approximately $265/acre was observed between the highest and lowest performing varieties at this location. Classing data from grab samples are reported in Table 7. Significant differences were observed among varieties for strength and elongation only at this location. Micronaire values averaged 2.9., staple averaged 37.5, and uniformity averaged 82.1%. Fiber strength values ranged from a high of 30.7 g/tex for FiberMax 1320GL to a low of 27.5 g/tex for PhytoGen 339WRF. Elongation values averaged 7.5% and leaf grades averaged 2.1. Color grade components, reflectance (Rd) and yellow (+b) averaged 76.9 and 7.9, respectively. This resulted in color grades of mostly 31 and 41. Summary and Conclusions Over the last several years, cotton producers in the Texas Panhandle region have increased planted acreage of cotton from approximately 616 thousand in 2008 to approximately 1.25 million in 2011. While regional cotton production has been variable since 2011 due to drought conditions, regionally, cotton production is still a very 65 important part of the Panhandle economy. With improved genetics and technologies, as well as the benefits of rotational crop management systems, cotton yields in the Texas Panhandle topped 1.4 million bales in 2010. In 2014, production increased approximately 90,000 bales over 2013 to 845,000 bales. As producers begin to regain cotton acreage, data generated from regional variety trials is utilized in varietal selections. Characteristics commonly evaluated include lint yield, turnout percentages, fiber quality, and earliness. The objective of this project was to evaluate the profitability of cotton varieties in producers' fields in the Texas Panhandle. Trials where located in Sherman County (northeast of Sunray), Moore County (northwest of Dumas), Hartley County (west of Middlewater), Gray County (north of Pampa), and Carson County (south of White Deer). The Carson County location was lost in early June due to thrips and hail. The remaining locations were taken to harvest; however, the yield at the Sherman County location was reduced by a late storm. Across all trials, the greatest average lint turnout was 31.9% at the Middlewater location. The greatest average bur cotton yield was 4767 lbs/ac at Pampa with the greatest bur cotton yield achieved by PhytoGen 339WRF at 5374 lbs/ac. However, the greatest test average net value was achieved at Middlewater with $821.67/acre. Evaluation of the highest and lowest performing varieties at Middlewater, Dumas and Pampa resulted in an overall difference of approximately $243/acre. Several varieties performed well at individual locations, and when comparing across locations, Deltapine 1212B2RF, FiberMax 1320GL, FiberMax 1830GLT, FiberMax 2011GT, PhytoGen 333WRF, PhytoGen 339WRF, and Stoneville 4747GLB2 were generally in the statistical upper tier for net value. Differences in net value were observed among varieties at all locations for 2014. However, this is not always the case and producers should compare varieties across as many years and locations as possible before deciding on a new variety. As industry continues to release new varieties with varying technologies, additional multisite and multi-year applied research is needed to evaluate these varieties across a series of environments. Acknowledgments We wish to express our appreciation to the producer-cooperators: Ryan Davis of Pampa (Gray County location), Mark and Ryan Williams of Middlewater (Hartley County), Tommy Cartrite of Sunray (Sherman County), Stan Spain of Dumas (Moore County), and Dudley Ponhert of Pampa (White Deer, Carson County location) for providing the land, equipment and time to conduct these projects. Furthermore, we thank Dr. Jane Dever and Ms. Valerie Morgan – Texas A&M AgriLife Research for use of the ginning facilities and Dr. Eric Hequet – Texas Tech University Fiber and Biopolymer Research Institute for HVI fiber quality analyses. We gratefully acknowledge Ms. Kristie Keys and Mr. Travis Brown for their assistance. Finally, we sincerely thank Cotton Incorporated – Texas State Support Committee for their generosity in funding this and other research projects. 66 67 17.9 Test average -------- % -------- 37.8 45.3 43.6 36.5 35.8 35.4 38.7 36.5 37.7 30.5 Seed turnout Lint yield Seed yield 2300 4102 2804 2647 2645 2066 1865 2036 1475 1063 a b b b bc bc bc c c 427 925 582 455 452 373 325 314 241 177 12.3 <0.0001 190 897 1858 1221 967 946 731 722 743 557 324 ------------------------------------ lb/acre ----------------------------------------- Bur cotton yield CV, % 7.9 10.3 11.5 12.4 OSL 0.0003 0.0099 <0.0001 <0.0001 LSD 2.5 6.7 459 92 For lint yield, means within a column with the same letter are not significantly different at the 0.05 probability level. CV - coefficient of variation. OSL - observed significance level, or probability of a greater F value. LSL - least significant diffierence at the 0.05 level. Note: some columns may not add up due to rounding error. 22.5 20.8 17.2 17.1 18.0 17.4 15.4 16.3 16.6 Lint turnout Stoneville 4747GLB2 FiberMax 2011GT FiberMax 1320GL PhytoGen 333WRF Deltapine 1410B2RF Deltapine 1212B2RF PhytoGen 222WRF NexGen 3306B2RF NexGen 1511B2RF Entry Table 1. Harvest results from the Large Plot Replicated Irrigated Cotton Variety Trial , Cartrite Farm, Moore, TX, 2014. 68 Seed turnout Assumes: $3.00/cwt ginning cost. $250/ton for seed. Value for lint based on CCC loan value from grab samples and FBRI HVI results. 977 1183 1102 1050 1063 978 971 936 882 803 801 1731 2050 1855 1671 1917 1703 1821 1741 1617 1461 1478 0.4959 0.4965 0.5072 0.5232 0.4910 0.5127 0.4948 0.4905 0.4833 0.5077 0.4517 Seed value Total value Ginning cost Seed/technology cost Net value 485.50 587.27 559.04 549.40 521.99 501.64 480.42 459.34 426.25 407.66 361.96 256.24 231.91 208.91 239.58 212.82 227.67 217.61 202.12 182.67 184.75 843.52 790.96 758.31 761.57 714.46 708.09 676.95 628.37 590.33 546.71 9.6 0.0052 16.72 101.95 120.32 109.39 102.58 113.18 101.12 102.43 104.46 96.65 81.74 87.60 ---- 94.38 102.73 84.20 89.82 96.03 96.55 96.55 96.03 96.03 92.92 92.92 a ab abc abc bcd bcde cde def ef f 11.6 0.0007 100.50 505.60 620.47 597.37 565.91 552.36 516.79 509.11 476.45 435.69 415.67 366.19 ------------------------------------------------- $/acre ------------------------------------------------- Lint value 9.7 0.0010 117.20 3398 4011 3646 3419 3773 3371 3414 3482 3222 2725 2920 $/lb Lint loan value CV, % 5.9 4.3 9.6 9.6 9.8 3.3 9.7 9.8 OSL 0.1664 0.2999 0.0052 0.0012 0.0092 0.0036 0.0002 0.0092 LSD NS NS 557 161 290 0.0278 81.00 36.26 For net value/acre, means within a column with the same letter are not significantly different at the 0.05 probability level. CV - coefficient of variation. OSL - observed significance level, or probability of a greater F value. LSD - least significant difference at the 0.05 level, NS - not significant. Note: some columns may not add up due to rounding error. 51.0 Seed yield 701.93 28.7 Test average 51.1 50.9 48.9 50.8 50.5 53.3 50.0 50.2 53.6 50.6 Lint yield ------------- lb/acre ------------- Bur cotton yield 216.43 29.5 30.2 30.7 28.2 29.0 28.4 26.9 27.4 29.5 27.4 -------- % -------- Lint turnout Stoneville 4747GLB2 FiberMax 2011GT FiberMax 1320GL PhytoGen 333WRF Deltapine 1212B2RF Deltapine 1410B2RF PhytoGen 222WRF PhytoGen 339WRF NexGen 3306B2RF NexGen 1511B2RF Entry Table 2. Harvest results from theLarge Plot Irrigated Replicated Cotton Variety TrialStan Spain Farm, Dumas - Moore Co, TX, 2014. 69 35.7 81.4 81.9 80.9 81.6 81.3 80.5 82.4 82.3 81.1 81.3 80.7 CV, % 5.5 1.1 0.4 OSL 0.0010 <0.0001 <0.0001 LSD 0.3 0.7 0.6 CV - coefficient of variation. OSL - observed significance level, or probability of a greater F value. LSD - least significant difference at the 0.05 level, NS - not significant 2.7 Test average 35.8 36.9 35.0 35.4 34.6 36.5 35.1 35.9 35.5 36.1 % 32nds inch units 2.8 2.6 3.0 2.7 2.3 2.7 2.8 2.6 2.5 2.8 Uniformity Staple Micronaire Deltapine 1212B2RF Deltapine 1410B2RF FiberMax 1320GL FiberMax 2011GT NexGen 1511B2RF NexGen 3306B2RF PhytoGen 222WRF PhytoGen 333WRF PhytoGen 339WRF Stoneville 4747GLB2 Entry 3.4 0.0011 1.6 28.3 28.9 29.7 28.3 28.1 26.4 30.4 28.2 28.9 28.0 26.2 g/tex Strength 6.3 <0.0001 0.8 7.7 8.5 6.7 8.0 7.1 7.7 8.4 8.9 7.2 8.2 6.1 % Elongation 48.8 0.2430 NS 1.4 1.3 1.3 1.0 1.3 2.5 1.0 1.0 2.0 1.3 1.3 grade Leaf 1.5 0.2748 NS 80.5 79.3 80.2 80.2 82.1 80.6 80.2 80.3 80.0 81.5 80.9 reflectance Rd 3.1 <0.0001 0.4 8.2 8.7 7.9 8.1 7.7 8.7 8.8 8.3 8.7 8.2 7.1 yellowness +b Table 3. HVI fiber property results from theLarge Plot Irrigated Replicated Cotton Variety Trial Stan Spain Farm, Dumas - Moore Co, TX, 2014. ---- 2.1 2.0 2.3 2.3 2.0 1.7 1.7 2.0 2.0 2.0 2.7 color 1 ---- 1.0 1.0 1.0 1.0 1.0 1.0 1.0 1.0 1.0 1.0 1.0 color 2 Color grade 70 Seed turnout Assumes: $3.00/cwt ginning cost. $250/ton for seed. Value for lint based on CCC loan value from grab samples and FBRI HVI results. 1371 1544 1473 1438 1428 1351 1260 1269 1205 1989 2062 1904 2096 1940 2005 2053 2003 1846 0.5710 0.5703 0.5658 0.5670 0.5785 0.5615 0.5822 0.5663 0.5760 Seed value Total value Ginning cost Seed/technology cost Net value 782.45 880.45 833.32 815.17 825.95 758.67 733.26 718.45 694.37 257.71 238.04 262.01 242.50 250.59 256.59 250.39 230.80 1138.16 1071.36 1077.18 1068.45 1009.26 989.85 968.84 925.17 5.5 0.1738 NS 128.80 137.07 127.17 135.40 125.27 132.70 124.72 125.36 122.73 ---- 80.56 71.25 76.00 81.70 87.00 86.93 78.63 81.70 81.26 a ab ab ab bc bc c c 6.0 0.0029 86.86 821.67 929.85 868.18 860.09 856.17 789.64 786.50 761.78 721.17 ------------------------------------------------- $/acre ------------------------------------------------- Lint value 5.5 0.0079 99.26 4293 4569 4239 4513 4176 4423 4157 4179 4091 $/lb Lint loan value CV, % 5.2 4.0 5.5 5.6 5.4 2.3 5.5 5.4 OSL 0.0072 0.0921† 0.1743 0.0009 0.1503 0.5135 0.0012 0.1493 LSD 2.9 2.6 NS 134 NS NS 75.78 NS For net value/acre, means within a column with the same letter are not significantly different at the 0.05 probability level. CV - coefficient of variation. OSL - observed significance level, or probability of a greater F value. LSD - least significant difference at the 0.05 level, †indicates significance at the 0.10 level, NS - not significant. Note: some columns may not add up due to rounding error. 46.3 Seed yield 1031.03 31.9 Test average 45.1 44.9 46.4 46.5 45.3 49.4 47.9 45.1 Lint yield ------------- lb/acre ------------- Bur cotton yield 248.58 33.8 34.7 31.9 34.2 30.5 30.3 30.4 29.5 -------- % -------- Lint turnout FiberMax 2011GT FiberMax 1320GL Deltapine 1212B2RF FiberMax 1830GLT Stoneville 4747GLB2 NexGen 3306B2RF Deltapine 1410B2RF PhytoGen 222WRF Entry Table 4. Harvest results from the Large Plot Replicated Irrigated Cotton Variety Trial, Mark and Ryan Williams Farm, Middlewater, TX, 2014. 71 37.1 82.1 82.4 81.0 82.0 82.2 81.7 83.6 82.6 80.8 30.6 32.1 30.9 30.6 30.9 30.5 32.2 29.3 28.0 g/tex Strength 8.2 9.9 7.3 8.7 7.0 7.7 8.7 9.8 6.7 % Elongation 1.3 1.0 1.7 1.0 1.3 1.3 1.3 1.3 1.7 grade Leaf CV, % 6.2 1.6 1.0 2.9 4.1 54.6 0.0692† OSL 0.0001 0.0174 0.0009 <0.0001 0.9110 LSD 0.4 1.0 1.4 1.5 0.6 NS CV - coefficient of variation. OSL - observed significance level, or probability of a greater F value. LSD - least significant difference at the 0.05 level, †indicates significance at the 0.10 level, NS - not significant 3.9 Test average 37.4 37.8 35.6 38.5 35.7 38.3 36.3 37.1 % 32nds inch units 4.0 3.6 4.3 3.7 3.8 3.8 4.1 4.0 Uniformity Staple Micronaire Deltapine 1212B2RF Deltapine 1410B2RF FiberMax 1320GL FiberMax 1830GLT FiberMax 2011GT NexGen 3306B2RF PhytoGen 222WRF Stoneville 4747GLB2 Entry 1.6 0.0637† 1.8 79.6 78.1 79.4 79.8 81.2 80.0 80.2 80.3 77.8 reflectance Rd 3.9 0.0009 0.5 7.9 8.2 7.9 8.0 7.7 7.6 8.8 8.1 7.1 yellowness +b ---- 2.6 3.0 2.7 2.7 2.3 2.7 2.0 2.3 3.3 color 1 ---- 1.0 1.0 1.0 1.0 1.0 1.0 1.0 1.0 1.0 color 2 Color grade Table 5. HVI fiber property results from the Large Plot Replicated Irrigated Cotton Variety Trial, Mark and Ryan Williams Farm, Middlewater, TX, 2014. 72 Seed turnout Assumes: $3.00/cwt ginning cost. $250/ton for seed. Value for lint based on CCC loan value from grab samples and FBRI HVI results. 1303 1455 1498 1502 1460 1314 1187 1194 1156 1166 1100 2295 2359 2606 2489 2358 2390 2304 2292 2200 1888 2067 0.5043 0.5377 0.4992 0.4960 0.5087 0.5105 0.5073 0.4968 0.4900 0.5053 0.4912 Seed value Total value Ginning cost Seed/technology cost Net value 657.92 782.26 747.71 744.91 742.62 670.75 602.01 593.21 566.24 589.30 540.22 294.85 325.70 311.15 294.69 298.78 287.95 286.44 275.05 235.99 258.41 1077.11 1073.41 1056.07 1037.32 969.54 889.96 879.65 841.29 825.28 798.64 5.4 0.0002 13.16 143.00 146.78 161.23 155.78 150.87 147.53 143.91 137.67 134.38 123.14 128.67 ---- 79.86 81.70 81.26 71.25 76.00 81.26 78.63 81.70 78.63 81.26 86.93 a a a ab bc cd d de de e 6.0 <0.0001 73.69 721.97 848.63 830.92 829.04 810.44 740.75 667.43 660.28 628.29 620.89 583.05 ------------------------------------------------- $/acre ------------------------------------------------- Lint value 5.4 <0.0001 86.83 4767 4893 5374 5193 5029 4918 4797 4589 4479 4105 4289 $/lb Lint loan value CV, % 11.1 10.1 5.4 5.4 5.4 5.6 5.3 5.4 OSL 0.4991 0.9966 0.0002 <0.0001 <0.0001 0.6836 <0.0001 <0.0001 LSD NS NS 439 121 212 NS 60.38 26.52 For net value/acre, means within a column with the same letter are not significantly different at the 0.05 probability level. CV - coefficient of variation. OSL - observed significance level, or probability of a greater F value. LSD - least significant difference at the 0.05 level, NS - not significant. Note: some columns may not add up due to rounding error. 48.1 Seed yield 944.83 27.3 Test average 48.2 48.5 47.9 46.9 48.6 48.0 49.9 49.1 46.0 48.2 Lint yield ------------- lb/acre ------------- Bur cotton yield 286.90 29.7 27.9 28.9 29.0 26.7 24.7 26.0 25.8 28.4 25.6 -------- % -------- Lint turnout Deltapine 1212B2RF PhytoGen 339WRF FiberMax 2011GT FiberMax 1320GL PhytoGen 333WRF NexGen 1511B2RF Deltapine 1410B2RF NexGen 3306B2RF PhytoGen 222WRF Stoneville 4747GLB2 Entry Table 6. Harvest results from theLarge Plot Replicated Irrigated Cotton Variety TrialRyan Davis Farm, Pampa, TX, 2014. 73 37.5 82.1 82.1 81.9 82.8 82.3 82.6 81.9 81.9 82.4 81.4 82.0 CV, % 9.6 2.0 1.0 OSL 0.7374 0.1729 0.6354 LSD NS NS NS CV - coefficient of variation. OSL - observed significance level, or probability of a greater F value. LSD - least significant difference at the 0.05 level, NS - not significant 2.9 Test average 37.2 38.4 38.1 36.9 37.4 38.1 36.6 37.4 37.4 37.5 % 32nds inch units 3.2 2.9 3.0 2.9 2.9 2.9 2.9 2.9 2.9 2.7 Uniformity Staple Micronaire Deltapine 1212B2RF Deltapine 1410B2RF FiberMax 1320GL FiberMax 2011GT NexGen 1511B2RF NexGen 3306B2RF PhytoGen 222WRF PhytoGen 333WRF PhytoGen 339WRF Stoneville 4747GLB2 Entry 2.5 0.0029 1.3 29.7 30.4 30.5 30.7 29.6 29.3 29.8 29.3 30.2 27.5 29.4 g/tex Strength 10.3 0.0471 1.3 7.5 8.2 7.1 7.1 8.1 7.6 8.0 8.1 7.2 6.0 8.1 % Elongation 43.4 0.5426 NS 2.1 2.7 2.3 2.3 1.7 2.0 2.3 2.7 1.3 2.0 1.3 grade Leaf 1.8 0.3319 NS 76.9 76.5 76.6 77.8 75.9 77.7 75.8 75.5 77.5 77.7 77.6 reflectance Rd +b 6.5 0.0464 0.9 7.9 8.0 7.6 7.7 8.2 8.4 7.8 8.7 7.8 7.0 7.6 yellowness Table 7. HVI fiber property results from the Large Plot Replicated Irrigated Cotton Variety TrialRyan Davis Farm, Pampa, TX, 2014. ---- 3.4 3.3 3.7 3.3 3.3 3.0 4.0 3.3 3.3 3.7 3.3 color 1 ---- 1.0 1.0 1.0 1.0 1.3 1.0 1.0 1.0 1.0 1.0 1.0 color 2 Color grade Replicated Dryland Large Plot Demonstrations 74 Replicated Dryland RACE Variety Trial, Lamesa, TX - 2014 Cooperator: Lamesa Cotton Growers/Texas A&M AgriLife Research/ Texas A&M AgriLife Extension Mark Kelley, Kristie Keys, Tommy Doederlein, and Gary Roschetzky Extension Agronomist – Cotton, Extension Assistant – Cotton, EA-IPM Dawson/Lynn Counties and CEA-ANR Dawson County Dawson County Objective: The objective of this study is to compare agronomic characteristics, yields, gin turnout, fiber quality, and economic returns of transgenic cotton varieties under dryland production on the Texas High Plains. Materials and Methods: Varieties: NexGen 1511B2RF, PhytoGen 499WRF, FiberMax 2334GLT, PhytoGen 417WRF, Stoneville 4946GLB2, FiberMax 2011GT, PhytoGen 367WRF, NexGen 4111RF Experimental design: Randomized complete block with three (3) replications. Planting date: 19-May Seeding rate: Planted 4.0 seeds/row-ft, or 52,272 seed/A, to prepared, listed 40 inch rows using a commercial John Deere MaxEmerge XP vacuum planter. Plot size: 4 rows by variable length (253-872 ft) Weed management: Trifluralin was applied preplant and incorporated at a rate of 1.3 pt/A on 9-April. A post-emergent application of glyphosate (RoundUp PowerMax at 32 oz/A) and metolachlor (Dual II Magnum at 1 pt/A) was made on 13-June. The trial was cultivated with sweeps on 21-June and hoed by hand on 6-Aug. 75 Irrigation: To ensure germination, 3.30” of irrigation was applied preplant. An additional 0.4” of irrigation was applied 28-June to deliver fertilizer. Rainfall: Based on the nearest Texas Tech University – West Texas Mesonet station at Lamesa, rainfall amounts were: April: May: June: July: 0.25" 1.26" 3.67" 1.24" August: September: October: Total rainfall: 0.45" 6.42" 0.02” 13.31" Fertility Management: A preplant application of 10-34-0 at a rate of 110 lb/A was made on 1-April. On 28-June, 30 lb/A 32-0-0 was applied via fertigation. Plant growth regulators: None were applied at this location. Harvest aids: An application of ethephon (Boll Buster at 1 qt/A) and pyraflufen ethyl (ET at 2oz/A) with 1% v/v COC was made on 4-Oct. This was followed by an application of pyraflufen ethyl (ET at 3 oz/acre ) and 1% v/v COC on 18-Oct. Due to difficulties in terminating crop and substantial regrowth, an additional application of pyraflufen ethyl (ETX at 1 oz/A) and paraquat (Gramoxone Inteon at 1 pt/A) with 1% v/v COC was made on 31-Oct. Harvest: Plots were harvested on 14-Nov using a commercial John Deere 7445 with bur extractor. Harvested material was transferred into a weigh wagon with integral electronic scales to determine individual plot weights. Plot yields were adjusted to lb/acre. Gin turnout: Grab samples were taken by plot and ginned at the Texas A&M AgriLife Research and Extension Center at Lubbock to determine gin turnouts. Fiber analysis: Lint samples were submitted to the Texas Tech University – Fiber and Biopolymer Research Institute for HVI analysis, and USDA Commodity Credit Corporation (CCC) loan values were determined for each variety by plot. Ginning cost and seed values: Seed and Technology fees: Ginning costs were based on $3.00 per cwt. of burr cotton and seed value/acre was based on $250/ton. Ginning cost did not include check-off. Seed and technology costs were calculated using the appropriate seeding rate (4.0 seed/row-ft) for the 40-inch row spacing and entries using the online Plains Cotton Growers Seed Cost Comparison Worksheet available at: http://plainscotton.org/Seed/PCGseed14.xls. 76 Results and Discussion: Agronomic data including plant population and nodes above white flower (NAWF) are included in Table 1. Significant differences were noted for most yield and economic parameters (Table 2). Stripper harvested lint turnout averaged 37.1% across all varieties and seed turnouts averaged 49.4%. Lint yields ranged from a low of 286 lb/acre (PhytoGen 499WRF) to a high of 393 lb/acre (NexGen 1511B2RF). Lint loan values ranged from a high of $0.4988/lb to a low of $0.4412/lb for FiberMax 2334GLT and PhytoGen 417WRF, respectively. Lint values ranged from a high of $180.02/acre for NexGen 1511B2RF to a low of $134.68/acre for PhytoGen 499WRF. After adding lint and seed values, total values averaged $218.05/acre with a high of $242.02/acre for NexGen 1511B2Rf and a low of $186.61/acre for PhytoGen 499WRF. When subtracting ginning and seed and technology costs, the net value/acre averaged $114.67, and ranged from a high of $137.67 for NexGen 1511B2RF to a low of $83.30 for PhytoGen 499WRF, a difference of $54.37/acre. Significant differences were observed for some fiber quality parameters at this location (Table 3). Micronaire values ranged from a low of 4.4 for PhytoGen 417WRF and FiberMax 2011GT to a high of 4.8 for FiberMax 2334GLT and Stoneville 4946GLB2. Staple averaged 31.4 across all varieties with a low of 30.0 (PhytoGen 417WRF) and a high of 32.7 (FiberMax 2334GLT). Uniformity averaged 79.5% and strength averaged 26.8 g/tex across all varieties. Significant differences were observed among varieties for percent elongation, averaging 8.0% overall with a high of 8.9% and a low of 6.4% for NexGen 1511B2RF and FiberMax 2334GLT, respectively. Leaf grades averaged 3.0 across all varieties. Values for Rd, or reflectance averaged 69.8 and +b, or yellowness, averaged 9.0 across all varieties and resulted in color grades of mostly 41. These data indicate that substantial differences can be obtained in terms of net value/acre due to variety selection under dryland production. Additional multi-site and multi-year applied research is needed to evaluate varieties across a series of environments. Acknowledgments: Appreciation is expressed to Drs. Wayne Keeling and Danny Carmichael, Texas A&M AgriLife Research Systems Agronomist - Lubbock and Research Associate - AGCARES, Lamesa. Further assistance with this project was provided by Dr. Jane Dever and Ms. Valerie Morgan - Texas A&M AgriLife Research and Extension Center, Lubbock, and Dr. Eric Hequet - Associate Director, Fiber and Biopolymer Research Institute, Texas Tech University. Furthermore, we greatly appreciate funding for HVI testing from the Cotton Fibers Initiative Fund. Disclaimer Clause: Trade names of commercial products used in this report are included only for better understanding and clarity. Reference to commercial products or trade names is made with the understanding that no discrimination is intended and no endorsement by the Texas A&M System is implied. Readers should realize that results from one experiment do not represent conclusive evidence that the same response would occur where conditions vary. 77 78 3.3 Test average 43,515 47,190 41,019 41,019 42,834 40,656 45,012 44,649 45,738 5.2 5.1 5.1 5.0 4.7 5.1 5.7 5.6 5.1 28-Jul 18.9 0.6834 NS 4.1 3.7 4.3 3.9 3.5 4.1 4.7 4.3 4.0 5-Aug 13.0 0.0178 0.6 2.8 2.5 3.4 2.8 2.5 3.3 2.9 3.0 2.2 13-Aug Nodes Above White Flower (NAWF) for week of CV, % 8.0 7.9 11.7 OSL 0.2114 0.2273 0.5513 LSD NS NS NS For NAWF, numbers represent an average of 5 plants per variety per rep (15 plants per variety) CV - coefficient of variation. OSL - observed significance level, or probability of a greater F value. LSD - least significant difference at the 0.05 level, NS - not significant 3.6 3.1 3.1 3.3 3.1 3.4 3.4 3.5 plants/acre Plant population plants/row ft FiberMax 2011GT FiberMax 2334GLT NexGen 1511B2RF NexGen 4111RF PhytoGen 367WRF PhytoGen 417WRF PhytoGen 499WRF Stoneville 4946GLB2 Entry Table 1. Inseason plant measurement results from the Dawson County Dryland RACE Variety Trial, AGCARES Farm, Lamesa, TX, 2014. 79 Seed turnout 37.1 39.8 39.2 33.6 35.2 40.4 36.8 39.0 32.9 49.4 50.2 48.8 50.2 49.4 49.3 49.9 49.7 47.8 -------- % -------- Lint turnout Lint yield Seed yield 937 987 990 989 1031 835 909 888 870 348 393 388 332 363 337 335 346 286 463 496 483 497 509 412 454 441 415 ------------- lb/acre ------------- Bur cotton yield 0.4614 0.4580 0.4445 0.4592 0.4575 0.4988 0.4615 0.4412 0.4702 $/lb Lint loan value 1 160.12 180.02 172.32 152.50 166.13 168.26 154.52 152.55 134.68 7.3 0.0158 7.42 57.93 62.00 60.33 62.12 63.68 51.44 56.75 55.19 51.93 - Seed/technology cost does not include any rebates that may be available from seed companies based on quantities purchased. Assumes: $3.00/cwt ginning cost. $250/ton for seed. Value for lint based on CCC loan value from grab samples and FBRI HVI results. Seed value Total value Ginning cost Seed/technology 1 cost Net value 7.3 0.0207 27.73 218.05 242.02 232.65 214.62 229.81 219.70 211.27 207.74 186.61 7.3 0.0285 3.58 28.12 29.62 29.70 29.68 30.94 25.04 27.28 26.63 26.09 ---- 75.26 74.73 67.72 59.27 82.61 82.68 77.23 80.64 77.23 a ab abc abcd bcd cde de e 12.0 0.0041 24.16 114.67 137.67 135.24 125.67 116.25 111.97 106.76 100.48 83.30 ------------------------------------------------- $/acre ------------------------------------------------- Lint value CV, % 10.2 8.1 7.3 7.3 7.3 3.7 7.2 OSL 0.1728 0.9949 0.0286 0.0037 0.0158 0.0296 0.0075 LSD NS NS 119 45 59 0.0300 20.32 For net value/acre, means within a column with the same letter are not significantly different at the 0.05 probability level. CV - coefficient of variation. OSL - observed significance level, or probability of a greater F value. LSD - least significant difference at the 0.05 level, NS - not significant. Note: some columns may not add up due to rounding error. Test average NexGen 1511B2RF FiberMax 2011GT NexGen 4111RF Stoneville 4946GLB2 FiberMax 2334GLT PhytoGen 367WRF PhytoGen 417WRF PhytoGen 499WRF Entry Table 2. Harvest results from the Dawson County Dryland RACE Variety Trial, AGCARES Farm, Lamesa, TX, 2014. 80 31.4 79.5 80.0 79.9 79.5 78.0 79.6 79.8 79.6 79.7 CV, % 2.8 2.2 1.0 OSL 0.0093 0.0142 0.1183 LSD 0.2 1.2 NS CV - coefficient of variation. OSL - observed significance level, or probability of a greater F value. LSD - least significant difference at the 0.05 level, NS - not significant 4.6 Test average 31.5 31.6 31.1 30.0 31.4 31.7 30.9 32.7 % 32nds inch units 4.7 4.7 4.8 4.4 4.6 4.6 4.4 4.8 Uniformity Staple Micronaire NexGen 1511B2RF PhytoGen 499WRF Stoneville 4946GLB2 PhytoGen 417WRF PhytoGen 367WRF NexGen 4111RF FiberMax 2011GT FiberMax 2334GLT Entry 4.9 0.2864 NS 26.8 27.4 27.8 27.7 26.1 26.3 27.6 25.8 25.9 g/tex Strength 5.6 <0.0001 0.8 8.0 8.9 8.7 8.6 8.5 8.1 7.8 6.6 6.4 % Elongation 28.2 0.3556 NS 3.0 2.7 3.0 3.7 3.7 3.3 2.3 3.3 2.3 grade Leaf 2.2 0.0389 2.7 69.8 68.8 69.5 70.1 70.5 69.1 67.3 70.3 72.6 reflectance Rd Table 3. HVI fiber property results from the Dawson County Dryland RACE Variety Trial, AGCARES Farm, Lamesa, TX, 2014. 3.9 0.0033 0.6 9.0 9.1 9.0 8.9 9.4 9.2 9.6 8.4 8.2 yellowness +b ---- 4.3 4.7 4.0 4.0 4.0 4.0 4.7 4.7 4.0 color 1 ---- 1.7 1.7 2.0 2.0 2.0 1.7 2.0 1.3 1.0 color 2 Color grade Replicated Dryland RACE Variety Trial, Floydada- 2014 Cooperator: Gary Nixon Mark Kelley, Kristie Keys, and Cristen Brooks, Extension Agronomist – Cotton, Extension Assistant – Cotton, and CEA-ANR Floyd County Floyd County Objective: The objective of this study is to compare agronomic characteristics, yields, gin turnout, fiber quality, and economic returns of transgenic cotton varieties grown under dryland production on the Texas High Plains. Materials and Methods: Varieties: NexGen 1511B2RF, Stoneville 4946GLB2, PhytoGen 333WRF, NexGen 4111RF, PhytoGen 339WRF, FiberMax 2011GT Experimental design: Randomized complete block with three (3) replications. Planting date: 3-June Seeding rate: Planted 2.3 seed/row-ft to prepared, listed 40 inch rows using a John Deere 1700 vacuum planter. Plot size: 8 rows Weed management: Diuron (Direx) was applied post-plant at a rate of 1 qt/A on 4-June. Post-emergent applications of generic glyphosate at 22oz/A were made on 12-June and 15-July. Rainfall: Based on the nearest Texas Tech University- West Texas Mesonet station at Floydada, rainfall amounts were: April: 0.36" May: 5.80" June: 3.22" July: Aug: Sep: Total rainfall: 20.09" 81 3.09" 2.92" 4.30" Oct: 0.40” Plant growth regulators: Plant growth regulators were not used in this study. Harvest aids: A foliar application of ethephon (Boll’D at 1 qt/A) was made on 28-Oct. Harvest: Plots were harvested on 20-Nov with a commercial eight-row John Deere 7460 cotton stripper with bur extractor. Harvested material was transferred to a weigh wagon with integral electronic scales to record individual plot weights. Plot weights were subsequently converted to lb/acre. Gin turnout: Grab samples were taken by plot and ginned at the Texas A&M AgriLife Research and Extension Center at Lubbock to determine gin turnouts. Fiber analysis: Lint samples were submitted to the Texas Tech University – Fiber and Biopolymer Research Institute for HVI analysis, and USDA Commodity Credit Corporation (CCC) loan values were determined for each variety by plot. Ginning cost and seed values: Seed and Technology fees: Ginning cost was based on $3.00 per cwt. of bur cotton and seed value/acre was based on $250/ton. Ginning cost did not include check-off. Seed and technology costs were calculated using the appropriate seeding rate (2.3 seed/row-ft) for the 40-inch row spacing and entries using the online Plains Cotton Growers Seed Cost Comparison Worksheet available at: http://www.plainscotton.org/Seed/PCGseed14.xls Results and Discussion: No significant differences were noted for some yield and economic parameters (Table 1). Lint turnout averaged 30.7% and seed turnout averaged 45.9% across varieties and no differences were observed for either parameter. Bur cotton yields averaged 1981 lb/acre and resulted in lint yields averaging 605 lb/acre. Lint yields ranged from a high of 668 lb/acre for FiberMax 2011GT to a low of 539 lb/acre for NexGen 1511B2RF. Differences in lint loan values were significant and values ranged from a high of $0.5542/lb (PhytoGen 333WRF) to a low of $0.4768/lb for Stoneville 4946GLB2. After combining lint yield and loan value, lint values ($/acre) averaged $310.76/acre and ranged from a high of $366.05 for FiberMax 2011GT to a low of $263.50 for NexGen 1511B2RF. When adding lint and seed value, total value ranged from a high of $481.67/acre to a low of $354.97/acre for FiberMax 2011GT and NexGen 1511B2RF, respectively. After subtracting ginning, seed costs and technology fees, net value/acre averaged $323.22/acre. Net values ranged from a high of $383.06/acre (FiberMax 2011GT) to a low of $261.45/acre (NexGen 1511B2RF), a difference of $121.61. Differences were observed among varieties for some fiber quality parameters at this location (Table 2). Differences in micronaire values were not significant with a test average of 3.6. Staple averaged 35.5 across all varieties with a high of 36.5 for PhytoGen 333WRF and a low of 34.2 for NexGen 1511B2RF. Uniformity 82 averaged 82.8% across varieties. Strength ranged from a low of 30.4 g/tex for PhytoGen 333WRF to a high of 32.3 g/tex for NexGen 4111RF. Elongation averaged 8.7% across varieties with a high of 10.0 for NexGen 1511B2RF and a low of 7.9 for FiberMax 2011GT and PhytoGen 333WRF. Color grade components of Rd (reflectance) and +b (yellowness) averaged 72.7 and 10.2, respectively. Leaf grades were mostly 2 and 3 and color grades were mostly 31. These data indicate that substantial differences can be obtained in terms of net value/acre due to variety selection. Additional multi-site and multi-year applied research is needed to evaluate varieties across a series of environments. Acknowledgments: Appreciation is expressed to Gary Nixon for the use of his land, equipment and labor for this demonstration. Further assistance with this project was provided by Dr. Jane Dever and Ms. Valerie Morgan - Texas A&M AgriLife Research and Extension Center, Lubbock and Dr. Eric Hequet - Associate Director, Fiber and Biopolymer Research Institute, Texas Tech University. Furthermore, we greatly appreciate the Texas Department of Agriculture - Food and Fiber Research for funding of HVI testing. Disclaimer Clause: Trade names of commercial products used in this report are included only for better understanding and clarity. Reference to commercial products or trade names is made with the understanding that no discrimination is intended and no endorsement by the Texas A&M System is implied. Readers should realize that results from one experiment do not represent conclusive evidence that the same response would occur where conditions vary. 83 84 Seed turnout Seed yield 605 668 622 591 646 567 539 911 925 936 930 1020 923 732 0.5124 0.5477 0.5542 0.5110 0.4768 0.4953 0.4892 Seed value Total value 1 310.76 366.05 344.50 301.78 307.93 280.77 263.50 115.59 116.98 116.27 127.48 115.32 91.46 - Seed/technology cost does not include any rebates that may be available from seed companies based on quantities purchased. Assumes: $3.00/cwt ginning cost. $250/ton for seed. Value for lint based on CCC loan value from grab samples and FBRI HVI results. Ginning cost Seed/technology 1 cost Net value 481.64 461.47 418.05 435.41 396.09 354.97 3.1 <0.0001 3.35 59.42 59.71 57.58 60.44 66.45 61.69 50.63 ---- 41.97 38.86 44.32 34.02 47.41 44.32 42.89 a b c c d e 3.3 <0.0001 19.69 323.22 383.06 359.57 323.59 321.55 290.08 261.45 ------------------------------------------------- $/acre ------------------------------------------------- Lint value 3.0 <0.0001 23.03 1981 1990 1919 2015 2215 2056 1688 $/lb Lint loan value CV, % 9.1 5.6 3.1 3.0 3.1 4.7 3.0 3.1 OSL 0.1522 0.2751 <0.0001 <0.0001 <0.0001 0.0123 <0.0001 <0.0001 LSD NS NS 112 33 51 0.0437 16.70 6.35 For net value/acre, means within a column with the same letter are not significantly different at the 0.05 probability level. CV - coefficient of variation. OSL - observed significance level, or probability of a greater F value. LSD - least significant difference at the 0.05 level, NS - not significant. Note: some columns may not add up due to rounding error. 45.9 46.5 48.8 46.2 46.0 44.9 43.4 Lint yield ------------- lb/acre ------------- Bur cotton yield 424.61 30.7 33.6 32.4 29.3 29.2 27.6 31.9 -------- % -------- Lint turnout 113.85 Test average FiberMax 2011GT PhytoGen 339WRF NexGen 4111RF Stoneville 4946GLB2 PhytoGen 333WRF NexGen 1511B2RF Entry Table 1. Harvest results from the Floyd County Dryland RACE Variety Trial, Gary Nixon Farm, Floydada, TX, 2014. 85 35.5 82.8 82.6 81.9 83.0 83.0 83.3 82.9 31.2 31.0 30.7 32.3 30.4 31.0 31.8 g/tex Strength 8.7 7.9 10.0 8.9 7.9 9.2 8.2 % Elongation 2.5 2.3 3.3 2.3 2.7 2.7 1.7 grade Leaf CV, % 12.0 2.2 1.2 2.3 2.1 24.2 0.0732† 0.0700† OSL 0.2335 0.6158 <0.0001 0.1064 LSD NS 1.2 NS 1.1 0.3 NS CV - coefficient of variation. OSL - observed significance level, or probability of a greater F value. LSD - least significant difference at the 0.05 level, †indicates significance at the 0.10 level, NS - not significant 3.6 Test average 35.8 34.2 35.2 36.5 35.7 35.7 % 32nds inch units 3.9 3.6 3.8 3.3 3.9 3.1 Uniformity Staple Micronaire FiberMax 2011GT NexGen 1511B2RF NexGen 4111RF PhytoGen 333WRF PhytoGen 339WRF Stoneville 4946GLB2 Entry 1.7 0.0004 2.3 72.7 75.7 69.5 72.4 72.3 75.9 70.5 reflectance Rd Table 2. HVI fiber property results from the Floyd County Dryland RACE Variety Trial, Gary Nixon Farm, Floydada, TX, 2014. 4.9 0.0002 0.9 10.2 8.8 11.0 10.9 10.5 8.8 11.3 yellowness +b ---- 2.9 3.0 3.3 2.3 3.0 3.0 2.7 color 1 ---- 2.4 1.3 3.0 3.0 2.7 1.3 3.0 color 2 Color grade Disease and Root-knot Nematode Management 86 Response of commercially available cotton cultivars to Verticillium wilt, bacterial blight, root-knot nematodes, and Fusarium wilt. Brand All-Tex All-Tex All-Tex All-Tex All-Tex All-Tex All-Tex Americot Americot Croplan Genetics Croplan Genetics Croplan Genetics Deltapine Deltapine Deltapine Deltapine Deltapine Deltapine Deltapine Deltapine Deltapine Deltapine Deltapine Deltapine Deltapine Deltapine Deltapine Fibermax Fibermax Fibermax Fibermax Fibermax Fibermax Fibermax Fibermax Fibermax Fibermax Fibermax Fibermax Fibermax Variety All-Tex ApexB2RF All-Tex AridB2RF All-Tex DineroB2RF All-Tex EdgeB2RF All-Tex EpicRF All-Tex Nitro-44B2RF All-Tex RapidB2RF AM 1532B2RF AM 1550B2RF CG 3035RF CG 3156B2RF CG 3787B2RF DP 0912B2RF DP 104B2RF DP 1044B2RF DP 1048B2RF DP 1050B2RF DP 1212B2RF DP 1219B2RF DP 1252B2RF DP 1311B2RF DP 1321B2RF DP1359B2RF DP 1410B2RF DP 1441RF DP 1454NRB2RF DP 174RF FM 1320GL FM 1740B2F FM 1830GLT FM 1845LLB2 FM 1880B2F FM 1900GLT FM 1944GLB2 FM 2007GLT FM 2011GT FM 2320GL FM 2322GL FM 2334GLT FM 2484B2F Verticillium wilt I Poor Unk I Poor I to Good Poor I Poor Poor Poor Poor I Good I Poor Poor Poor-I I Poor I to Good I Poor I to good I to good I I I I- good Good Unk Good I Good I Good Unk Good Good Good 87 Bacterial blight S S S S S R Unk S S S S R S S S S S S S S S S PR R S S S S R R PR R R S R R Unk S R R Root-knot nematodes S S S S S S S S S S S S S S S S S S S S S S S S S R PR S S S S S S S S PR Unk S S S Fusarium Wilt S S S S S S S S S S S S S S S S S S S S S S S S S Unk PR S S S S S S S S Unk Unk S S S Verticillium Bacterial Root-knot Brand Variety wilt blight nematodes Fibermax FM 2989GLB2 Good R S Fibermax FM 8270GLB2 I R S Fibermax FM 9170B2F Good R S Fibermax FM 9180B2F Good R S Fibermax FM 9250GL Good R S NexGen NG 1511B2RF Poor to I S S NexGen NG 1551RF I S S NexGen NG 1572RF Poor R S NexGen NG 3306B2RF I to Good S Unk NexGen NG 3348B2RF Good PR S NexGen NG 4010B2RF Good R S NexGen NG 4012B2RF Good R S NexGen NG 4111RF Good R S NexGen NG 5315B2RF Poor S Unk Phytogen PHY 222WRF I S S Phytogen PHY 315RF Poor S S Phytogen PHY 333WRF Poor S S Phytogen PHY 339WRF I to Good R S Phytogen PHY 367ERF I S PR Phytogen PHY 375WRF Poor R S Phytogen PHY 417WRF Poor S R Phytogen PHY 427WRF Poor S R Phytogen PHY 499WRF I S S Stoneville ST 4747GLB2 Good S S Stoneville ST 4946GLB2 Poor S PR Stoneville ST 5032GLT Poor S S Stoneville ST 5289GLT Poor R S Stoneville ST 6448GLB2 Poor to I R S I=Intermediate, PR=partially resistant, R=Resistant, S=Susceptible, Unk=unknown. 88 Fusarium Wilt S S S S S S S S Unk S S S S Unk S S S S PR S R R S S Unk S S S 2014 Sites Planted but Lost Due to Weather 89 1 2 3 4 5 6 7 8 9 10 11 12 13 14 15 15 14 13 12 11 10 9 8 7 3 2 1 6 5 4 10 11 12 13 14 15 1 2 3 7 8 9 4 5 6 Farwell Irrigated Systems Variety Trial - 2014 48 rows to Pivot (Seeding Rate Trial) CP 3006B2RF DP 1321B2RF FM 1830GLT NG 1511B2RF PHY 222WRF ST 4747GLB2 DP 1212B2RF NG 3306B2RF PHY 333WRF DP 1410B2RF PHY 339WRF FM 2322GL FM 1320GL NG 4111RF FM 2011GT FM 2011GT NG 4111RF FM 1320GL FM 2322GL PHY 339WRF DP 1410B2RF PHY 333WRF NG 3306B2RF DP 1212B2RF FM 1830GLT DP 1321B2RF CP 3006B2RF ST 4747GLB2 PHY 222WRF NG 1511B2RF DP 1410B2RF PHY 339WRF FM 2322GL FM 1320GL NG 4111RF FM 2011GT CP 3006B2RF DP 1321B2RF FM 1830GLT DP 1212B2RF NG 3306B2RF PHY 333WRF NG 1511B2RF PHY 222WRF ST 4747GLB2 Remainder of Field Rep I Rep II Rep III 90 34.435567 -102.944331 COMMENTS: 8 row plots X variable length (circular pivot) 24 row planting pattern (3 varieties planted per pass) Lat: 34.435640⁰ Long: -102.942658⁰ 83 70 Fair Flat Previous: Silage Sorghum Case IH 1255 Early Riser Herbicide Temp @ planting Soil Temp @ planting Moisture @ planting Seed Bed Type Previous/Cover Crop Planter Type Maturity 5/6/2014 45,000 Variety CP 3006B2RF DP 1321B2RF FM 1830GLT NG 1511B2RF PHY 222WRF ST 4747GLB2 DP 1212B2RF NG 3306B2RF PHY 333WRF DP 1410B2RF PHY 339WRF FM 2322GL FM 1320GL NG 4111RF FM 2011GT Planting date Seeding rate 1 2 3 4 5 6 7 8 9 10 11 12 13 14 15 Insecticide CG 3787B2RF FM 2011GT FM 2484B2F NG 4111RF FM 2334GLT NG 1511B2RF PHY 333WRF DP 1410B2RF PHY 367WRF ST 4946GLB2 NG 1511B2RF FM 2334GLT ST 4946GLB2 PHY 367WRF DP 1410B2RF PHY 333WRF NG 4111RF FM 2484B2F FM 2011GT CG 3787B2RF FM 2484B2F NG 4111RF FM 2334GLT NG 1511B2RF CG 3787B2RF FM 2011GT PHY 333WRF DP 1410B2RF PHY 367WRF ST 4946GLB2 FM 2011GT CG 3787B2RF ST 4946GLB2 PHY 367WRF DP 1410B2RF PHY 333WRF NG 1511B2RF FM 2334GLT NG 4111RF FM 2484B2F Fill 1 2 3 4 5 6 7 8 9 10 6 5 10 9 8 7 4 3 2 1 3 4 5 6 1 2 7 8 9 10 2 1 10 9 8 7 6 5 4 3 Plains Dryland Variety Trial - 2014 Rep I Rep II Rep III Rep IV 91 Comments: 6 row plots 33.197017 -102.653959 Good Packed Beds Temp @ planting Soil Temp @ planting Moisture @ planting Seed Bed Type Previous/Cover Crop Planter Type Rep 2 6/2/2014 31,000 FM 2011GT FM 2484B2F NG 4111RF FM 2334GLT NG 1511B2RF PHY 333WRF DP 1410B2RF PHY 367WRF ST 4946GLB2 Rep 1 Planting date Seeding rate 2 3 4 5 6 7 8 9 10 Variety 1 CG 3787B2RF Rep 3 RACE Trial Planted May 19, 2014 Ray Haseloff farm 2014 GPS Plot # 42 41 40 39 38 37 36 35 34 33 32 31 Rep # Treatment # Variety 101 1 1 NG 3306 102 1 2 FM 2011 103 1 3 PHY 339 104 1 4 ST 4747 105 1 5 DP 1410 106 1 6 PHY 222 107 1 7 NG 1511 108 1 8 DP 1212 201 2 4 ST 4747 202 2 3 PHY 339 203 2 2 FM 2011 204 2 1 NG 3306 205 2 8 DP 1212 206 2 7 NG 1511 207 2 6 PHY 222 208 2 5 DP 1410 301 3 7 NG 1511 302 3 8 DP 1212 303 3 5 DP 4010 304 3 6 PHY 222 305 3 3 PHY 339 306 3 4 ST 4747 307 3 1 NG 3306 308 3 2 FM 2011 Ave planting rate: 41,000/ac 47,400 34.341922 -102.707705 92 3 6 2 4 5 8 1 7 8 4 3 6 5 7 2 1 5 6 7 8 1 2 3 4 Tower Tower Tower ST 4747GLB2 FM 1830GLT CP 3787B2RF NG 1511B2RF Tower NG 3306B2RF PHY 222WRF FM 2011GT PHY 339WRF ST 4747GLB2 NG 1511B2RF FM 2011GT CP 3787B2RF Tower FM 1830GLT PHY 339WRF NG 3306B2RF PHY 222WRF FM 2011GT CP 3787B2RF NG 3306B2RF PHY 339WRF Tower ST 4747GLB2 PHY 222WRF NG 1511B2RF FM 1830GLT Hale County Irrigated RACE Variety Trial - 2014 Rep I Rep II Rep III 93 Planting date Seeding rate Variety CP 3787B2RF FM 2011GT NG 3306B2RF PHY 339WRF ST 4747GLB2 PHY 222WRF NG 1511B2RF FM 1830GLT Rep 1 34° 0'32.52"N 101°51'59.93"W COMMENTS: 12 row plots FM 2484 - Tower Tracks 2 1/2 tons compost applied preplant Temp @ planting Soil Temp @ planting Moisture @ planting Seed Bed Type Previous/Cover Crop Planter Type 1 2 3 4 5 6 7 8 88 76 Good Flat Sorghum Stalks 5/22/2014 48,000 Rep 2 Rep 3 1 2 3 4 5 6 7 8 4 3 2 1 8 7 6 5 7 8 1 2 5 6 3 4 34.573667 -102.798833 PHY 339WRF NG 3306B2RF PHY 222WRF FM 2011GT DP 1410B2RF NG 1511B2RF DP 1212B2RF ST 4747GLB2 FM 2011GT PHY 222WRF NG 3306B2RF PHY 339WRF ST 4747GLB2 DP 1212B2RF NG 1511B2RF DP 1410B2RF DP 1212B2RF ST 4747GLB2 PHY 339WRF NG 3306B2RF DP 1410B2RF NG 1511B2RF PHY 222WRF FM 2011GT Parmer County Irrigated RACE Demonstration - 2014 Rep I Rep II Rep III 94 Planting date Seeding rate Variety PHY 339WRF DP 1410B2RF NG 3306B2RF NG 1511B2RF PHY 222WRF DP 1212B2RF FM 2011GT ST 4747GLB2 Rep 1 COMMENTS: 30" 6 Row Plots Planted Flat Following Corn Temp @ planting Soil Temp @ planting Moisture @ planting Seed Bed Type Cover Crop Planter Type 1 5 2 6 3 7 4 8 54 56 Dry Bedded None/Previous Crop Sorghum Case IH 1200 Vacuum 5/1/2014 65,000 Rep 2 Rep 3 2013 Texas High Plains Production and Weather 95 Acres (x 1M) High Plains (TASS 1N and 1S) Planted Acres 1993-2014 5.0 4.5 4.0 3.5 3.0 2.5 2.0 1.5 1.0 0.5 0.0 2014 3.9M 1993 1996 1999 2002 2005 2008 2011 2014 Year Source: USDA-NASS % High Plains (TASS 1N and 1S) Abandoned Acres 1993-2013 70 60 50 40 30 20 10 0 2011 - 60.1% 2014 – 26.0% 2010 - 4.6% 1993 1996 1999 2002 2005 2008 2011 2014 Year Source: USDA-NASS 96 Bales (x 1M) High Plains (TASS 1N and 1S) Total Bale Production 1969-2014 7 6 5 4 3 2 1 0 2014 3.47M 1969-2012 Average = 2.6M 2011 1.84M 1969 1974 1979 1984 1989 1994 1999 2004 2009 2014 Year Source: USDA-NASS Temperature (F) Lubbock Air Temperatures April, 2014 100 90 80 70 60 50 40 30 20 High LTA High Low LTA Low 1 4 7 10 13 16 19 22 25 28 Day of month 97 Temperature (F) Lubbock Air Temperatures May, 2014 110 100 90 80 70 60 50 40 30 High LTA High Low LTA Low 1 4 7 10 13 16 19 22 25 28 31 Day of month Temperature (F) Lubbock Air Temperatures June, 2014 120 110 100 90 80 70 60 50 40 High LTA High Low LTA Low 1 4 7 10 13 16 19 22 25 28 Day of month 98 Temperature (F) Lubbock Air Temperatures July, 2014 110 100 90 80 70 60 50 40 High LTA High Low LTA Low 1 4 7 10 13 16 19 22 25 28 31 Day of month Temperature (F) Lubbock Air Temperatures August, 2014 110 100 90 80 70 60 50 40 High LTA High Low LTA Low 1 4 7 10 13 16 19 22 25 28 31 Day of month 99 Lubbock Air Temperatures September, 2014 High 90 LTA High Low 80 LTA Low 70 60 50 40 1 4 7 10 13 16 19 22 25 28 Day of month Lubbock Air Temperatures October, 2014 Temperature (F) Temperature (F) 100 100 90 80 70 60 50 40 30 20 High LTA High Low LTA Low 1 4 7 10 13 16 19 22 25 28 31 Day of month 100 Lubbock 30-Yr Long Term Average (1971-2000) vs. 2014 Cotton Heat Unit Accumulation From May 1 through July 31 Heat units (DD60s) 2000 Lubbock LTA 2014 1500 1000 500 20.2% above normal (1426 vs 1715) for 2012 season from May 1 through July 31 0 1-May 31-May 30-Jun 30-Jul Date Lubbock 30-Yr Long Term Average (1971-2000) vs. 2014 Cotton Heat Unit Accumulation From August 1 through October 31 Heat units (DD60s) 2000 Lubbock LTA Lubbock 2014 1500 1000 500 0 1-Aug 31-Aug 30-Sep Date 101 30-Oct Lubbock LTA (1971-2000) vs. 2014 Rainfall Precipitation (inches) 4.0 LTA 2014 3.0 2.0 1.0 0.0 Source: http://www.weather.gov/climate/index.php?wfo=lub 102 18.02” 12.01” - 4.15” EVALUATING FIELD TRIAL DATA This article has been reprinted with permission from Southwest Farm Press Vol 25, Number 11, April 9, 1998. Field trials can provide helpful information to producers as they compare products and practices for their operations. However, field trials must be evaluated carefully to make sure results are scientifically sound, not misleading and indicate realistic expectations for on-farm performance. This fact sheet is designed to give you the tools to help you determine whether data from a field trial is science fact or science fiction. What are the best sources of field trial data? Field trials are conducted by a broad range of individuals and institutions, including universities, ag input suppliers, chemical and seed companies and growers themselves. All are potentially good sources of information. What are the common types of field trials? Most field trials fall into one of two categories: side-by-side trials (often referred to as strip trials) or small-plot replicated trials. Side-by-side trials are the most common form of on-farm tests. As the name suggests, these trials involve testing practices or products against one another in plots arrayed across a field, often in strips the width of the harvesting equipment. These strips should be replicated across the field or repeated at several locations to increase reliability. Small-plot replicated trials often are conducted by universities and companies at central locations because of the complexity of managing them and the special planting and harvesting equipment often required. Replicated treatments increase the reliability of an experiment. They compare practices or products against one another multiple times under uniform growing conditions in several randomized small plots in the same field or location. Small-plot replicated trials also may be conducted on farmers’ fields where special conditions exist, for example, a weed infestation that does not occur on an experiment station. 103 Are side-by-side plots more valuable than small-plot replicated trials, or vice versa? Both types of plots can provide good information. The key is to evaluate the reliability of the data. It is also important to consider the applicability of the trial to your farming operation. When is plot data valid, and when isn’t it? There isn’t a black-and-white answer to that questions. But there are good rules of thumb that can help guide you. Consider these three field trial scenarios: Scenario 1: A single on-farm side-by-side trial comparing 10 varieties. Each variety is planted in one strip the width of the harvesting equipment and is 250 to 300 feet long. What you can learn: This trial will allow you to get a general feel for each variety or hybrid in the test, including how it grows and develops during the season. However, this trial, by itself, probably won’t be able to reliably measure differences in yield. This is because variability within the field, even if it appears to be relatively uniform, may be large enough to cause yield variations that mask genetic difference among the varieties. Other varietal characteristics, such as maturity or micronaire in cotton, can also be masked by soil variation. Scenario 2: Yield data from side-by-side variety trials conducted on the same varieties on multiple farms in your region. What you can learn: When data from multiple side-by-side trials are considered together, reliability increases. In this case, the more trials comparing the same varieties, the better. As you go from three to five to 10 or more locations, the certainty goes up that yield differences represent genetic differences and not field variability. Be aware, however, that small differences between treatments (in this case varieties) may still be within the margin of random variability of the combined trial and may not indicate actual genetic differences. One treatment will almost always be numerically higher. Statistical analysis helps determine if differences are significant (consistent). 104 Scenario 3: A university-style small-block replicated trial comparing the same 10 varieties. What can you learn: Data from such trials, if they are designed well and carried out precisely, generally are reliable. That is, the results generally determine the yield potential of crop varieties. However, it is still important to consider whether results are applicable to your farming operation and are consistent with other research. How do I know whether differences in yield, for example, are real and not caused by field variability or sloppy research? Scientists use statistical analysis to help determine whether differences are real or are the result of experimental error, such as field variation. The two most commonly used statistics are Least Significant Difference (LSD) and the Coefficient of Variation (CV), both of which can provide insight on the validity of trial data. If these values aren’t provided with trial results, ask for them. Least Significant Difference (LSD) is the minimum amount that two varieties must differ to be considered significantly different. Consider a trial where the LSD for yield is four bushels per acre. If one variety yields 45 bushels per acre and another yields 43 bushels per acre, the two are not statistically different in yield. The difference in their yields is due to normal field variation, not to their genetics. In this example, a variety that yields 45 bushels per acre is significantly better than those yielding less than 41 bushels per acre. In many research trials, LSDs are calculated at confidence level of 75 to 95 percent. For example, a confidence level of 95 percent means you can be 95 percent certain that yield differences greater than the LSD amount are due to genetics and not to plot variability. Coefficient of Variation (CV) measures the relative amount of random experimental variability not accounted for in the design of a test. It is expressed as a percent of the overall average of the test. For measuring yield differences, CV’s of up to five percent are considered excellent; 5.1 to 10 percent are considered good; and 10.1 to 15 percent are fair. A high CV means there must be larger differences among treatments to conclude that significant differences exist. The bottom line: When considering yield test data, be skeptical when the CV exceeds 15 percent. 105 Is a one-year test valid, or are several years of results necessary to know whether one product or practice is superior to another? In an ideal world, having several years of tests to verify use of a practice or product is best. But where changes are rapid, such as with crop varieties, having university data from multiple years isn’t always possible. When multi-year university data aren’t available, pay more careful attention to statistical measures like CV and LSD, and the number of locations and testing environments. Multi-year data on yield and performance can also be requested from the developers of new products prior to university testing. In either case, be cautious about making major production changes and trying large acreages of a given variety based on one year’s data. How should I evaluate trial results that are markedly different from other research in my area? When research results are at odds with the preponderance of scientific evidence, examine the new research with extra care. Pay special attention to factors that might have influenced the outcome, such as soil type, planting date, soil moisture and other environmental conditions, and disease, insect and weed pressures. For example, was the growing season unusually wet or unusually dry? When was it dry or wet? What was the crop growth stage when it was wet or dry? Was there a disease that affected one variety or hybrid more than another one? Were there insect problems? Could this have influenced the trial’s outcome and its applicability to your operation? If you determine that unusual circumstances affected the outcome, be cautious about how you use the results. 106


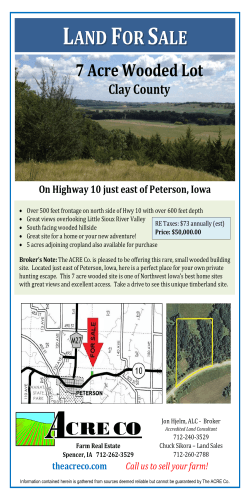


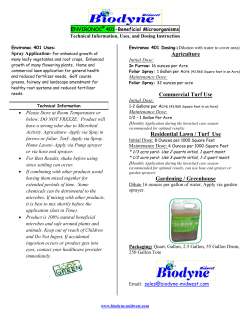


© Copyright 2026