
13893_AquaLab Pre_Web
Water Activity Meter
Operator’s Manual
Decagon Devices, Inc.
Version: May 29, 2015 — 16:02:40
AquaLab Pre
Decagon Devices, Inc.
2365 NE Hopkins Court
Pullman WA 99163
Phone: 509-332-5601
Fax: 509-332-5158
Website: www.aqualab.com
Email: [email protected] or [email protected]
Trademarks
AquaLab is a registered trademark of Decagon Devices, Inc.
c
2008-2013
Decagon Devices, Inc.
ii
AquaLab Pre
CONTENTS
Contents
1 Introduction
1.1 Customer Support .
1.2 About This Manual
1.3 Warranty . . . . . .
1.4 Seller’s Liability . . .
.
.
.
.
.
.
.
.
.
.
.
.
.
.
.
.
.
.
.
.
.
.
.
.
.
.
.
.
.
.
.
.
.
.
.
.
.
.
.
.
.
.
.
.
.
.
.
.
.
.
.
.
.
.
.
.
.
.
.
.
1
1
1
2
2
2 About AquaLab Pre
2.1 Pre Instrument Specifications
2.2 AquaLab and Water Activity
2.3 How AquaLab Pre Works . .
2.3.1 Dew Point Block . . .
2.3.2 Volatile Block . . . . .
2.4 AquaLab and Temperature .
.
.
.
.
.
.
.
.
.
.
.
.
.
.
.
.
.
.
.
.
.
.
.
.
.
.
.
.
.
.
.
.
.
.
.
.
.
.
.
.
.
.
.
.
.
.
.
.
.
.
.
.
.
.
.
.
.
.
.
.
.
.
.
.
.
.
.
.
.
.
.
.
.
.
.
.
.
.
.
.
.
.
.
.
4
4
5
5
5
6
6
3 Water Activity Theory
3.1 Moisture Content . .
3.2 Water Activity . . .
3.3 Water Potential . . .
3.4 Sorption Isotherms .
.
.
.
.
.
.
.
.
.
.
.
.
.
.
.
.
.
.
.
.
.
.
.
.
.
.
.
.
.
.
.
.
.
.
.
.
.
.
.
.
.
.
.
.
.
.
.
.
.
.
.
.
.
.
.
.
.
.
.
.
.
.
.
.
8
8
8
10
12
4 Getting Started
4.1 Components of your AquaLab Pre
4.2 Choosing a Location . . . . . . . .
4.3 Features . . . . . . . . . . . . . . .
4.4 Preparing AquaLab for Operation
.
.
.
.
.
.
.
.
.
.
.
.
.
.
.
.
.
.
.
.
.
.
.
.
.
.
.
.
.
.
.
.
.
.
.
.
.
.
.
.
.
.
.
.
14
14
14
15
15
.
.
.
.
.
.
.
.
.
.
.
.
.
.
.
.
.
.
.
.
.
.
.
.
.
.
.
.
.
.
.
.
.
.
.
.
.
.
.
.
.
.
.
.
.
.
.
.
.
.
.
.
.
.
.
.
.
.
.
.
.
.
.
.
.
.
.
.
.
.
.
.
.
.
.
.
.
17
17
17
18
19
19
20
21
5 The
5.1
5.2
5.3
5.4
5.5
5.6
.
.
.
.
.
.
.
.
.
.
.
.
.
.
.
.
.
.
.
.
.
.
.
.
.
.
.
.
Menus
The Measurement Screen . . . . .
Changing Languages . . . . . . . .
Normal Sampling Mode . . . . . .
Continuous Mode . . . . . . . . . .
Temperature Equilibration Screen
System Configuration . . . . . . .
5.6.1 Completion Notification . .
6 Cleaning and Maintenance
23
6.1 Cleaning the Block and Sensors . . . . . . . . . . . . . 24
6.1.1 Accessing the Block . . . . . . . . . . . . . . . 24
iii
CONTENTS
6.2
6.3
AquaLab Pre
Cleaning Procedures . . . . . . . . . . . . . . . . . . . 25
Checking Calibration . . . . . . . . . . . . . . . . . . . 27
7 Verification and Calibration
7.1 Water Activity Verification . . . .
7.2 Calibration Standards . . . . . . .
7.3 Calibration . . . . . . . . . . . . .
7.3.1 Adjusting for Linear Offset
.
.
.
.
.
.
.
.
.
.
.
.
.
.
.
.
.
.
.
.
.
.
.
.
.
.
.
.
.
.
.
.
.
.
.
.
.
.
.
.
.
.
.
.
28
28
28
29
31
8 Sample Preparation
34
8.1 Preparing the Sample . . . . . . . . . . . . . . . . . . 34
8.2 Samples Needing Special Preparation . . . . . . . . . . 35
8.3 Low Water Activity . . . . . . . . . . . . . . . . . . . 37
9 Taking a Reading
39
9.1 Measurement Steps . . . . . . . . . . . . . . . . . . . . 39
9.2 How AquaLab takes Readings . . . . . . . . . . . . . . 40
9.3 Cautions . . . . . . . . . . . . . . . . . . . . . . . . . . 40
10 Computer Interface
42
10.1 AquaLink 4 Software . . . . . . . . . . . . . . . . . . . 42
10.2 Using a Communication Program . . . . . . . . . . . . 43
11 Troubleshooting
45
11.1 Component Performance Screen . . . . . . . . . . . . . 50
12 Support and Repair
52
12.1 Repair Costs . . . . . . . . . . . . . . . . . . . . . . . 53
12.2 Loaner Service . . . . . . . . . . . . . . . . . . . . . . 53
13 Further Reading
54
13.1 Water Activity Theory & Measurement . . . . . . . . 54
14 Appendix A
76
14.1 Preparing Salt Solution . . . . . . . . . . . . . . . . . 76
15 Appendix B
78
16 Declaration of Conformity
79
17 Certificate of Traceability
80
iv
AquaLab Pre
1
1
INTRODUCTION
Introduction
Welcome to the AquaLab Pre Water Activity Meter. AquaLab Pre
is a quick, accurate, and reliable instrument for measuring water
activity (aw ). Whether you are doing research or working on the
production line, AquaLab will suit your needs. It is easy to use
and provides accurate and timely results. We hope you find this
manual informative and helpful in understanding how to maximize
the capabilities of your AquaLab Pre.
1.1
Customer Support
If you ever need assistance with your AquaLab Pre, have any questions or feedback, there are several ways to contact us. Decagon has
Customer Service Representatives available to speak with you Monday thru Friday, between 7am and 5pm Pacific time.
Note: If you purchased your AquaLab Pre through a distributor,
please contact them for assistance.
Email:
[email protected] or [email protected]
Phone:
1-509-332-5601
Fax:
1-509-332-5158
If contacting us by email or fax, please include as part of your message your instrument serial number, your name, address, phone, fax
number, and a description of your problem or question.
1.2
About This Manual
This manual includes instructions for setting up your AquaLab Pre,
verifying the calibration of the instrument, preparing samples, and
1
1
INTRODUCTION
AquaLab Pre
maintaining and caring for your instrument. Please read these instructions before operating your instrument to ensure that the instrument performs to its full potential.
1.3
Warranty
AquaLab Pre has a 30-day satisfaction guarantee and a one-year warranty on parts and labor. Your warranty is automatically validated
upon receipt of the instrument. We will contact you within the first
90 days of your purchase to see how your AquaLab is working for
you.
1.4
Seller’s Liability
Seller warrants new equipment of its own manufacture against defective workmanship and materials for a period of one year from the
date of receipt of equipment.
Note: We do not consider the results of ordinary wear and tear,
neglect, misuse, accident and excessive deterioration due to corrosion from any cause as defects.
The Seller’s liability for defective parts shall in no event exceed the
furnishing of replacement parts Freight On Board the factory where
originally manufactured. Material and equipment covered hereby
which is not manufactured by Seller shall be covered only by the
warranty of its manufacturer. Seller shall not be liable to Buyer for
loss, damage or injuries to persons (including death), or to property
or things of whatsoever kind (including, but not without limitation,
loss of anticipated profits), occasioned by or arising out of the installation, operation, use, misuse, nonuse, repair, or replacement of said
material and equipment, or out of the use of any method or process
for which the same may be employed. The use of this equipment constitutes Buyer’s acceptance of the terms set forth in this warranty.
There are no understandings, representations, or warranties of any
kind, express, implied, statutory or otherwise (including, but without limitation, the implied warranties of merchantability and fitness
2
AquaLab Pre
1
INTRODUCTION
for a particular purpose), not expressly set forth herein.
3
2
ABOUT AQUALAB PRE
2
AquaLab Pre
About AquaLab Pre
AquaLab Pre is a fast and accurate instrument for measuring water
activity (aw ), giving readings in five minutes or less. Its readings
are reliable providing ±0.01 aw accuracy. The instrument is easy to
clean and checking calibration is simple.
2.1
Pre Instrument Specifications
Water Activity Range: Dew point block – 0.05 to 1.00; Volatile
block – 0.05 to 0.95 aw
Water Activity Accuracy: Dew point block – ±0.01 aw ; Volatile
block – ±0.015 aw
Water Activity Resolution: ±0.001
Read Time1 : ≤ 5 min.
Sample Temperature Control: 25 ◦ C
Sample Temperature Accuracy2 : ±0.2 ◦ C
Sample Temperature Resolution: 0.1 ◦ C
Sample Dish Capacity: 7 ml Recommended (15 ml Full)
Operating Environment: 4 to 50 ◦ C and 0 to 90% Relative Humidity
(non-condensing)
Case Dimensions: 24.1 x 22.9 x 8.9 cm
Weight: 3.2 Kg
Case Material: Powder Painted Aluminum
Display: 20 x 2 alphanumeric backlit LCD
Data Communications: RS232A compatible, 8-data bit ASCII code,
9600 baud, no parity, 1 stop bit
Power: 110 VAC to 220 VAC, 50/60 Hz
1
2
On samples with no significant impedance to vapor loss.
AquaLab is calibrated to a NIST traceable temperature standard.
4
AquaLab Pre
2
ABOUT AQUALAB PRE
Warranty: 1 year parts and labor
2.2
AquaLab and Water Activity
Water activity (aw ) is a measurement of the energy status of the
water in a system. It indicates how tightly water is “bound,” structurally or chemically, within a substance. Water activity is the relative humidity of air in equilibrium with a sample in a sealed measurement chamber. The concept of water activity is of particular
importance in determining product quality and safety. Water activity influences color, odor, flavor, texture and shelf-life of many
products. It predicts safety and stability with respect to microbial
growth, chemical and biochemical reaction rates, and physical properties. For a more detailed description of water activity as it pertains
to products, please refer to Chapter 3: “Water Activity Theory.”
2.3
How AquaLab Pre Works
Your AquaLab Pre comes with either a dew point block to measure the water activity of non-volatile samples or a volatile block to
measure the water activity of volatile sample.
2.3.1
Dew Point Block
If your instrument uses the chilled-mirror dew Point technique, the
sample equilibrates with the headspace of a sealed chamber that contains a mirror and a means of detecting condensation on the mirror.
At equilibrium, the relative humidity of the air in the chamber is
the same as the water activity of the sample. In the AquaLab Pre,
the mirror temperature is precisely controlled by a thermoelectric
(Peltier) cooler. Detection of the exact point at which condensation
first appears on the mirror is observed with a photoelectric cell. A
beam of light is directed onto the mirror and reflected into a photodetector cell. The photodetector senses the change in reflectance
when condensation occurs on the mirror. A thermocouple attached
to the mirror then records the temperature at which condensation
occurs. AquaLab then signals you by flashing a green LED and/or
5
2
ABOUT AQUALAB PRE
AquaLab Pre
beeping. The AquaLab Pre will then display the final water activity
and temperature of the sample.
In addition to the technique described above, AquaLab uses an internal fan that circulates the air within the sample chamber to reduce
equilibrium time. Since both dew Point and sample surface temperatures are simultaneously measured, the need for complete thermal
equilibrium is eliminated, which reduces measurement times to less
than five minutes.
2.3.2
Volatile Block
If you will be measuring samples with volatiles such as propylene
glycol or ethanol, we recommend that you purchase a volatile block
(uses a capacitance sensor) for your AquaLab Pre. Samples with high
volatiles will condense on the mirror during the reading process, but
will not evaporate from the mirror as water does. As a result the
reading on samples with volatiles will not be accurate with the dew
point technique.
Not all volatiles react this way, but it is important to note that some
volatiles can affect the performance of your instrument. The extent
of the effect is both concentration and matrix-dependent; thus, just
because a product contains some ethanol or propylene glycol does
not necessarily mean the readings will be erroneous. Therefore, if
your sample contains propylene glycol or a high concentration of
other volatiles, it is still possible to make accurate readings. Refer
to the section titled “Volatile Samples” or contact Decagon for more
details.
2.4
AquaLab and Temperature
The AquaLab Pre controls temperature to 25 ◦ C, making it ideal for
the measurement of samples at room temperature. However, samples that are not at room temperature during the read cycle will
equilibrate to the temperature of AquaLab before the water activity
is displayed. Large temperature differences will cause longer reading
times, since a complete and accurate reading will not be made until
6
AquaLab Pre
2
ABOUT AQUALAB PRE
the sample and the instrument are within two degrees of each other.
To better help you control the temperature difference between your
sample and the instrument, you can access a sample equilibration
screen at the main menu that shows the difference in temperature
between the sample and block chamber. (See Chapter 4.) If tests
need to be conducted at temperatures other than 25 ◦ C, the temperature control feature can be turned off and the instrument will be at
the same temperature as ambient.
7
3
WATER ACTIVITY THEORY
3
AquaLab Pre
Water Activity Theory
Water is a major component of foods, pharmaceuticals, and cosmetics. Water influences the texture, appearance, taste and spoilage of
these products. There are two basic types of water analysis: moisture
content and water activity
3.1
Moisture Content
The meaning of the term moisture content is familiar to most people.
It implies a quantitative analysis to determine the total amount of
water present in a sample. There are two primary methods for determining moisture content: loss on drying and Karl Fisher titration,
but you can also use secondary methods such as infrared and NMR.
Moisture content determination is essential in meeting product nutritional labeling regulations, specifying recipes and monitoring processes. However, moisture content alone is not a reliable indicator for
predicting microbial responses and chemical reactions in materials.
The limitations of moisture content measurement are attributed to
differences in the intensity with which water associates with other
components.
3.2
Water Activity
Water activity is a measure of the energy status of the water in a
system, and thus is a far better indicator of perishability than water
content. Figure 1 shows how the relative activity of microorganisms,
lipids and enzymes relate to water activity. While other factors, such
as nutrient availability and temperature, can affect the relationships,
water activity is the best single measure of how water influences these
processes. Water activity of a system is measured by equilibrating
the liquid phase water in the sample with the vapor phase water in
the headspace and measuring the relative humidity of the headspace.
In the AquaLab, a sample is placed in a sample cup which is sealed
against a sensor block. Inside the sensor block is a fan, a dew point
sensor, a temperature sensor, and an infrared thermometer. The dew
point sensor measures the dew point temperature of the air, and the
8
AquaLab Pre
3
WATER ACTIVITY THEORY
Figure 1: Water Activity Diagram adapted from Labuza
infrared thermometer measures the sample temperature. From these
measurements the relative humidity of the headspace is computed
as the ratio of dew point temperature saturation vapor pressure to
saturation vapor pressure at the sample temperature. When the water activity of the sample and the relative humidity of the air are in
equilibrium, the measurement of the headspace humidity gives the
water activity of the sample. The purpose of the fan is to speed equilibrium and to control the boundary layer conductance of the dew
point sensor.
In addition to equilibrium between the liquid phase water in the
sample and the vapor phase, the internal equilibrium of the sample
is important. If a system is not at internal equilibrium, one might
measure a steady vapor pressure (over the period of measurement)
which is not the true water activity of the system. An example of this
might be a baked good or a multi-component food. Initially out of
the oven, a baked good is not at internal equilibrium; the outer surface is at a lower water activity than the center of the baked good.
One must wait a period of time in order for the water to migrate
9
3
WATER ACTIVITY THEORY
AquaLab Pre
and the system to come to internal equilibrium. It is important to
remember the restriction of the definition of water activity to equilibrium.
Temperature Effects
Temperature plays a critical role in water activity determination.
Most critical is the measurement of the difference between sample
and dew point temperature. If this temperature difference were in
error by 1 ◦ C, an error of up to 0.06 aw could result. In order
for water activity measurements to be accurate to 0.001, temperature difference measurements need to be accurate to 0.017 ◦ C. The
AquaLab infrared thermometer measures the difference in temperature between the sample and the block. It is carefully calibrated
to minimize temperature errors, but large temperature differences
make it difficult to achieve 0.017 ◦ C accuracy. Customers can obtain the best accuracy when the sample is near chamber temperature.
Another effect of temperature on water activity occurs when samples are near saturation. A sample that is close to 1.0 aw and is only
slightly warmer than the sensor block will condense water within the
block. This will cause errors in the measurement, and in subsequent
measurements until the condensation disappears. A sample at 0.75
aw needs to be approximately 4 ◦ C above the chamber temperature
to cause condensation. The AquaLab warns the user if a sample is
more than 4 ◦ C above the chamber temperature, but for high water
activity samples the operator needs to be aware that condensation
can occur if a sample that is warmer than the block is put in the
AquaLab.
3.3
Water Potential
Some additional information may be useful for understanding what
water activity is and why it is such a useful measure of moisture
status in products. Water activity is closely related to a thermodynamic property called the water potential, or chemical potential (µ)
of water, which is the change in Gibbs free energy (∆G) when water
concentration changes. Equilibrium occurs in a system when (µ) is
10
AquaLab Pre
3
WATER ACTIVITY THEORY
the same everywhere in the system. Equilibrium between the liquid
and the vapor phases implies that (µ) is the same in both phases. It
is this fact that allows us to measure the water potential of the vapor phase and use that to determine the water potential of the liquid
phase. Gradients in (µ) are driving forces for moisture movement.
Thus, in an isothermal system, water tends to move from regions of
high water potential (high aw ) to regions of low water potential (low
aw ). Water content is not a driving force for water movement, and
therefore can not be used to predict the direction of water movement,
except in homogeneous materials.
Factors In Determining Water Activity
The water activity of the water in a system is influenced by factors
that effect the binding of water. They include osmotic, matric, and
pressure effects. Typically water activity is measured at atmospheric
pressure, so only the osmotic and matric effects are important.
Osmotic Effects: Osmotic effects are well known from biology and
physical chemistry. Water is diluted when a solute is added. If
this diluted water is separated from pure water by a semi-permeable
membrane, water tends to move from the pure water side through
the membrane to the side with the added solute. If sufficient pressure
is applied to the solute-water mixture to just stop the flow, this pressure is a measure of the osmotic potential of the solution. Addition
of one mole of an ideal solute to a kilogram of water produces an
osmotic pressure of 22.4 atm. This lowers the water activity of the
solution from 1.0 to 0.98 aw . For a given amount of solute, increasing
the water content of the systems dilutes the solute, decreasing the
osmotic pressure, and increasing the water activity. Since microbial
cells are high concentrations of solute surrounded by semi-permeable
membranes, the osmotic effect on the free energy of the water is important for determining microbial water relations and therefore their
activity.
Matric Effects: The sample matrix affects water activity by physically binding water within its structure through adhesive and cohesive forces that hold water in pores and capillaries, and to particle
11
3
WATER ACTIVITY THEORY
AquaLab Pre
surfaces. If cellulose or protein were added to water, the energy status of the water would be reduced. Work would need to be done to
extract the water from this matrix. This reduction in energy status
of the water is not osmotic, because the cellulose or protein concentrations are far too low to produce any significant dilution of water.
The reduction in energy is the result of direct physical binding of
water to the cellulose or protein matrix by hydrogen bonding and
van der Waal forces. At higher water activity levels, capillary forces
and surface tension can also play a role.
3.4
Sorption Isotherms
Relating Water Activity to Water Content
Changes in water content affect both the osmotic and matric binding
of water in a product. Thus a relationship exists between the water
activity and water content of a product. This relationship is called
the sorption isotherm, and is unique for each product. Besides being
unique to each product, the isotherm changes depending on whether
it was obtained by drying or wetting the sample. These factors need
to be kept in mind if one tries to use water content to infer the
stability or safety of a product. Typically, large safety margins are
built into water content specifications to allow for these uncertainties.
While the sorption isotherm is often used to infer water activity from
water content, one could easily go the other direction and use the water activity to infer the water content. This is particularly attractive
because water activity is much more quickly measured than water
content. This method gives particularly good precision in the center
of the isotherm. In order to infer water content from water activity,
one needs an isotherm for the particular product. Decagon sells an
Isotherm Generator called the AquaLab Vapor Sorption Analyzer or
you can also have Decagon run the isotherm for a fee.
For example, if one were to monitor the water content of dried potato
flakes, one would measure the water activity and water content of
potato flakes dried to varying degrees using the standard drying process for those flakes. An isotherm would be constructed using those
12
AquaLab Pre
3
WATER ACTIVITY THEORY
data, and the water content would be inferred using the measured
water activity of samples and that isotherm.
We cannot overemphasize the importance of the concept of water
activity for foods, pharmaceuticals, and cosmetics. Water activity is
a measure of the energy status of the water in a system. More importantly, the utility of water activity in relation to microbial growth,
chemical reactivity, and stability over water content has been shown.
13
4
GETTING STARTED
4
AquaLab Pre
Getting Started
4.1
Components of your AquaLab Pre
Your AquaLab should have shipped with the following items.
• AquaLab Pre water activity meter
• Power cord
• RS-232 to USB interface cable
• 50 disposable sample cups
• Operator’s Manual
• Quick Start Guide
• Three spare filters for capacitance sensor
Note: The three spare filters are only included if you purchased
the volatiles block.
• Cleaning Kit and DVD
• Two vials each of the following verification standards:
0.920
0.760
0.500
0.250
4.2
aw
aw
aw
aw
2.33 mol/kg NaCl
6.00 mol/kg NaCl
8.57 mol/kg LiCl
13.41 mol/kg LiCl
Choosing a Location
To ensure that your AquaLab Pre operates correctly and consistently,
place it on a level surface. This reduces the chance that sample material will spill and contaminate the sample chamber. Also select a
location where the temperature remains fairly stable to avoid temperature changes that can affect accuracy. This location should be
well away from air conditioner and heater vents, open windows, etc.
Place the AquaLab in a location where cleanliness can be maintained
to prevent contamination of the sample chamber.
14
AquaLab Pre
4.3
4
GETTING STARTED
Features
Figure 2: Front View of AquaLab Pre
Figure 3: Back View of AquaLab Pre
4.4
Preparing AquaLab for Operation
After finding a good location for your AquaLab, plug the power cord
into the back of the unit. Before turning it on, turn the knob to the
“Open or Load” position, pull open the sample drawer and remove
the empty disposable sample cup. This empty cup is placed in the
drawer to protect it during shipment. Turn the instrument on (see
features diagram). The Title screen will appear on the LCD.
15
4
GETTING STARTED
AquaLab Pre
NOTE: The “v 3.61” shown in the above illustration is an example
showing the version of operating code used in the instrument. We periodically update the code and add new features, so if your AquaLab
shows a version number higher than this, do not be alarmed.
Following the Title screen the AquaLab Pre will automatically shift
to the Measurement screen shown below with a displayed water activity (aw ) on the top left portion of the screen, and the sample
temperature in the lower right.
In order to provide the most accurate readings, your AquaLab should
ideally be allowed to warm-up for at least 15 minutes after turning
it on. This allows the air inside the AquaLab to equilibrate to the
temperature of its surroundings.
16
AquaLab Pre
5
5.1
5
THE MENUS
The Menus
The Measurement Screen
Each time you turn on your AquaLab, the Measurement screen above
will appear. As mentioned earlier, the water activity and sample
temperature will display on the screen. On each side of the LCD
there are two buttons. Each button performs a different function.
Figure 4 provides a description of the modes and options you may
use, and the buttons used to set them.
Figure 4: Main Menu Button Options Diagram
5.2
Changing Languages
The AquaLab comes to you with English as the default on-screen
user language. If you prefer not to use English, you can change it
to one of a variety of other languages: German, French, Spanish,
17
5
THE MENUS
AquaLab Pre
Italian, Swedish, Danish, Norwegian, Czech, Portuguese, Japanese,
Polish or Finnish. You can changes languages simply by pressing
the upper right button of the instrument while the drawer knob is in
the Open or Load position. If you press the upper right button you
should see the Language Selection screen.
Press the upper right key again, and the next language option (German) will appear:
Each time you press the right button, the display will scroll to the
next language option. Select the desired language, then press the
lower left button to exit.
5.3
Normal Sampling Mode
The first time you turn on the AquaLab, it will be in normal sampling
mode. In this mode, the instrument measures the sample once, after
which the instrument notifies you that it is finished with a series of
four beeps and a green flashing light. The operator has the ability
to change the sampling mode and the audible alarm.
18
AquaLab Pre
5.4
5
THE MENUS
Continuous Mode
Continuous mode reads your sample continuously until you turn the
knob to the Open or Load position. It will read the sample, display
the water activity and sample temperature, then begin another read
cycle without turning the knob. Between samples, it will signal you
with the green LED flash, accompanied by the beeper (if it is enabled). To toggle between the normal and continuous modes, press
the top left button. The display will show a small “c” to the left of
the water activity readings.
Figure 5: Main Menu with Continuous Mode Enabled
If you press the upper left button again, the “c” will disappear and
you will be back in normal sampling mode.
5.5
Temperature Equilibration Screen
To see the temperature difference between your sample and the Aqua
Lab, press the lower right button at the main menu. You can only
access the temperature screen when the drawer knob is in the Open
or Load position. The Temperature Equilibration screen will appear.
19
5
THE MENUS
AquaLab Pre
The Temperature Equilibration screen shows the temperature difference between the sample (Ts) and the block chamber (Tb), allowing
you to quickly check if the sample is too hot, which may cause condensation inside the chamber. Press the lower right button to exit.
5.6
System Configuration
If you press the bottom left button while at the Measurement screen,
it will bring you to the System Configuration menu.
Figure 6: System Configuration Menu Button
The System Configuration menu allows you to make minor system
changes. From this menu, you can change the audible alarm after
each sample or enter the linear offset adjustment menu.
Figure 7: System Configuration Menu
20
AquaLab Pre
5.6.1
5
THE MENUS
Completion Notification
When you are sampling, the AquaLab has two ways of notifying you
that the water activity reading is complete: an audible alarm and a
flashing green LED, located on the left front corner of the AquaLab
case. In normal sampling mode, when a sample is started, the LED
will flash once, and when it is finished it will flash continuously until
the knob is moved to the Open or Load position (if not operating in
continuous mode). You cannot turn off or change the LED flashing
functions.
There are three audible alarm options, represented by three icons
as shown below.
Figure 8: Definition of Beeper Icons
You can turn the audible alarm off completely, switch it to beep
momentarily when the sample is finished and then stop, or to beep
continuously until the operator turns the the knob to the Open or
Load position.
TE SET
This selection lets you turn the temp control on and off. If on,
the instrument will control to 25 ◦ C. If off, the instrument will be at
ambient temperature.
EXIT
You may press the Exit button (the lower left button) to exit back
to the main Measurement screen at any time.
21
5
THE MENUS
AquaLab Pre
Adjusting for Linear Offset
When you need to adjust for linear offset, press the upper right button in the system configuration menu, and you will be brought to
the linear offset menu. For more details on linear offset and how to
verify for it, please refer to Chapter 7.
22
AquaLab Pre
6
6
CLEANING AND MAINTENANCE
Cleaning and Maintenance
Keeping your AquaLab clean is vital to maintaining the accuracy
of your instrument. Dust and sampling debris can contaminate the
sampling chamber and must therefore be regularly cleaned out. To
clean your instrument, carefully follow these instructions and refer
to the labeled diagram below.
Figure 9: View of Inside Dew Point Block Chamber
Purpose
The purpose for the cleaning procedure is to remove grease, dirt
and other soluble substances which can absorb/release water during
verification, calibration, and/or sample testing. For a smooth and
even dew formation, it requires the mirror to be perfectly clean. If
there are any contaminants (e.g. fingerprints) on the mirror, the dew
will form unevenly and thus affect the accuracy of the reading.
Cleaning Supplies
23
6
CLEANING AND MAINTENANCE
AquaLab Pre
Your new instrument comes with the AquaLab Cleaning Kit and
instructional DVD. The AquaLab Cleaning Kit comes with all the
materials needed to clean one instrument for about a year. Every
time you send in your instrument for the annual calibration service,
you will receive a new cleaning kit. The following supplies are included in the cleaning kit.
•
•
•
•
Spatula (a thin plastic rod)
Steam Distilled Water
Decagon Cleaning Solution
R
Kimwipes
and Kimwipe strips
Note: Wash your hands with soap and water and/or use clean lab
gloves before starting the cleaning procedure. This will prevent oils
from contaminating the cleaning materials, the sample chamber and/or
the sensors.
6.1
6.1.1
Cleaning the Block and Sensors
Accessing the Block
Turn the power off on your AquaLab (switch in back.) Next, remove the case lid screw located on the back panel. Carefully remove
the lid by pulling the back of the lid upward and then sliding the
lid back (away from the front of the case) and off. Unscrew the two
thumbscrews that secure the sensor block. Unplug the cable with the
20-pin socket that attaches the block to the main circuit board by
releasing the two locking levers that are on either side of the socket.
Carefully lift the block straight up from its mount. Turn the block
over to expose the chamber cavity as shown in the illustration at the
beginning of this chapter.
Note for Volatiles Block: If cleaning an AquaLab Pre Volatiles Block,
follow the cleaning procedures listed below being especially careful not
to get cleaning solution or alcohol on the capacitance sensor filter.
Repeated exposure of cleaning materials or contaminants to the filter
may cause inaccurate readings. If the filter appears contaminated,
replace the filter while being careful not to touch or clean the sensor
behind the filter.
24
AquaLab Pre
6
CLEANING AND MAINTENANCE
Figure 10: View of Inside Volatiles Block Chamber
6.2
Cleaning Procedures
Cleaning your AquaLab is a multi-step procedure which involves
washing, rinsing, and drying for each specific area as outlined in
the rest of Chapter 6.
1. Cleaning the Sample Chamber
Note: Be extremely careful not to damage the fan blades (see
illustration) when cleaning the chamber.
(a) Remove any debris that may have collected within or
around the sample chamber.
(b) Wrap a new Kimwipe around the end of the spatula (thin
plastic rod) and moisten it with Decagon Cleaning Solution or with Isopropyl Alcohol.
Note: Do not dip a used Kimwipe into your cleaning solution (the cleaning solution will become contaminated).
(c) Wash — Clean all surface areas of the sample chamber,
25
6
CLEANING AND MAINTENANCE
AquaLab Pre
including the edge where the sample cup seals to the block
chamber. You may need to replace the Kimwipe if it becomes too dirty during this process.
(d) Rinse — Repeat steps b and c using new Kimwipes with
distilled water.
(e) Dry — Repeat steps b and c using new, dry Kimwipes to
help remove any moisture remaining from the cleaning.
Note: Do not reuse Kimwipes
(f) Visually inspect the sample chamber for cleanliness, clean
again if necessary.
2. Clean the Mirror
(a) Wrap a new Kimwipe around the end of the spatula and
moisten it with Decagon Cleaning Solution.
(b) Wash — Swipe the moistened Kimwipe across the mirror once. (A single swipe is usually sufficient to remove
contaminants.)
(c) Rinse — Repeat steps a-b using new Kimwipes moistened
with distilled water instead of cleaning solution.
(d) Dru — Repeat steps a-b using a new, dry Kimwipes to
help remove any moisture remaining from the cleaning.
(e) Visually inspect the mirror for cleanliness. Clean again if
necessary.
3. Clean the Thermopile and Optical Sensor
(a) Wrap a new Kimwipe around the end of the spatula and
moisten it with Decagon Cleaning Solution.
(b) Wash — Swipe the moistened Kimwipe across thermopile
and optical sensor. (A single swipe across the sensor is
usually sufficient to remove contaminants.)
(c) Rinse — Repeat steps a-b using new Kimwipes moistened
with distilled water instead of cleaning solution.
(d) Dry — Repeat steps a-b but use a new, dry Kimwipe to
help remove any moisture remaining from the cleaning.
26
AquaLab Pre
6
CLEANING AND MAINTENANCE
(e) Visually inspect the thermopile and optical sensor for cleanliness. Clean again if necessary.
4. Additional Drying Time
(a) Visually inspect the sample chamber and sensors for contaminants, including moisture. If necessary, repeat the
cleaning process using new Kimwipes.
(b) Let stand for about five minutes to ensure the sample
chamber is dry.
6.3
Checking Calibration
After you have cleaned the chamber and other parts of your AquaLab,
it is important to check the instrument performance in order to correct for any linear offset that may have occurred during the cleaning
process.
Before you check the instrument we recommend that you run a sample of the activated charcoal pellets provided in your AquaLab cleaning kit. This cleans the air inside the chamber, helping it come back
to a stable sampling environment.
Verify the linear offset against known calibration standards according
to the procedure described in the next chapter. If a linear offset has
occurred, refer to “adjust for linear offset” section in Chapter 7 for
directions on how to correct for linear offset. If, after adjusting for
linear offset, your instrument is still not reading samples correctly,
please contact Decagon for support.
27
7
VERIFICATION AND CALIBRATION
7
AquaLab Pre
Verification and Calibration
It is important to verify the AquaLab water activity calibration
against known standards to guarantee optimal performance and accuracy. Decagon recommends verification daily, once per shift, or
before each use (if used infrequently).
7.1
Water Activity Verification
AquaLab uses the chilled-mirror dew point technique to determine
water activity. Because this is a primary measurement of relative
humidity, no calibration is necessary; however, it is important to
periodically check for linear offset. The components used by the
instrument to measure water activity are subject to contamination
which may affect the AquaLab performance. Contamination will
impact the accuracy of the instrument. We refer to this change in
readings as “linear offset.” Frequent verification will assure that your
AquaLab performs correctly. Linear offset is checked by using two
different calibration standards.
7.2
Calibration Standards
Calibration standards are specially prepared salt solutions having a
specific molality and water activity constant which are accurately
measurable. The calibration standards that were sent with your initial shipment are very accurate and readily available from Decagon.
Using calibration standards to verify accuracy can greatly reduce
preparation errors. For these reasons, we recommend using standards available through Decagon for the most accurate verification
of your AquaLab performance.
Performance Calibration Standards come in six water activity levels: 1.000, 0.984, 0.920, 0.760, 0.500, and 0.250 aw . The standards
are produced under a strict quality assurance regime. Please contact Decagon Devices to order additional standards via email at
[email protected] or by phone at 509-332-5601.
28
AquaLab Pre
7
VERIFICATION AND CALIBRATION
Table 1: Verification Flowchart
Calibration Standard @ 25 ◦ C
13.40 mol/kg LiCl
8.57 mol/kg LiCl
6.00 mol/kg NaCl
2.33 mol/kg NaCl
0.50 mol/kg KCl
Distilled Water
Water Activity
0.250 ±0.003
0.500 ±0.003
0.760 ±0.003
0.920 ±0.003
0.984 ±0.003
1.000 ±0.003
Note: If you need to obtain a Material Safety Data Sheet (SDS) for
any of these standards, a printable version is available on our website
at http://www.decagon.com/education/safety-data-sheets/.
To use a calibration standard, remove the twist top and pour the
contents into an AquaLab sample cup. If for some reason you cannot
obtain Decagon’s calibration standards and need to make a saturated
salt solution for verification, refer to Appendix A.
In the Pre Capacitance models, the capacitance sensor can hold a
memory of high water activity samples such as distilled water or
the 0.984 aw standard. If you verify calibration with one of these
high water activity standards, you will need to wait an hour to allow
the capacitance sensor to dry before testing samples of lower water
activity or the results may be slightly high.
7.3
Calibration
When to Verify for Linear Offset
Linear offset should be checked against two known calibration standards either daily, once per shift or before each use. Linear offset
should never be verified solely against distilled water, since it does
not give an accurate representation of the linear offset. For batch processing, the instrument should be checked regularly against a known
standard of similar water activity. It is also a good idea to check
the offset with a standard of similar water activity when the general
water activity range of your sample is changing. Checking the water
29
7
VERIFICATION AND CALIBRATION
AquaLab Pre
activity of a standard solution will alert you to the possibility of unit
contamination or shifts in the linear offset from other causes.
Note: The calibration process is the same for both the dew point and
volatiles block except that the accuracy for the capacitance sensor in
the volatiles block is ±0.015 aw .
Verification
To verify for linear offset of your AquaLab, do the following:
1. Choose a calibration standard that is close to the water activity of the sample you are measuring.
Note: The AquaLab needs to warm up for approximately 15
minutes to make accurate readings.
2. Empty a vial of the chosen calibration standard into a sample
cup and place it in the AquaLab sample drawer. Make sure
that your standard is as close to the instrument temperature
as possible.
Note: Make sure the rim of the sample cup is clean.
3. Carefully slide the drawer closed and turn the knob to the Read
position.
4. Take two readings. The water activity readings should be
within ±0.01 aw of the given value for the calibration standard. See Appendix B for the correct water activity value of
Decagon’s standards at temperatures other than 25 ◦ C.
5. If your AquaLab is reading within ±0.01 aw of the calibration
standard, choose a second calibration standard that would border the range of water activity you plan to test. For example,
if you plan to test for water activity readings ranging between
0.713 and 0.621 you should use the 8.57 mol/kg LiCl (0.50 aw )
standard for your first verification and the 6.0 M, NaCl (0.76
aw ) for the second verification.
6. Prepare a sample cup of the second calibration standard and
30
AquaLab Pre
7
VERIFICATION AND CALIBRATION
make two readings. The water activity reading for the second
calibration standard should be within ±0.01 aw .
7. If either one of the verifications is not correct, it is probably
due to contamination of the sensor chamber. For cleaning instructions, see Chapter 6. After cleaning, repeat verification
from step two.
8. If you are consistently getting readings outside the water activity of your first calibration standard by more than ±0.01
aw , a linear offset has probably occurred. In this case, adjust
the reading on the calibration standard to its correct value as
outlined in the next section.
7.3.1
Adjusting for Linear Offset
1. Once you are certain that a linear offset has occurred, enter the
system configuration menu by pressing the lower left button
from the Measurement screen. Press the upper right button in
the system configuration menu to enter the linear offset menu.
You will be guided through the linear offset routine.
2. If you
return
“no.”
“place
wish to continue, press the button next to “yes.” To
to the Measurement screen, press the button next to
After selecting “yes,” the screen will prompt you to
standard in the drawer and read.”
3. Empty the whole vial of a calibration standard into a sample
cup. We recommend using the 6.00 mol/kg NaCl (0.76 aw ). Do
not adjust for the offset using distilled water. Ensure the rim
and outside of the cup are clean. Place the prepared sample
cup in the AquaLab sample drawer.
31
7
VERIFICATION AND CALIBRATION
AquaLab Pre
Note: The same calibration standard may be used to verify and
adjust the linear offset.
4. Close the drawer, being especially careful so the solution will
not splash or spill and contaminate the chamber.
5. Turn the drawer knob to the Read position to make a water
activity reading.
Note: If you decide at this point not to continue with the linear
offset program, just return the knob to the Open or Load position and remove the sample.
After your AquaLab has finished sampling the calibration standard, the Adjustment screen will prompt you to adjust the aw
value.
6. Adjust the water activity value to its proper value for the particular calibration standard you are measuring by pressing the
up or down buttons until it displays the correct value. When
the value is correct, press the Exit button to store this new
value.
Note: This is the only menu where these buttons can change
the linear offset, so you will not hurt anything by pressing these
buttons in other menus.
7. Measure the calibration standard again in the normal sampling
mode. It should read the proper value at a given temperature
for that calibration standard (see Appendix B).
8. Measure the water activity of a second calibration standard ac32
AquaLab Pre
7
VERIFICATION AND CALIBRATION
cording to the verification procedure described above. If both
verification readings are within ±0.01 aw then the instrument
is ready to begin testing.
Note: The flowchart in Figure 11 is a graphical representation of the steps 1 through 8 for check linear offset.
If you still have incorrect verification readings after cleaning the
chamber and/or adjusting for linear offset, contact Decagon for further instructions at [email protected] or 509-332-5601. If you
purchased your AquaLab from one of our international distributors,
please contact them for local service and support.
Figure 11: Measure Verification Standard Flowchart
33
8
SAMPLE PREPARATION
8
AquaLab Pre
Sample Preparation
Your AquaLab will continually provide accurate water activity measurements as long as its internal sensors are not contaminated by
improperly-prepared samples. Careful preparation and loading of
samples will lengthen time between cleanings and will help you avoid
cleaning and downtime.
8.1
Preparing the Sample
To prepare a sample, follow these steps:
1. Make sure that the sample to be measured is homogeneous. Multi-component samples (e.g., muffins with raisins)
or samples that have outside coatings (like deep-fried, breaded
foods) can be measured, but may take longer to equilibrate. For
samples like these, AquaLab may take more than five minutes
to give an accurate reading, or may require multiple readings
of the same sample. Later, this chapter discusses measuring
the water activity of these types of products. (see section in
Chapter 8 “Samples Needing Special Preparation”).
2. Place the sample in a disposable sample cup, completely covering the bottom of the cup, if possible.
AquaLab is able to accurately measure a sample that does not
(or cannot) cover the bottom of the cup. For example, raisins
only need to be placed in the cup and not flattened to cover the
bottom. A larger sample surface area increases instrument efficiency by providing more stable infrared sample temperatures.
It also speeds up the reading by shortening the time needed to
reach vapor equilibrium.
3. Do not fill the sample cup more than half full. Overfilled cups will contaminate the sensors in the sensor
chamber. Filling the sample cup will not make the readings
faster or more accurate. There only needs to be enough sample in the cup to allow the water in the sample to equilibrate
with the water in the vapor phase and not change the moisture
content of the sample. There is a minimum amount of sample
34
AquaLab Pre
8
SAMPLE PREPARATION
needed; therefore, covering the bottom of the sample cup is
normally enough.
4. Make sure that the rim and outside of the sample cup
are clean. Wipe any excess sample material from the rim of
the cup with a clean tissue. Material left on the rim or the
outside of the cup will contaminate the sensor chamber and be
transferred to subsequent samples. The rim of the cup forms
a vapor seal with the sensor block when the drawer knob is
turned to the Read position. Therefore, any sample material
left on the cup rim will be transferred to the block, preventing
this seal and contaminating future samples.
5. If a sample will be read at some other
disposable sample cup lid on the cup to
transfer. For long-term storage, seal the lid
TM
or Parafilm completely around the cup/lid
necessary to seal the cup if it will be a long
measurement is made.
8.2
time, put the
restrict water
by placing tape
junction. It is
time before the
Samples Needing Special Preparation
AquaLab reads most materials in less than five minutes, depending
on which mode you are operating in. Some samples, however, may
require longer reading times, due to the nature of the material you
are sampling. These materials need additional preparation to ensure
quick, accurate readings. To find out whether special sample preparation is necessary, take a reading and see how long it takes to find
the water activity. If it takes longer than six minutes, remove the
sample and take a reading of a calibration standard. This will ensure
that the sample itself is causing the long read time, and that there
is not a problem with your instrument. If the calibration standard
also takes longer than six minutes to sample, refer to Chapter 11 of
this manual for more information.
Coated and Dried Samples
Samples with coatings such as sugar or fat often require longer reading times, because it takes longer for them to equilibrate. If this is
35
8
SAMPLE PREPARATION
AquaLab Pre
the case for your samples, do not worry that something is wrong with
your instrument; it simply means that your particular sample takes
longer than most to equilibrate water with its outside environment.
To reduce the time needed to take a water activity reading for coated
or dried samples, one thing you can do is crush, slice, or grind the
sample before putting it in the sample cup. This increases the surface area of the sample, thus decreasing reading times. Keep in mind,
however, that modifying some samples may alter their water activity
readings.
For example, a candy may have a soft chocolate center and a hard
outer coating. The water activity reading for the center and the outer
coating are different, so one would need to evaluate which part of the
sample needed to be measured before crushing it. When the candy
is crushed, for example, the water activity will represent the average
water activity of the entire sample; whereas leaving the candy whole
will give a reading for the coating, which may act as a barrier to the
center.
Note: If you crush, grind, or slice your sample, be consistent in
the method you use in order to obtain reproducible results.
Slow Water-Emitting Samples
Some extremely dry, dehydrated, highly viscous water-in-oil (butter), high fat, or glassy compositions may have increased read times,
due to their moisture sorption characteristics. AquaLab may require
up to ten minutes to reach an accurate measurement of water activity and nothing can be done to decrease the reading times of these
types of samples. For faster reading, it is important to have the water activity of the chamber at or below the water activity of these
type of samples. This causes the sample to release water to the vapor phase and equilibrate with the chamber. If the water activity
of the headspace is greater than this type of sample, a long period
of time will be required to reach equilibrium and it may affect the
water activity of the sample.
36
AquaLab Pre
8
SAMPLE PREPARATION
Volatile Samples
AquaLab Pre with the chilled mirror dew point sensor will give accurate readings on most samples. However, samples with certain
volatiles in high enough concentrations may give inaccurate water
activity values. This is because the volatiles condense on the mirror
during the reading process, but do not evaporate from the mirror as
water does. As a result, the reading on volatiles will not be accurate.
The concentration of volatiles that will cause interference is variable
and matrix dependent. The most effective method to determine if
volatiles are a problem is to look for incorrect standard readings after
reading the sample.
If you will be testing samples with volatiles on a regular basis that
need a more accurate reading, you can purchase a volatiles block for
your Pre that has a capacitance sensor or upgrade to the Decagon’s
Series 4TEV which are both designed for measuring volatiles such as
propylene glycol and ethanol. For more information about the Pre
Capacitance Sensor or the Series 4TEV, contact Decagon Devices at
[email protected] or 509-332-5601.
8.3
Low Water Activity
Samples that have a water activity of less than about 0.03 cannot
be accurately measured with the normal AquaLab Pre model. Samples with such low water activity values are rare. When a sample
water activity value is below its ability to accurately measure, your
AquaLab will display an error message indicating the last reading
it could make on that particular sample. For example, say you are
measuring a dry sample and the screen returns a reading with aw
less than the minimum standard.
37
8
SAMPLE PREPARATION
AquaLab Pre
This screen indicates that the last water activity reading the AquaLab
measured on this sample was 0.031 at 24.7 ◦ C. Therefore, the actual
water activity of the sample is lower than the instrument components
can measure. If your sample is not extremely dry but is still getting
the error message, refer to Chapter 11 for other possible explanations.
Samples not at Room Temperature
Samples that are four degrees colder or warmer than the instrument
(chamber) temperature will need to equilibrate to ambient temperature before a fast and accurate reading can be made. Rapid changes
in temperature over short periods of time will cause the water activity readings to rise or fall until the temperature stabilizes. When
the temperature stabilizes within one or two degrees of the chamber
temperature, you can proceed with normal measurements.
High water activity samples that are warmer than the chamber temperature can cause condensation inside the measuring chamber, which
will adversely affect subsequent readings. A warning message appears if the sample temperature is more than 4 ◦ C above chamber
temperature.
If this message appears, immediately remove the sample from the
instrument, place a lid on the cup, and allow the sample to cool to
within 4 ◦ C of the instrument before measuring.
Samples that are lower than 4 ◦ C of the instrument temperature will
cause long read times. The sample temperature must be within one
or two degrees of the chamber temperature before fast and accurate
readings can be made.
38
AquaLab Pre
9
9
TAKING A READING
Taking a Reading
9.1
Measurement Steps
Once you have prepared your sample, you are ready to take readings.
The process is simple.
1. Turn the sample drawer knob to the Open or Load position
and pull the drawer open.
2. Place your prepared sample in the drawer. Check the top lip
of the cup to make sure it is free from sample residue (remember, an over-filled sample cup may contaminate the chamber
sensors).
3. Carefully slide the drawer closed, being especially careful if you
have a liquid sample that may splash or spill and contaminate
the chamber.
4. Turn the sample drawer knob to the Read position to seal the
sample cup with the chamber. The screen will report that the
measurement has started.
This will start the read cycle. Length of read times may vary
depending on temperature differences between the chamber
and your sample, and other properties of your sample.
Note: Samples that have a large difference in water activity
from previous samples may need extra time to reach equilibrium, since some of the previous sample’s atmosphere stays in
the chamber after measurement.
39
9
TAKING A READING
9.2
AquaLab Pre
How AquaLab takes Readings
The AquaLab reading cycle continues until the rate of change of
three consecutive readings are less than 0.0005 of each other. The
instrument crosses the dew threshold numerous times to ensure the
accuracy of readings. When the instrument has finished its read
cycle, the water activity is displayed, accompanied by the LED flash
and beeper (if you have the beeper enabled).
9.3
Cautions
• Never leave a sample in your AquaLab after a reading
has been taken. The sample may spill and contaminate the
instrument chamber if the instrument is accidentally moved or
jolted.
• Never try to move your instrument after a sample has
been loaded. Movement may cause the sample material to
spill and contaminate the sample chamber.
• Take special care not to move the sample drawer too
quickly when loading or unloading liquid samples, in
order to avoid spilling.
• If a sample has a temperature that is four degrees
higher (or more) than the AquaLab chamber, the instrument will display “the sample too hot” message to
alert you to cool the sample before reading. Although
the instrument will measure warmer samples, the readings may
be inaccurate. Warm samples can cause condensation in the
chamber if they have a high water activity.
40
AquaLab Pre
9
TAKING A READING
• The physical temperature) of the instrument should be
between 4 and 50 ◦ C. Between these ambient temperatures,
AquaLab will measure samples of similar temperature quickly
and accurately.
• If you are sampling and a triangular warning symbol
appears in the top right corner, this indicates that the
mirror has become too dirty to give accurate measurements, and you need to clean the mirror and chamber before continuing to sample. For more details about this symbol,
please refer to Chapter 11. For cleaning instructions, refer to
Chapter 6.
• If a sample has a water activity lower than about 0.03,
AquaLab will display a message, accompanied by the
flashing light, notifying you that your sample is too dry
to be accurately measured by the AquaLab.
This message will stay on the screen until you open the sample drawer. If you know that your sample water activity is
above what the screen is telling you, your instrument sensors
may have been contaminated and will need to be cleaned (see
Chapter 6) or serviced (see Chapter 12).
41
10
COMPUTER INTERFACE
10
AquaLab Pre
Computer Interface
Your AquaLab Pre comes with a RS-232 to USB interface cable.
Using this cable, you can connect to your AquaLab and send water
activity data to a computer for further analysis and storage. The
interface is run through the AquaLink 4 Software or a terminal communication program.
Note: You can find the driver for this cable on our website at http://
www.aqualab.com/support/usb-cable-adaptor-driveror on the AquaLi
nk trial CD included with your instrument.
10.1
AquaLink 4 Software
An optional software program, AquaLink 4, is available for use with
your AquaLab. AquaLink 4 is a Windows based program designed
for data collection and customized report generation for all AquaLab
models. AquaLink 4 logs water activity, temperature, time of measurement, and date stamps along with other information. AquaLink
4 also has sample identification and comment fields that you can use
to help annotate the data your AquaLab is gathering.
A 30 day trial CD of this program is included with your AquaLab
Pre. If you are interested in purchasing a license of AquaLink 4,
contact Decagon or your local distributor. On the next page is a
sample picture of the AquaLink 4 program. Figure 12 demonstrates
a sample AquaLink data set.
42
AquaLab Pre
10
COMPUTER INTERFACE
Figure 12: AquaLink 4 Screen
10.2
Using a Communication Program
There are several terminal program options. Decagon has its own terminal program (DecaTerm) which can be downloaded from www.soft
ware.decagon.com/DecaTerm.zip. Two other options are TeraTerm,
which is a free program that can be found on the internet and Hyperterminal which came standard with Windows prior to Windows 7.
To use any of these terminal programs with your AquaLab, follow
the instructions for the program with the following settings. Be sure
to power on the AquaLab prior to connecting the USB interface cable
to your computer.
• Choose correct Com port
• Set/Verify Com Properties
! Bits per second 9600
! 8 Databits
43
10
COMPUTER INTERFACE
AquaLab Pre
! No parity
! 1 stop bit
! Flow control set to none
After successfully connecting the AquaLab to your computer and
upon completion of a water activity reading, the data will display in
the as measurement time (minutes), sample temperature, and water
activity. Table 2 shows an example data return.
Table 2: Terminal Data
Time since chamber was
closed
Temperature (◦ C)
aw
3.1,
24.3,
0.862
44
AquaLab Pre
11
11
TROUBLESHOOTING
Troubleshooting
AquaLab is a high performance, low maintenance instrument, designed to have few problems if used with care. Unfortunately, sometimes even the best operators using the best instruments encounter
technical difficulties. Below is quick reference guide that will direct you to detailed solutions of some problems that may occur. If
these remedies still do not resolve your problem, then please contact
Decagon for help (see Customer Support in Chapter 1). Table 3 provides a list of some problems that may occur.
Note: If you purchased your Decagon instrument from one of our
international distributors, please contact them for local service and
support.
Table 3: Troubleshooting Quick Guide
If this problem occurs:
AquaLab will not turn on
Readings are slow or inconsistent
Aw solution readings are too high/low to adjust
Screen displays “Sample too hot”
Screen displays “aw < x.xxx”
Screen displays “aw > 1.0”
Verification is not correct
Triangle Appears on Upper Right Corner
Screen displays “Block Failure” upon power up
Refer to:
Problem #1
Problem #2
Problem #3
Problem #4
Problem #5
Problem #6
Problem #7
Problem #8
Problem #9
1.PROBLEM:
AquaLab will not turn on.
SOLUTIONS:
1. Check to make sure your power cord is securely attached to the
back of the instrument and it is plugged into the power outlet.
2. A power surge may have caused a fuse to blow. To change the
fuses, follow instructions a through d.
(a) Unplug the power cord.
45
11
TROUBLESHOOTING
AquaLab Pre
(b) Locate the panel where the power cord plugs in. The fuse
box is on the right side of that panel. Press in on the
release tab and pull the fuse-holder out. Pull the broken
fuse(s) out and replace with a 1.25 Amp 250V fuse.
Caution: Do not use any other kind of fuse or
you will risk damage to your instrument as well as
void your warranty.
(c) Replace the fuse-holder and push it into the fuse-well until
the release tab snaps in place.
(d) Connect the power cord and turn your instrument on. If
the fuse blows again, a failed component may be causing
the problem. Contact Decagon to make arrangements for
repairs.
2. PROBLEM:
Readings are slow or inconsistent.
SOLUTIONS:
1. The sample chamber may be dirty. Refer to Chapter 6 for
directions on cleaning the sample chamber.
2. The temperature difference between the sample and the block
chamber may be too great. The sample will need to equilibrate
to instrument temperature before a fast and accurate reading
can be made. (Refer to Chapter 8, Samples Not at Room
Temperature.)
3. Some products absorb or desorb moisture very slowly, causing
measurements to take longer than usual, and nothing can be
done to speed up the process. Refer to Chapter 8 for further
explanation.
4. Your sample may contain volatiles. Volatiles are known to
cause unstable readings, because they condense on the surface
of the chilled mirror and alter readings. Please refer to the
volatiles section in Chapter 8 for hints on reducing difficulties
with measuring samples with propylene glycol. If you have fur46
AquaLab Pre
11
TROUBLESHOOTING
ther questions regarding the measurement of volatiles contact
Decagon.
5. A fan blade in the block chamber may be broken or bent. If
even salt standards take a long time to read, and the sample
chamber is clean, you may have a broken chamber fan blade.
This is especially likely if you have just cleaned the chamber.
If you suspect this may have happened, contact Decagon for
details on replacement.
3. PROBLEM:
Water activity readings on verification standards are too high/low
and a linear offset adjustment cannot be made any higher/lower.
SOLUTIONS:
1. The thermopile in your chamber, which measures sample temperature, may have become contaminated. Refer to Chapter 6
for directions on cleaning.
2. The chamber mirror may be dirty. Refer to Chapter 6 for directions on cleaning.
4. PROBLEM:
Message on screen says sample is too hot.
SOLUTION:
Your sample temperature is too high for the instrument to equilibrate with it in a reasonable amount of time. The instrument and
sample need to be in temperature equilibrium before accurate measurements can be made. Therefore, very cold samples will take a very
long time to measure for the same reason. To avoid this problem,
47
11
TROUBLESHOOTING
AquaLab Pre
make sure to only measure samples that are at the same temperature
as the instrument.
5. PROBLEM:
Message on screen displays aw < below instrument detection limits.
SOLUTIONS:
1. The sample is too dry for the instrument to read accurately.
If your sample has a water activity that is less than below the
detection limits of the instrument, this message will come up.
Essentially, it means that there is not enough sample moisture
to condense on the mirror and provide a reading.
2. Or the mirror may be dirty. Try cleaning the mirror and chamber and measuring the sample again.
6. PROBLEM:
Message on screen displays ”aw > 1.0...
SOLUTION:
The Cooler is damaged and will need to be serviced by Decagon.
See Chapter 12 for detailed instructions.
7. PROBLEM:
Verification is not correct.
48
AquaLab Pre
11
TROUBLESHOOTING
SOLUTION:
1. The sample chamber and mirror need to be cleaned. See Chapter 6 for detailed cleaning instructions. If verification is still not
correct, then linear offset has occurred.
2. Verify and Adjust for Linear offset. After you have cleaned the
sample chamber and mirror (Chapter 7) you will need to use a
Verification Standard to verify and adjust for Linear offset as
described in Chapter 7.
8. PROBLEM:
A small triangle appears in the upper right corner after sampling.
SOLUTION:
The mirror used for dew point measurements requires cleaning. Follow the instructions outlined in Chapter 6: Cleaning and Maintenance before trying to run your sample again. If this message continues to appear, contact Decagon for further options.
9. PROBLEM:
The block failure screen comes up after turning on the Pre.
SOLUTIONS:
49
11
TROUBLESHOOTING
AquaLab Pre
1. The block is not plugged in to the motherboard. Open the
case and check to make sure that the small ribbon cable that
connects the block to the motherboard is snapped and locked
in place.
2. One or more components has failed on the block circuit board.
If the block is properly plugged in to the motherboard and this
message appears, it is likely that one or more of the components
have failed on the block circuit board. If you press Exit at this
prompt, the instrument will not have values for the component
that has failed, which will lead to incorrect readings. If this
message appears and you continue to sample, Decagon cannot
be liable for errors in reading that may occur. Contact Decagon
for a solution to this problem.
11.1
Component Performance Screen
If, after cleaning your instrument and reading the other troubleshooting hints, you have reason to believe that one of the components of
your AquaLab may be causing measurement error, then you can access the Performance screen that displays values for component performance. This is done either by holding down the lower right button
while turning on the instrument, or by first pressing the lower left
button (system configuration menu), then the upper right button
(linear offset menu) and then the upper left button. The screen will
display component performance values.
The Performance screen returns four values. The top left value is
the value the thermocouple is reading. It is basically the difference
in temperature between the block and the mirror. It should typically have a value of 3, ±0.3. If this is 0, there is something wrong
with the thermocouple. The top right value is the value read by the
50
AquaLab Pre
11
TROUBLESHOOTING
thermopile, which is the temperature difference between the block
and what it “sees” below it (the sample, when reading). This value
should be around zero, but will change when you change the drawer
position. The bottom left value is the block temperature. This value
should be around ambient temperature. The bottom right value
is the mirror reflectance voltage, in units of millivolts. This value
should normally be between 400 and 2400 mV, and should be steady.
You cannot change anything in this screen, but it is here to give
you an indication of the component performance. If you notice that
any of these values are not what they should be, contact Decagon
for further instruction. Press the Exit button to return to the main
menu.
51
12
SUPPORT AND REPAIR
12
AquaLab Pre
Support and Repair
Note: If you purchased your AquaLab from one of our international
distributors, please contact them. They will be able to provide you
with local support and service.
When encountering problems with your AquaLab (that you unable
to resolve with the help of this manual), please contact Decagon Customer Support at [email protected], 509-332-5601 or fax us at
509-332-5158. Please have the serial number and model of the instrument ready.
All AquaLabs returning to Decagon for servicing must be accompanied with a Return Material Authorization (RMA) form. Prior to
shipping the instrument, please contact a Decagon customer support
representative to obtain an RMA.
Shipping Directions
The following steps will help to ensure the safe shipping and processing of your AquaLab.
1. Ship your AquaLab in its original cardboard box with suspension packaging. If this is not possible, use a box that has at
least four inches of space between your instrument and each
wall of the box.
2. Place the AquaLab in a plastic bag to avoid disfiguring marks
from the packaging.
3. Do not ship the power cord or serial cable.
4. If the original packaging is not available, pack the box moderately tight with packing material (e.g. styrofoam peanuts
or bubble wrap), ensuring the instrument is suspended in the
packing material.
5. On the RMA form, please verify the ship to and bill to information, contact name, and problem description. If anything is
incorrect please contact a Decagon representative.
52
AquaLab Pre
12
SUPPORT AND REPAIR
6. Tape the box in both directions for added support.
7. Include the RMA number in the attention line on the shipping
label.
Ship to:
Decagon Devices Inc.
ATTN: RMA (insert your RMA #)
2365 NE Hopkins Court
Pullman, WA 99163
12.1
Repair Costs
Manufacturer defects and instruments within the one-year warranty
will be repaired at no charge. Non-warranty repair charges for parts,
labor and shipping will be billed to you. An extra fee may be charged
for rush work. Customers must ask Decagon to provide an estimated
repair cost.
12.2
Loaner Service
Decagon has loaner instruments to keep you measuring water activity while your instrument is being serviced. If your AquaLab is
still under calibration warranty or you have a service plan with your
instrument, there is no charge for the loaner service.
53
13
FURTHER READING
13
13.1
AquaLab Pre
Further Reading
Water Activity Theory & Measurement
Bousquet-Ricard, M., G. Qualyle, T. Pharm, and J. C. Cheftel. 1980.
Comparative study of three methods of determining water activity
in intermediate moisture foods. Lebensm Wiss Technol 13:169-173.
Cazier, J.B., and V. Gekas. 2001. Water activity and its prediction: a review. International Journal of Food properties 4(1):35-43.
Chirife, J., G. Favetto, C. Ferro-Fontn, and S.L.Resnik. 1983. The
water activity of standard saturated salt solutions in the range of
intermediate moisture foods. Lebensm Wiss Technol 16:36-38.
Duckworth, R. 1975. Water relations of foods. Academic Press,
New York.
Gmez, R., and J. Fernandez-Salguero. 1992. Water activity and
chemical composition of some food emulsions. Food Chem 45:91-93.
Greenspan, L. 1977. Humidity fixed points of binary saturated aqueous solutions. J Res Nat Bur Stand - A Phys Chem 81A:89-96.
Karmas, E. 1981. Measurement of moisture content. Cereal Foods
World 26:332-334.
Kitic, D., D.C. Pereira-Jardim, G.J. Favetto, S.L. Resnik, and J.
Chirife. 1986. Theoretical prediction of the water activity of standard saturated salt solutions at various temperatures. Journal of
Food Science 51:1037-1042.
Labuza, T.P., and R. Contreras-Medellin. 1981. Prediction of moisture protection requirements for foods. Cereal Foods World 26:335343.
Labuza, T.P., K. Acott, S.R.Tatini, R.Y. Lee, J. Flink, and W. McCall. 1976. Water activity determination: A collaborative study of
54
AquaLab Pre
13
FURTHER READING
different methods. Journal of Food Science 41:910-917.
Marcolli, C., and Th. Peter. 2005. Water activity in polyol/water
systems: new UNIFAC parameterization. Atmospheric Chemistry
and Physics 5:1545-1555.
Ninni, L., M.S. Camargo, and A.J.A. Meirelles. 2000. Water activity in polyol systems. Journal of Chemical and Engineering Data
45:654-660.
Prior, B.A. 1979. Measurement of water activity in foods: A review. Journal of Food Protection 42:668-674.
Rahman, M.S. and S.S. Sablani. 2001. Measurement of water activity by electronic sensors. P. A2.5.1-A2.5.4 In R.E. Wrolstad (ed.)
Current Protocols In Food Analytical Chemistry. John Wiley &
Sons, Inc., New York.
Rahman, M.S., S.S. Sablani, N. Guizani, T.P. Labuza, and P.P.
Lewicki. 2001. Direct manometic determination of vapor pressure.
P. A2.4.1-A2.4.6. In R.E. Wrolstad (ed.) Current Protocols In Food
Analytical Chemistry. John Wiley & Sons, Inc., New York.
Reid, D.S., A.J. Fontana, M.S. Rahman, S.S. Sablani, T.P. Labuza,
N. Guizani, and P.P. Lewicki. 2001. Vapor pressure measurements
of water p. A2.1.1-A2.5.4. In R.E. Wrolstad (ed.) Current Protocols
In Food Analytical Chemistry. John Wiley & Sons, Inc., New York.
Reid, D.S. 1976. Water activity concepts in intermediate moisture
foods. p. 54-65. In R. Davies, G.G. Birch, and K.J. Parker (ed.)
Intermediate Moisture Foods. Applied Science Publishers, London.
Richard, J., and T.P. Labuza. 1990. Rapid determination of the
water activity of some reference solutions, culture media and cheese
using a dew point method. Sci. des Aliments 10:57-64.
Roa,V., and M.S. Tapia de Daza. 1991. Evaluation of water activity
measurements with a dew point electronic humidity meter. Lebensm
55
13
FURTHER READING
AquaLab Pre
Wiss Technol 24:208-213.
Rodel, W. 2001. Water activity and its measurement in food. P.
453-483. In E. Kress-Rogers, and C.B. Brimelow (ed.) Instrumentation and sensors for the food industry. CRC Press LLC, Boca Raton,
FL.
Roos, K.D. 1975. Estimation of water activity in intermediate moisture foods. Food Tech 29:26-30.
Scott, V.N., and D.T. Bernard. 1983. Influence of temperature on
the measurement of water activity of food and salt systems. Journal
of Food Science 48:552-554.
Snavely, M.J., J.C. Price, and H.W. Jun. 1990. A comparison of
three equilibrium relative humidity measuring devices. Drug Dev.
Ind. Pharm. 16:1399-1409.
Stamp, J.A., S. Linscott, C. Lomauro, and T.P. Labuza. 1984. Measurement of water activity of salt solutions and foods by several electronic methods as compared to direct vapor pressure measurement.
Journal of Food Science 49:1139-1142.
Stoloff, L. 1978. Calibration of water activity measuring instruments
and devices: Collaborative study. Journal of the Association of Official Analytical Chemists 61:1166-1178.
Troller, J.A. 1983. Methods to measure water activity. Journal of
Food Protection 46:129-134.
Troller, J.A., and J.H.B Christian. 1978. Water Activity and Food.
Academic Press, New York.
Troller, J.A., and V.N. Scott. 1992. Measurement of water activity(aw )
and acidity. p. 135-151. In C. Vanderzant, and D.F. Splittstoesser
(ed.) Compendium of Methods for the Microbiological Examination
of Foods. American Public Health Association, Washington, D.C.
56
AquaLab Pre
13
FURTHER READING
Van den Berg, C. 1986. Water activity. p. 11-36. In D. MacCarthy
(ed.) Concentration and drying of foods. Elsevier Applied Science
Publishers, London.
Van den Berg, C. 1991. Food-water relations: Progress and integration, comments and thoughts. In H. Levine, and L. Slade (ed.)
Water Relationships in Foods. Plenum Press, New York.
Van den Berg, C., and S. Bruin. 1981. Water activity and its estimation in food systems: Theoretical aspects. p. 1-61. In L.B. Rockland,
and G.F. Stewart (ed.) Water Activity: Influences on Food Quality.
Academic Press, New York.
Vega-Mercado, H., and G.V. Barbosa-Canovas. 1994. Prediction
of water activity in food systems: A review on theoretical models.
Revista Espanola De Ciencia Y Tecnologia De Alimentos 34:368-388.
Vega-Mercado, H., B. Romanach, and G.V. Barbosa-Canovas. 1994.
Prediction of water activity in food systems: A computer program
for predicting water activity in multicomponent foods. Revista Espanola De Ciencia Y Tecnologia De Alimentos 34:427-440.
Vos, P.T., and T.P. Labuza. 1974. Technique for measurements of
water activity in the high aw range. J. Agric. Food Chem. 22:326327.
Voysey, P. 1993. An evaluation of the AquaLab CX-2 system for
measuring water activity. F. M. B. R. A. Digest No. 124 24-25.
Food Safety and Microbiology
Bei, Z.H., and R.-M.J. Nout. 2000. Effects of temperature, water activity and gas atmosphere on mycelial growth of tempe fungi
Rhizopus microsporus var. microcporus and R. microsporus var.
oligosporus. World Journal of Microbiology and Biotechnology 16:853858.
Beuchat, L.R. 1981. Microbial stability as affected by water activity.
57
13
FURTHER READING
AquaLab Pre
Cereal Foods World 26:345-349.
Brandt, L. 1996. Bound for success. Controlling water activity gives
technologists the edge in developing safe, shelf-stable foods. Food
Formulating 2:41-48.
Chirife, J., and M.P. Buera. 1994. Water activity, glass transition and microbial stability in concentrated/semimoist food systems.
Journal of Food Science 59:921-927.
Chirife, J., and M.P. Buera. 1995. A critical review of some non
equilibrium situations and glass transitions on water activity values
of foods in the microbiological growth range. Journal of Food Engineering 25:531-552.
Chirife, J., and M.P. Buera. 1996. Water activity, water glass dynamics, and the control of microbiological growth in foods. Critical
Rev. in Food Sci. Nutr. 36:465-513.
Farberm, J.M., F. Coates, and E. Daley. 1992. Minimum water activity requirements for the growth of Listeria monocytogenes. Lett
Appl Microbiol 15:103-105.
Franks, F. 1991. Water activity: a credible measure of food safety
and quality? Trends Food Sci Technol March:68-72.
Garcia de Fernando, G.D., O. Diaz, M. Fernandez, and J.A. Ordonez. 1992. Changes in water activity of selected solid culture
media throughout incubation. Food Microbiology 9:77-82.
Gibson, A.M., J. Baranyi, J.I. Pitt, M.J. Eyles, and T.A. Roberts.
1994. Predicting fungal growth: The effect of water activity on Aspergillus flavus and related species. International Journal of Food
Microbiology 23:419-431.
Goaleni, N., J.E. Smith, J. Lacey, and G. Gettinby. 1997. Effects of
temperature, water activity, and incubation time on production of
aflatoxins and cyclopiazonic acid by an isolate of Aspergillus flavus
58
AquaLab Pre
13
FURTHER READING
in surface agar culture. Appl Environ Microbiol 63:1048-1053.
Hardman, T.M. 1988. Water and food quality. Elseiver Press, London.
Hocking, A.D., and B.F. Miscamble. 1995. Water relations of some
Zygomycetes isolated from food. Mycological Research 99:1113-1118.
Hocking, A.D., B.F. Miscamble, and J.I. Pitt. 1994. Water relations of Alternaria alternata, Cladosporium cladosporioides, Cladosporium sphaerospermum, Curvulario lunata and Curvulario palles
cens. Mycological Research 98:91-94.
Houtsma, P.C., A. Heuvelink, J. Dufrenne, and S. Notermans. 1994.
Effect of sodium lactate on toxin production, spore germination and
heat resistance of proteolytic Clostridium botulinum strains. Journal
of Food Protection 57:327-330.
Kress-Rogers, E. 1993. Food quality measurement. Food Industry
News September:23-26.
Kuntz, L.A. 1992. Keeping microorganisms in control. Food Product Design August:44-51.
Levine, H., and L. Slade. 1991. Water Relationships in Foods.
Plenum Press, New York.
Li, K.Y., and J.A. Torres. 1993. Water activity relationships for
selected mesophiles and psychrotrophs at refrigeration temperature
Journal of Food Protection 56:612-615.
Lopez-Malo, A., S. Guerrero, and S.M. Alzamora. 2000. Probabilistic modeling of Saccharomyces cerevisiae inhibition under the
effects of water activity, pH, and potassium sorbate concentration.
Journal of Food Protection 63:91-95.
Mannheim, C.H., J.X. Liu, and S.G. Gilbert. 1994. Control of water
in foods during storage. Journal of Food Engineering 22:509-532.
59
13
FURTHER READING
AquaLab Pre
Marauska, M., A. Vigants, A. Klincare, D. Upite, E. Kaminska, and
M. Bekers. 1996. Influence of water activity and medium osmolality
on the growth and acid production of Lactobacillus casei var. alactosus. Proceedings of the Latvian Academy of Sciences Section B
Natural Exact and Applied Sciences 50:144-146.
Masana, M.O., and J. Baranyi. 2000. Growth/no growth interface of
Brochothrix thermosphacta as a function of pH and water activity.
Food Microbiology 17:485-858.
Mattick, K. L., F. Jorgensen, J.D. Legan, M.B. Cole, J. Porter, H.M.
Lappin-Scott, and T.J. Humphrey. 2000. Survival and filamentation
of Salmonella enterica serovar Enteritidis PT4 and Salmonella enterica serovar Typhimurium DT104 at low water activity. Appl Environ
Microbiol 66:1274-1279.
Mattick, K.L., F. Jorgensen, J.D. Legan, H.M. Lappin-Scott, and
T.J. Humphrey. 2000. Habituation of Salmonella spp. at reduced
water activity and its effect on heat tolerance. Appl Environ Microbiol 66:4921-4925.
Mattick, K.L., F. Jorgensen, J.D. Legan, H.M. Lappin-Scott, and
T.J. Humphrey. 2001. Improving recovery of Salmonella enterica
Serovar Typhimurium DT104 cells injured by heating at different
water activity values. Journal of Food Protection 64:1472-1476.
McMeekin, T.A., and T. Ross. 1996. Shelf life prediction: Status
and future possibilities. International Journal of Food Microbiology
33:65-83.
Miller, A.J. 1992. Combined water activity and solute effects on
growth and survival of Listeria monocytogenes. Journal of Food
Protection 55:414-418.
Nakajo, M., and Y. Moriyama. 1993. Effect of pH and water activity on heat resistance of spores of Bacillus coagulans. Journal of
the Japanese Society for Food Science and Technology 40:268-271.
60
AquaLab Pre
13
FURTHER READING
Nelson, K.A., and T.P. Labuza. 1994. Water activity and food
polymerscience: Implications of state on arrhenius and WLF models
in predicting shelf life. Journal of Food Engineering 22:271-289.
Nesci, A., M. Rodrigues, and M. Etcheverry. 2003. Control of
Aspergillus growth and aflatoxin production using antioxidants at
different conditions of water activity and pH. Journal of Applied Microbiology 95:279-287.
. Nolan, D.A., D.C. Chamblin, and J.A. Troller. 1992. Minimal water activity levels for growth and survival of Listeria monocytogenes
and Listeria innocua. International Journal of Food Microbiology
16:323-335.
Noorlidah, A., A. Nawawi, and I. Othman. 2000. Fungal spoilage of
starch-based foods in relation to its water activity (aw). Journal of
Stored Products Research 36:47-54.
Park, C.M., and L.R.Beuchat. 2000. Survival of Escherichia coli
O157:H7 in potato starch as affected by water activity, pH and temperature. Lett Appl Microbiol 31(5):364-367.
Petersson, S., and J. Schnuerer. 1995. Biocontrol of mold growth
in high moisture wheat stored under airtight conditions by Pichia
anomala, Pichia guilliermondii, and Saccharomyces cerevisiae. Appl
Environ Microbiol 61:1027-1032.
Pitt, J.I., and B.F. Miscamble. 1995. Water relations of Aspergillus
flavus and closely related species. Journal of Food Protection 58:8690.
Plaza, P., J. Usall, N. Teixido, and I. Vinas. 2003 Effect of water
activity and temperature on germination and growth of Penicillium
digitatum, P. italicum and Geoteichum candidum. Journal of Applied Microbiology 94:549-554.
Quintavalla, S., and G. Parolari. 1993. Effects of temperature, water
61
13
FURTHER READING
AquaLab Pre
activity and pH on the growth of Bacillus cells and spore: A response
surface methodology study. International Journal of Food Microbiology 19:207-216.
Rockland, L.B., and G.F. Stewart. 1981. Water activity: Influences on food quality. Academic Press, New York.
Rockland, L.B., and S.K. Nishi. 1980. Influence of water activity
on food product quality and stability. Food Tech 34:42-59.
Saad, R.R. 1992. Effect of water activity on growth and lipids of
xerophilic fungi, Aspergillus repens and Aspergillus amstelodami.
Zentralblatt Fuer Mikrobiologie 147:61-64.
Salter, M.A., D.A. Ratkowsky, T. Ross, and T.A. McMeekin. 2000.
Modelling the combined temperature and salt (NaCl) limits for growth
of a pathogenic Escherichia coli strain using nonlinear logistic regression. International Journal of Food Microbiology 61:159-167.
Santos,J., T.M.Lopez-Diaz, M.C.Garcia-Lopez, M.C.Garcia-Fernandez,
and A.Otero. 1994. Minimum water activity for the growth of
Aeromonas hydrophila as affected by strain, temperature and humectant. Lett Appl Microbiol 19:76-78.
Sautour, M., A. Rouget, P. Dantigny, C. Divies, and M. Bennsoussan.
2001. Prediction of conidial germination of Penicillium chrysogenum
as influenced by temperature, water activity and pH. Lett Appl Microbiol 32:131-134.
Seow, C.C., T.T. Teng, and C.H. Quah. 1988. Food preservation
by moisture control. Elsevier, New York.
Shebuski, J.R., O. Vilhelmsson, and K.J. Miller. 2000. Effects of
growth at low water activity on the thermal tolerance of Staphylococcus aureus. Journal of Food Protection 63:1277-1281.
Taoukis, P., W. Breene, and T.P. Labuza. 1988. Intermediate moisture foods. Adv Cereal Sci Technol 9:91-128.
62
AquaLab Pre
13
FURTHER READING
Tapia de Daza, M.S., Y. Villegas, and A. Martinez. 1991. Minimal water activity for growth of Listeria monocytogenes as affected
by solute and temperature. International Journal of Food Microbiology 14:333-337.
Tokuoka, K., and T. Ishitani. 1991. Minimum water activities for
the growth of yeasts isolated from high sugar foods. Journal of General and Appied Microbiology 37:111-119.
Torres, R., J. Usall, N. Teixido, M. Abadias, and I. Vinas. 2003.
Liquid formulation of the biocontrol agent Candida sake by modifying water activity or adding protectants. Journal of Applied Microbiology 94:330-339.
Ucar, F., and I. Guneri. 1996. The effect of water activity, pH
and temperature on the growth of osmophilic yeasts. Turkish Journal of Biology 20:37-46.
Wijtzes, T., P.J. Mcclure, M.H. Zwietering, and T.A. Roberts. 1993.
Modelling bacterial growth of Listeria monocytogenes as a function
of water activity, pH and temperature. International Journal of Food
Microbiology 18:139-149.
Zwietering, M.H., T. Wijtzes, J.C. de Wit, and K. Van’T Riet. 1992.
A decision support system for prediction of the microbial spoilage in
foods. Journal of Food Protection 55:973-979.
Meat and Seafood
Allen, K., D. Cornforth, D. Whittier, M. Vasavada, and B. Nummer. 2007. Evaluation of high humidity and wet marinade methods
for pasteurization of jerky. Journal of Food Science. 72:C351-C355.
Chen, H.C. 1995. Seafood microorganisms and seafood safety. Journal of Food and Drug Analysis 3:133-144.
Clavero, M.R.S., and L.R. Beuchat. 1996. Survival of Escherichia
63
13
FURTHER READING
AquaLab Pre
coli O157:H7 in broth and processed salami as influenced by pH, water activity, and temperature and suitability of media for its recovery.
Appl Environ Microbiol 62:2735-2740.
Duffy, L.L., P.B. Vanderlinde, and F.H. Grau. 1994. Growth of
Listeria monocytogenes on vacuum-packed cooked meats: Effects of
pH, aw , nitrite and ascorbate. International Journal of Food Microbiology 23:377-390.
Elgasim, E.A., and M.S. Al Wesali. 2000. Water activity and Hunter
colour values of beef patties extended with samh (Mesembryanthemum forsskalei Hochst) flour. Food Chem 69(2):181-185.
Gmez, R., andJ. Fernandez-Salguero. 1993. Note: Water activity
of Spanish intermediate moisture fish products. Revista Espanola
De Ciencia Y Tecnologia De Alimentos 33:651-656.
Hand, L. 1994. Controlling water activity and pH in snack sticks.
Meat Marketing and Technology May:55-56.
Lee, M.B., and S. Styliadis. 1996. A survey of pH and water activity levels in processed salamis and sausages in Metro Toronto.
Journal of Food Protection 59:1007-1010.
Luecke, F.K. 1994. Fermented meat products. Food Res Intl 27:299307. Minegishi, Y., Y. Tsukamasa, K. Miake, T. Shimasaki, C. Imai,
M.
Sugiyama, and H. Shinano. 1995. Water activity and microflora
in commercial vacuum-packed smoked salmons. Journal of the Food
Hygienic Society of Japan 36:442-446.
Nunez, F., M.C. Diaz, M. Rodriguez, E. Aranda, A. Martin, and
M.A. Asensio. 2000. Effects of substrate, water activity, and temperature on growth and verrucosidin production by Penicillium polonicum
isolated from dry-cured ham. Journal of Food Protection 63:231-236.
Placido, M. and M.P. Aleman. 2002. Rapid hygrometric method
64
AquaLab Pre
13
FURTHER READING
for determining water activity. Ciencia y Tecnologia Alimentaria
3(4):229-235.
Rocha-Garza, A.E., and J.F. Zayas. 1996. Quality of broiled beef
patties supplemented with wheat germ protein flour. Journal of Food
Science 61:418-421
Sabadini, E., M.D. Hubinger, P. J. D.Sobral, and B.C. Carvalho,
Jr. 2001. Change of water activity and meat colour in the elaborationprocess of dehydrated salted meat. Ciencia e Tecnologia de
Alimentos 21(1):14-19.
Shimasaki, T., K. Miake, Y. Tsukamasa, M.A. Sugiyama, Y. Minegishi,
and H. Shinano. 1994. Effect of water activity and storage temperature on the quality and microflora of smoked salmon. Nippon Suisan
Gakkaishi 60:569-576.
Untermann, F., and C. Muller. 1992. Influence of aw value and
storage temperature on the multiplication and enterotoxin formation of staphylococci in dry-cured raw hams. International Journal
of Food Microbiology 16:109-115.
Williams, S.K., G.E. Rodrick, and R.L. West. 1995. Sodium lactate
affects shelf life and consumer acceptance of fresh Catfish (Ictalurus nebulosus, marmoratus) fillets under simulated retail conditions.
Journal of Food Science 60:636-639.
Dairy Products
Clavero, M.R.S., and L.R. Beuchat. 1996. Survival of Escherichia
coli O157:H7 in broth and processed salami as influenced by pH, water activity, and temperature and suitability of media for its recovery.
Appl Environ Microbiol 62:2735-2740.
Correia, R., M. Magalhaes, M. Pedrini, A. da Cruz, and I. Clementino.
2008. Ice cream made from cow and goat milk: chemical composition and melting point characteristics. Revista Ciencia Agronomica
39:251-256.
65
13
FURTHER READING
AquaLab Pre
Duffy, L.L., P.B.Vanderlinde, and F.H. Grau. 1994. Growth of Listeria monocytogenes on vacuum-packed cooked meats: Effects of pH,
aw , nitrite and ascorbate. International Journal of Food Microbiology 23:377-390.
Gmez, R., and J. Fernandez-Salguero. 1993. Note: Water activity of
Spanish intermediate moisture fish products. Revista Espanola De
Ciencia Y Tecnologia De Alimentos 33:651-656.
Hand, L. 1994. Controlling water activity and pH in snack sticks.
Meat Marketing and Technology May:55-56.
Hardy, J., J. Scher, and S. Banon. 2002. Water activity and hydration of dairy powders. Lait 82:441-442.
Lee, M.B., and S. Styliadis. 1996. A survey of pH and water activity levels in processed salamis and sausages in Metro Toronto.
Journal of Food Protection 59:1007-1010.
Luecke, F.K. 1994. Fermented meat products. Food Res Intl 27:299307.
Malec, L.S., A.S. Pereyra-Gonzales, G.B. Naranjo, and M.S. Vigo.
2002. Influence of water activity and storage temperature on lysine
availability of a milk like system. Food Res Intl 35(9):849-853.
Minegishi, Y., Y. Tsukamasa, K. Miake, T. Shimasaki, C. Imai, M.
Sugiyama, and H. Shinano. 1995. Water activity and microflora in
commercial vacuum-packed smoked salmons. Journal of the Food
Hygienic Society of Japan 36:442-446.
Rocha-Garza, A.E., and J.F. Zayas. 1996. Quality of broiled beef
patties supplemented with wheat germ protein flour. Journal of Food
Science 61:418-421.
Shah, N.P., and R.R. Ravula. 2000. Influence of water activity on
fermentation, organic acids production and viability of yoghurt and
66
AquaLab Pre
13
FURTHER READING
probiotic bacteria. Australian Journal of Dairy Technology 55(3):127131.
Shimasaki, T., K. Miake, Y. Tsukamasa, M.A. Sugiyama, Y. Minegishi,
and H. Shinano. 1994. Effect of water activity and storage temperature on the quality and microflora of smoked salmon. Nippon Suisan
Gakkaishi 60:569-576.
Untermann, F., and C. Muller. 1992. Influence of aw value and
storage temperature on the multiplication and enterotoxin formation of staphylococci in dry-cured raw hams. International Journal
of Food Microbiology 16:109-115.
Williams, S.K., G.E. Rodrick, and R.L. West. 1995. Sodium lactate
affects shelf life and consumer acceptance of fresh Catfish (Ictalurus nebulosus, marmoratus) fillets under simulated retail conditions.
Journal of Food Science 60:636-639.
Fruits and Vegetables
Ayub, M., R. Khan, S. Wahab, A. Zeb, and J. Muhammad. 1995.
Effect of crystalline sweeteners on the water activity and shelf stability of osmotically dehydrated guava. Sarhad Journal of Agriculture
11:755-761.
Beveridge,T., and S.E. Weintraub. 1995. Effect of blanching pretreatment on color and texture of apple slices at various water activities. Food Res Intl 28:83-86.
Clavero, M.R.S., R.E. Brackett, L.R. Beuchat, and M.P. Doyle. 2000.
Influence of water activity and storage conditions on survival and
growth of proteolytic Clostridium botulinum in peanut spread. Food
Microbiology 17(1):53-61.
Fouskaki, M., K. Karametsi, and N.A. Chaniotakis. 2003. Method
for the determination of water content in sultana raisins using a water activity probe. Food Chem 82:133-1337.
67
13
FURTHER READING
AquaLab Pre
Gogus, F., C. Cuzdemir, and S. Eren. 2000. Effects of some hydrocolloids and water activity on nonenzymic browning of concentrated
orange juice. Nahrung 44(6):438-442.
Hubinger, M., F.C. Menegalli, R.J. Aguerre, and C. Suarez. 1992.
Water vapor adsorption isotherms of guava, mango and pineapple.
Journal of Food Science 57:1405-1407.
Jimenez, M., M. Manez, and E. Hernandez. 1996. Influence of water
activity and temperature on the production of zearalenone in corn by
three Fusarium species. International Journal of Food Microbiology
29:417-421.
Khalloufi, S., J. Giasson, and C. Ratti. 2000. Water activity of
freeze dried mushrooms and berries. Canadian Agricultural Engineering 42(1):51-56.
Kiranoudis, C.T., Z.B. Maroulis, E. Tsami, and D. Marinos-Kouris.
1993. Equilibrium moisture content and heat of desorption of some
vegetables. Journal of Food Engineering 20:55-74.
Lopez-Malo, A., and E. Palou. 2000. Modeling the growth/nogrowth
interface of Zygosaccharomyces bailii in Mango puree. Journal of
Food Science: 65:516-520.
Makower, B., and S. Myers. 1943. A new method for the determination of moisture in dehydrated vegetables. Proceedings of Institute
of Food Technologists, 4th Conference 156.
Maltini, E., D. Torreggiani, B.R. Brovetto, and G. Bertolo. 1993.
Functional properties of reduced moisture fruits as ingredients in
food systems. Food Res Intl 26:413-419.
Marin, S., N. Magan, M. Abellana, R. Canela, A.J. Ramos, and
V. Sanchis. 2000. Selective effect of propionates and water activity on maize mycoflora and impact on fumonisin B1 accumulation.
Journal of Stored Products Research 36:203-214.
68
AquaLab Pre
13
FURTHER READING
Marin, S., V. Sanchis, I. Vinas, R. Canela, and N. Magan. 1995.
Effect of water activity and temperature on growth and fumonisin
B-1 and B-2 production by Fusarium proliferatum and F. moniliforme on maize grain. Lett Appl Microbiol 21:298-301.
Monsalve-Gonzalez, A., G.V. Barbosa-Canovas, and R.P. Cavalieri.
1993. Mass transfer and textural changes during processing of apples
by combined methods. Journal of Food Science 58:1118-1124.
Pinsirodom, P., and K.L. Parkin. 2000. Selectivity of Celite immobilized patatin (lipid acyl hydrolase) from potato (Solanum tuberosum
L.) tubers in esterification reactions as influenced by water activity
and glycerol analogues as alcohol acceptors. J. Agric. Food Chem.
48(2):155-160.
Tapia de Daza, M.S., C.E. Aguilar, V. Roa, and R.V. Diaz de Tablante.
1995. Combined stress effects on growth of Zygosaccharomyces rouxii
from an intermediate moisture papaya product. Journal of Food Science 60:356-359.
Zeb, A., R. Khan, A. Khan, M. Saeed, and S.A. Manan. 1994. Influence of crystalline sucrose and chemical preservatives on the water
activity and shelf stability of intermediate banana chips. Sarhad
Journal of Agriculture 10:721-726.
Zhang, X.W., X. Liu, D.X. Gu, W. Zhou, R.L. Wang, and P. Liu.
1996. Desorption isotherms of some vegetables. Journal of the Science of Food and Agriculture 70:303-306.
Baked Goods and Cereals
Abellana, M., A.J. Ramos, V. Sanchis, and P.V. Nielsen. 2000. Effect of modified atmosphere packaging and water activity on growth
of Eurotium amstelodami, E. chevalieri and E. herbariorum on a
sponge cake analogue. Journal of Applied Microbiology 88:606-616.
Aramouni, F.M., K.K. Kone, J.A. Craig, and D.Y.C. Fung. 1994.
Growth of Clostridium sporogenes PA 3679 in home-style canned
69
13
FURTHER READING
AquaLab Pre
quick breads. Journal of Food Protection 57:882-886.
Cahagnier, B., L. Lesage, and D. Richard-Molard. 1993. Mould
growth and conidiation in cereal grains as affected by water activity
and temperature. Lett Appl Microbiol 17:7-13.
Clawson, A.R., and A.J. Taylor. 1993. Chemical changes during
cooking of wheat. Food Chem 47:337-343.
Fleurat-Lessard, F. 2002. Qualitative reasoning and integrated management of the quality of stored grain: a promising new approach.
Journal of Stored Products Research 38:191-218.
Gmez, R., J. Fernandez-Salguero, M.A. Carmona, and D. Sanchez.
1993. Water activity in foods with intermediate moisture levels: Bakery and confectionery products: Miscellany. Alimentaria 30:55-57.
Guynot, M.E., A.J. Ramos, L. Seto, P. Purroy, V. Sanchis, and S.
Marin. 2003. Antifungal activity of volatile compounds generated by
essential oils against fungi commonly causing deterioration of bakery
products.
Harris, M., and M. Peleg. 1996. Patterns of textural changes in brittle cellular cereal foods caused by moisture sorption. Cereal Chem
73:225-231.
Hope, R., and N. Magan. 2003. Two-dimensional environmental profiles of growth, deoxynivalenol and nivalenol production by Fusarium
culmorum on wheat-based substrate. Lett Appl Microbiol 37:70-74.
Michniewicz, J., C.G. Biliaderis, and W. Bushuk. 1992. Effect of
added pentosans on some properties of wheat bread. Food Chem
43:251-257.
Moreno-Contreras, M.D., A.J. Martinez-Yepez, and R.R. Martinez.
2000. Determination of deoxynivalenol (DON) in wheat, barley and
corn and its relationship with the levels of total molds, Fusarium spp.,
infestation percentage, and water activity. Archivos Latinoameri-
70
AquaLab Pre
13
FURTHER READING
canos de Mutricion. 50(2):183-186.
Phoungchandang, S., and J.L. Woods. 2000. Moisture diffusion and
desorption isotherms for banana. Journal of Food Science 65:651-657.
Ramanathan, S., and S. Cenkowski. 1995. Sorption isotherms of
flour and flow behaviour of dough as influenced by flour compaction.
Canadian Agricultural Engineering 37:119-124.
Roessler, P.F., and M.C. Ballenger. 1996. Contamination of an unpreserved semisoft baked cookie with a Xerophilic Aspergillus species.
Journal of Food Protection 59:1055-1060.
Schebor, C., and J. Chirife. 2000. A survey of water activity and
pH values in fresh pasta packed under modified atmosphere manufactured in Argentina and Uruguay. Journal of Food Protection
63:965-969.
Seiler, D.A.L. 1979. The mould-free shelf life of bakery products.
FMBRA Bulletin April:71-74.
Sumner, S.S., J.A. Albrecht, and D.L. Peters. 1993. Occurrence
of enterotoxigenic strains of Staphylococcus aureus and enterotoxin
production in bakery products. Journal of Food Protection 56:722724.
Tesch, R., M.D. Normand, and M. Peleg. 1996. Comparison of
the acoustic and mechanical signatures of two cellular crunchy cereal
foods at various water activity levels. Journal of the Science of Food
and Agriculture 70:347-354.
Weegels, P.L., J.A. Verhoek, A.M.G. de Groot, and R.J. Hamer.
1994. Effects of gluten of heating at different moisture contents: I.
Changes in functional properties. Journal of Cereal Science 19:31-38.
Beverages, Soups, Sauces, and Preserves
Cardelli, C., and T.P. Labuza. 2001. Application of Weibull Hazard
71
13
FURTHER READING
AquaLab Pre
Analysis to the determination of shelf life of roasted and ground coffee. Lebensm Wiss Technol 34:273-278.
Carson, K.J., J.L. Collins, and M.P. Penfield. 1994. Unrefined,
dried apple pomace as a potential food ingredient. Journal of Food
Science 59:1213-1215.
Cavia, M.M., M.A. Fernandez-Muio, J.F. Huidobro, and M.T. Sancho. 2004. Correlation between Moisture and Water Activity of
Honeys Harvested in Different Years. Journal of Food Science 69:C368-370.
Durrani, M.J., R. Khan, M. Saeed, and A. Khan. 1992. Development of concentrated beverages from Anna apples with or without
added preservatives by controlling activity of water for shelf stability.
Sarhad Journal of Agriculture 8:23-28.
Ferragut, V., J.A. Salazar, and A. Chiralt. 1993. Stability in the
conservation of emulsified sauces low in oil content. Alimentaria
30:67-69.
Gleiter, R.A., H. Horn, and H.D. Isengard. 2006. Influence of type
and state of crystallization on the water activity of honey. Food
Chem 96:441-445.
Hajmeer, M.N., F.M. Aramouni, and E.A.E.Boyle. 2000. Shelflife of lite syrup after opening and storage at room or refrigerated
temperature. Journal of Food Quality 23:529-540.
Ibarz, A., J. Pagan, and R. Miguelsanz. 1992. Rheology of clarified
fruit juices: II. Blackcurrant juices. Journal of Food Engineering
15:63-74.
Khalloufi, S., Y. El-Maslouhi, and C. Ratti. 2000. Mathematical
model for prediction of glass transition temperature of fruit powders. Journal of Food Science 65:842-848.
Kusumegi, K., T. Takahashi, and M. Miyagi.
72
1996.
Effects of
AquaLab Pre
13
FURTHER READING
addition of sodium citrate on the pasteurizing conditions in Tuyu,
Japanese noodle soup. Journal of the Japanese Society for Food Science and Technology 43:740-747.
Perera, C.O. 2005. Selected quality attributes of dried foods. Drying
Technology 23:717-730.
Sa, M.M., and A.M. Sereno. 1993. Effect of temperature on sorption
isotherms and heats of sorption of quince jam. International Journal
of Food Science & Technology 28:241-248.
Shafi ur-Rahman, M. 2005. Dried food properties: challenges ahead.
Drying Technology 23:695-715.
Pharmaceuticals/Cosmetics
Ahlneck, C., and G. Zografi. 1990. The Molecular basis of moisture effects on the physical and chemical stability of drugs in the
solid state. International Journal of Pharmaceutics 62:87-95.
Bell, L.N., and K.L. White. 2000. Thiamin Stability in Solids as
Affected by the Glass Transition. Journal of Food Science 65:498501.
Cochet, N., and A.L. Demain. 1996. Effect of water activity on
production of betalactam antibiolics by Streptomyces clavuligerus in
submerged culture. Journal of Applied Bacteriology 80:333-337.
Constantino, H.R., R. Langer, and A.M. Klibanov. 1994. SolidPhase Aggregation of Proteins under Pharmaceutically Relevant Conditions. Journal of Pharmaceutical Science 83:1662-1669.
Enigl, D.C. 2001. Pharmaceutical stability testing using water activity. European Pharmaceutical Review 6:46-49.
Enigl, D.C., and K.M. Sorrel. 1997. Water Activity and Self-Preserving
Formulas. p. 45-73. In J.J. Kabara, and D.S. Orth (ed.) PreservativeFree and Self-Preserving Cosmetics and Drugs: Principles and Prac-
73
13
FURTHER READING
AquaLab Pre
tice. Marcel Dekker.
Hageman, M.J. 1988. The Role of Moisture in Protein Stability.
Drug Dev. Ind. Pharm. 14:2047-2070.
Heidemann, D.R., and P.J. Jarosz. 1991. Preformulation Studies
Involving Moisture Uptake in Solid Dosage Forms. Pharmaceutical
Research 8:292-297.
Kontny, M.J. 1988. Distribution of Water in Solid Pharmaceutical Systems. Drug Dev. Ind. Pharm. 14:1991-2027.
Sablani, S.S., K. Al-Belushi, I. Al-Marhubi, and R. Al-Belushi. 2007.
Evaluating Stability of Vitamin C in Fortified Formula Using Water
Activity and Glass Transition. International Journal of Food Properties 10:61-71.
Zografi, G. 1988. States of Water Associated with Solids. Drug
Dev. Ind. Pharm. 14:1905-1926.
Zografi, G., and M.J. Kontny. 1986. The interactions of water with
cellulose and starch derived pharmaceutical excipients. Pharmaceutical Research 3:187-193.
Miscellaneous
Bell, L.N. 1995. Kinetics of non-enzymatic browning in amorphous
solid systems: Distinguishing the effects of water activity and the
glass transition. Food Res Intl 28:591-597.
Bell, L.N., and T.P. Labuza. 1992. Compositional influence on the
pH of reduced-moisture solutions. Journal of Food Science 57:732734.
Bell, L.N., and T.P. Labuza. 1994. Influence of the low-moisture
state on pH and its implication for reaction kinetics. Journal of
Food Engineering 22:291-312.
74
AquaLab Pre
13
FURTHER READING
Bhandari, B., and I. Bareyre, 2003. Estimarion of crystalline phase
present in glucose crystal solution mixture by water activity measurement. Lebensm Wiss Technol 36:729-733(5).
Brake, N.C., and O.R. Fennema. 1993. Edible coatings to inhibit
lipid migration in a confectionery product. Journal of Food Science
58:1422-1425.
Dole, M., and L. Faller. 1950. Water sorption by synthetic high
polymers. Journal of the American Chemical Society 12:414-419.
Fernandez-Salguero, J., R. Gmez, and M.A. Carmona. 1993. Water
activity in selected high moisture foods. Journal of Food Composition and Analysis 6:364-369.
Juhan, K., and G.K. Byung. 2000. Lipase-catalyzed synthesis of
lysophosphatidylcholine using organic cosolvent for in situ water activity control. Journal of American Oil Chemists’ Society 77(7):701797.
Lima, J.R., S.D.S. Campos, and L. A.G. Goncalves. 2000. Relationship between water activity and texture of roasted and salted
cashew kernel. Journal of Food Science and Technology 37(5):512513.
Lomauro, C.J., A.S. Bakshi, and T.P.Labuza. 1985a. Evaluation
of food moisture sorption isotherm equations. Part II: Milk, coffee,
tea, nuts, oilseeds, spices and starchy foods. Lebensm Wiss Technol
18:118-124.
Lomauro, C.J., A.S. Bakshi, and T.P. Labuza. 1985b. Evaluation of
food moisture sorption isotherm equations. Part I: Fruit, vegetable
and meat products. Lebensm Wiss Technol 18:111-117.
75
14
APPENDIX A
14
14.1
AquaLab Pre
Appendix A
Preparing Salt Solution
If you choose to mix a saturated salt solution for use as a verification
standard, we recommend that you use the approved AOAC method.
Steps 1 through 4 detail the AOAC method.
1. Select a reagent grade salt and place it in a test container to
a depth of about 4cm for more soluble salts (lower aw ), to a
depth of about 1.5 cm for less soluble salts (high aw ), and to
an intermediate depth for intermediate salts.
2. Add distilled water in increments of about 2 mL, stirring constantly.
3. Add water until the salt can absorb no more water, evidenced
by the presence of free liquid. Keep the amount of free liquid
to the minimum needed to keep the solution saturated with
water. If you plan on using this solution over a long term period, seal the solution well to prevent losses from evaporation.
Table 4 shows saturated salt solutions and their respective water activities at various temperatures. Please note that these
values are based on averaged published data, and the standard
errors shown reflect Greenspan’s standard error for each salt
solution, not the accuracy of the AquaLab measuring the salt.
AquaLab measures all samples with an accuracy of ±0.003 aw .
4. Saturated salt solutions are very temperature sensitive and
their values are not as accurate as the verification standards
offered by Decagon.
76
AquaLab Pre
14
APPENDIX A
Table 4: Water Activity of Selected Salt Solutions
Saturated Solution
Lithium Chloride
Magnesium Chloride
Potassium Carbonate
Magnesium Nitrate
Sodium Chloride
Potassium Chloride
Potassium Sulfate
aw at 20 ◦ C
0.113 ±0.003
0.331 ±0.002
0.432 ±0.003
0.544 ±0.002
0.755 ±0.001
0.851 ±0.003
0.976 ±0.005
aw at 25 ◦ C
0.113 ±0.003
0.328 ±0.002
0.432 ±0.004
0.529 ±0.002
0.753 ±0.001
0.843 ±0.003
0.973 ±0.005
Note: Table 4 adapted from Greenspan (1977). Rounded to nearest
thousandth.
77
15
15
APPENDIX B
AquaLab Pre
Appendix B
Temperature Correction
of Decagon’s Verification Standards
Table 5: Water Activity of Selected Salt Solutions
Temp.(◦ C)
H2O
15.0
20.0
25.0
30.0
35.0
40.0
50.0
1.000
1.000
1.000
1.000
1.000
1.000
1.000
0.50 mol/kg
KCL
0.984
0.984
0.984
0.984
0.984
0.984
0.984
2.33 mol/kg
NaCL
0.923
0.922
0.920
0.920
0.920
0.921
0.894
6.00 mol/kg
NaCL
0.761
0.760
0.760
0.760
0.760
0.760
0.740
8.57 mol/
LiCl
0.492
0.496
0.500
0.504
0.508
0.512
0.517
Note: AquaLab will measure these verification standards to ±0.003
aw .
78
AquaLab Pre
16
16
DECLARATION OF CONFORMITY
Declaration of Conformity
Application of Council Directive:
2004/108/EC and 2011/65/EU
Standards to which conformity is
declared:
EN 61326-1:2013 and
EN 50581:2012
Manufacturer’s Name:
Decagon Devices, Inc 2365 NE
Hopkins Ct. Pullman, WA 99163
USA
Type of Equipment:
AquaLab water activity meter.
Model Number:
Pre
Year of First Manufacture:
2012
This is to certify that the AquaLab Pre water activity meter, manufactured by Decagon Devices, Inc., a corporation based in Pullman,
Washington, USA meets or exceeds the standards for CE compliance as per the Council Directives noted above. All instruments are
built at the factory at Decagon and pertinent testing documentation
is freely available for verification. This certification applies to the
AquaLab Pre.
79
17
17
CERTIFICATE OF TRACEABILITY
AquaLab Pre
Certificate of Traceability
Decagon Devices, Inc.
2365 NE Hopkins Court
Pullman WA 99163 USA
Tel: 509-332-5601
Fax: 509-332-5158
[email protected]
This NIST seal certifies that Decagon Inc. manufactures all AquaLab
water activity meters according to temperature standards with calibration traceable to the National Institute of Standards and Technology (NIST).
80
Index
Accessories, 14
Accuracy, 4
AquaLab
and Chilled Mirror Dew Point
Technique, 5
and Temperature, 6
Theory, 8
AquaLink Software, 42
Beeper
Changing, 21
Binding, 11, 12
Block Diagram
Dew Point, 23
Volatiles, 24
Block Failure, 49
Buttons
for Linear Offset Settings, 22
for Menu Selection, 17
C for Continuous Mode, 19
Calibration, 29
Standards, 29
Capillaries, 11
Cautions, 40, 46
CE Compliance, 79
Chilled-Mirror Technique, 5
Cleaning Procedures, 25
Coated Samples
Shortening Read Time for, 35
Component Performance Indicator, 50
Components, 14
Computer Interface, 42
Condensation, 10
Contact Information, 1
Cosmetics, 8, 13
Customer Support, 1
Czech, 18
Danish, 18
DecaTerm Program, 43
Declaration of Conformity, 79
Dehydrated Samples, 36
Dried Samples
Shortening Read Time for, 35
Dry Samples, 41, 48
Email, 1, 80
Equilibrium, 10
Equilibrium, of sample aw and rh,
9
Error Messages, 45
“Sample too Hot”, 47
“Sample too Dry”, 48
Triangle on Screen, 49
Exit, 21
Fan
Inside Sample Chamber, 6
Fax, 80
Features, 15
French, 17
Fuse
Changing, 45
German, 17
Gibbs Free Energy, 10
Homogeneous, 11
Humidity, Related to aw , 5
Hyperterminal, 43
81
INDEX
AquaLab Pre
Italian, 18
Quantitative Analysis, 8
Japanese, 18
Read Time
Affected by Sample Temperature, 38
Long Read Time, 6, 35, 46
Readings
Cautions, 40
How AquaLab Takes, 40
References, 54
Baked Goods and Cereals, 69
Beverages, Soups, Sauces, Preserves, 71
Dairy Products, 65
Food Safety and Microbiology, 57
Fruits and Vegetables, 67
Meat and Seafood, 63
Miscellaneous, 74
Pharmaceuticals/Cosmetics, 73
Water Activity Theory & Measurement, 54
Regulations, 8
Repair Instructions, 52
Languages, 17
LED, 19
Linear Offset
Causes for, 28
Definition, 28
How to Adjust for, 29
Menu, 22
When to Verify for, 29
Location
For Sampling, 14
Loss on Drying, 8
Low Water Activity, 37, 41
Main Menu, 17
Maintenance, 23
Material Safety Data Sheet, 29
Matric Effects, 11
Menus
System Configuration, 20
Microbial Growth, 13
Model 4TEV, 37
Multi-Component Food, 9
Salt Standard, 29
Sample
NIST Traceability, 80
Slow Water-Emitting, 46
Norwegian, 18
Sample Cups
Osmotic Effects, 11
Cleaning, 35
Filling Level, 34
Peltier Cooler, 5
Sample Equilibration Screen, 7
Pharmaceuticals, 8, 13
Sample Preparation, 34
Polish, 18
Samples
Portuguese, 18
Coated, 35
Preparing Salt Solutions, 76
Dehydrated, 36
Pressure Effects, 11
Dried, 35
Propylene Glycol, 6, 37, 46
Low Water Activity, 37
Cleaning Out the Chamber,
Multi-Component, 34
37
82
AquaLab Pre
INDEX
Needing Special Preparation,
35
Not at Room Temperature,
38
Slow Water-Emitting, 36
Surface Area of, 36
Viscous, 36
Sampling Mode
Continuous, 19
Normal, 18
Saturated Salts, 76
Seller’s Liability, 2
Sorption Isotherm, 12
Spanish, 17
Specifications, 4
Spilling the Sample, 40
Swedish, 18
Verification, 30
Verification Standards, 14
Compared to Saturated Salts,
77
Volatiles, 6, 37
Warm-Up, 15
Warranty, 2, 53
Water Activity, 8
AquaLab and, 5
Definition, 5
Displayed, 16
Effect on Food, 8
Microbial Growth, 8
Stability Diagram, 9
Theory, 8
Water Content, 12
Definition, 8
Technical Difficulties, 45
versus Water Activity, 8
Technical Support, 1
Water Potential, 10
Telephone Number, 1
Matric Effects, 11
Temperature
Osmotic Effects, 11
Effects on Water Activity, 10
Relation to Water Activity,
Equilibrium, 10
10
Hot Samples, 40
of Instrument, 41
Sample not at Room Temperature, 40
Temperature Control, 6
Thermodynamic Property, 10
Triangle
Mirror Performance Indicator,
49
Troubleshooting, 45
USB
Driver, 43
Interface Cable, 42
Vapor Phase, 11
83

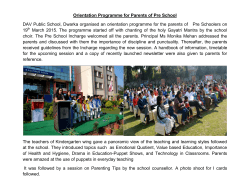


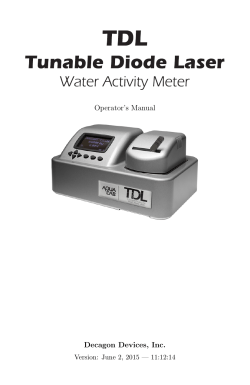
© Copyright 2026