
21. - Matthew R. Helmus
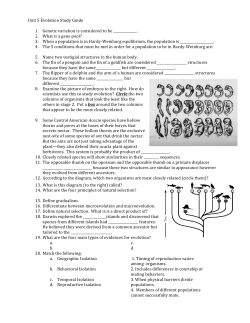
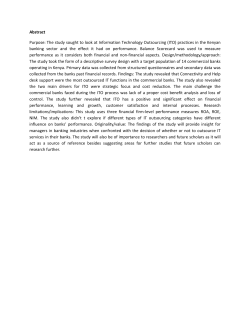
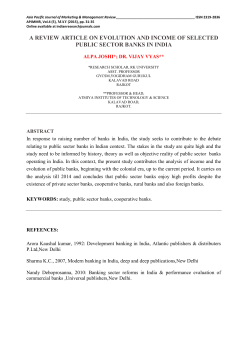
LETTER
doi:10.1038/nature13739
Island biogeography of the Anthropocene
Matthew R. Helmus1, D. Luke Mahler2 & Jonathan B. Losos3
For centuries, biogeographers have examined the factors that produce patterns of biodiversity across regions. The study of islands has
proved particularly fruitful and has led to the theory that geographic
area and isolation influence species colonization, extinction and speciation such that larger islands have more species and isolated islands
have fewer species (that is, positive species–area and negative species–
isolation relationships)1–4. However, experimental tests of this theory
have been limited, owing to the difficulty in experimental manipulation of islands at the scales at which speciation and long-distance
colonization are relevant5. Here we have used the human-aided transport of exotic anole lizards among Caribbean islands as such a test
at an appropriate scale. In accord with theory, as anole colonizations
have increased, islands impoverished in native species have gained
the most exotic species, the past influence of speciation on island biogeography has been obscured, and the species–area relationship has
strengthened while the species–isolation relationship has weakened.
Moreover, anole biogeography increasingly reflects anthropogenic
rather than geographic processes. Unlike the island biogeography
of the past that was determined by geographic area and isolation, in
the Anthropocene—an epoch proposed for the present time interval—
island biogeography is dominated by the economic isolation of human
populations.
The number of species (that is, richness) on islands is theorized to be
a function of colonization and in situ speciation that add species, and
extinction that subtracts them1–6. Larger and less-isolated islands have
lower extinction and higher colonization compared to smaller and moreisolated islands. Larger islands have more in situ speciation than smaller
islands because they have a greater diversity of habitat types and offer
more opportunities for allopatric divergence7,8, while isolated islands
have fewer and more closely related species because they are infrequently
colonized9,10. Island area is thought to set the maximum richness islands
can contain (that is, equilibrium saturation points1), while isolation and
in situ speciation influence how close islands are to saturation. Together,
these processes are presumed to cause the positive species–area and negative species–isolation relationships (SARs and SIRs) ubiquitous across
islands.
Tests of this theory are lacking owing to limits in the scale at which
experimental manipulation is possible5. For example, the most comprehensive experiment was an arthropod defaunation and recovery manipulation of six small, un-isolated islands (maximum area ,0.003 ha; maximum
interisland distance ,1.2 km)11. Other tests have monitored diversity
recoveries from natural catastrophes that wiped out existing species (for
example, volcanic eruptions12). These studies demonstrated that colonization and extinction can balance each other to determine species
richness—although this equilibrium may take a long time, if ever, to
achieve4,13—and that area and extinction rate are negatively correlated14.
Other predicted relationships have not been experimentally investigated
because all previous tests were on few islands of small size and limited
isolation where the effects of speciation and long-distance colonization
could not be assessed.
Here, we illustrate how the spread of exotic species experimentally
tests island biogeography theory15–17. In the past, changes to the species
richness of major islands (that is, those large and isolated enough to have
speciation and infrequent colonizations) have occurred on timescales
precluding direct human observation and testing of theoretical predictions. This is no longer the case today. For many insular groups, island
richness is increasing as the number of exotic species establishing surpasses the number of native species lost18.
Caribbean Anolis lizards are one such group. Until recently, each Caribbean island bank—shallow areas that connect islands—housed endemic
clades of anoles (Fig. 1, Extended Data Fig. 1)19. This high endemicity
resulted because over-water dispersal is naturally perilous for anoles,
making natural long-distance colonization rare and allopatric speciation common even among neighbouring banks. No anole has gone extinct
except possibly one (Anolis roosevelti)20. In contrast, 34 populations comprising 18 species have established on a Caribbean island far from their
native bank, increasing mean bank richness from 4.72 (2.06 s.e.m.) to
5.41 (1.91; P = 0.001, Fig. 1, Extended Data Table 1). If the tenets of
island biogeography theory are valid, then this human-mediated increased
colonization will predictably alter anole biogeography and richness relationships. Here we test three predictions: exotic anoles have mostly
established on impoverished banks, increased anole colonizations have
diminished the past signal of speciation on bank richness, and the anole
SAR has strengthened while the anole SIR has weakened.
Have exotic anoles established on banks furthest from their area-set
saturation points? Banks impoverished in native anoles should provide
the most opportunity for new species establishment. We estimated bank
saturation as the residuals from a log-linear regression of native richness
on area (that is, lower residuals suggest impoverished banks, Extended
Data Fig. 2). As predicted, exotic anoles have established on the most
impoverished banks (coefficient of exotic richness on saturation: –0.422
6 0.126, P 5 0.002)—a result also robust to an alternative metric based
on a direct estimate of the anole saturation curve (20.409 6 0.126,
P 5 0.003, Extended Data Table 2).
Has increased colonization obscured the past effect of speciation on
anole biogeography? Speciation is responsible for two main biogeographic
patterns in anoles. First, because an isolated island is more likely to contain
species descended from speciation of a few colonists from the same source
area rather than multiple colonists from multiple source areas, which
is more likely for proximate islands10, negative phylogenetic diversity–
isolation relationships (PDIRs) are expected where the most isolated
islands contain small numbers of closely related species. Such a relationship
previously existed for Caribbean anoles. Anoles found on the same bank
were more closely related to each other than expected if species randomly
colonized banks regardless of isolation (Fig. 1; mean standardized effect:
–8.08, P = 0.001, indicating strong phylogenetic underdispersion)21,
and as a result of this non-random colonization, the PDIR was strongly
negative (past PDIR coefficient: –0.734 6 0.196, P 5 0.002, Extended Data
Fig. 3). In the present day, anole assemblages are more phylogenetically
random (increase in mean standardized effect: 3.02, P = 0.001) because
exotic species can colonize isolated banks from across the Caribbean
(compare native and exotic distributions in Fig. 1)22; consequently the
anole PDIR has been eliminated (present PDIR coefficient: –0.520 6 0.245,
P . 0.05; Extended Data Fig. 3).
Second, in situ speciation is expected to be a nonlinear function of
area, stemming from a threshold area below which speciation does not
1
Amsterdam Global Change Institute, Department of Animal Ecology, Vrije Universiteit, 1081 HV Amsterdam, The Netherlands. 2Center for Population Biology, University of California, Davis, California
95616, USA. 3Department of Organismic and Evolutionary Biology and Museum of Comparative Zoology, Harvard University, Cambridge, Massachusetts 02138, USA.
2 5 S E P T E M B E R 2 0 1 4 | VO L 5 1 3 | N AT U R E | 5 4 3
©2014 Macmillan Publishers Limited. All rights reserved
RESEARCH LETTER
Caribbean island bank
Bermuda
Cuba
Native Anolis species
Exotic Anolis species
Hispaniola
Puerto Rico
equestris
Cay Sal
Little Cayman
Navassa
Great Bahama
Little Bahama
Acklins
St. Croix
porcatus
carolinensis
maynardi
smaragdinus
Mona
Desecheo
Caicos
Antigua
St. Eustatius
Anguilla
Guadeloupe
Saba
Redonda
Montserrat
Marie−Galante
Les Saintes
distichus
Dominica
Cayman Brac
cristatellus
Jamaica
wattsi
Grand Cayman
Aruba
Curacao
leachii
Klein Curacao
Trinidad
Tobago
sagrei
St. Vincent
grahami
Martinique
lineatus
trinitatis
extremus
aeneus
richardii
Barbados
Grenada
Bonaire
Blanquilla
St. Lucia
Figure 1 | The biogeographic distributions of Caribbean anole lizards in the
Anthropocene. Lines link species to the banks where they are found; the
mirrored tree21,29 is ordered to minimize the crossing of native-to-bank links.
Bermuda, Klein Curaçao and Tobago have no native anoles.
occur6–8. This effect causes two-part SARs in which species richness rises
modestly with area up to the threshold, and then increases dramatically.
In the past, the anole SAR exhibited this nonlinearity (Fig. 2a), but the
pattern is now gone. The present-day SAR is linear (P , 0.001) because
the area relationship of banks without in situ speciation has become
similar to the area relationship of banks with in situ speciation (Fig. 2b).
This homogenization of relationships is expected because banks that
lacked in situ speciation (Extended Data Fig. 1) were impoverished in
species, especially banks just below the breakpoint in Fig. 2a (P 5 0.007,
Extended Data Table 3).
Does area now explain more, and isolation less, of the variation in
anole richness? By adding species to impoverished islands, increased
colonization should move islands towards their area-set saturation points,
strengthening the SAR; and because isolated islands, especially those
too small for in situ speciation, should be impoverished, the SIR should
weaken. In the past, a strong, negative SIR existed (Table 1, Fig. 2c) with
Table 1 | The shifting importance of area and isolation to Caribbean anole biogeography
Sum of squares
Explained variation
Past to present change
Geographic isolation
Past
Exotic
Present
Area
1
2
3
Residual
Area
Total isolation
Area
Total isolation
(1) 13.73
(1) 4.69
(1) 17.88
(2) 2.11
0.04
(2) 2.16
(2) 3.53
(1) 7.43
0.14
(2) 4.23
(1) 6.57
0.28
10.27
20.13
13.76
41%
12%
52%
29%
36%
7%
29%
274%
‘Past’ is native richness. ‘Exotic’ is exotic richness. ‘Present’ is native 1 exotic richness. ‘Area’ is total emerged land of a bank. ‘Geographic isolation’ is three orthogonal metrics calculated from the pairwisedistances among banks and the mainland (Extended Data Table 4). Significant values (a 5 0.05) are in bold and given with the sign of the relationship. ‘Past to present change’ is the difference between present and
past explained variation divided by past explained variation. Richness and area were log transformed and all variables were standardized.
5 4 4 | N AT U R E | VO L 5 1 3 | 2 5 S E P T E M B E R 2 0 1 4
©2014 Macmillan Publishers Limited. All rights reserved
LETTER RESEARCH
a
35
c
Established exotic anole populations (cumulative)
e4
e3
e2
e1
e0
b
d
e4
e3
e2
30
25
20
15
10
5
WWII end
(1945)
Cold War end
(1991)
0
e1
1850
1900
1950
2000
Documented year
e0
100
101
102
103
104
105 –2
–1
Area (km2)
0
1
Isolation
Figure 2 | The linearization of the Caribbean anole species–area
relationship (SAR) and flattening of the species–isolation relationship
(SIR). a, The past SAR was nonlinear and best fitted by a regression with two
slopes and a breakpoint (*, 3.579 [CI95%, 3.337–3.822], P = 0.001)6. In all
panels, solid black lines indicate regression fits across all banks and coloured
lines are regressions of banks with (red) or without (blue) in situ speciation.
b, Colonization of exotic anoles has eliminated the two-part SAR. Solid symbols
are banks with exotics and the y-axis plots loge(species richness). c, In the
past, there was a strong SIR across all banks. ‘Isolation’ is the mean of three
orthogonal isolation metrics (Table 1, Extended Data Table 4). d, Exotic
colonization has reduced the strength of the SIR by eliminating the SIR of banks
without in situ speciation. R2 in each panel for the regressions on all banks,
with in situ, and without in situ, speciation are respectively: a, 0.85, 0.90, 0.11;
b, 0.57, 0.89, 0.31; c, 0.32, 0.65, 0.22; d, 0.15, 0.65, 0.01. See Table 1 for the
multivariate regressions.
the most isolated banks also the most impoverished in native anoles
(P = 0.001, Extended Data Table 3). As predicted, the SIR has now weakened while the SAR has strengthened (Fig. 2b, d, Table 1, Extended Data
Table 5). This shift is because isolation now correlates positively with
the richness of newly colonized species, a reversal of the natural pattern,
but like the natural pattern, exotic richness positively correlates with area,
further strengthening the present-day anole SAR (see the exotic model
in Table 1).
Our results support the theory that it is the influence of geographic
area and isolation on long-term biogeographic processes such as speciation
and colonization that fundamentally determine island biodiversity1,2,4,10.
However, as the species richness of isolated islands is increasing, Caribbean anoles are not currently in equilibrium and island isolation no longer
inhibits colonization by new species (Figs 1, 2d; Table 1). Yet, this latter
conclusion rests on defining isolation relevant to the natural over-water
colonizing ability of lizards. In the modern world, anoles colonize as
commensals of humans arriving at new destinations primarily as stowaways in cargo shipments (Extended Data Table 1). In this context, island
Figure 3 | Anole lizards are establishing on Caribbean islands at an
increasing rate. The accumulation of exotic anole lizard species across the
Caribbean is best explained by a three-segment regression (P = 0.001) with
breakpoints (*) estimated at 1961 (1943–79 CI95%, horizontal bars) and 1999
(1997–2002), and rates of 0.07 (60.01 s.e.m.), 0.23 (0.07), 0.96 (0.12) exotic
establishments per year.
isolation should be redefined to be relevant to this new way in which
islands gain species.
Translocating species to new destinations is one of the many ways
humans alter Earth. Human effects are so pervasive that a new epoch for
the present day, the Anthropocene, has been proposed23. Proponents
argue that an anthropogenic perspective is necessary to understand current
and future trajectories of Earth systems24,25. Beginning with the Industrial
Revolution, multiple indicators of human activity (for example, atmospheric CO2 concentration) slowly increased, but then following the
Second World War (WWII) increased rapidly23. The establishment of
exotic anoles follows such a curve (Fig. 3). Establishment rate increased
first after WWII, and again following the end of the Cold War when global
shipping more than doubled26. An Anthropocene perspective may thus
well apply to understanding present-day island isolation, and we interpret our final results in this context.
Shipping traffic among Caribbean banks is not related to geographic
isolation (Extended Data Table 6)27. Instead, variation in shipping is
dependent on anthropogenic factors that influence trade (for example,
the US–Cuban trade embargo)28. We estimated the economic isolation
of Caribbean banks from a global maritime shipping-traffic data set27
and asked if this metric explained anole richness.
Economic isolation determines Caribbean biodiversity in the Anthropocene—both exotic and present-day (that is, native 1 exotic) anole
richness were negative functions of economic isolation (Table 2, Extended
Data Table 5). Further, the correlation between area and economic isolation was high (r 5 20.74, P = 0.001), implicating shipping trade as
the mechanism underlying the positive exotic SAR (Table 1). Therefore,
two mechanisms, natural and anthropogenic, underlie the shifting importance of area and isolation in determining past from present anole biogeography (Tables 1 and 2, Extended Data Table 2). As expected if area
Table 2 | The importance of economic isolation to Anthropocene island biogeography
Sum of squares
Explained variation
Geographic isolation
Exotic
Present
Area
1
2
3
Economic isolation
Residual
Area
Total isolation
Economic isolation
(1) 4.83
(2) 3.3
(1) 6.06
-
(1) 7.32
-
(2) 10.76
(2) 2.26
14.11
11.91
22%
35%
15%
28%
10%
See Table 1 footnote. Economic isolation is based on the total number of ships docking on each bank. Models are best-fit based on the lowest Akaike information criterion, dashes indicate dropped covariates.
2 5 S E P T E M B E R 2 0 1 4 | VO L 5 1 3 | N AT U R E | 5 4 5
©2014 Macmillan Publishers Limited. All rights reserved
RESEARCH LETTER
determines saturation points, isolated banks without in situ speciation
are impoverished in native species (Extended Data Table 3) and are consequently gaining exotics to strengthen the anole SAR, yet because the
trade that disperses anoles is constrained by area (for example, larger
banks have more people and ports), the SAR is also strengthening because
there is a negative economic isolation–area relationship (EIAR, Extended
Data Fig. 4a).
Anthropocene models of island biogeography must include economic
isolation. For example, the US embargo strongly increases Cuban economic isolation (Extended Data Fig. 4b). We estimated Cuban economic
isolation without an embargo from the Caribbean EIAR, and then estimated the expected number of exotic anoles from the exotic model in
Table 2 (Extended Data Fig. 4c). Given the current rate of exotic establishment (Fig. 3), we predict Cuba would rapidly gain 1.65 anole lizard
species (95% confidence interval, CI95%, 1.06–2.57) should trade normalize following embargo cessation; this gain is comparable to that already
seen on Hispaniola, a bank of similar area but without a trade embargo.
As the native biodiversity of islands such as Cuba is extraordinary and
economically important, strategies (such as cargo screening, ecological
monitoring and species import bans) to prevent the establishment and
impact of exotic species must increase as economic isolation decreases.
Just as for models of other Earth systems, biogeographic models must
now include anthropogenic forcing to understand, predict and mitigate
the consequences of the new island biogeography of the Anthropocene.
Online Content Methods, along with any additional Extended Data display items
and Source Data, are available in the online version of the paper; references unique
to these sections appear only in the online paper.
Received 23 December 2013; accepted 7 August 2014.
1.
MacArthur, R. H. & Wilson, E. O. The Theory of Island Biogeography (Princeton Univ.
Press, 1967).
2. Losos, J. B. & Ricklefs, R. E. The Theory of Island Biogeography Revisited (Princeton
Univ. Press, 2010).
3. Lomolino, M. V. A call for a new paradigm of island biogeography. Glob. Ecol.
Biogeogr. 9, 1–6 (2000).
4. Heaney, L. R. Dynamic disequilibrium: a long-term, large-scale perspective on the
equilibrium model of island biogeography. Glob. Ecol. Biogeogr. 9, 59–74 (2000).
5. Schoener, T. W. in The Theory of Island Biogeography Revisited (eds Losos, J. B. &
Ricklefs, R. E.) 53–85 (Princeton Univ. Press, 2011).
6. Losos, J. B. & Schluter, D. Analysis of an evolutionary species–area relationship.
Nature 408, 847–850 (2000).
7. Kisel, Y. & Barraclough, T. G. Speciation has a spatial scale that depends on levels of
gene flow. Am. Nat. 175, 316–334 (2010).
8. Wagner, C. E., Harmon, L. J. & Seehausen, O. Cichlid species-area relationships are
shaped by adaptive radiations that scale with area. Ecol. Lett. 17, 583–592 (2014).
9. Gillespie, R. G., Claridge, E. M. & Roderick, G. K. Biodiversity dynamics in isolated
island communities: interaction between natural and human-mediated
processes. Mol. Ecol. Notes 17, 45–57 (2008).
10. Rosindell, J. & Phillimore, A. B. A unified model of island biogeography sheds light
on the zone of radiation. Ecol. Lett. 14, 552–560 (2011).
11. Wilson, E. O. & Simberloff, D. S. Experimental zoogeography of islands:
defaunation and monitoring techniques. Ecology 50, 267–278 (1969).
12. Whittaker, R. J., Field, R. & Partomihardjo, T. How to go extinct: lessons from the lost
plants of Krakatau. J. Biogeogr. 27, 1049–1064 (2000).
13. Rabosky, D. L. & Glor, R. E. Equilibrium speciation dynamics in a model
adaptive radiation of island lizards. Proc. Natl Acad. Sci. USA 107, 22178–22183
(2010).
14. Schoener, T. W. & Schoener, A. The time to extinction of a colonizing propagule of
lizards increases with island area. Nature 302, 332–334 (1983).
15. Blackburn, T. M., Cassey, P. & Lockwood, J. L. The island biogeography of exotic
bird species. Glob. Ecol. Biogeogr. 17, 246–251 (2008).
16. Sax, D. F. et al. Ecological and evolutionary insights from species invasions. Trends
Ecol. Evol. 22, 465–471 (2007).
17. Kerr, J. T., Kharouba, H. M. & Currie, D. J. The macroecological contribution to
global change solutions. Science 316, 1581–1584 (2007).
18. Sax, D. F. & Gaines, M. S. Species invasions exceed extinctions on islands
worldwide: a comparative study of plants and birds. Am. Nat. 160, 766–783
(2002).
19. Losos, J. B. Lizards in an Evolutionary Tree (Univ. California Press, 2009).
20. Ojeda Kessler, A. G. Status of the Culebra Island giant anole (Anolis roosevelti).
Herpetol. Conserv. Biol. 5, 223–232 (2010).
21. Helmus, M. R. & Ives, A. R. Phylogenetic diversity-area curves. Ecology 93, S31–S43
(2012).
22. Poe, S. Comparison of natural and nonnative two-species communities of Anolis
lizards. Am. Nat. 184, 132–140 (2014).
23. Steffen, W., Grinevald, J., Crutzen, P. J. & McNeill, J. The Anthropocene: conceptual
and historical perspectives. Phil. Trans. R. Soc. A 369, 842–867 (2011).
24. Thomas, C. D. The Anthropocene could raise biological diversity. Nature 502, 7
(2013).
25. Mendenhall, C. D., Karp, D. S., Meyer, C. F. J., Hadly, E. A. & Daily, G. C. Predicting
biodiversity change and averting collapse in agricultural landscapes. Nature 509,
213–217 (2014).
26. Essl, F., Winter, M. & Pysek, P. Biodiversity: trade threat could be even more dire.
Nature 487, 39 (2012).
27. Morinie`re, V. & Re´glain, A. Development of a GIS-based Database for Maritime Traffic
in the Wider Caribbean Region (Strategic Plan 10-11, Activity 4.6.b.2., UNEP RAC/
REMPEITC-Caribe, 2012).
28. Bhagwati, J. Protectionism (MIT Press, 1988).
29. Mahler, D. L., Revell, L. J., Glor, R. E. & Losos, J. B. Ecological opportunity and the rate
of morphological evolution in the diversification of greater antillean anoles.
Evolution 64, 2731–2745 (2010).
Acknowledgements We thank J. Behm, J. Ellers, A. Ives, C. Pfister, J. Vermaat and
T. Wootton for critical feedback; S. Buckner, S. Charles, A. Fields, M. Lo´pez Darias,
G. Perry, R. Platenberg, R. Powell, G. Reynolds, A. Sanchez, G. van Buurt and G. Wever for
information on anole introductions; and A. Reglain for access to the RAC/
REMPEITC-Caribe UNEP shipping traffic data set. M.R.H. was supported by the
Netherlands Organisation for Scientific Research (858.14.040) and the US National
Science Foundation (DBI 0906011).
Author Contributions M.R.H. conceived of the study, built the data sets and wrote the
manuscript. M.R.H and D.L.M. performed the analyses. J.B.L. was involved in study
design and contributed data. All authors discussed the results and commented on the
manuscript.
Author Information Reprints and permissions information is available at
www.nature.com/reprints. The authors declare no competing financial interests.
Readers are welcome to comment on the online version of the paper. Correspondence
and requests for materials should be addressed to M.R.H. ([email protected]).
5 4 6 | N AT U R E | VO L 5 1 3 | 2 5 S E P T E M B E R 2 0 1 4
©2014 Macmillan Publishers Limited. All rights reserved
LETTER RESEARCH
METHODS
We constructed a data set of native and exotic (34 establishments) anole distributions across 39 Caribbean banks with an exhaustive literature search and by contacting anole experts. All Caribbean-region banks with documented introductions
were analysed along with all banks that have endemic species (Extended Data Fig. 1).
All banks were within nations of the Caribbean Community and Common Market
(CARICOM) group, a geopolitical economic development organization that influences Caribbean trade. To test for phylogenetic underdispersion, we calculated the
mean relatedness of species in past and present bank assemblages and compared
the mean across banks to null distributions derived by randomizing species across
banks21. Bank area was estimated as total dry land area. Isolation was based on our
current understanding of anole ancestral biogeography (Extended Data Fig. 1)13,19,29,
estimated as the square root9 of: total pairwise distance from all banks, distance from
Cuba, distance from northern South America, and total distance from both Cuba
and northern South America (that is, the estimated origins of all Caribbean anoles).
We then performed a principal component analysis and used the resultant axes as
isolation metrics (Extended Data Table 4). Economic isolation was the total number
of ships docking on each bank from anywhere within the Caribbean region in 2007–
0827, divided by the maximum value across banks and subtracted from one (Extended
Data Fig. 4a). Alternative economic isolation metrics (for example, total cargo tonnage per ship) were highly correlated and produced the same conclusions. Regressions in Tables 1 and 2 were Gaussian and data met model assumptions. We tested
the sensitivity of our results by: using an alternative ancestral origin (Hispaniola),
removing banks without natives, removing the Greater Antilles, removing Bermuda,
using alternative species definitions, including bank age, and finally using an alternative data set30 of 43 Caribbean banks with 21 exotic establishments (Extended Data
Table 5).
30.
31.
32.
Powell, R. & Henderson, R. W. Island lists of West Indian amphibians and reptiles.
Florida Mus. Nat. Hist. Bull. 51, 85–166 (2012).
Pagel, M. Detecting correlated evolution on phylogenies: a general method for
the comparative analysis of discrete characters. Proc. R. Soc. Lond. B 255, 37–45
(1994).
Helmus, M. R., Bland, T. J., Williams, C. K. & Ives, A. R. Phylogenetic measures of
biodiversity. Am. Nat. 169, E68–E83 (2007).
©2014 Macmillan Publishers Limited. All rights reserved
RESEARCH LETTER
Extended Data Figure 1 | Bayesian maximum clade credibility
phylogeny of Caribbean Anolis lizards with estimates of geographic history
based on native species distributions. The relative likelihoods of character
states at internal nodes31 are depicted as pie charts and are coloured by
geography (see tip colours and labels). Grey boxes encompass nodes and edges
with relative log likelihood for a mainland state .0.005. Six banks here are
identified as having had cladogenetic (in situ) speciation: the Greater Antilles
(as previously reported6), St Vincent and Guadeloupe—St Vincent because our
phylogeny13,21,29 is different from the phylogeny of the previous work6, and
Guadeloupe because unlike the previous work6 we aggregated islands to banks.
©2014 Macmillan Publishers Limited. All rights reserved
LETTER RESEARCH
Extended Data Figure 2 | Caribbean anole bank saturation and the effect of
isolation on the species–area relationship (SAR). a, We used the residuals
from a linear regression (dashed line) of the bank SAR and deviations from a
90% quantile regression (dotted line in a–c) of the SAR of islands within the
Cuban bank as estimates of native anole saturation (Extended Data Table 2, 3).
SR is species richness. The two metrics of saturation were strongly correlated
(r 5 0.989, P = 0.001). b, Cuban islands span the range of areas exhibited
by Caribbean banks and are much less isolated and nearby to Cuba, the
most species-rich island in the Caribbean. Our 90% quantile regression is
analogous to calculations of island saturation curves based on drawing a line
between a source island and a species-rich island very near to the source1.
c, In the present day, bank richness has not exceeded the saturation curve, an
indication that banks are not currently oversaturated with anoles. Filled
symbols indicate banks with exotics. d, Isolation determines much of the
nonlinear relationship between past (that is, native) anole richness and area
(Fig. 2a) and validates our use of a linear model for the analyses in Tables 1
and 2. The ordinate is the residual from a regression of past species richness on
the three isolation metrics, and unlike the raw SAR in a, a linear model (solid
line), and not a breakpoint model (Fig. 2a), best fit the data.
©2014 Macmillan Publishers Limited. All rights reserved
RESEARCH LETTER
Extended Data Figure 3 | The loss of the Caribbean anole negative
phylogenetic diversity–isolation relationship (PDIR). a, In the past there was
a strong negative PDIR (P 5 0.003), but in the present day (b), this negative
relationship has been reduced by 71% and c, is no longer significant (see Table 1
footnote for definitions of the values in c). Phylogenetic species variability
(PSV) is the mean relative phylogenetic relatedness of all species on a bank32.
Red points are banks with, and blue points banks without, in situ speciation.
Filled symbols show banks with exotics. Grey points in b are banks that in the
past had ,2 anole species, but with exotic colonization now have 2 or more
species such that PSV can now be calculated32. Note that to be comparable, both
the PSV regressions in c are only on the banks with 2 or more native species.
Variation in PSV is caused both by colonization and in situ speciation.
Specifically, (1) Jamaica, Guadeloupe and St Vincent have low PSV because
they are derived from one colonization and then in situ speciation (Extended
Data Fig. 1); (2) Grenada, St Eustatius, Anguilla and Antigua have low PSV
because each of their two colonizations came from the same clade;
(3) Cay Sal, Little Cayman and Acklins have high PSV because they had
colonizations from distantly related clades originating from Cuba—each had a
natural colonization of the ubiquitous Anolis sagrei and of an ancestor from
the carolinensis clade; (4) Great Bahama has high PSV because it received
colonizations from both Hispaniola and Cuba; and (5) Cuba, Hispaniola and
Puerto Rico have high PSV because they have had much in situ speciation
derived from multiple colonizations.
©2014 Macmillan Publishers Limited. All rights reserved
LETTER RESEARCH
Extended Data Figure 4 | The effect of the US trade embargo on Cuban
economic isolation. a, There is a negative economic isolation–area
relationship (EIAR) across Caribbean banks. b, The largest residual
(studentized) of the EIAR (line in a) is Cuba. c, The predicted economic
isolation of Cuba (3 symbol) if the trade embargo is lifted, based on the EIAR.
©2014 Macmillan Publishers Limited. All rights reserved
RESEARCH LETTER
Extended Data Table 1 | Exotic colonization data set
©2014 Macmillan Publishers Limited. All rights reserved
LETTER RESEARCH
Extended Data Table 2 | Natural and anthropogenic mechanisms determine exotic anole richness
Depicted models are exotic richness regressed on economic isolation and either saturation measured as residuals from a linear regression of the past bank species–area relationship (SAR, Extended Data Fig. 2a) or
saturation measured as deviations from a 90% linear quantile regression of the SAR of islands of the Cuban bank (Extended Data Fig. 2b). Pearson correlation of these two saturation metrics was 0.98. Coefficient
estimates are presented and all variates were scaled to have mean 0 and s.d. 1. Both models had adjusted R2 5 0.40, F4,34 5 13.84, P = 0.001.
©2014 Macmillan Publishers Limited. All rights reserved
RESEARCH LETTER
Extended Data Table 3 | The saturation of banks with native anoles is explained by bank isolation and in situ speciation
Saturation is the residual of the linear SAR (Extended Data Fig. 2a). Coefficient estimates are presented for the full model with an adjusted R2 0.53, F4,34 5 11.71, P = 0.001. Also those banks in the upper quartile of
the banks below the threshold estimated by the breakpoint regression depicted in Fig. 2a are less saturated than the banks in the lower three quartiles of banks below the breakpoint (P 5 0.009).
©2014 Macmillan Publishers Limited. All rights reserved
LETTER RESEARCH
Extended Data Table 4 | Correlations of the original isolation metrics and the three orthogonal isolation metrics used in all analyses
The three isolation metrics are the principal components of the four original isolation metrics which are the square root9 of: total pairwise distance from all banks, distance from northern South America, distance
from Cuba, and total distance from both Cuba and northern South America (that is, the estimated origins of all Caribbean anoles). Correlations greater than 0.5 (absolute values) are in bold.
©2014 Macmillan Publishers Limited. All rights reserved
RESEARCH LETTER
Extended Data Table 5 | The shifting importance of geographic area and isolation (Table 1) and the importance of economic isolation to anole
Anthropocene island biogeography (Table 2) are robust to variations in the underlying data
The first scenario is as reported in the main text for ‘past to present change’ (Table 1) and ‘exotic/present richness’ (Table 2). For each scenario, the isolation metrics were recalculated and the regressions refitted.
The conservative species definitions scenario lumped the following species: luteosignifer to sagrei; kahouannensis, desiradei, terraealtae and chrysops to marmoratus; ernestwilliamsi and desechensis to cristatellus and
schwartzi to wattsi. Bank age was a binomial variable indicating if banks were completely submerged during the mid-Pliocene (3–3.3 Myr ago). The Powell and Henderson data set30 is an alternative data set of native
and exotic anole distributions across Caribbean banks—43 banks as opposed to our 39 and 21 exotic establishments as opposed to our 34. We did not merge the Powel and Henderson data set to the Caribbean
shipping traffic data set27.
©2014 Macmillan Publishers Limited. All rights reserved
LETTER RESEARCH
Extended Data Table 6 | Correlations of economic isolation on geographic area and isolation
Area and the four original distance metrics were log transformed. Only the area correlation was significant (P , 0.001). S.A. is South America. There was also no correlation between the pairwise geographic
distances between banks and the number of ships travelling between banks (r 5 20.23, P . 0.05, Mantel test).
©2014 Macmillan Publishers Limited. All rights reserved


© Copyright 2026