
full text PDF - International Journal of MCH and AIDS
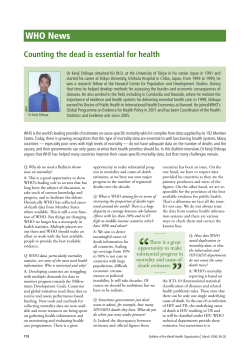
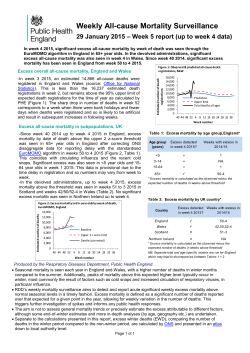
International Journal of MCH and AIDS (2015),Volume 3, Issue 2, 106-118 Available online at www.mchandaids.org INTERNATIONAL JOURNAL of MCH and AIDS ISSN 2161-864X (Online) ISSN 2161-8674 (Print) ORIGINAL ARTICLE Widening Socioeconomic and Racial Disparities in Cardiovascular Disease Mortality in the United States, 1969-2013 Gopal K. Singh, PhD;1 Mohammad Siahpush, PhD;2 Romuladus E. Azuine, DrPH, RN;1 Shanita D. Williams, PhD, RN, MPH3 The Center for Global Health and Health Policy, Global Health and Education Projects, Riverdale, Maryland 20738, USA; 2University of Nebraska Medical Center, Department of Health Promotion, Social and Behavioral Health, Omaha, NE 68198-4365, USA; 3US Department of Health and Human Services, Rockville, Maryland 20857, USA 1 Corresponding author email: [email protected] ABSTRACT Objectives: This study examined trends and socioeconomic and racial/ethnic disparities in cardiovascular disease (CVD) mortality in the United States between 1969 and 2013. Methods: National vital statistics data and the National Longitudinal Mortality Study were used to estimate racial/ethnic and area- and individual-level socioeconomic disparities in CVD mortality over time. Rate ratios and log-linear regression were used to model mortality trends and differentials. Results: Between 1969 and 2013, CVD mortality rates decreased by 2.66% per year for whites and 2.12% for blacks. Racial disparities and socioeconomic gradients in CVD mortality increased substantially during the study period. In 2013, blacks had 30% higher CVD mortality than whites and 113% higher mortality than Asians/Pacific Islanders. Compared to those in the most affluent group, individuals in the most deprived area group had 11% higher CVD mortality in 1969 but 40% higher mortality in 2007-2011. Education, income, and occupation were inversely associated with CVD mortality in both men and women. Men and women with low education and incomes had 46-76% higher CVD mortality risks than their counterparts with high education and income levels. Men in clerical, service, farming, craft, repair, construction, and transport occupations, and manual laborers had 30-58% higher CVD mortality risks than those employed in executive and managerial occupations. Conclusions and Global Health Implications: Socioeconomic and racial disparities in CVD mortality are marked and have increased over time because of faster declines in mortality among the affluent and majority populations. Disparities in CVD mortality may reflect inequalities in the social environment, behavioral risk factors such as smoking, obesity, physical inactivity, disease prevalence, and healthcare access and treatment. With rising prevalence of many chronic disease risk factors, the global burden of cardiovascular diseases is expected to increase further, particularly in low- and middle-income countries where over 80% of all CVD deaths occur. Key words: CVD mortality • Deprivation • Socioeconomic status • Race/ethnicity • Inequality • Longitudinal Copyright © 2015 Singh et al. This is an open-access article distributed under the terms of the Creative Commons Attribution License, which permits unrestricted use, distribution, and reproduction in any medium, provided the original work is properly cited. © 2015 Global Health and Education Projects, Inc. SES, Race, and Trends in CVD Mortality Introduction Cardiovascular diseases (CVD) are the leading cause of death not only in the United States (US) but worldwide.[1-7] Although CVD mortality has declined consistently and substantially over time, nearly 800,000 deaths still occur annually, accounting for 31% of all deaths in the US.[1-5] Globally, 17.3 million CVD deaths occur annually, representing 30% of all global deaths.[6,7] Cardiovascular diseases, including heart disease and stroke, have been the leading cause of death in the US for the last eight decades and contribute more to years of potential life lost than any other disease except cancer.[1,2] In the United States, the prevalence of smoking, a major risk factor, has decreased markedly over time, which has helped reduce CVD mortality by 75% during the past 60 years.[1,2] Health inequalities according to racial/ethnic and socioeconomic characteristics have long represented an important area of research in the United States, and reduction of health inequalities, including those in CVD morbidity and mortality, has been an integral part of the national health policy initiative for the past four decades.[1,8-11] Trends and contemporary patterns in CVD mortality are routinely analyzed by age, sex, race/ ethnicity,and place of residence in the United States.[1-5] Several US studies have also examined differentials in CVD mortality according to socioeconomic status (SES) or area-based deprivation level.[11-15] However, studies of time trends in CVD mortality according to area- and individual-level SES are still relatively uncommon in the United States.[11,12] Previous research has shown substantial and widening socioeconomic disparities in CVD mortality in the US.[11] Research showing increased CVD mortality risks among lower SES groups in the US dates as far back as 1950.[12] Similarly, historical data showing consistently and markedly higher CVD mortality rates among US blacks than whites and among males than females goes as far back as 1935.[2] In 2012, the CVD prevalence was at least 50% higher among blacks, Hispanics, and American Indians/Alaska Natives than whites; and the CVD © 2015 Global Health and Education Projects, Inc. mortality rate was 1.3 times higher for blacks than for whites.[4,16] To our knowledge, comprehensive efforts have not yet been undertaken to examine socioeconomic patterns in CVD mortality across major racesex groups in a temporal fashion, using annual mortality data for the past four decades. It is important to estimate and monitor the magnitude of CVD mortality disparities across racial and socioeconomic groups for the purposes of setting up CVD prevention and control programs, resource allocation, and target setting.[8,11] Temporal analysis allows us to assess progress in reducing health inequalities among those at higher risks of CVD morbidity and mortality. It also provides important insights into the role of health-policy and medical interventions in reducing cardiovascular disease burden, such as differential access to health services and availability of drugs/ medications to lower cholesterol and blood pressure levels, and surgical treatments, well as of changing socioeconomic conditions and behavioral risk factors such as smoking, obesity, physical inactivity, and unhealthy diet.[6-8,10,11] The aim of our study is to examine changes in the extent of socioeconomic and racial disparities in CVD mortality in the US between 1969 and 2013. We use census-based deprivation indices linked to national vital statistics mortality data to examine area-based socioeconomic differences in CVD mortality over time. Additionally, we use the National Longitudinal Mortality Study (NLMS) to analyze temporal variations in CVD mortality risks by individual-level socioeconomic and demographic characteristics.[17] We examine annual trends in CVD mortality among major racial/ethnic groups and analyze whether socioeconomic gradients in mortality vary by sex. Methods Linking National Vital Statistics and Census Databases to Compute Mortality Rates by Area Deprivation Level To analyze temporal inequalities in CVD mortality, we used the national vital statistics mortality database.[1-5,18] Since the vital-statistics-based | www.mchandaids.org 107 Singh et al. International Journal of MCH and AIDS (2015), Vol. 3, No. 2, 106-118 national mortality database lacks reliable SES data, socioeconomic patterns in CVD mortality were derived by linking the 1990 and 2000 census-based county-level deprivation indices to age-sex-racecounty-specific mortality statistics from 1969 through 2011.[9-11,19,20] Area Deprivation Indices for the United States We used previously published factor-based deprivation indices from the 1990 and 2000 decennial US censuses.[10,11,19] The 1990 deprivation index consisted of 17 census-based socioeconomic indicators, which may be viewed as broadly representing educational opportunities, labor force skills, economic, and housing conditions in a given county.[10,11] Selected indicators of education, occupation, wealth, income distribution, unemployment, poverty, and housing quality were used to construct the 1990 index.[10,11] The factor loadings (correlations of indicators with the index) for the 1990 index ranged from 0.92 for 150% of the poverty rate to 0.45 for household plumbing.[10,11] The 2000 deprivation index consisted of 22 socioeconomic indicators, including five additional measures of income distribution, wealth, and housing quality.[19] The factor loadings for the 2000 index varied from 0.92 for 150% of the poverty rate to 0.39 for household plumbing.[19] The common indicators in the 1990 and 2000 deprivation indices generally had similar factor loadings or relative weights.[10,11,19] The correlation between the 1990 and 2000 deprivation indices was 0.97, indicating a fairly stable geographical distribution of deprivation in the US over time. Substantive and methodological details of the US deprivation indices are provided elsewhere.[10,11,19] In order to compute mortality rates by deprivation level, we used the weighted population quintile distribution of the deprivation index that classified all 3,141 US counties into 5 groups of approximately equal population size.[10,11,19] The groups thus created ranged from being the most-deprived (first quintile) to the least-disadvantaged (fifth quintile) population groups.[10,11,19] Each of the 3,141 counties in the mortality database was assigned one of the 5 deprivation quintiles. The 1990 index was used to compute deprivation-specific mortality rates from 1969 to 1998, whereas the 2000 index was used to 108 www.mchandaids.org | compute mortality rates by deprivation level from 1999 to 2011. CVD mortality rates were computed annually for the total population and by race and sex from 1969 through 2013. CVD mortality rates according to county deprivation levels were computed annually between 1969 and 1998 and for the following time periods: 1999-2001, 2002-2006, and 2007-2011. Our trend analysis included all 41,755,700 CVD deaths that occurred in the US between 1969 and 2013. Of these, 36,783,348 (or 88.1%) deaths occurred among whites and 4,433,500 (or 10.6%) deaths among blacks. Mortality rates for each area- or individuallevel socioeconomic group and race-sex group were age-adjusted by the direct method using the age-composition of the 2000 US population as the standard.[1-5,10,11] Log-linear regression models were used to estimate annual rates of decrease in CVD mortality for race, sex, and deprivation groups.[10,11] Specifically, the logarithm of mortality rates were modeled as a linear function of time (calendar year), which yielded annual exponential rates of change in mortality rates.[10,11] Racial/ethnic and deprivationspecific disparities in mortality were described by rate ratios (relative risks) and rate differences (absolute inequalities), which were tested for statistical significance at the 0.05 level. National Longitudinal Mortality Study (NLMS) To examine variations in CVD mortality rates according to individual-level socioeconomic and demographic characteristics, we used the 19791998 NLMS data. The NLMS is a longitudinal dataset for examining socioeconomic, occupational, and demographic factors associated with all-cause and cause-specific mortality in the United States.[13,17,21,22] The NLMS is conducted by the National Heart, Lung, and Blood Institute (National Institutes of Health [NIH]) in collaboration with the US Census Bureau, the National Cancer Institute (NIH), the National Institute on Aging (NIH), and the National Center for Health Statistics (Centers for Disease Control and Prevention). [13,17,21,22] The NLMS consists of 30 Current Population Survey (CPS) and census cohorts between 1973 and 2002 whose survival © 2015 Global Health and Education Projects, Inc. SES, Race, and Trends in CVD Mortality Relative Contribution of CVD to Overall Mortality Figure 1 shows changes in relative contributions of CVD and cancer, the top two leading causes of death, to overall US mortality over time. Even though CVD has become relatively less important over time as a cause of death, it still accounted for 31% of all US deaths in 2013. About 23% of all deaths in 2013 were due to cancer. In 1969, on the other hand, CVD accounted for 53% of all US deaths, and there were 3 times as many deaths from CVD as from cancer. In terms of age-specific risks, CVD is a more prominent cause of death than cancer for infants and at older ages 75 years and beyond, while CVD and cancer exert similar mortality risks between ages 20 and 74 years (Figure 1). Trends in Racial/Ethnic Disparities in CVD Mortality Figure 2 presents annual CVD mortality trends from 1969 to 2013 for the total US population and by race/ ethnicity and sex. During 1969-2013, the total CVD © 2015 Global Health and Education Projects, Inc. Percentage of all deaths 52.7 45 46.8 40 35 30 25 30.7 30.5 20 22.5 15 16.8 CVD 10 Cancer All other diseases 2013 2011 2009 2007 2005 2003 2001 1999 1997 1995 1993 1991 1989 1987 1985 1983 1981 1979 1977 1975 1973 1971 0 1969 5 Age-Specific Patterns in Cause-Specific Mortality, 2013 100000 CVD 10000 Cancer All causes combined 1000 100 10 85+ 80-84 75-79 70-74 65-69 60-64 55-59 50-54 45-49 40-44 35-39 30-34 25-29 20-24 15-19 5-9 0.1 1-4 1 10-14 Results 50 <1 year The full NLMS consists of approximately 3 million individuals drawn from 30 CPS and census cohorts whose mortality experience has been followed from 1979 through 2002, with the total number of deaths during the 23-year follow-up being 341,343.[17] For this study, we used the 1979-1998 NLMS data to compute cohort-based mortality rates during 1979-1989 and 1990-1998 using the person-years approach. Mortality rates in the NLMS were expressed as the number of deaths divided by person-years lived, adjusting for age. Relative Contribution of CVD and Cancer to Total Mortality 55 Rate per 100,000 population (log-scale) (mortality) experiences were studied between 1979 and 2002.[17] The CPS is a sample household and telephone interview survey of the civilian noninstitutionalized population in the United States and is conducted by the US Census Bureau to produce monthly national statistics on unemployment and the labor force. Data from death certificates on the fact of death and cause of death are combined with the socioeconomic and demographic characteristics of the NLMS cohorts by means of the National Death Index.[13,17,21,22] Detailed descriptions of the NLMS have been provided elsewhere.[17,21,22] Figure 1. Relative Contribution of Cardiovascular Disease (CVD) and Cancer to Overall Mortality and Age-Specific Patterns in CVD and Cancer Mortality, United States, 1969-2013 mortality rate declined by 69.6%. Between 1969 and 2013, CVD mortality rates decreased by 2.66% per year for whites and 2.12% for blacks. Mortality rates declined consistently between 1990 and 2013 for American Indians/Alaska Natives (AIANs), Asians/ Pacific Islanders (APIs), and Hispanics at average annual rates of 2.79%, 3.11%, and 2.47%, respectively. While absolute black/white differences in CVD mortality, as measured by rate differences, narrowed somewhat during the last two decades, racial disparities in CVD mortality, as measured by rate ratios, widened consistently between 1969 and 2013 (Figure 2). Compared to whites, blacks had 12% higher CVD mortality in 1969 but 38% higher mortality in 2007. In 2013, blacks had 30% higher CVD mortality than whites, but APIs, AIANs, and Hispanics 25-39% had lower CVD mortality than | www.mchandaids.org 109 Singh et al. International Journal of MCH and AIDS (2015), Vol. 3, No. 2, 106-118 Age-adjusted death rate per 100,000 2000 US standard population Age-adjusted death rate per 100,000 2000 US standard population 1000 Age-adjusted death rate per 100,000 2000 US standard population Both Sexes 1000 1000 All Races White Black American Indian & Alaska Native Asian & Pacific Islander Hispanic 800 600 400 0 1969 1971 1973 1975 1977 1979 1981 1983 1985 1987 1989 1991 1993 1995 1997 1999 2001 2003 2005 2007 2009 2011 2013 200 Males 800 600 400 0 1969 1971 1973 1975 1977 1979 1981 1983 1985 1987 1989 1991 1993 1995 1997 1999 2001 2003 2005 2007 2009 2011 2013 200 Females 800 600 400 0 1969 1971 1973 1975 1977 1979 1981 1983 1985 1987 1989 1991 1993 1995 1997 1999 2001 2003 2005 2007 2009 2011 2013 200 Figure 2. Trends in Cardiovascular Disease (CVD) Mortality by Race/Ethnicity and Sex, United States, 1969-2013 whites. Racial/ethnic patterns in CVD mortality were similar for men and women. Trends in Area Socioeconomic Disparities in CVD Mortality Area socioeconomic gradients (rate ratios) in CVD mortality increased substantially during 1969-2011 (Figure 3). Compared to those in the most-affluent group, individuals in the most-deprived area group had 11% higher CVD mortality in 1969, but 40% higher mortality in 2007-2011. During 1969-2011, 110 www.mchandaids.org | even though CVD mortality rates decreased by at least 62% for all deprivation groups, more deprived groups had higher mortality rates than less deprived groups in each year/time-period (Figure 3). CVD mortality declined at a much faster pace among individuals in the most affluent group than those in more deprived groups. During 1969-2011, CVD mortality in the five most-to-least deprived groups decreased at average annual rates of 2.20%, 2.48%, 2.54%, 2.66%, and 2.71%, respectively. Absolute socioeconomic disparities in CVD mortality for the total, male, and female populations, as measured by rate differences between the most and least deprived quintiles, also widened between 1982 and 2012. CVD mortality rates decreased with decreasing deprivation levels for both white and black populations, with socioeconomic gradients in CVD mortality increasing consistently during 1969-2011 for both racial groups (data not shown for brevity). Absolute socioeconomic inequalities also widened over time for both whites and blacks. During 2007-2011, CVD mortality rates varied from a low of 118.23 deaths per 100,000 population for AIANs in the least-deprived group to a high of 334.59 for blacks in the most-deprived group. Socioeconomic gradients were steepest for AIANs. Whites, blacks, AIANs, APIs, and Hispanics had, respectively, 1.36, 1.32, 1.76, 1.27, and 1.42 times higher CVD mortality in the most deprived group than in the least deprived group (Figure 4). Trends in Individual-Level Disparities in CVD Mortality Socioeconomic Tables 1 and 2 show changes in CVD mortality rates according to individual-level baseline socioeconomic and demographic characteristics in the NLMS. Education, income, and occupation were inversely associated with CVD mortality in both men and women, with individual-level socioeconomic patterns being similar during 1979-1989 and 19901998. Although CVD mortality rates for almost all socioeconomic and marital status groups, especially for men, declined significantly between the two time periods, the social gradients in mortality persisted. Men and women with low education and incomes had 46-76% higher CVD mortality risks than their © 2015 Global Health and Education Projects, Inc. CVD Mortality Rates, Both Sexes Relative Risk of CVD Mortality, Both Sexes 550 450 350 1991 1993 1995 1997 1999-01 2007-11 1981 1983 1985 1987 1989 250 2007-11 1997 1999-01 1995 1993 1991 1989 1987 1985 1983 2007-11 1999-01 1997 1995 1993 1991 1989 1987 Relative Risk of CVD Mortality, Females 1.4 1.39 1.3 1.2 1.10 1.1 1.0 0.9 1969 1971 1973 1975 1977 1979 1981 1983 1985 1987 1989 1991 1993 1995 1997 1999-01 2007-11 Age-adjusted relative risk of mortality CVD Mortality Rates, Females 650 1985 1.0 0.9 1999-01 2007-11 1995 1997 1991 1993 1987 1989 1985 1981 1983 1977 1979 1973 1975 1969 1971 250 1.1 1983 350 1.11 1981 450 1.2 1979 550 1.3 1973 650 1.39 1971 750 1.4 1969 Age-adjusted relative risk of mortality 850 150 1981 Relative Risk of CVD Mortality, Males CVD Mortality Rates, Males 950 150 1979 0.9 1977 1.0 1977 150 1969 1971 1973 1975 1977 1979 1981 1983 1985 1987 1989 1991 1993 1995 1997 1999-01 2007-11 250 1.11 1.1 1975 350 1.2 1973 450 1.3 1975 550 1.40 1st Quintile (Low SES) 2nd Quintile 3rd Quintile 4th Quintile 5th Quintile (High SES) 1971 650 1.4 1969 1st Quintile (Low SES) 2nd Quintile 3rd Quintile 4th Quintile 5th Quintile (High SES) 750 Age-adjusted relative risk of mortality 850 1969 1971 1973 1975 1977 1979 Age-adjusted death rate per 100,000 population 2000 US population used as standard Age-adjusted death rate per 100,000 population 2000 US population used as standard Age-adjusted death rate per 100,000 population 2000 US population used as standard SES, Race, and Trends in CVD Mortality Figure 3. US Cardiovascular Disease (CVD) Mortality by Area Socioeconomic Deprivation Index, 1969-2011 counterparts with high education and income levels. Men in clerical, service, farming, craft, repair, © 2015 Global Health and Education Projects, Inc. construction, and transport occupations, and manual laborers had 30-58% higher CVD mortality risks | www.mchandaids.org 111 Singh et al. International Journal of MCH and AIDS (2015), Vol. 3, No. 2, 106-118 344.6 334.1 1st Quintile (Low SES) 2nd Quintile 3rd Quintile 4th Quintile 278.64 278.6 262.0 151.6 155.83 155.8 200 118.2 150 207.8 187.7 164.48 163.3 146.3 207.5 5th Quintile (High SES) 165.5 159.4 151.21 151.2 130.8 279.8 249.2 250 213.62 213.6 206.1 254.5 300 288.2 350 215.74 215.7 206.5 Age-adjusted death rate per 100,000 population 2000 US population used as standard 400 100 50 All Races White Black American Asian/Pacific Indian/Alaska Islander Native Hispanic Figure 4: Cardiovascular Disease (CVD) Mortality by Race/ Ethnicity and Socioeconomic Deprivation Level, United States, 2007-2011 than those employed in executive and managerial occupations. Among women, those employed in sales and service occupations, respectively, had 17% and 29% higher CVD mortality risks, and those in transport occupations had 2.6 times higher mortality risks in 1990-1998 than those in executive and managerial occupations. Unemployed men but not women were significantly more likely to die from CVD than their employed counterparts. Both men and women with disabilities had 2.1-2.6 times higher risks of CVD mortality than their employed counterparts. In 1990-1998, self-employed men had the lowest CVD mortality risk, whereas women working in the government sector had the lowest mortality risk. Divorced/separated, never married, and widowed individuals had 15-32% higher CVD mortality risks than their married counterparts. Discussion Cardiovascular disease mortality rates have decreased substantially for all socioeconomic and racial/ethnic groups in the United States. Despite the impressive overall decline in mortality, socioeconomic and racial disparities in CVD mortality have remained marked and increased over time, as relative inequalities in mortality widened consistently between 1969 and 2013. During 1969-2013, whites and those in more affluent groups experienced faster declines in CVD 112 www.mchandaids.org | mortality than blacks and those in more deprived groups respectively, which contributed to the widening gap in CVD mortality. Absolute inequalities in CVD mortality, as measured by mortality rate differences, also widened between black and white populations and across deprivation groups during the past three decades. These marked and growing social inequalities in CVD mortality runs counter to the goals of the national health initiative that calls for further reductions or elimination of health inequalities in the United States, including those in cardiovascular disease, by 2020.[8] Area-based socioeconomic differences in CVD mortality reported here are consistent with those at the individual level. Cardiovascular disease mortality rates in 1979-1989 and 1990-1998 by individual-level socioeconomic and demographic characteristics presented herein should serve as the baseline data for comparison with more recent mortality followup data in the NLMS and for comparison with international patterns.[17] Socioeconomic and racial/ethnic disparities in CVD mortality reflect inequalities in the social environment (e.g., material living conditions, social support, and stress), behavioral risk factors such as smoking,obesity,physical inactivity,disease prevalence, and healthcare access and treatment.[6,7,11,14] In the United States, racial/ethnic minorities such as blacks, American Indians/Alaska Natives, and Hispanics are greatly disadvantaged in socioeconomic attainment compared to whites. They have significantly lower education and income levels and higher rates of poverty, unemployment, and lack of health insurance than whites.[1,23-25] During the past 4 decades, poverty rates for blacks and Hispanics have been 2-3 times higher than the rate for whites, and the unemployment rate for backs has consistently been twice that for whites.[1,23,24] The substantial whiteblack gap in median family income has persisted, and absolute racial differences in income have widened over time.[24,25] In general, ethnic minorities and individuals with lower SES or in more deprived areas of the United States have reduced access to health care and are more likely to forego or delay preventive © 2015 Global Health and Education Projects, Inc. SES, Race, and Trends in CVD Mortality Table 1. Age-Adjusted Death Rates per 100,000 Person-Years of Exposure and Relative Risks of Cardiovascular Disease (CVD) Mortality Among US Males Aged 25+ years: The National Longitudinal Mortaliy Study, 1979-1998 Baeline Sociodemographic characteristics 1979-1989 (Males) Death rate SE RR 95% CI 1990-1998 (Males) Death rate SE RR 95% CI % Decline in death rate, 1979-1998 Marital status Married 739.74 5.80 1.00 Reference 562.50 3.66 1.00 Reference 23.96 Widowed 914.16 29.34 1.24 1.16-1.32 740.28 34.21 1.32 1.20-1.44 19.02 Divorced/separated 892.71 27.51 1.21 1.13-1.28 644.51 15.25 1.15 1.09-1.20 27.80 Never married 893.30 24.29 1.21 1.14-1.27 649.61 15.62 1.15 1.10-1.21 27.28 Education (years) <9 879.16 10.44 1.46 1.38-1.54 679.09 8.58 1.52 1.46-1.59 22.76 9-11 829.18 14.98 1.38 1.29-1.46 679.51 9.99 1.52 1.45-1.59 18.05 20.56 12 742.66 12.14 1.23 1.16-1.30 589.99 6.72 1.32 1.27-1.38 13-15 719.85 18.60 1.19 1.11-1.28 536.33 10.22 1.20 1.14-1.26 25.49 16+ 602.58 15.14 1.00 Reference 446.24 8.20 1.00 Reference 25.95 Poverty status (ratio of family income to poverty threshold) <100% 957.63 17.50 1.64 1.52-1.75 689.67 12.80 1.51 1.43-1.59 27.98 100-149% 865.10 16.70 1.48 1.38-1.58 682.99 12.56 1.49 1.41-1.57 21.05 150-199% 844.89 16.79 1.44 1.34-1.55 667.71 11.67 1.46 1.38-1.54 20.97 200-399% 725.00 9.81 1.24 1.16-1.32 584.39 6.02 1.28 1.22-1.32 19.39 400-599% 690.80 15.40 1.18 1.10-1.26 536.97 8.44 1.17 1.12-1.23 22.27 ≥600% 584.85 17.51 1.00 Reference 457.26 9.20 1.00 Reference 21.82 Employment status Employed 583.65 12.44 1.00 Reference 505.49 6.09 1.00 Reference 13.39 Unemployed 869.97 44.75 1.49 1.33-1.65 628.28 38.19 1.24 1.09-1.39 27.78 1,623.05 45.32 2.78 2.59-2.97 1,051.11 32.61 2.08 1.94-2.22 35.24 984.16 16.39 1.69 1.60-1.78 755.78 11.43 1.50 1.44-1.55 23.21 15.13 Disabled/unable to work Outside labor force Class of worker Private sector 619.82 18.11 1.06 0.98-1.15 526.03 7.94 1.10 1.04-1.15 Government sector 615.26 17.93 1.06 0.97-1.14 558.30 18.69 1.16 1.08-1.25 9.26 Self-employed 582.32 17.73 1.00 Reference 479.43 9.64 1.00 Reference 17.67 Executive/managerial 501.01 31.48 1.00 Reference 404.86 14.56 1.00 Reference 19.19 Professional/technical 570.97 29.80 1.14 0.96-1.32 471.34 14.85 1.16 1.06-1.27 17.45 Sales 688.21 37.43 1.37 1.15-1.60 487.89 16.23 1.21 1.09-1.32 29.11 Clerical/administrative support 673.05 56.78 1.34 1.07-1.62 534.23 24.34 1.32 1.17-1.47 20.63 Occupation Service 705.58 33.83 1.41 1.19-1.63 563.69 17.15 1.39 1.26-1.52 20.11 Farmers and farm managers 601.75 24.95 1.20 1.02-1.38 538.90 15.47 1.33 1.21-1.45 10.44 12.34 Craftsmen and kindred 624.35 38.51 1.25 1.03-1.46 547.31 16.60 1.35 1.23-1.58 Operatives, except transport 673.75 67.92 1.34 1.03-1.66 638.56 32.14 1.58 1.39-1.77 5.22 Transport equipment operatives 605.20 64.48 1.21 0.92-1.50 527.18 21.99 1.30 1.16-1.44 12.89 Laborers 573.66 51.39 1.15 0.90-1.39 612.05 29.56 1.51 1.33-1.69 −6.69 © 2015 Global Health and Education Projects, Inc. | www.mchandaids.org 113 Singh et al. International Journal of MCH and AIDS (2015), Vol. 3, No. 2, 106-118 Table 2. Age-Adjusted Death Rates per 100,000 Person-Years of Exposure and Relative Risks of Cardiovascular Disease (CVD) Mortality Among US Females Aged 25+ Years: The National Longitudinal Mortaliy Study, 1979-1998 Baeline 1979-1989 (Females) sociodemographic characteristics Death rate 1990-1998 (Females) SE RR 95% CI Death rate SE RR 95% CI % Decline in death rate, 1979-1998 Marital status Married 422.35 5.63 1.00 Reference 347.45 2.98 1.00 Reference 17.73 Widowed 552.51 12.70 1.31 1.24-1.38 459.13 9.25 1.32 1.26-1.38 16.90 Divorced/separated 522.47 17.18 1.24 1.15-1.32 431.89 9.50 1.24 1.19-1.30 17.34 Never married 547.04 14.60 1.30 1.22-1.37 446.05 10.45 1.28 1.22-1.35 18.46 <9 574.58 7.41 1.57 1.47-1.67 473.78 6.22 1.59 1.51-1.67 17.54 9-11 516.66 8.91 1.41 1.32-1.51 468.39 6.43 1.58 1.50-1.66 9.34 12 442.24 6.64 1.21 1.13-1.29 364.09 3.83 1.22 1.17-1.28 17.67 13-15 406.19 10.14 1.11 1.03-1.20 332.85 6.13 1.12 1.06-1.18 18.06 16+ 365.48 11.12 1.00 Reference 297.29 6.51 1.00 Reference 18.66 Education (years) Poverty status (ratio of family income to poverty threshold) <100% 594.93 9.32 1.61 1.50-1.72 511.43 7.32 1.76 1.66-1.85 14.04 100-149% 517.57 10.02 1.40 1.30-1.50 447.72 7.39 1.54 1.45-1.62 13.50 150-199% 491.43 10.76 1.33 1.23-1.43 419.94 7.23 1.44 1.36-1.52 14.55 200-399% 444.91 6.78 1.20 1.12-1.28 370.74 4.11 1.27 1.21-1.34 16.67 400-599% 412.18 10.58 1.11 1.02-1.20 322.32 5.86 1.11 1.04-1.117 21.80 ≥600% 370.49 11.59 1.00 Reference 291.18 6.63 1.00 Reference 21.41 Employed 347.64 14.95 1.00 Reference 318.58 6.14 1.00 Reference 8.36 Unemployed 358.24 37.97 1.03 0.80-1.26 341.78 35.27 1.07 0.85-1.29 4.59 1,203.66 48.41 3.46 3.06-3.86 832.67 31.53 2.61 2.40-2.83 30.82 495.11 4.11 1.42 1.30-1.55 414.89 3.06 1.30 1.25-1.35 16.20 Private sector 373.33 18.11 1.16 0.96-1.37 329.64 6.87 1.00 0.90-1.09 11.70 Government sector 337.34 16.34 1.05 0.86-1.24 295.57 14.01 0.89 0.78-1.01 12.38 Self-employed 320.66 24.84 1.00 Reference 330.54 14.19 1.00 Reference -3.08 Executive/managerial 368.34 40.88 1.00 Reference 295.15 14.99 1.00 Reference 19.87 Professional/technical 297.34 40.47 0.81 0.53-1.09 304.12 20.70 1.03 0.86-1.20 -2.28 Sales 359.40 36.39 0.98 0.69-1.26 346.45 15.51 1.17 1.02-1.33 3.60 Clerical/administrative support 402.73 37.80 1.09 0.78-1.40 298.54 12.36 1.01 0.88-1.14 25.87 Service 366.64 20.59 1.00 0.75-1.24 379.38 10.48 1.29 1.14-1.43 -3.47 Farmers and farm managers 321.33 52.35 0.87 0.54-1.21 304.79 27.93 1.03 0.82-1.24 5.15 Craftsmen and kindred 343.38 62.17 0.93 0.54-1.32 315.02 30.67 1.07 0.84-1.30 8.26 Operatives, except transport 425.18 79.55 1.15 1.66-1.65 368.08 23.05 1.25 1.05-1.44 13.43 757.06 112.86 2.57 1.77-3.36 551.14 73.65 1.50 0.99-2.01 298.11 47.83 1.01 0.68-1.34 Employment status Disabled/unable to work Outside labor force Class of worker Occupation Transport equipment operatives Laborers 114 www.mchandaids.org | © 45.91 2015 Global Health and Education Projects, Inc. SES, Race, and Trends in CVD Mortality or needed medical care than their more advantaged counterparts.[1,11,20] With reduced access to preventive care and early detection services, individuals in disadvantaged minority groups are more likely to be diagnosed with advanced disease and have lower survival rates even after controlling for socioeconomic characteristics.[20] Racial/ethnic and socioeconomic patterns in risk factors such as smoking, hypertension, and serum cholesterol are generally consistent with those in CVD mortality. Smoking prevalence is higher in American Indians/Alaska Natives, whites, and blacks than Asians.[1,16] Smoking prevalence is also substantially higher in lower SES groups or more deprived areas, and has fallen much more rapidly in higher SES groups than in more disadvantaged groups.[1,16] In 2012, the prevalence of hypertension was 38% higher in blacks than whites, whereas those with low education and family income levels had an approximately 50% higher prevalence of hypertension than their low-SES counterparts.[16] There is a consistent income gradient in high cholesterol levels, with Americans at lower income levels having moderately higher serum cholesterols than their higher-income counterparts.[1,16] Obesity prevalence is higher among lower socioeconomic groups and among blacks, American Indians/Alaska Natives, and Hispanics.[1,16,26] Social class gradients and racial disparities in US obesity rates have persisted for the past 4 decades.[1,26] With obesity and diabetes prevalence continuing to rise in the United States and smoking and physical inactivity levels being relatively high among several racial/ethnic and sociodemographic groups, further declines in US cardiovascular disease mortality are not a given.[1,16,26] Indeed, with prevalence of many chronic disease risk factors on the rise in many parts of the world, the global burden of cardiovascular disease and other non-communicable diseases such as cancer and diabetes is expected to increase further, particularly in low- and middle-income countries, where over 80% of all CVD deaths occur.[6,7,27,28] The temporal patterns in CVD mortality shown here are consistent with those observed previously for the United States, where socioeconomic disparities © 2015 Global Health and Education Projects, Inc. (in terms of relative inequalities) increased over time even as overall CVD mortality rates declined markedly.[11] A previous NLMS analysis based on the 1979-1989 follow-up showed substantial inverse socioeconomic gradients in CVD mortality, with men and women with low levels of education and family income having 35-63% higher adjusted risks of CVD mortality than those with high education and income levels, a finding compatible with our study.[13] Also consistent with our study, the previous NLMS study found 32-45% lower CVD mortality risks in Hispanic women and men than their non-Hispanic white counterparts, even after adjusting for socioeconomic and demographic characteristics.[13] Increasing socioeconomic disparities in CVD mortality shown here are consistent with those observed for several European countries although the magnitude of SES disparities in the US tends to be greater than that for some countries in Southern Europe.[29-33] Like the United States, social class gradients in cardiovascular disease and ischemic heart disease mortality in the United Kingdom and other European countries increased as mortality rates declined more rapidly for those in lower social class groups or more deprived areas.[29-33] Conclusions and Global Health Implications Reductions in CVD mortality rates for all socioeconomic and racial/ethnic groups in the US have contributed substantially to gains in life expectancy over time and must be seen as a major public health achievement. However, the growing socioeconomic and racial disparities in CVD mortality remain a major public policy concern. Because cardiovascular diseases are the leading cause of death and account for nearly one-third of all US deaths, these widening inequalities in CVD mortality contribute greatly to overall levels of health and mortality inequalities in the United States.[1,4,10,11] These disparities in mortality reflect substantial and continuing gaps in CVD prevention and control efforts across various population subgroups. Higher inequality in social and behavioral risk factors is perhaps an important contributing factor for the United States’ unfavorable standing in CVD mortality relative to many other Organization | www.mchandaids.org 115 Singh et al. International Journal of MCH and AIDS (2015), Vol. 3, No. 2, 106-118 for Economic Cooperation and Development (OECD) countries.[32-34] For example, Canada, United Kingdom, Australia, Germany, Sweden, Norway, Denmark, and Switzerland have significantly lower mortality rates from ischemic heart disease, and the rates for South Korea, Japan, and France are 60-70% lower than those for the United States.[34] While changes in the social patterning of behavioral risk factors such as smoking, diet, physical Key Messages • Black/white disparities in mortality from cardiovascular disease (the leading cause of death in the US for the past eight decades) rose consistently betzeen 1969 and 2013. • Lower levels of area- and individual-level socioeconomic position were associated with substantially higher rates of cardiovascular-disease mortality among US men and women during the study period. • Area socioeconomic inequalities in cardiovascular-disease mortality increased consistently between 1969 and 2011 for the total US population, whites, and blacks as higher socioeconomic groups experienced faster mortality declines. Absolute inequalities in cardiovascular-disease mortality also widened over time. • Increasing social inequalities in US cardiovascular-disease mortality may be related to increasing temporal differences in material living conditions and behavioral risk factors such as smoking, obesity, physical inactivity, and unhealthy diet between social groups and geographic areas. • From a policy standpoint, narrowing the socioeconomic gap between affluent and disadvantaged areas has the potential to reduce CVD and hence overall mortality. With prevalence of many chronic disease risk factors on the rise in the developing world, the global burden of cardiovascular diseases and other non-communicable diseases such as cancer and diabetes is expected to increase further, particularly in low- and middle-income countries where over 80% of all CVD deaths occur. 116 www.mchandaids.org | inactivity, and alcohol use may have been largely responsible for temporal social inequalities in CVD mortality, the inequalities in lifestyle factors are themselves largely determined by underlying social and economic factors.[11,14,15,20,35] Behavioral and health care interventions would likely be less effective without addressing the larger societal/social and economic forces that give rise to inequalities in behavioral risk factors in the first place.[11,14,30,35] A broad course of policy action with a clear emphasis on the wider social determinants is, therefore, needed to tackle the problem of growing inequalities in CVD mortality.[11,30,35] Health and social policy interventions such as improved access to health services and reductions in inequalities in education, poverty, unemployment, occupation, and housing are essential for tackling long-term health inequalities in CVD mortality between socioeconomic and racial groups in the United States.[6,11,14,30,35] Acknowledgments The views expressed are the authors’ and not necessarily those of their respective institutions. Human Subjects Review: No IRB approval was required for this study, which is based on the secondary analysis of public-use federal databases. Financial Disclosure: None. Funding/Support: None. Conflicts of Interest: None. References 1. National Center for Health Statistics. Health, United States, 2013 with Special Feature on Prescription Drugs. Hyattsville, MD: US Department of Health and Human Services; 2014. 2. Hoyert DL. 75 years of mortality in the United States, 2010. NCHS Data Brief. 2012;88:1-8. 3. Murphy SL, Xu JQ, Kochanek KD. Deaths: final data for 2010. National Vital Statistics Reports. 2013;61(4):1-168. 4. Xu J, Kochanek KD, Murphy SL, Arias E. Mortality in the United States, 2012. NCHS Data Brief. 2014;168:1-8. 5. Kochanek KD, Murphy SL, Xu J, Arias E. Mortality in the United States, 2013. NCHS Data Brief. 2014;178:1-8. 6. World Health Organization. Global Atlas on © 2015 Global Health and Education Projects, Inc. SES, Race, and Trends in CVD Mortality Cardiovascular Disease Prevention and Control. Geneva, Switzerland: WHO; 2011. 7. Laslett LJ, Alagona P, Clark BA, Drozda JP, Saldivar F, Wilson SR, et al. The worldwide environment of cardiovascular disease: prevalence, diagnosis, therapy, and policy issues. Journal of the American College of Cardiology. 2012;60(25):S1-S49. 8. US Department of Health and Human Services. Healthy People 2020. Available at: http://www. healthypeople.gov/2020/default.aspx. Accessed February 23, 2015. 9. Singh GK, Siahpush M. Widening socioeconomic inequalities in US life expectancy, 19802000. International Journal of Epidemiology. 2006;35(4):969-979. 10. Singh GK. Area deprivation and widening inequalities in US mortality, 1969-1998. American Journal of Public Health. 2003;93(7):1137-1143. 11. Singh GK, Siahpush M. Increasing inequalities in allcause and cardiovascular mortality among US adults aged 25-64 years by area socioeconomic status, 1969-1998. International Journal of Epidemiology. 2002; 31(3):600-613. 12. Kitagawa EM, Hauser PM. Differential Mortality in the United States: A Study in Socioeconomic Epidemiology. Cambridge, MA: Harvard University Press; 1973. 13. Singh GK, Siahpush M. All-cause and cause-specific mortality of immigrants and native born in the United States. American Journal of Public Health. 2001;91(3):392-399. 14. Davey Smith G, Neaton JD,Wentworth D, Stamler R, Stamler J. Socioeconomic differentials in mortality risk among men screened for the Multiple Risk Factor Intervention Trial: I-white men. American Journal of Public Health. 1996;86(4):486-496. 15. Davey Smith G, Wentworth D, Neaton JD, Stamler R, Stamler J. Socioeconomic differentials in mortality risk among men screened for the Multiple Risk Factor Intervention Trial: II-black men. American Journal of Public Health. 1996;86(4):497-504. 16. Blackwell DL, Lucas JW, Clarke TC. Summary health statistics for US adults: National Health Interview Survey, 2012. Vital and Health Statistics. 2014;10(260):1-161. 17. US Census Bureau. National Longitudinal Mortality Study, Reference Manual. Washington, DC: US © 2015 Global Health and Education Projects, Inc. Census Bureau; 2012. http://www.census.gov/did/ www/nlms/publications/reference.html 18. National Center for Health Statistics. National Vital Statistics System, Mortality Multiple Cause-of-Death Public Use Data File Documentation. Hyattsville, MD: US Department of Health and Human Services; 2014. http://www.cdc.gov/nchs/nvss/mortality_ public_use_data.htm. Accessed February 23, 2015. 19. Singh GK, Azuine RE, Siahpush M, Kogan MD. Allcause and cause-specific mortality among US youth: socioeconomic and rural-urban disparities and international patterns. Journal of Urban Health. 2013; 90(3):388-405. 20. Singh GK, Williams SD, Siahpush M, Mulhollen A. Socioeconomic, rural-urban, and racial inequalities in US cancer mortality: part 1−all cancers and lung cancer and Part II−colorectal, prostate, breast, and cervical cancers. Journal of Cancer Epidemiology. 2011;107497:1-27. doi:10.1155/2011/107497. 21. Rogot E, Sorlie PD, Johnson NJ, Schmitt C.A Mortality Study of 1.3 Million Persons by Demographic, Social, and Economic Factors, 1979-85 Follow-Up: U.S. National Longitudinal Mortality Study. Washington, DC: Public Health Service; NIH publication 92-3297; 1992. 22. Sorlie PD, Backlund E, Keller JB. US mortality by economic, demographic, and social characteristics: the National Longitudinal Mortality Study. American Journal of Public Health. 1995;85(7):949-956. 23. Bureau of Labor Statistics. Labor Force Statistics from the Current Population Survey. Washington, DC: United States Department of Labor; 2015. http://www.bls.gov/cps/home.htm. Accessed March 6, 2015. 24. US Census Bureau. The 2013 American Community Survey. Washington, DC: US Census Bureau; 2014. http://www.census.gov/acs/www/. Accessed March 6, 2015. 25. US Census Bureau. Income Data from the Current Population Survey. Washington, DC: US Census Bureau; 2015. http://www.census.gov/hhes/www/ income/data/historical/families/ . Accessed March 6, 2015. 26. Singh GK, Siahpush M, Hiatt RA,Timsina LR. Dramatic Increases in Obesity and Overweight Prevalence and Body Mass Index among Ethnic-Immigrant and Social Class Groups in the United States, 1976-2008. Journal of Community Health. 2011; 36(1):94-110. | www.mchandaids.org 117 Singh et al. 27. International Journal of MCH and AIDS (2015), Vol. 3, No. 2, 106-118 World Health Organization. World Health Statistics Report 2014. Geneva, Switzerland: WHO; 2014. 28. World Health Organization. Noncommunicable Diseases: Country Profiles 2014. Geneva, Switzerland: WHO; 2014. 29. Shaw M, Dorling D, Gordon D, Davey-Smith G. The Widening Gap: Health Inequalities and Policy in Britain. Bristol: Policy Press; 1999. 30. 31. 118 Department of Health. Tackling Health Inequalities: 10 Years On. London, UK: Health Inequalities Unit, Department of Health; 2009. Bajekal M, Scholes S, O’Flaherty M, Raine R, Norman P, Capewell S. Unequal trends in coronary heart disease mortality by socioeconomic circumstances, England 1982-2006: an analytical study. PLoS One. 2013;8(3):e59608. www.mchandaids.org | 32. Mackenbach JP, Bos V, Anderson O, Cardano M, Costa G, Harding S, et al. Widening socioeconomic inequalities in mortality in six Western European countries. International Journal of Epidemiology. 2003;32(5):830-837. 33. Mackenbach JP, Cavellaars AEJM, Kunst AE, Groenhof F. Socioeconomic inequalities in cardiovascular disease mortality: an international study. European Heart Journal. 2000; 21(14):11411151. 34. Organization for Economic Cooperation and Development (OECD). Health at a Glance 2011. OECD; 2011. 35. Wilkinson R, Marmot M (editors). Social Determinants of Health: The Solid Facts. Second Edition. Copenhagen, Denmark: World Health Organization, Regional Office for Europe; 2003. © 2015 Global Health and Education Projects, Inc.


© Copyright 2026