
EMBARGOED UNTIL 6:00AM ET, THURSDAY, MARCH 19, 2015
INCLUDING
Marc H. Morial, Mayor Muriel Bowser, Debra Martin Chase, Benjamin Crump,
Secretary Anthony Foxx, Mayor Karen Freeman-Wilson, Lily Eskelsen García, Mayor Kevin
Johnson, Alfred Liggins, La June Montgomery Tabron and “The Three Doctors”
EMBARGOED UNTIL 6:00AM ET,
THURSDAY, MARCH 19, 2015
A NATIONAL URBAN LEAGUE PUBLICATION
WWW.STATEOFBLACKAMERICA.ORG | #SAVEOURCITIES
CONTRIBUTORS
The Honorable Muriel Bowser
Debra Martin Chase
Benjamin Lloyd Crump, Esq.
The Honorable Anthony Foxx
The Honorable Karen Freeman-Wilson
Lily Eskelsen García
The Honorable Kevin Johnson
Alfred C. Liggins, III
Marc H. Morial
La June Montgomery Tabron
“The Three Doctors”
Dr. Sampson Davis, Dr. Rameck Hunt and Dr. George Jenkins
Valerie Rawlston Wilson, Ph.D.
A NATIONAL URBAN LEAGUE PUBLICATION
WWW.STATEOFBLACKAMERICA.ORG | #SAVEOURCITIES
Copyright © 2015, National Urban League
All rights reserved.
No part of this publication may be reproduced
or transmitted in any form or by any means,
electronic or mechanical, including photocopy,
recording or any information storage and
retrieval system now known or to be invented,
without permission in writing from the publisher,
except by a reviewer who wishes to quote brief
passages in connection with a review written for
inclusion in a magazine, newspaper or broadcast.
ISBN-978-1-4951-4602-2
The State of Black America® is a registered
trademark of the National Urban League.
2015 STATE OF BL ACK AMERICA ¨
SAVE OUR CITIES
Education, Jobs + Justice
PUBLISHER
Marc H. Morial
EDITORIAL DIRECTOR
Latraviette D. Smith-Wilson
EXECUTIVE EDITOR
Pamela Rucker Springs
SENIOR EDITOR
Shu-Fy H. Pongnon
CREATIVE DIRECTOR
Rhonda Spears Bell
DESIGN
Untuck Design
From the President’s Desk
8
Marc H. Morial
National Urban League
2015 Equality Index™
14INTRODUCTION TO THE
2015 EQUALITY INDEX
Valerie Rawlston Wilson, Ph.D.
29UNDERSTANDING THE
2015 EQUALITY INDEX
Valerie Rawlston Wilson, Ph.D.
35NATIONAL URBAN LEAGUE
2015 EQUALITY INDEX: BLACK–WHITE
IHS Global Insight
48
METRO AREA BLACK–WHITE
UNEMPLOYMENT EQUALITY RANKINGS
50METRO AREA BLACK–WHITE
INCOME EQUALITY RANKINGS
52NATIONAL URBAN LEAGUE
2015 EQUALITY INDEX: HISPANIC–WHITE
IHS Global Insight
64
METRO AREA HISPANIC–WHITE
UNEMPLOYMENT EQUALITY RANKINGS
66METRO AREA HISPANIC–WHITE
INCOME EQUALITY RANKINGS
Featured Equality Index
68NATIONAL URBAN LEAGUE 2015
STATE EDUCATION EQUALITY INDEX ™
IHS Global Insight
Essay 1
Essay 7
108CIVIL RIGHTS…AND LEFTS:
BUILDING A TRANSPORTATION
SYSTEM FOR ALL
U.S. Transportation Secretary
Anthony Foxx
134CREATING THE CHANGE
THE WORLD NEEDS TO SEE
Debra Martin Chase
Essay 2
112 ANSWERING THE CALL TO ACTION
Mayor Muriel Bowser
139I WANNA BE LIKE…EDUCATION, PACTS,
AND THE POTENTIAL OF YOUTH
“The Three Doctors”—Dr. Sampson Davis,
Dr. Rameck Hunt and Dr. George Jenkins
Essay 3
Essay 9
116REAL TALK: DEMONSTRATE THE
VALUE OF BLACK LIVES THROUGH
QUALITY EDUCATION
Mayor Kevin M. Johnson
143SUCCESSFUL BLACK ENTREPRENEURS
SHOULD NOT BE AN ANOMALY
Alfred C. Liggins, III
Essay 4
121A NEW DAY, NEW LEGACY FOR
GARY, INDIANA
Mayor Karen Freeman-Wilson
Essay 8
Essay 10
147EDUCATION’S OPPORTUNITY DASHBOARD
Lily Eskelsen García
Appendices
Essay 5
151
125IT’S TIME TO PASS THE GRAND
JURY REFORM ACT OF 2014
Benjamin Lloyd Crump, Esq.
161 INDEX OF AUTHORS + ARTICLES
Essay 6
130CLEARING A PATHWAY TO
PROGRESS FOR ALL CHILDREN
La June Montgomery Tabron
ABOUT THE AUTHORS
180NATIONAL URBAN LEAGUE
BOARD OF TRUSTEES
181NATIONAL URBAN LEAGUE
EXECUTIVE STAFF
182 NATIONAL URBAN LEAGUE AFFILIATES
From the President’s Desk + 8
2015 STATE OF BLACK AMERICA©
SAVE OUR CITIES
NATIONAL URBAN LEAGUE
From the President’s Desk + 9
Few times in a nation’s history is the
conscience of its citizens shocked and
awakened across racial, economic,
generational and even ideological
lines. These are the times when the
collective consciousness of a people also
unapologetically screams that it’s time
for change—and that it must start today.
That time is now. 2014 was indeed a catalytic year that was propelled
by cataclysmic circumstances—little accountability for law enforcement
responsible for killing unarmed Black men, teenagers and children;
a continual assault on voting rights; widening economic inequality
gaps; and an increasingly partisan education debate far more rooted in
political agendas than in putting our children first.
The theme of the 2015 State of Black America® “Save Our Cities:
Education, Jobs + Justice” conveys the urgency of focus around each
of these areas and their interconnectedness in our ongoing quest for
full equality in America.
So, what is the state of Black America in 2015? In short, on many
fronts, Black America remains in crisis—and we see justice challenged
at every turn.
The world watched as non-indictments of the police officers responsible
for the deaths of unarmed Black males including Eric Garner, Michael
Brown and John Crawford signaled that police accountability for taking
Black lives was reaching a modern-day low—and that the widespread
and dangerous mistrust between law enforcement and too many
communities of color in America was reaching a new high. Perhaps
nowhere was this more evident than in Cleveland, OH, where police
shot and killed 12-year-old Tamir Rice at point-blank range within two
seconds of pulling alongside him in a park, where he was playing with a
toy gun. A U.S. Justice Department report released in December 2014
found a pattern of excessive force by the Cleveland Police Department,
2015 STATE OF BLACK AMERICA¨
SAVE OUR CITIES
NATIONAL URBAN LEAGUE
From the President’s Desk + 10
including hostility from police toward residents
Justice was also challenged in 2014 with an
and lack of accountability for misconduct. The
assault on voting rights following the Supreme
state’s attorney general had also found systemic
Court’s 2013 decision in the Shelby County
failures in the department’s communication
case. This decision struck down preclearance
and supervision.
provisions of the Voting Rights Act, which
The protests—on the streets, in social media and
across cities—that we witnessed as these nonindictments and new cases were announced was
new to a generation, but not to the nation. As
the National Urban League released our 10-Point
Plan for Police Reform and Accountability,
millions of Americans—young, old, Black, white,
Brown, Christian, Muslim, Hindu and beyond—
joined us in raising their voices, as we have
together many times throughout our nation’s
required states with a history of race-based
voter suppression to have changes in their
election laws, including reapportionment and
polling location changes, approved by the
United States Justice Department before they
took effect. In the aftermath, we’ve seen states
across the nation move aggressively to enact
new voter suppression laws aimed at making
registration and voting more difficult for people
of color.
history, because difficult circumstances often
In 1964, the Supreme Court said, “No right is
present a once-in-a-lifetime opportunity to
more precious in a free country than that of
effect historic change. The time was then—and
having a voice in the election of those who
the time continues now.
make the laws under which, as good citizens, we
As 2015 opened, we saw Brooklyn, NY
District Attorney Kenneth Thompson bring an
must live. Other rights, even the most basic, are
illusory if the right to vote is undermined.”
indictment against the police officer responsible
Fifty years after President Lyndon Johnson
for killing Akai Gurley in the stairwell of his
signed the Voting Rights Act, this basic principle
apartment building. In this case, and as we hope
stands. Organizations like ours will continue to
will continue with others, there is a renewed
fight to protect democracy via the protection of
sense of fairness in our justice system and an
our voting rights and pushing Congress to move
example of the process working.
the bipartisan Voting Rights Amendment Act of
We also heard FBI Director James Comey,
in his unprecedented speech “Hard Truths:
Law Enforcement and Race,” acknowledge
unconscious bias as an issue impacting the
2014 forward, but the battle is not ours alone.
Individually and collectively, we must take the
first step in ensuring our voices are heard by
ensuring our votes are cast in every election.
actions of officers and the relationship between
Justice also continues to be challenged on
law enforcement and communities of color.
the jobs and economic front. The start of 2015
There are many “hard truths” that we need to
saw the most sustained period of job creation
confront as we work to ensure the safety of
this century. However, the dark cloud inside
all of our communities and to improve police–
this silver lining is that too many people are
community relations. It will be a difficult yet
still being left behind. Black unemployment is
critical conversation that will require, as Director
twice that of white unemployment. Wages are
Comey observed, that we “speak the truth to
stagnant. Many people who are working are
ourselves” about the challenges on both sides—
simply not earning what they need or should
in law enforcement and in our communities.
earn to make ends meet. Whether one calls
2015 STATE OF BLACK AMERICA¨
SAVE OUR CITIES
NATIONAL URBAN LEAGUE
From the President’s Desk + 11
it income inequality, upward social mobility,
support services, they need to chart a path to
decline of the middle class, eliminating poverty
a better future. The National Urban League and
among working people or something different,
the advocacy work of our Affiliates on the Urban
it is one of the great challenges facing post-
Jobs Act—co-sponsored by Senator Kirsten
recession America.
Gillibrand of New York and Rep. Chaka Fattah
We know that opportunity is not equal when
affluent families have significant resources
for things like better nutrition, health care
of Pennsylvania—were the impetus for many of
the local youth provisions that are now a part of
the WIOA.
and early childhood education, while many
other households have very little, if any,
resources to spare for these purposes. We
ECONOMIC INEQUALITY
know that low-income families face an unfair
HAS BEEN CALLED THE
disadvantage when public funding for safety
BIGGEST THREAT FACING
net programs and public education is cut.
AMERICA. AS SUCH, IT IS
We also know that the rising cost of college,
the slowdown in business formation for
AN ISSUE THAT WE ALL—
low-income Americans and the huge gap in
GOVERNMENT, PRIVATE
inheritances between the top and bottom
SECTOR AND NGOS—HAVE
rungs of the economic ladder directly impact
economic prosperity and mobility.
I’ve always believed that when we know better,
A ROLE IN HELPING TO
ALLEVIATE.
we should do better. So, how are we going to
create jobs that pay living wages, afford human
dignity and respect and provide the ability for
one to be economically self-sufficient?
We don’t have all of the answers, but we know
the power of action—and we have a model that
works. Through the National Urban League’s 50city, $100 million Jobs Rebuild America initiative
and our steadfast commitment to workforce
development, we have made it our business to
train and prepare people for good jobs that pay
good wages. We have put more than 160,000
people to work during my tenure here alone.
We have also fought victoriously for the passage
of bipartisan jobs bills like the Workforce
Innovation and Opportunity Act (WIOA), which
is allowing millions of unemployed and underemployed workers and urban youth of color
to receive the job and skills training, as well as
2015 STATE OF BLACK AMERICA¨
SAVE OUR CITIES
We’ve also seen individual states pick up the ball
and run when Congress has fumbled. Stalled by
congressional obfuscation and obstruction of
a federal minimum wage increase, states have
taken this fight into their own hands. Refusing
to wait for Congress to act, as of the beginning
of 2015, almost 30 states and the District of
Columbia have minimum wages above the
federal minimum wage.
But no one should be let off of the proverbial
hook. Economic inequality has been called the
biggest threat facing America. As such, it is an
issue that we all—government, private sector
and NGOs—have a role in helping to alleviate.
Lastly, justice has been challenged regarding
education—undoubtedly one of the most
pressing civil rights issues of our time.
Disparities remain in both the K–12 and higher
NATIONAL URBAN LEAGUE
From the President’s Desk + 12
education system. Sixty years after the
Urban League Movement took an aggressive
landmark ruling in Brown v. Board of Education
public posture in support of higher education
ended segregation in America’s public schools,
standards (widely referred to as Common Core
separate and unequal is still a pervasive reality.
State Standards) and improved accountability
While de jure, or legal, segregation has been
combined with equitable resources and
abolished, de facto, or the actual practice of
implementation. If, according to Brown,
segregation, is greater now than it was 40
education “is a right which must be made
years ago.
available to all on equal terms,” then we must
Black and Brown students are less likely to share
classrooms with white students. We also see
separate and unequal levels of expectations
and resources in our schools that continue to
break down along economic, and thus largely
make it a priority to ensure that all children—
no matter their race, where they live or their
parents’ income—receive a high-quality
education. (To learn more about the campaign,
visit www.putourchildren1st.org.)
color, lines. The Organization for Economic
Cooperation and Development (OECD) found
that the U.S. is one of few advanced nations
MORE MUST BE DONE
where more educational resources are provided
TO ENSURE THAT ALL
to schools with richer students than to those
DISTRICTS ARE HELD TO
serving poor children.
HIGH STANDARDS, THAT
Earlier this year, The Economist appropriately
THOSE STANDARDS ARE
spoke to the education crisis facing our nation
CONSISTENT ACROSS
with its cover story “America’s New Aristocracy:
Education and the Inheritance of Privilege.”
THE COUNTRY, AND THAT
The achievement levels of Black and Brown
SCHOOLS, TEACHERS AND
students, especially those burdened with the
STUDENTS IN ALL SCHOOLS
economic and social disadvantages of poverty,
are falling further behind their white peers. This
AND NEIGHBORHOODS
is a recipe for economic and social disaster,
HAVE THE NECESSARY
but it can be avoided if we make closing the
RESOURCES TO SUCCEED.
achievement gap a national priority, guided by a
commitment to a common set of principles.
More must be done to ensure that all districts
are held to high standards, that those
standards are consistent across the country,
and that schools, teachers and students in all
schools and neighborhoods have the necessary
resources to succeed.
In 2015, our stake in the ground around
education continues to deepen, and our efforts
to ensure that all children have a fair chance to
achieve their potential and be successful are
being expanded. For the first time in the history
of the State of Black America® report, in addition
to the National Equality Index™ and Metro
In 2014, via the National Urban League’s
Equality Index Rankings, we have included a
360-degree Put Our Children 1st television,
50-state Education Equality Index and ranking
radio, digital and social media platform, the
of Black–White and Hispanic–White equality in
educational achievement.
2015 STATE OF BLACK AMERICA¨
SAVE OUR CITIES
NATIONAL URBAN LEAGUE
From the President’s Desk + 13
While we observe monumental celebrations,
including the 50th anniversaries of the heroes
and heroines of Selma and of the signing of the
Voting Rights Act, on far too many fronts, there
is significant work to do. While we celebrate
the tremendous progress and transformation
of our nation, we have a continuing need to
be vigilant, to persevere and to protect past
gains. We must not allow the forces of division,
intolerance and right-wing extremism to turn
back the hands of time.
We are a nation that has to confront today’s
challenges with a clear understanding of our
past. This is our work, and we will succeed
because we are resilient—buoyed by our
victories of yesterday, our progress of today and
our hopes for tomorrow.
The time is now, and as long as justice is
challenged on any front, we will keep pushing
on every front. +
2015 STATE OF BLACK AMERICA¨
SAVE OUR CITIES
NATIONAL URBAN LEAGUE
Introduction to the 2015 Equality Index™ + 14
2015 STATE OF BLACK AMERICA©
SAVE OUR CITIES
NATIONAL URBAN LEAGUE
Introduction to the 2015 Equality Index™ + 15
President Obama opened his January
2015 State of the Union address touting
a lower unemployment rate than before
the financial crisis, more kids graduating
than ever before and more people
insured than ever before. While each of
these milestones is reflected in the 2015
National Urban League Equality Index,
it also tells a less popular, though all
too familiar, story of persistent racial
disparities in American life.
As the National Urban League continues to press the case for closing
the divide in economic opportunity, education, health, social justice and
civic engagement, the 2015 National Urban League Equality Index™ is the
eleventh edition of this critical quantitative tool for tracking Black–White
racial equality in America and the sixth edition of the Hispanic–White
Index. This year’s Equality Index also includes the second installment of
rankings of Black–White and Hispanic–White unemployment and income
equality for about 70 metropolitan statistical areas (“metro areas”
or “metros”) in America.1 New to the 2015 Equality Index is a special
feature on state-level racial and ethnic disparities in K–12 education that
documents the extent of Black–White and Hispanic–White achievement
gaps in states across the country. The State Education Index also
includes supporting data on some of the factors that contribute to
narrowing or widening these gaps.
OVERVIEW OF 2015 NATIONAL URBAN LEAGUE
EQUALIT Y INDEX
The 2015 Equality Index™ of Black America stands at 72.2 percent
compared to a revised 2014 index of 71.5 percent. Revisions to the
previous year’s index are done for greater comparability across years
and reflect data points that have been corrected, removed from the
current year’s index or re-weighted so that less emphasis is placed on
older data. The largest increases in this year’s index were in the areas
2015 STATE OF BLACK AMERICA¨
SAVE OUR CITIES
NATIONAL URBAN LEAGUE
Introduction to the 2015 Equality Index™ + 16
of social justice (from 56.9% to 60.6%) and
health (from 78.2% to 79.8%) with only a small
increase in economics (from 55.4% to 55.8%).
The education (from 76.7% to 76.1%) and civic
engagement (from 104.7% to 104%) indexes
both declined slightly.
EQUALITY INDEX OF BLACK AMERICA
CATEGORY
EQUALITY INDEX
REVISED 2014
2015
71.5%
72.2%
Economics
55.4%
55.8%
Health
78.2%
79.8%
Education
76.7%
76.1%
The increase in the social justice index was the
Social Justice
56.9%
60.6%
result of fewer Blacks being victims of violent
Civic Engagement
104.7%
104.0%
crimes and fewer Black high school students
carrying weapons, while at the same time, the
EQUALITY INDEX OF HISPANIC AMERICA
rates for white high school students increased.
The increase in the health index resulted from
CATEGORY
increased health care coverage for Blacks since
EQUALITY INDEX
REVISED 2014
2015
75.8%
77.7%
the Affordable Care Act went into effect and a
Economics
60.6%
61.7%
decline in binge drinking among Blacks, while
Health
102.4%
106.9%
the rates for whites continued to climb.
The small increase in the economics index was the
Education
73.2%
74.6%
Social Justice
66.1%
72.7%
Civic Engagement
71.2%
71.0%
result of improvements in the income, poverty and
home loan denial gaps. The unemployment and
homeownership gaps widened.
METROPOLITAN AREA RANKINGS OF
UNEMPLOYMENT EQUALIT Y
The 2015 Equality Index of Hispanic America
Last year, the National Urban League introduced
stands at 77.7 percent compared to a revised
rankings of unemployment and income equality
2014 index of 75.8 percent. The increase
between whites, Blacks and Latinos in the
in the Hispanic–White Index resulted from
nation’s largest metropolitan areas. Comparison
improvements in all categories, except for civic
of the 2014 and 2015 Metro Unemployment
engagement. The greatest gains were in social
Equality Index rankings reveals that there was
justice (from 66.1% to 72.7%) and health (from
significant shuffling of metros at the top of
102.4% to 106.9%), followed by education (from
the list. 2 In the Black–White rankings and the
73.2% to 74.6%) and economics (from 60.6%
Hispanic–White rankings, only three of the
to 61.7%). The civic engagement index declined
cities in last year’s top 10 metros were also in
modestly from 71.2 percent to 71.0 percent.
this year’s top 10. On the other hand, many of
the metros at the bottom of last year’s rankings
The large increase in the social justice index
remained at the bottom of this year’s rankings
came from a lower Hispanic incarceration
as well.
rate, and fewer Hispanic high school students
These patterns seem to represent differences
carrying firearms.
in the pace of recovery across the country as
The increase in the health index came from
metros at the top of the list averaged larger
lower death rates among Hispanics and
improvements in unemployment rates than
increased health care coverage.
those at the bottom of the list. The full list of
Black–White and Hispanic–White 2015 Metro
2015 STATE OF BLACK AMERICA¨
SAVE OUR CITIES
NATIONAL URBAN LEAGUE
Introduction to the 2015 Equality Index™ + 17
TABLE 1: M ETRO HIGHS AND LOWS: BLACK–WHITE UNEMPLOYMENT EQUALITY
AND UNEMPLOYMENT RATES
HIGHEST AND LOWEST
BLACK-WHITE
UNEMPLOYMENT
EQUALITY INDEX ª
(Index in Parentheses)
LOWEST AND
HIGHEST BLACK
UNEMPLOYMENT
RATES
Black
Unemployment
Rate
* 2013 Unemployment Rate
LOWEST AND
HIGHEST WHITE
UNEMPLOYMENT
RATES
White
Unemployment
Rate
1
Providence–Warwick,
RI–MA (65.4%)
Omaha–Council Bluffs,
NE–IA
7.5%
Omaha–Council Bluffs,
NE–IA
3.8%
2
Phoenix–Mesa–Scottsdale,
AZ (64.0%)
Austin–Round Rock, TX
9.2%
Jackson, MS
3.9%
3
Austin–Round Rock, TX
(63.0%)
Oklahoma City, OK
9.9%
San Antonio–New
Braunfels, TX
4.5%
4
Riverside–San Bernardino–
Ontario, CA (59.0%)
Phoenix–Mesa–Scottsdale,
AZ
10.0%
Washington–
Arlington–Alexandria,
DC–VA–MD–WV
4.5%
5
Greensboro–High Point,
NC (58.8%)
Nashville–Davidson–
Murfreesboro–Franklin, TN
10.8%
Minneapolis–St. Paul–
Bloomington, MN–WI
4.5%
66
Minneapolis–St.
Paul–Bloomington, MN–WI
(31.7%)
Cleveland–Elyria, OH
20.4%
Augusta–Richmond
County, GA–SC
8.7%
67
Grand Rapids–Wyoming,
MI* (31.3%)
Las Vegas–Henderson–
Paradise, NV
21.1%
Lakeland–Winter Haven, FL
8.7%
68
Cleveland–Elyria, OH
(29.4%)
Sacramento–Roseville–
Arden–Arcade, CA
21.4%
Las Vegas–Henderson–
Paradise, NV
9.6%
69
Milwaukee–Waukesha–
West Allis, WI (29.0%)
Chicago–Naperville–Elgin,
IL–IN–WI
21.4%
Sacramento–Roseville–
Arden–Arcade, CA
10.2%
70
Jackson, MS (27.9%)
Toledo, OH
22.6%
Riverside–San Bernardino–
Ontario, CA
10.8%
TABLE 2: M
ETRO HIGHS AND LOWS: HISPANIC–WHITE UNEMPLOYMENT EQUALITY
AND UNEMPLOYMENT RATES
HIGHEST AND LOWEST
HISPANIC-WHITE
UNEMPLOYMENT
EQUALITY INDEX ª
(Index in Parentheses)
LOWEST AND
HIGHEST HISPANIC
UNEMPLOYMENT
RATES
Hispanic
Unemployment
Rate
LOWEST AND
HIGHEST WHITE
UNEMPLOYMENT
RATES
White
Unemployment
Rate
1
Deltona–Daytona
Beach–Ormond Beach, FL
(148.3%)
New Orleans–Metairie, LA
5.3%
Urban Honolulu, HI
3.7%
2
Indianapolis–Carmel–
Anderson, IN (126.4%)
Indianapolis–Carmel–
Anderson, IN
5.3%
Omaha–Council Bluffs,
NE–IA
3.8%
3
Lakeland–Winter Haven,
FL (119.2%)
Nashville–Davidson–
Murfreesboro–Franklin, TN
5.6%
Minneapolis–St. Paul–
Bloomington, MN–WI
4.5%
4
New Orleans–Metairie, LA
(115.1%)
Oklahoma City, OK
5.7%
San Antonio–New
Braunfels, TX
4.5%
5
Nashville–Davidson–
Murfreesboro–Franklin, TN
(107.1%)
Deltona–Daytona Beach–
Ormond Beach, FL
5.8%
Washington–
Arlington–Alexandria,
DC–VA–MD–WV
4.5%
68
Allentown–Bethlehem–
Easton, PA–NJ (44.7%)
Rochester, NY
16.2%
Bakersfield, CA
9.9%
69
Omaha–Council Bluffs,
NE–IA (44.2%)
Providence–Warwick,
RI–MA
16.5%
Sacramento–Roseville–
Arden–Arcade, CA
10.2%
70
Springfield, MA (41.8%)
Hartford–West Hartford–
East Hartford, CT
17.3%
Riverside–San Bernardino–
Ontario, CA
10.8%
17.7%
Stockton–Lodi, CA
11.5%
Modesto, CA
12.0%
71
Rochester, NY (38.3%)
Springfield, MA
72
Hartford–West Hartford–
East Hartford, CT (38.2%)
Modesto, CA
2015 STATE OF BLACK AMERICA¨
SAVE OUR CITIES
20.8%
NATIONAL URBAN LEAGUE
Introduction to the 2015 Equality Index™ + 18
Unemployment Equality Index rankings,
there were four other metros with a Hispanic–
complete with a comparison to 2014, can be
White unemployment index greater than 100,
found in the tables at the end of this section
indicating that the Hispanic unemployment rate
of the report.
was lower than the white unemployment rate—
BLACK–WHITE
UNEMPLOYMENT EQUALIT Y
With an index of 65 percent, the smallest
Black–White unemployment gap was in the
Providence–Warwick, RI–MA metro area, where
the Black unemployment rate was 13 percent
Indianapolis–Carmel–Anderson, IN; Lakeland–
Winter Haven, FL; New Orleans–Metairie, LA and
Nashville–Davidson–Murfreesboro–Franklin, TN.
Last year’s #1—Memphis, TN—fell to #33 this
year as the Hispanic unemployment rate more
than doubled (from 3.8% to 8.2%).
and the white rate was 8.5 percent. Last year’s
Since unemployment disparities between
most equal metro—Augusta–Richmond County,
Latinos and whites have narrowed more than
GA–SC—fell to #13 this year as the Black
those between Blacks and whites during the
unemployment rate increased from 13.3 percent
recovery, 3 lower unemployment rates and
to 16.5 percent and the white unemployment
greater unemployment equality seemed to
rate was essentially unchanged.
be more closely linked in the Hispanic-White
Similar to the 2014 rankings, the 2015
rankings reveal that metros with the greatest
unemployment equality are not necessarily the
metros with the best employment outcomes
for either group. The metro with the lowest
unemployment rate for both Blacks and whites
(7.5% and 3.8%, respectively) was Omaha–
Council Bluffs, NE–IA, #16 in the equality ranking.
The metro with the highest Black unemployment
rate (22.6%) was Toledo, OH, #60 in the equality
rankings. The metro with the lowest Hispanic
unemployment rate (5.3%) was Indianapolis–
Carmel–Anderson, IN, #2 in the ranking. The
metro with the highest Hispanic unemployment
rate (20.8%) was Modesto, CA at #59 in the
ranking. The five highest and five lowest metro
areas in terms of Hispanic–White unemployment
equality, as well as Hispanic and white
unemployment rates are presented in Table 2.
ranking. Riverside–San Bernardino–Ontario, CA
METROPOLITAN AREA RANKINGS OF
INCOME EQUALIT Y
registered the highest white unemployment rate
Unlike the Black–White unemployment equality
(10.8%) and came in at #4 in the equality ranking.
rankings, the Black–White Income Equality Index
The five highest and five lowest metro areas in
rankings were relatively stable between 2014
terms of Black–White unemployment equality, as
and 2015. Six of last year’s top 10 metros were
well as Black and white unemployment rates are
again in the top 10 this year. On the other hand,
presented in Table 1.
the Hispanic–White rankings were less stable
HISPANIC–WHITE
UNEMPLOYMENT EQUALIT Y
With an index of 148 percent, Deltona–Daytona
Beach–Ormond Beach, FL topped the Hispanic–
White metro unemployment rankings this year.
Deltona was up from #29 last year due to a
large drop in the Hispanic unemployment rate
(from 9.4% to 5.8%). In addition to Deltona,
2015 STATE OF BLACK AMERICA¨
SAVE OUR CITIES
with only four of last year’s top 10 appearing at
the top of this year’s list. Nationally, Hispanic
households experienced the largest increase
in median household income between 2012
and 2013.4 The extent to which this growth
was concentrated in certain metros could help
explain why there may have been more shuffling
in the Hispanic–White ranking. The full list of
Black–White and Hispanic–White 2015 Metro
NATIONAL URBAN LEAGUE
Introduction to the 2015 Equality Index™ + 19
TABLE 3: M
ETRO HIGHS AND LOWS: BLACK–WHITE INCOME EQUALITY
AND MEDIAN HOUSEHOLD INCOME
HIGHEST AND LOWEST
BLACK-WHITE INCOME
EQUALITY INDEX ª
(Index in Parentheses)
HIGHEST AND
LOWEST BLACK
MEDIAN HOUSEHOLD
INCOME
Black Median
Household
Income
* Median Household Income, 2013 Dollars
HIGHEST AND
LOWEST WHITE
MEDIAN HOUSEHOLD
INCOME
White Median
Household
Income
1
Riverside–San Bernardino–
Ontario, CA (71%)
Washington–
Arlington–Alexandria,
DC–VA–MD–WV
$64,663
Washington–
Arlington–Alexandria,
DC–VA–MD–WV
$108,254
2
Nashville–Davidson–
Murfreesboro–Franklin,
TN (67%)
Boston–Cambridge–
Newton, MA–NH
$48,326
Bridgeport–Stamford–
Norwalk, CT
$98,697
3
San Diego–Carlsbad, CA
(66%)
Baltimore–Columbia–
Towson, MD
$47,866
San Francisco–Oakland–
Hayward, CA
$95,285
4
San Antonio–New
Braunfels, TX (65%)
Hartford–West Hartford–
East Hartford, CT
$47,491
New York–Newark–Jersey
City, NY–NJ–PA
$83,457
5
Lakeland–Winter Haven,
FL (64%)
San Diego–Carlsbad, CA
$46,524
Baltimore–Columbia–
Towson, MD
$80,573
66
Minneapolis–St.
Paul–Bloomington, MN–WI
(44%)
Albany–Schenectady–Troy,
NY*
$26,714
Greenville–Anderson–
Mauldin, SC
$50,315
67
Toledo, OH (44%)
Cleveland–Elyria, OH
$26,627
Tampa–St. Petersburg–
Clearwater, FL
$49,974
68
Bridgeport–Stamford–
Norwalk, CT (43%)
Buffalo–Cheektowaga–
Niagara Falls, NY
$26,136
Winston–Salem, NC
$49,451
69
Albany–Schenectady–Troy,
NY* (42%)
Grand Rapids–Wyoming, MI
$25,495
Toledo, OH
$49,333
70
San Francisco–Oakland–
Hayward, CA (42%)
Toledo, OH
$21,699
Lakeland–Winter Haven, FL
$46,512
TABLE 4: M
ETRO HIGHS AND LOWS: HISPANIC–WHITE INCOME EQUALITY
AND MEDIAN HOUSEHOLD INCOME
* Median Household Income, 2013 Dollars
HIGHEST AND LOWEST
HISPANIC-WHITE INCOME
EQUALITY INDEX ª
(Index in Parentheses)
HIGHEST AND
LOWEST HISPANIC
MEDIAN HOUSEHOLD
INCOME
Hispanic Median
Household
Income
HIGHEST AND
LOWEST WHITE
MEDIAN HOUSEHOLD
INCOME
White Median
Household
Income
1
Deltona–Daytona Beach–
Ormond Beach, FL (97%)
Washington–
Arlington–Alexandria,
DC–VA–MD–WV
$65,736
Washington–
Arlington–Alexandria,
DC–VA–MD–WV
$108,254
2
McAllen–Edinburg–
Mission, TX* (91%)
Urban Honolulu, HI
$60,962
San Jose–Sunnyvale–Santa
Clara, CA
$100,281
3
Boise City, ID (90%)
Baltimore–Columbia–
Towson, MD
$59,939
Bridgeport–Stamford–
Norwalk, CT
$98,697
4
Jacksonville, FL (87%)
San Jose–Sunnyvale–Santa
Clara, CA
$59,150
San Francisco–Oakland–
Hayward, CA
$95,285
5
St. Louis, MO–IL (83%)
San Francisco–Oakland–
Hayward, CA
$56,269
Oxnard–Thousand Oaks–
Ventura, CA
$86,786
68
Providence–Warwick,
RI–MA (47%)
Worcester, MA–CT
$29,216
Tampa–St. Petersburg–
Clearwater, FL
$49,974
69
Rochester, NY (46%)
Providence–Warwick,
RI–MA
$28,622
Cape Coral–Fort Myers, FL
$49,633
70
Worcester, MA–CT (44%)
Indianapolis–Carmel–
Anderson, IN
$27,293
Lakeland–Winter Haven, FL
$46,512
71
Springfield, MA (41%)
Rochester, NY
$26,315
Deltona–Daytona Beach–
Ormond Beach, FL
$42,473
72
Hartford–West Hartford–
East Hartford, CT (40%)
Springfield, MA
$24,781
McAllen–Edinburg–Mission,
TX*
$35,185
2015 STATE OF BLACK AMERICA¨
SAVE OUR CITIES
NATIONAL URBAN LEAGUE
Introduction to the 2015 Equality Index™ + 20
Income Equality Index rankings, complete with a
percent loss for whites. In Deltona, the median
comparison to 2014, can be found in the tables
Hispanic household had 97 cents for every dollar
at the end of this section of the report.
of median white household income. Hispanic and
BL ACK–WHITE INCOME EQUALIT Y
Riverside–San Bernardino–Ontario, CA
remained at the top of the Black–White Income
Equality ranking this year, with the median Black
household having 71 cents for every dollar of
median white household income. In Riverside,
Black household income fell five percent yearover-year while whites saw an increase of four
percent. Black and white incomes were least
equal in San Francisco–Oakland–Hayward, CA
where the gap was 42 cents on the dollar. In
San Francisco, the median household income
for Blacks was $39,902 (down three percent
from last year’s Index) compared to $95,285 for
whites (up four percent from last year’s Index).
white incomes were least equal in Hartford–West
Hartford–East Hartford, CT where the gap was
40 cents on the dollar. In Hartford, the median
household income for Latinos was $30,453 (down
six percent from the 2014 index), compared to
$75,475 for whites (down one percent).
As was the case for Blacks and whites, the
highest median Hispanic household income
was in Washington–Arlington–Alexandria,
DC–VA–MD–WV ($65,736), #47 in the equality
ranking. The lowest median Hispanic household
income was in Springfield, MA ($24,781), #71 in
the equality ranking. The five highest and five
lowest metro areas in terms of Hispanic–White
income equality, as well as Hispanic and white
The highest median household income for both
median household income are presented in
Blacks ($64,663) and whites ($108,254) was in
Table 4.
Washington–Arlington–Alexandria, DC–VA–MD–
WV, #21 in the ranking. The lowest median Black
household income ($21,699) was in Toledo, OH
(#67 in the ranking). Even though Toledo had the
second lowest median white household income,
white household income in Toledo was still more
than double Black household income. Toledo, OH
also had the highest Black unemployment rate,
STATE EDUCATION INDEX
New to this year’s Equality Index is a statelevel education index. This portion of the index
features achievement indicators based on 2013
National Assessment of Educational Progress
(NAEP) reading and math test scores for grades
4 and 8 and 2009–2010 high school graduation
which would at least partly account for the low
rates. These indicators are supported by
income of Black households. The lowest median
additional data on some of the factors that can
white household income for whites ($46,512) was
help to narrow these gaps, including teacher
in Lakeland–Winter Haven, FL, #5 in the ranking.
quality, pre-school and course enrollment, and
The five highest and five lowest metro areas in
student status and risk factors. The full set of
terms of Black–White income equality, as well as
indicators is presented in the State Education
Black and white median household income are
Index tables for all 50 states and the District
presented in Table 3.
of Columbia, located at the end of this section.
HISPANIC–WHITE INCOME EQUALIT Y
For Latinos, median household incomes were
closest to those of whites in Deltona–Daytona
Beach–Ormond Beach, FL, which was up from
#4 in last year’s ranking as a result of seven
percent income growth for Latinos and a 10
2015 STATE OF BLACK AMERICA¨
SAVE OUR CITIES
Figures depicting Black–White and Hispanic–
White reading and math proficiency gaps as well
as high school graduation gaps are presented
throughout this section of the report. These
figures provide a simple way of summarizing
and comparing achievement gaps across states.
NATIONAL URBAN LEAGUE
Introduction to the 2015 Equality Index™ + 21
FIGURE A: BLACK–WHITE READING PROFICIENCY EQUALITY INDEX ª, GRADES 4 AND 8
0%
WA
54%
45%
WV
52%
92%
DE
46%
45%
VA
45%
37%
GA
45%
40%
NY
45%
39%
SD
45%
0%
AZ
45%
38%
MN
45%
35%
AK
44%
37%
47%
NJ
43%
PA
42%
35%
NC
42%
38%
FL
41%
45%
IN
41%
28%
TX
40%
35%
OK
39%
40%
KS
39%
32%
KY
39%
38%
AR
39%
33%
TN
38%
43%
RI
38%
41%
CO
37%
27%
AL
37%
28%
MA
37%
42%
NE
37%
38%
MD
36%
47%
NV
36%
41%
IA
35%
38%
SC
34%
36%
MI
33%
31%
MO
33%
32%
LA
33%
35%
MS
32%
26%
30%
0%
IL
30%
30%
ME
29%
0%
CT
28%
40%
CA
28%
33%
WI
28%
22%
OH
26%
38%
DC
19%
16%
0%
OR
0%
58%
10
36%
NH
%
63%
80
62%
NM
%
64%
60
59%
ND
%
G8
81%
40
G4
HI
20
STATE
%
■ Grade 4 ■ Grade 8
Index Values
2015 STATE OF BLACK AMERICA¨
SAVE OUR CITIES
NATIONAL URBAN LEAGUE
Introduction to the 2015 Equality Index™ + 22
READING PROFICIENCY GAPS
MATH PROFICIENCY GAPS
Reading proficiency gaps (measured by the
Math proficiency gaps were measured in the
Index) represent the percentage of Black (or
same way as reading efficiency gaps. In this
Latino) students testing at or above proficient
case, the index measures the percentage of
for their grade level in reading relative to the
Black (or Latino) students testing at or above
percentage of white students testing at or above
proficient for their grade level in math relative
proficient. As shown in Figures A and B, the
to the percentage of white students testing at
largest grade 4 reading proficiency gaps were in
or above proficient. As shown in Figure C, the
the District of Columbia (DC) with a Black–White
largest grade 4 Black–White math proficiency
index of 19 percent and a Hispanic–White index
gap was in Wisconsin with an index of 21 percent
of 30 percent. Among DC 4th graders, 14.7
and the smallest gap was in West Virginia with
percent of Blacks, 76.6 percent of whites and
an index of 69 percent. Among Wisconsin 4th
22.8 percent of Hispanic students tested at or
graders, 12.1 percent of Black students and 56.9
above proficient in reading (see State Education
percent of white students tested at or above
Equality Index table).
proficient in math (see State Education Equality
The smallest Black–White reading proficiency
gap was in Hawaii, where the index was 81
percent. Among Hawaii 4th graders, 37.1 percent
of Blacks and 45.7 percent of whites tested
at or above proficient in reading (see State
Education Equality Index table). With an index of
75 percent, the smallest Hispanic–White reading
Index table). Though the gap between white and
Black 4th graders in West Virginia was smaller,
math achievement for both races was lower.
Among West Virginia 4th graders, 24.7 percent
of Blacks and 35.6 percent of whites tested at
or above proficient in math (see State Education
Equality Index table).
proficiency gap was in Kentucky. Among
Figure D shows math proficiency gaps for Latino
Kentucky 4th graders, 29.4 percent of Hispanics
students. The largest Hispanic–White math
and 39.2 percent of whites tested at or above
proficiency gap was in the District of Columbia
proficient in reading (see State Education
with an index of 27 percent and the smallest
Equality Index table).
gap was in Louisiana where the index was 72
Comparing the progression of these gaps
between grades 4 and 8, we find that the
Hispanic–White reading proficiency gap was
more likely to narrow than the Black–White gap.
The Hispanic–White reading index improved
between grades 4 and 8 in 32 out of 47 states
(see Figure B), while the Black–White reading
percent. Among DC 4th graders, 23.3 percent of
Hispanics and 87.7 percent of whites tested at or
above proficient in math. Among Louisiana 4th
graders, 28.9 percent of Hispanic students and
40 percent of white students tested at or above
proficient in math (see State Education Equality
Index table).
index improved in only 16 out of 46 states (see
Based on the progression of these gaps
Figure A). Improvement among Latino students
between grades 4 and 8, we find that both
may be partially attributed to increased English
Blacks and Latinos saw less narrowing of math
language proficiency among students for whom
gaps than of reading gaps. Black–White math
English is a second language as they progress
proficiency gaps improved in only 9 of 45 states,
through school.
while Hispanic–White gaps improved in just 13
of 47 states (see Figures C and D). This limited
progression is consistent with the fact that more
2015 STATE OF BLACK AMERICA¨
SAVE OUR CITIES
NATIONAL URBAN LEAGUE
Introduction to the 2015 Equality Index™ + 23
FIGURE B: HISPANIC–WHITE READING PROFICIENCY EQUALITY INDEX ª, GRADES 4 AND 8
■ Grade 4 ■ Grade 8
63%
70%
56%
AR
63%
WY
59%
61%
MI
58%
58%
LA
58%
74%
MT
58%
63%
MD
57%
57%
OH
57%
80%
IN
57%
59%
HI
57%
56%
IA
55%
53%
SC
55%
63%
GA
52%
61%
TN
52%
73%
64%
DE
51%
NE
51%
45%
SD
51%
54%
NC
50%
55%
VA
50%
59%
MN
49%
42%
MS
48%
57%
KS
46%
48%
OK
46%
52%
NY
46%
42%
NM
44%
41%
CO
44%
47%
OR
42%
41%
NV
42%
45%
WI
41%
55%
WA
40%
42%
NH
40%
41%
PA
40%
35%
IL
39%
51%
AZ
39%
41%
NJ
39%
56%
CT
38%
45%
AL
37%
58%
TX
37%
40%
MA
36%
35%
RI
35%
40%
35%
46%
34%
41%
UT
33%
51%
DC
30%
28%
20
0%
ID
CA
0%
72%
63%
10
FL
AK
80
78%
%
75%
60
74%
MO
%
G8
%
75%
40
G4
KY
%
STATE
Index Values
2015 STATE OF BLACK AMERICA
¨
SAVE OUR CITIES
NATIONAL URBAN LEAGUE
Introduction to the 2015 Equality Index™ + 24
advanced mathematical concepts are built upon
Louisiana, New Hampshire, Hawaii
concepts that are learned earlier. So unless
and Arkansas.
targeted interventions are made, students
who struggle with math in grade 4 are likely to
continue to face challenges in later grades.
INTERPRETING THE STATE EDUCATION
EQUALIT Y INDEX ™ RESULTS
Educational outcomes are determined by a
HIGH SCHOOL GRADUATION GAPS
multitude of factors, many of which cannot
High school graduation gaps are based on
be narrowed down to or captured by a few
the percentage of entering freshman who
numbers. The State Education Index does
graduated high school. The index is measured
not measure the cause of racial achievement
as the Black (or Latino) graduation rate
gaps, rather it presents a comparison of these
relative to the white graduation rate. Figure E
gaps across states based on NAEP scores,
presents both Black–White and Hispanic–White
a commonly used, standardized measure
graduation gaps. The largest Black–White
of student achievement, and high school
graduation gap was in Nebraska with an index
graduation rates.
of 65 percent. In Nebraska, 57.6 percent of Black
high school freshmen graduate high school,
compared to 88.8 percent of whites (see State
Education Equality Index table). The smallest
graduation gap was in Vermont with an index of
111 percent, indicating that the Black graduation
rate actually exceeded the white graduation
rate. In Vermont, 100 percent of Black freshmen
graduate from high school, compared to 89.9
percent of whites (see State Education Equality
Index table). In fact, Black students had a higher
graduation rate than whites in three other states
as well—Maine, Arizona and North Dakota—all of
which have relatively small Black populations.
Consistent with findings on the largest Hispanic–
White gaps in reading and math proficiency,
the largest Hispanic–White graduation gap was
also in the District of Columbia where the index
was 67 percent. In DC, 58.5 percent of Hispanic
freshman graduate high school, compared to
87.8 percent of whites (see State Education
Equality Index table). The smallest gap was in
Maine, with an index of 117 percent. In Maine,
96.1 percent of Hispanic freshmen graduate high
school, compared to 82.4 percent of whites (see
State Education Equality Index table). Hispanic
students also had higher graduation rates than
Still, some notable patterns emerge from this
year’s data. The smallest gaps were commonly
found in states with relatively small minority
populations and in cases where test scores
were relatively low for each group—white,
Black or Hispanic. Higher graduation rates for
Black and Latino students were also found in
states where these groups are a smaller share
of the population.
On average, larger gaps were present in
states with large urban areas that are home to
large minority populations that live in highly
segregated neighborhoods with excessive
rates of concentrated high poverty. This is
important because racially and economically
segregated neighborhoods create similarly
segregated schools, a fact that remains even
60 years after Brown v. Board of Education. 5 In
fact, the majority of Black and Latino students
enter kindergarten in highly segregated schools
where nearly half of their peers live in poverty.6
On average, students in these heavily minority,
high poverty schools are less prepared when
they start in the fall and make less progress
(relative to the average) over the course of the
year than those in low poverty schools.7
whites in six other states—Vermont, Alaska,
2015 STATE OF BLACK AMERICA¨
SAVE OUR CITIES
NATIONAL URBAN LEAGUE
Introduction to the 2015 Equality Index™ + 25
Universal early childhood education is
NOTES
commonly proposed as a way to start students
1
hese metro areas are those for which there were
T
large enough samples of African-American and Latino
populations to calculate reliable estimates.
2
he unemployment and income data used for the
T
Metro Index rankings comes from the American
Community Survey (ACS). The 2015 Metro Index
is based on data from the 2013 ACS (most recent)
and the 2014 Metro Index is based on data from the
2012 ACS.
3
ilson, Valerie. 2015. “Single-Digit Black
W
Unemployment May Not be So Far Away.” Working
Economics (Economic Policy Institute blog). January
9. http://www.epi.org/blog/single-digit-Blackunemployment-may-not-be-so-far-away/.
4
ilson, Valerie. 2014. “Real Median Household
W
Incomes for all Racial Groups Remain Well Below
Their 2007 Levels.” Working Economics (Economic
Policy Institute blog). September 16. http://www.epi.
org/blog/real-median-household-incomes-racialgroups/.
5
othstein, Richard. 2014. Brown v. Board at 60: Why
R
Have We Been So Disappointed? What Have We
Learned? Economic Policy Institute report. http://
www.epi.org/publication/brown-at-60-why-have-webeen-so-disappointed-what-have-we-learned/.
6
arcia, Emma and Elaine Weiss. 2014. Segregation
G
and peers’ characteristics in the 2010–2011
kindergarten class: 60 years after Brown v. Board.
Economic Policy Institute and Broader Bolder
Approach to Education report. http://www.epi.org/
publication/segregation-and-peers-characteristics/.
7
Ibid.
out on more equal footing. The data presented
in the State Education Index table show that
similar shares of white, Black and Hispanic
children were enrolled in pre-school, and in
fact in some states, Black and Hispanic children
had higher enrollment rates than whites.
Since only a handful of states offer universal
pre-K, the wider the divide in family economic
status, the more likely it is that children with
different backgrounds attend pre-schools
of different quality and have varying early
learning experiences.
Policies aimed at providing universal highquality early childhood education, effectively
integrating neighborhoods, and promoting
full employment are critical to reducing the
socio-economic barriers that limit student
achievement for children of color. These policies
should be combined with others aimed at
directly improving the quality of America’s
public K–12 education system for all students.
Lastly, while our analysis identified the
significant Black–White–Latino gaps in
education across the country, we must all
recognize that the nation is struggling overall.
There even appears to be a similarly significant
gap between all students’ test scores and
what is considered proficiency. Strategies,
supports and investments must be developed
and implemented that close subgroup gaps in
opportunity and achievement; but the nation
must also consider which set of strategies,
supports and investments are necessary to
make all students proficient and truly bring
about excellence and equity at scale. +
2015 STATE OF BLACK AMERICA¨
SAVE OUR CITIES
NATIONAL URBAN LEAGUE
Introduction to the 2015 Equality Index™ + 26
FIGURE C: BLACK–WHITE MATH PROFICIENCY EQUALITY INDEX ª, GRADES 4 AND 8
■ Grade 4 ■ Grade 8
47%
ME
51%
34%
NM
51%
30%
MN
47%
27%
AZ
43%
43%
KY
43%
33%
AK
42%
44%
KS
41%
38%
VA
40%
32%
NJ
40%
41%
TX
39%
41%
GA
38%
30%
MA
38%
44%
FL
37%
35%
NC
37%
35%
DE
37%
30%
NV
37%
31%
IN
37%
33%
PA
36%
26%
AR
36%
26%
28%
CO
36%
OR
35%
0%
RI
35%
32%
CA
34%
27%
NY
34%
28%
MD
33%
35%
LA
33%
28%
IA
32%
25%
SC
31%
30%
IL
30%
25%
TN
30%
30%
32%
OK
30%
MO
29%
31%
SD
29%
23%
OH
28%
35%
MS
27%
24%
CT
23%
27%
AL
23%
20%
23%
19%
MI
22%
20%
DC
22%
18%
WI
21%
18%
0%
NE
0%
0%
51%
10
56%
%
HI
WA
80
56%
%
66%
60
55%
ND
%
G8
40
69%
%
G4
WV
20
STATE
Index Values
2015 STATE OF BLACK AMERICA¨
SAVE OUR CITIES
NATIONAL URBAN LEAGUE
Introduction to the 2015 Equality Index™ + 27
FIGURE D: HISPANIC–WHITE MATH PROFICIENCY EQUALITY INDEX ª, GRADES 4 AND 8
■ Grade 4 ■ Grade 8
69%
56%
68%
60%
MT
67%
64%
KY
67%
51%
AR
65%
57%
AK
64%
52%
OH
64%
60%
72%
MS
63%
MO
63%
61%
GA
62%
58%
34%
IA
59%
KS
58%
52%
VA
58%
54%
AL
57%
22%
NH
57%
42%
NC
57%
56%
WY
56%
64%
NM
54%
42%
NV
53%
43%
54%
SC
51%
AZ
51%
41%
MN
50%
37%
TX
49%
54%
MI
49%
39%
MD
49%
60%
NJ
49%
58%
IL
48%
47%
CO
48%
43%
57%
DE
47%
OK
47%
51%
MA
47%
44%
NY
47%
33%
PA
47%
31%
ID
46%
36%
TN
44%
65%
OR
44%
40%
WA
43%
47%
RI
43%
34%
41%
41%
38%
40%
CA
35%
34%
SD
34%
61%
UT
32%
30%
CT
32%
26%
DC
27%
26%
20
%
0%
WI
NE
0%
IN
FL
10
67%
80
71%
%
81%
HI
%
G8
60
72%
%
G4
LA
40
STATE
Index Values
2015 STATE OF BLACK AMERICA
¨
SAVE OUR CITIES
NATIONAL URBAN LEAGUE
Introduction to the 2015 Equality Index™ + 28
FIGURE E: H
IGH SCHOOL GRADUATION RATE EQUALITY INDEX ª,
BLACK–WHITE AND HISPANIC–WHITE
95%
96%
HI
95%
102%
RI
95%
88%
KY
93%
100%
SD
93%
85%
TN
92%
95%
NH
91%
105%
AR
89%
102%
CO
89%
77%
ID
88%
95%
FL
88%
98%
MS
87%
90%
AL
86%
88%
NC
86%
84%
UT
85%
74%
DE
85%
84%
OK
85%
88%
OR
85%
98%
88%
MT
85%
MD
85%
88%
SC
84%
90%
GA
84%
89%
NM
84%
93%
TX
84%
93%
LA
84%
106%
89%
VA
84%
MA
83%
75%
MO
82%
94%
84%
NJ
81%
WA
81%
82%
KS
79%
92%
AK
78%
109%
IL
78%
86%
CA
78%
85%
IN
78%
91%
PA
78%
80%
68%
CT
78%
MN
75%
72%
MI
73%
77%
NV
71%
72%
NY
71%
70%
OH
70%
78%
WY
69%
90%
WI
69%
82%
IA
69%
98%
67%
67%
NE
65%
80%
0%
DC
Index Values
0%
WV
12
117%
0%
92%
105%
10
106%
%
AZ
ME
80
73%
%
110%
60
111%
ND
%
H–W
40
111%
%
B–W
VT
20
STATE
■ Black–White ■ Hispanic–White
Understanding the 2015 Equality Index™ + 29
2015 STATE OF BLACK AMERICA©
SAVE OUR CITIES
NATIONAL URBAN LEAGUE
Understanding the 2015 Equality Index™ + 30
WHY DOES THE NATIONAL URBAN LEAGUE PUBLISH
AN EQUALIT Y INDEX ™ ?
Economic empowerment is the central
theme of the National Urban League’s
mission. The Equality Indexª, based on
data gathered by IHS Global Insight,
is a way to document progress toward
this mission.
WHAT IS THE EQUALIT Y INDEX TRYING TO DO?
Imagine if we were to summarize how
well African Americans and Latinos
are doing, compared to whites, in the
areas of economics, health, education,
social justice and civic engagement,
and represent that by a pie.
The Equality Index measures the share
of that pie which African Americans and
Latinos get.
Whites are used as the benchmark
because the history of race in America
has created advantages for whites
that persist in many of the outcomes
being measured.
2015 STATE OF BLACK AMERICA¨
SAVE OUR CITIES
NATIONAL URBAN LEAGUE
Understanding the 2015 Equality Index™ + 31
THE 2015 EQUALIT Y INDEX OF
BLACK AMERICA IS 72 . 2%.
WHAT DOES THAT MEAN?
That means that rather
than having a whole pie
(100%), which would mean
full equality with whites in
2015, African Americans
are missing about 28% of
the pie (Figure 1).
100% WHITE
72.2% BLACK
FIGURE 1
2015 Black–White Equality Index is 72.2%
HOW IS THE EQUALIT Y
INDEX CALCULATED?
The categories that make
up the Equality Index
are economics, health,
education, social justice
and civic engagement.
In each, we calculate how
well African Americans
and Latinos are doing
relative to whites and
add them to get the total
Equality Index.
10%
30%
10%
25%
25%
FIGURE 2
Different Categories that Make Up the Equality Index
Economics 30%
Health 25%
Education 25%
Social Justice 10%
Civic Engagement 10%
Each category is weighted,
based on the importance
that we give to each
(Figure 2).
2015 STATE OF BLACK AMERICA¨
SAVE OUR CITIES
NATIONAL URBAN LEAGUE
Understanding the 2015 Equality Index™ + 32
IS IT POSSIBLE TO SEE HOW
WELL AFRICAN AMERICANS AND
LATINOS ARE DOING IN EACH
OF THE CATEGORIES?
FIGURE 3
Black–White Equality Index for 2015
Yes. We show this in the
tables included with the
Equality Index.
CATEGORY
2015
EQUALITY INDEX
72.2%
Economics
55.8%
Health
79.8%
Education
76.1%
Social Justice
60.6%
Civic Engagement
104.0%
Each category can be
represented by a mini-pie
and interpreted in the same
way as the total Equality
Index. So, an index of
55.8% for the economics
category for African
Americans in 2015 means
that African Americans are
missing close to half of the
economics mini-pie.
IS IT POSSIBLE TO SEE HOW WELL AFRICAN AMERICANS
AND LATINOS ARE DOING OVER TIME?
Yes. The National Urban League has published the Equality
Index and all the variables used to calculate it annually since
2005. We have noted the ones for 2005, 2010 and 2015.
FIGURE 4
Black–White Equality Index for 2005, 2010 and 2015
CATEGORY
EQUALITY INDEX
72.9%
2005
72.1%
2010
2015 STATE OF BLACK AMERICA¨
72.2%
2015
SAVE OUR CITIES
2005
2010
2015
72.9%
72.1%
72.2%
Economics
56.8%
57.9%
55.8%
79.8%
Health
76.2%
76.7%
Education
77.2%
78.3%
76.1%
Social Justice
67.5%
57.8%
60.6%
Civic Engagement
108.1%
102.2%
104.0%
NATIONAL URBAN LEAGUE
Understanding the 2015 Equality Index™ + 33
IT DOESN'T LOOK LIKE THERE'S BEEN
MUCH IMPROVEMENT IN THE EQUALIT Y
INDEX—WHAT'S THE POINT ?
Since the Equality Index is
composed of many parts,
improvements in one
area are sometimes offset
by losses in another,
leaving the overall index
unchanged.
Change often happens
slowly. The Equality Index
offers solid evidence of
just how slowly change
happens, making it an
important tool for driving
policies needed in the
ongoing fight against
inequality.
2015 STATE OF BLACK AMERICA¨
SAVE OUR CITIES
NOT ALL AFRICAN AMERICANS ARE
DOING POORLY AND NOT ALL WHITES
ARE DOING WELL . WHY DOESN'T THE
EQUALIT Y INDEX CAPTURE CLASS
DIFFERENCES?
The national Equality
Index was created to
capture racial inequality.
Most of the data points
are reported as averages
for African Americans,
whites and Latinos. An
average is the easiest
way to summarize a large
amount of information, but
can mask class differences
within each group. In lieu
of class differences, we
offer insight into regional
differences in racial
inequality through our
rankings of metro area
unemployment and income
inequality, as well as state
level education disparities.
NATIONAL URBAN LEAGUE
Understanding the 2015 Equality Index™ + 34
WHAT SHOULD I DO NEXT ?
Support the work of
the National Urban
League as we continue
to advance policies
and programs to
empower African
Americans and other
urban communities.
2015 STATE OF BLACK AMERICA¨
SAVE OUR CITIES
NATIONAL URBAN LEAGUE
2015 Equality Index™ : Black–White + 35
2015 STATE OF BLACK AMERICA©
SAVE OUR CITIES
NATIONAL URBAN LEAGUE
2015 Equality Index™ : Black–White + 36
Updated
History Revised
Removed Weight in 2014
2015 EQUALITY INDEX OF
BLACK AMERICA
New Series 2014
Source
No New Data
Year
Black
White
Total Equality Weighted Index
Index
Diff.
(’15–’14)
72.2%
0.007
ECONOMICS (30%)
MEDIAN INCOME (0.25)
Median Household Income (Real), Dollars
ACS
2013
34,815
57,684
60%
0.01
Median Male Earnings, Dollars
ACS
2013
37,290
52,452
71%
(0.01)
Median Female Earnings, Dollars
ACS
2013
33,780
41,010
82%
0.00
POVERTY (0.15)
Population Living Below Poverty Line, %
ACS
2013
27.6
11.1
40%
0.01
Population Living Below 50% of Poverty Line, %
ACS
2013
13.2
5.0
38%
0.02
ACS
2013
34.2
14.7
43%
0.01
Population Living Below Poverty Line (Under 18), %
Population Living Below 125% of Poverty Line, %
CPS ASEC
2013
38.3
10.7
28%
(0.05)
Population Living Below Poverty Line (18–64), %
CPS ASEC
2013
23.9
9.9
41%
0.01
Population Living Below Poverty Line (65 and Older), %
CPS ASEC
2013
17.6
7.4
42%
0.05
EMPLOYMENT ISSUES (0.20)
Unemployment Rate, %
BLS
2014
11.3
5.3
47%
(0.03)
Unemployment Rate: Male, %
BLS
2014
12.2
5.4
44%
(0.04)
Unemployment Rate: Female, %
BLS
2014
10.5
5.2
50%
(0.02)
Unemployment Rate Persons Ages 16–19, %
BLS
2014
33.0
17.3
52%
0.00
Percent Not in Workforce: Ages 16–19, %
BLS
2014
72.8
63.8
88%
0.00
Percent Not in Workforce: Ages 16 and Older, %
BLS
2014
38.8
36.9
95%
0.01
Labor Force Participation Rate, %
BLS
2014
61.2
63.1
97%
0.01
LFPR 16–19, %
BLS
2014
27.2
36.2
75%
(0.01)
LFPR 20–24, %
BLS
2014
66.6
73.0
91%
0.02
(0.01)
LFPR Over 25: Less Than High School Grad., %
BLS
2014
37.8
46.2
82%
LFPR Over 25: High School Grad., No College, %
BLS
2014
59.4
57.6
103%
0.01
LFPR Over 25: Some College, No Degree, %
BLS
2014
68.9
63.6
108%
(0.01)
LFPR Over 25: Associate’s Degree, %
BLS
2014
72.4
70.8
102%
(0.00)
LFPR Over 25: Some College or Associate Degree, %
BLS
2014
70.0
66.3
106%
(0.00)
LFPR Over 25: College Grad., %
Employment to Pop. Ratio, %
BLS
2014
78.6
74.3
106%
0.01
BLS
2014
54.3
59.7
91%
0.01
HOUSING & WEALTH (0.34)
Census
2013
43.1
73.3
59%
(0.01)
Mortgage Application Denial Rate (Total), %
Home Ownership Rate, %
HMDA
2013
35.2
12.0
34%
0.01
Mortgage Application Denial Rate (Male), %
HMDA
2013
32.6
14.0
43%
0.01
Mortgage Application Denial Rate (Female), %
HMDA
2013
38.0
13.9
36%
0.00
Mortgage Application Denial Rate (Joint), %
HMDA
2013
33.2
9.8
30%
0.02
Home Improvement Loans Denials (Total), %
HMDA
2013
62.4
30.8
49%
0.02
Home Improvement Loans Denials (Male), %
HMDA
2013
62.6
36.5
58%
0.01
Home Improvement Loans Denials (Female), %
HMDA
2013
65.7
38.2
58%
0.01
Home Improvement Loans Denials (Joint), %
HMDA
2013
51.8
22.6
44%
0.02
2015 STATE OF BLACK AMERICA¨
SAVE OUR CITIES
NATIONAL URBAN LEAGUE
2015 Equality Index™ : Black–White + 37
Updated
History Revised
Removed Weight in 2014
2015 EQUALITY INDEX OF
BLACK AMERICA
Percent of High-Priced Loans (More Than 3%
Above Treasury)
New Series 2014
No New Data
Source
Year
Black
White
Index
Diff.
(’15–’14)
HMDA
2013
6.1
2.9
47%
(0.00)
Median Home Value, 2000 Dollars
Census
2000
80,600
123,400
65%
0.00
Median Wealth, 2010 Dollars
Census
SIPP
2011
6,314
110,500
6%
0.00
Equity in Home, Dollars
Census
SIPP
2011
50,000
85,000
59%
0.00
Percent Investing in 401(K), %
Census
2011
31.7
46.4
68%
0.02
Percent Investing in IRA, %
Census
2011
11.2
35.4
32%
0.01
U.S. Firms By Race (% Compared to Employment Share)
Census
2007
7.1
83.4
9%
0.00
DIGITAL DIVIDE (0.05)
Households With Computer at Home, %
Census
2013
75.8
85.4
89%
0.08
Households With the Internet, %
Census
2013
61.3
77.4
79%
0.05
Adult Users With Broadband Access, %
Census
2013
60.6
76.2
80%
0.05
TRANSPORTATION (0.01)
Car Ownership, %
Census
2011
70.5
88.3
80%
0.00
Means of Transportation to Work: Drive Alone, %
ACS
2013
71.8
79.9
90%
(0.00)
Means of Transportation to Work: Public Transportation, %
ACS
2013
11.2
3.1
Economic Weighted Index
28%
0.01
55.8%
0.004
HEALTH (25%)
DEATH RATES & LIFE EXPECTANCY (0.45)
Life Expectancy at Birth
CDC
2011
74.9
78.8
95%
0.00
Male
CDC
2011
71.7
76.4
94%
0.00
Female
CDC
2011
77.8
81.1
96%
0.00
CDC
2011
17.9
19.1
94%
0.01
Male at 65
CDC
2011
16.1
17.8
90%
0.01
Female at 65
CDC
2011
19.2
20.3
95%
0.00
Age-Adjusted Death Rates (Per 100,000): All Causes
CDC
2012
887.1
754.3
85%
0.01
Age-Adjusted Death Rates (Per 100,000): Male
CDC
2012
1,086.4
876.2
81%
(0.00)
Age-Adjusted Death Rates (Per 100,000): Female
CDC
2012
742.1
637.6
86%
0.01
Age-Adjusted Death Rates (Per 100,000): Heart Disease
CDC
2012
216.3
172.3
80%
(0.00)
Life Expectancy at 65 (Additional Expected Years)
CDC
2012
123.4
107.4
87%
0.00
Age-Adjusted Death Rates (Per 100,000): Stroke
(Cerebrovascular)
Ischemic Heart Disease
CDC
2012
50.4
35.8
71%
0.01
Age-Adjusted Death Rates (Per 100,000): Cancer
CDC
2012
198.6
170.6
86%
0.01
Trachea, Bronchus, and Lung
CDC
2012
49.6
48.0
97%
(0.01)
Colon, Rectum, and Anus
CDC
2012
20.5
14.7
72%
0.03
Prostate (Male)
CDC
2012
42.4
18.1
43%
(0.01)
Breast (Female)
CDC
2012
30.2
21.3
71%
0.02
CDC
2012
29.7
46.3
156%
(0.02)
Age-Adjusted Death Rates (Per 100,000):
Chronic Lower Respiratory
2015 STATE OF BLACK AMERICA¨
SAVE OUR CITIES
NATIONAL URBAN LEAGUE
2015 Equality Index™ : Black–White + 38
Updated
History Revised
Removed Weight in 2014
2015 EQUALITY INDEX OF
BLACK AMERICA
New Series 2014
No New Data
Source
Year
Black
White
Index
Diff.
(’15–’14)
Age-Adjusted Death Rates (Per 100,000): Influenza
and Pneumonia
CDC
2012
16.1
14.4
89%
(0.02)
Age-Adjusted Death Rates (Per 100,000): Chronic Liver
Disease and Cirrhosis
CDC
2012
7.0
10.0
143%
0.08
Age-Adjusted Death Rates (Per 100,000): Diabetes
CDC
2012
39.7
18.5
47%
(0.00)
Age-Adjusted Death Rates (Per 100,000): HIV
CDC
2012
9.8
1.0
10%
0.01
Unintentional Injuries
CDC
2012
32.5
43.9
135%
0.01
CDC
2012
11.8
12.1
103%
(0.03)
Motor Vehicle-Related Injuries
Age-Adjusted Death Rates (Per 100,000): Suicide
CDC
2012
5.8
15.7
271%
(0.11)
CDC
2012
10.0
25.2
252%
(0.04)
Death Rates (Per 100,000): Suicide Males Ages 15–24
CDC
2012
12.0
21.2
177%
(0.05)
Age-Adjusted Death Rates (Per 100,000): Suicide Females
CDC
2012
2.1
6.9
329%
(0.24)
CDC
2012
2.9
5.1
176%
(0.33)
CDC
2012
19.4
2.6
13%
(0.01)
CDC
2012
34.8
3.5
10%
(0.00)
CDC
2012
75.0
3.9
5%
0.00
CDC
2012
5.1
1.7
33%
0.01
CDC
2012
8.3
1.7
20%
0.01
Death Rates (Per 100,000) By Age Cohort: < 1 Male
CDC
2012
1,218.2
558.2
46%
(0.01)
Death Rates (Per 100,000) By Age Cohort: 1–4 Male
CDC
2012
45.0
27.9
62%
0.03
Death Rates (Per 100,000) By Age Cohort: 5–14 Male
CDC
2012
22.5
13.3
59%
(0.08)
Death Rates (Per 100,000) By Age Cohort: 15–24 Male
CDC
2012
146.5
92.0
63%
(0.01)
Death Rates (Per 100,000) By Age Cohort: 25–34 Male
CDC
2012
226.6
149.0
66%
0.01
Death Rates (Per 100,000) By Age Cohort: 35–44 Male
CDC
2012
322.4
221.7
69%
(0.01)
Death Rates (Per 100,000) By Age Cohort: 45–54 Male
CDC
2012
720.0
508.0
71%
0.00
Death Rates (Per 100,000) By Age Cohort: 55–64 Male
CDC
2012
1,657.2
1,058.0
64%
0.01
Death Rates (Per 100,000) By Age Cohort: 65–74 Male
CDC
2012
3,146.5
2,175.8
69%
(0.00)
Death Rates (Per 100,000) By Age Cohort: 75–84 Male
CDC
2012
6,550.1
5,599.2
85%
(0.03)
Death Rates (Per 100,000) By Age Cohort: 85+ Male
CDC
2012
14,006.7
15,504.4
111%
0.03
Death Rates (Per 100,000) By Age Cohort: <1 Female
CDC
2012
1,000.0
469.2
47%
0.01
Death Rates (Per 100,000) By Age Cohort: 1–4 Female
CDC
2012
35.2
21.7
62%
0.03
Death Rates (Per 100,000) By Age Cohort: 5–14 Female
CDC
2012
14.8
10.1
68%
(0.01)
Death Rates (Per 100,000) By Age Cohort: 15–24 Female
CDC
2012
46.1
37.8
82%
(0.02)
Death Rates (Per 100,000) By Age Cohort: 25–34 Female
CDC
2012
95.2
70.7
74%
0.06
Death Rates (Per 100,000) By Age Cohort: 35–44 Female
CDC
2012
203.2
136.0
67%
0.01
Death Rates (Per 100,000) By Age Cohort: 45–54 Female
CDC
2012
478.6
315.2
66%
0.00
Death Rates (Per 100,000) By Age Cohort: 55–64 Female
CDC
2012
975.0
635.9
65%
0.00
Death Rates (Per 100,000) By Age Cohort: 65–74 Female
CDC
2012
1,963.1
1,480.2
75%
(0.00)
Death Rates (Per 100,000) By Age Cohort: 75–84 Female
CDC
2012
4,489.1
4,178.1
93%
0.02
Death Rates (Per 100,000) By Age Cohort: 85+ Female
CDC
2012
12,334.1
13,437.0
109%
0.01
Age-Adjusted Death Rates (Per 100,000): Suicide Males
Death Rates (Per 100,000): Suicide Females
Ages 15–24
Age-Adjusted Death Rates (Per 100,000): Homicide
Age-Adjusted Death Rates (Per 100,000): Homicide Male
Death Rates (Per 100,000): Homicide Males
Ages 15–24
Age-Adjusted Death Rates (Per 100,000):
Homicide Female
Death Rates (Per 100,000): Homicide Females
Ages 15–24
2015 STATE OF BLACK AMERICA¨
SAVE OUR CITIES
NATIONAL URBAN LEAGUE
2015 Equality Index™ : Black–White + 39
Updated
History Revised
Removed Weight in 2014
2015 EQUALITY INDEX OF
BLACK AMERICA
New Series 2014
Source
No New Data
Year
Black
White
Index
Diff.
(’15–’14)
PHYSICAL CONDITION (0.10)
Overweight: 18+ Years, % of Population
CDC
2013
34.4
35.8
104%
(0.01)
Overweight: Men 20 Years and Over, % of Population
CDC
2009–2012
31.7
38.7
122%
(0.05)
Overweight: Women 20 Years and Over, % of Population
CDC
2009–2012
24.3
28.6
118%
0.11
Obese, % of Population
CDC
2013
36.6
26.4
72%
0.00
Obese: Men 20 Years and Over, % of Population
CDC
2009–2012
37.3
34.0
91%
0.01
Obese: Women 20 Years and Over, % of Population
CDC
2009–2012
57.2
32.4
57%
(0.04)
Diabetes: Physician Diagnosed in Ages 20+,
% of Population
CDC
2009–2012
13.8
6.6
48%
0.03
AIDS Cases Per 100,000 Males Ages 13+
CDC
2012
64.3
7.1
11%
(0.01)
AIDS Cases Per 100,000 Females Ages 13+
CDC
2012
27.5
1.2
4%
(0.00)
Binge Alcohol (5 Drinks in 1 Day, 1X a Year) Ages 18+,
% of Population
CDC
2012
13.7
27.8
203%
0.17
Use of Illicit Drugs in the Past Month Ages 12 +,
% of Population
CDC
2012
11.3
9.2
81%
(0.06)
Tobacco: Both Cigarette & Cigar Ages 12+, % of Population
CDC
2012
27.2
29.2
107%
(0.01)
Students Who Consider Suicide: Male, %
CDC
2011
9.0
12.8
142%
0.00
Students Who Carry Out Intent and Require Medical
Attention: Male, %
CDC
2007
2.5
0.9
36%
0.00
SUBSTANCE ABUSE (0.10)
MENTAL HEALTH (0.02)
Students That Act on Suicidal Feeling: Male, %
CDC
2007
5.5
3.4
62%
0.00
Students Who Consider Suicide: Female, %
CDC
2011
17.4
18.4
106%
0.00
Students Who Carry Out Intent and Require Medical
Attention: Female, %
CDC
2007
2.1
2.1
100%
0.00
Students That Act on Suicidal Feeling: Female, %
CDC
2007
9.9
7.7
78%
0.00
Private Insurance Payment for Health Care: Under 65
Years Old, % of Distribution
CPS ASEC
2013
50.7
75.0
68%
(0.01)
People Without Health Insurance, % of Population
CPS ASEC
2013
15.9
11.1
70%
0.12
People 18 to 64 Without a Usual Source of Health
Insurance, % of Adults
CPS ASEC
2013
21.8
15.4
71%
0.11
People 18 to 64 and in Poverty Without a Usual Source
of Health Insurance, % of Adults
CPS ASEC
2013
33.0
33.0
100%
0.07
Population Under 65 Covered By Medicaid,
% of Population
CPS ASEC
2013
32.1
13.0
40%
(0.02)
ACCESS TO CARE (0.05)
ELDERLY HEALTH CARE (0.03)
Population Over 65 Covered By Medicaid, % of Population
Medicare Expenditures Per Beneficiary, Dollars
CPS ASEC
2013
11.5
4.2
36%
(0.01)
CDC
2010
23,047
16,474
71%
(0.11)
PREGNANCY ISSUES (0.04)
Prenatal Care Begins in 1st Trimester
CDC
2011
80.9
85.7
94%
0.01
Prenatal Care Begins in 3rd Trimester
CDC
2007
6.0
2.3
38%
0.00
Percent of Births to Mothers 18 and Under
CDC
2012
3.7
1.4
38%
0.03
Percent of Live Births to Unmarried Mothers
CDC
2012
72.1
29.3
41%
0.01
Infant Mortality Rates Among Mothers with Less Than
12 Years of Education
CDC
2005
14.8
9.3
63%
0.00
2015 STATE OF BLACK AMERICA¨
SAVE OUR CITIES
NATIONAL URBAN LEAGUE
2015 Equality Index™ : Black–White + 40
Updated
History Revised
Removed Weight in 2014
2015 EQUALITY INDEX OF
BLACK AMERICA
New Series 2014
No New Data
Source
Year
Black
White
Index
Diff.
(’15–’14)
Infant Mortality Rates Among Mothers with
12 Years of Education
CDC
2005
14.2
7.1
50%
0.00
Infant Mortality Rates Among Mothers with
13 or More Years of Education
CDC
2005
11.4
4.1
36%
0.00
Mothers Who Smoked Cigarettes During Pregnancy, %
CDC
2011
6.9
22.0
319%
0.04
Low Birth Weight, % of Live Births
CDC
2012
13.2
7.0
53%
0.00
Very Low Birth Weight, % of Live Births
CDC
2012
2.9
1.1
38%
(0.00)
REPRODUCTION ISSUES (0.01)
Abortions, Per 1,000 Live Births
CDC
2007
447.0
159.0
36%
0.00
Women Using Contraception, % of Population
CDC
2006–2010
54.2
65.6
83%
0.00
DELIVERY ISSUES (0.10)
All Infant Deaths: Neonatal and Post, Per 1,000 Live Births
CDC
2010
11.5
5.2
45%
0.02
Neonatal Deaths, Per 1,000 Live Births
CDC
2010
7.5
3.4
45%
0.03
Postneonatal Deaths, Per 1,000 Live Births
CDC
2010
4.0
1.8
45%
0.01
CDC
2007
23.8
8.1
34%
0.00
Babies Breastfed, %
CDC
2011
61.6
81.1
76%
(0.00)
Children Without a Health Care Visit in Past 12 Months
(up to 6 Years Old), %
CDC
2011–2012
4.6
4.2
91%
0.32
Vaccinations of Children Below Poverty: Combined Vacc.
Series 4:3:1:3:1:4, % of Children 19–35 Months
CDC
2012
63.0
58.0
109%
0.07
Maternal Mortality, Per 100,000 Live Births
CHILDREN'S HEALTH (0.10)
Uninsured Children, %
CPS ASEC
2013
7.3
5.3
73%
0.03
Overweight Boys 6–11 Years Old, % of Population
CDC
2009–2012
27.6
12.9
47%
(0.33)
Overweight Girls 6–11 Years Old, % of Population
CDC
2009–2012
25.0
14.2
57%
(0.00)
AIDS Cases Per 100,000 All Children Under 13
CDC
2012
0.1
0.0
13%
0.07
79.8%
0.016
Health Weighted Index
EDUCATION (25%)
QUALITY (0.25)
TEACHER QUALITY (0.10)
Middle Grades: Teacher Lacking at Least a College Minor
in Subject Taught (High Vs. Low Minority Schools), %
ET
2000
49.0
40.0
85%
0.00
HS: Teacher Lacking An Undergraduate Major in Subject
Taught (High Vs. Low Poverty Secondary Schools), %
ET
2007–
2008
21.9
10.9
88%
0.00
Per Student Funding (High [30%] Vs. Low [0%] Poverty
Districts), Dollars
SFF
2009
10,948
10,684
102%
0.00
NCES
2007–
2008
13
10
77%
0.00
SRI
2008–2009
5
1
20%
0.00
NCES
2004
39.5
61.5
64%
0.00
ET
1999
75.0
86.0
87%
0.00
Teachers With <3 Years Experience (High Vs. Low
Poverty Schools), %
Distribution of Underprepared Teachers (High Vs. Low
Minority Schools), % (California Only)
COURSE QUALITY (0.15)
College Completion, % of All Entrants
College Completion, % of Entrants with Strong HS
Curriculum (Algebra II Plus Other Courses)
2015 STATE OF BLACK AMERICA¨
SAVE OUR CITIES
NATIONAL URBAN LEAGUE
2015 Equality Index™ : Black–White + 41
Updated
History Revised
Removed Weight in 2014
2015 EQUALITY INDEX OF
BLACK AMERICA
New Series 2014
No New Data
Source
Year
HS Students: Enrolled in Chemistry, %
NCES
2009
HS Students: Enrolled in Algebra II, %
NCES
2009
Students Taking: Precalculus, %
NCES
2009
Students Taking: Calculus, %
NCES
Students Taking: Physics, %
White
Index
Diff.
(’15–’14)
65.3
71.5
91%
0.00
70.6
77.4
91%
0.00
22.7
37.9
60%
0.00
2009
6.1
17.5
35%
0.00
NCES
2009
26.9
37.6
72%
0.00
CB
2009
31.0
43.0
72%
0.00
Graduation Rates, 2-Year Institutions Where Students
Started As Full Time, First Time Students, %
NCES
2006
27.1
32.0
85%
0.00
Graduation Rates, 4-Year Institutions Where Students
Started As Full Time, First Time Students, %
NCES
2003
37.7
59.3
64%
0.00
NCAA Div. I College Freshmen Graduating Within 6 Years, %
NCAA
2005
33.0
52.0
63%
0.00
Degrees Earned: Associate, % of Population Aged 18–24 Yrs
NCES
2012–2013
2.9
3.5
82%
(0.03)
Degrees Earned: Bachelor's, % of Population Aged 18–29 Yrs
NCES
2012–2013
2.5
4.1
62%
0.00
Degrees Earned: Master's, % of Population Aged 18–34 Yrs
NCES
2012–2013
0.9
1.1
79%
0.04
Educational Attainment: at Least High School
(25 Yrs. and Over), % of Population
Census
2013
85.1
92.9
92%
(0.00)
Educational Attainment: at Least Bachelor's
(25 Yrs. and Over), % of Population
Census
2013
21.8
35.2
62%
0.00
Students Taking: English Composition, %
Black
ATTAINMENT (0.30)
Degrees Conferred, % Distribution, By Field
Agriculture/Forestry
NCES
2012
0.4
1.7
24%
0.00
Art/Architecture
NCES
2012
0.3
0.7
47%
0.00
Business/Management
NCES
2012
25.7
18.9
136%
0.00
Communications
NCES
2012
3.8
3.9
99%
0.00
Computer and Information Sciences
NCES
2012
2.5
2.1
119%
0.00
Education
NCES
2012
10.3
12.6
82%
0.00
Engineering
NCES
2012
2.4
4.9
49%
0.00
English/Literature
NCES
2012
1.7
2.7
62%
0.00
Foreign Languages
NCES
2012
0.4
1.0
39%
0.00
Health Sciences
NCES
2012
11.8
11.9
99%
0.00
Liberal Arts/Humanities
NCES
2012
2.5
1.9
134%
0.00
Mathematics/Statistics
NCES
2012
0.4
0.9
47%
0.00
Natural Sciences
NCES
2012
3.6
5.4
67%
0.00
Philosophy/Religion/Theology
NCES
2012
0.4
0.6
66%
0.00
Psychology
NCES
2012
6.3
5.2
121%
0.00
Social Sciences/History
NCES
2012
6.7
7.5
89%
0.00
Other Fields
NCES
2012
22.4
19.2
117%
0.00
NCES
2005
44.1
46.8
94%
0.00
SCORES (0.25)
PRESCHOOL 10% OF TOTAL SCORES (0.015)
Children’s School Readiness Skills (Ages 3–5),
% With 3 or 4 Skills*
*Recognizes all letters, counts to 20 or higher, writes name,
reads or pretends to read
2015 STATE OF BLACK AMERICA¨
SAVE OUR CITIES
NATIONAL URBAN LEAGUE
2015 Equality Index™ : Black–White + 42
Updated
History Revised
Removed Weight in 2014
2015 EQUALITY INDEX OF
BLACK AMERICA
New Series 2014
No New Data
Source
Year
Black
White
Index
Diff.
(’15–’14)
ELEMENTARY 40% OF TOTAL SCORES (0.06)
Average Scale Score (out of 500) in U.S. History, 8th Graders
NCES
2010
250
274
91%
0.00
Average Scale Score (out of 500) in U.S. History, 4th Graders
NCES
2010
198
224
88%
0.00
Average Scale Score (out of 500) in Math, 8th Graders
NCES
2013
262
293
89%
0.00
Average Scale Score (out of 500) in Math, 4th Graders
NCES
2013
224
250
90%
0.00
Average Scale Score (out of 500) in Reading, 8th Graders
NCES
2013
251
272
92%
0.00
Average Scale Score (out of 500) in Reading, 4th Graders
NCES
2013
205
232
88%
0.00
Average Scale Score (out of 300) in Science, 8th Graders
NCES
2011
129
163
79%
0.00
Average Scale Score (out of 300) in Science, 4th Graders
NCES
2009
127
163
78%
0.00
Average Scale Score (out of 300) in Writing, 8th Graders
NCES
2011
132
158
84%
0.00
Science Proficiency at or Above Proficient, 8th Graders,
% of Students
NCES
2002
10
43
23%
0.00
Science Proficiency at or Above Proficient, 4th Graders,
% of Students
NCES
2009
11
47
22%
0.00
Reading Proficiency at or Above Proficient, 8th Graders,
% of Students
NCES
2013
17
48
35%
0.00
Reading Proficiency at or Above Proficient, 4th Graders,
% of Students
NCES
2013
17
45
38%
0.00
Math Proficiency at or Above Proficient, 8th Graders,
% of Students
NCES
2013
14
44
32%
0.00
Math Proficiency at or Above Proficient, 4th Graders,
% of Students
NCES
2013
18
54
33%
0.00
Writing Proficiency at or Above Proficient, 8th Graders,
% of Students
NCES
2011
11
34
32%
0.00
Writing Proficiency at or Above Proficient, 4th Graders,
% of Students
NCES
2013
17
45
38%
0.00
NCES
2011
61
86
71%
0.00
0.00
HIGH SCHOOL 50% OF TOTAL SCORES (0.075)
Writing Proficiency at or Above Basic, 12th Graders,
% of Students
Average Scale Score (out of 300) in Science, 12th Graders
NCES
2005
120
156
77%
Average Scale Score (out of 500) in U.S. History, 12th Graders
NCES
2010
268
296
91%
0.00
Average Scale Score (out of 500) in Reading, 12th Graders
NCES
2013
268
297
90%
(0.01)
High School GPAs for Those Taking the SAT
CB
2009
3.0
3.4
88%
0.00
SAT Reasoning Test: Mean Scores
CB
2014
1,278
1,576
81%
0.00
CB
2014
429
534
80%
0.00
(0.00)
Mathematics, Joint
Mathematics, Male
CB
2014
435
552
79%
Mathematics, Female
CB
2014
423
519
82%
0.00
CB
2014
431
529
81%
(0.00)
Critical Reading, Male
CB
2014
428
532
80%
(0.00)
Critical Reading, Female
CB
2014
434
526
83%
0.00
CB
2014
418
513
81%
0.00
CB
2014
407
507
80%
(0.00)
CB
2014
427
519
82%
0.01
ACT
2013
16.9
22.2
76%
0.00
Critical Reading, Joint
Writing, Joint
Writing, Male
Writing, Female
ACT: Average Composite Score
2015 STATE OF BLACK AMERICA¨
SAVE OUR CITIES
NATIONAL URBAN LEAGUE
2015 Equality Index™ : Black–White + 43
Updated
History Revised
Removed Weight in 2014
2015 EQUALITY INDEX OF
BLACK AMERICA
New Series 2014
No New Data
Source
Year
Black
White
Index
Diff.
(’15–’14)
ENROLLMENT (0.10)
School Enrollment: Ages 3–34, % of Population
Census
2013
57.2
54.7
105%
(0.00)
Preprimary School Enrollment
Census
2013
66.8
66.9
100%
0.04
3 and 4 Years Old
Census
2013
57.2
57.4
100%
0.06
5 and 6 Years Old
Census
2013
94.4
93.6
101%
0.03
7 to 13 Years Old
Census
2013
97.3
98.2
99%
(0.01)
14 and 15 Years Old
Census
2013
98.7
98.4
100%
0.01
16 and 17 Years Old
Census
2013
92.8
93.6
99%
0.01
18 and 19 Years Old
Census
2013
64.2
69.6
92%
(0.07)
20 and 21 Years Old
Census
2013
47.9
55.2
87%
(0.02)
22 to 24 Years Old
Census
2013
27.0
29.1
93%
0.00
25 to 29 Years Old
Census
2013
16.7
12.9
129%
0.19
30 to 34 Years Old
Census
2013
8.6
6.5
132%
(0.53)
35 and Over
Census
2013
3.1
1.6
192%
(0.05)
Census
2013
9.0
6.9
131%
(0.06)
Census
2013
1.3
2.1
61%
(0.05)
(0.11)
College Enrollment (Graduate or Undergraduate):
Ages 14 and Over, % of Population
14 to 17 Years Old
18 to 19 Years Old
Census
2013
34.6
51.2
68%
20 to 21 Years Old
Census
2013
44.0
53.5
82%
0.02
22 to 24 Years Old
Census
2013
25.7
28.9
89%
(0.05)
25 to 29 Years Old
Census
2013
16.0
12.7
126%
0.15
30 to 34 Years Old
Census
2013
8.2
6.4
128%
(0.55)
35 Years Old and Over
Census
2013
2.9
1.6
183%
(0.07)
College Enrollment Rate As a Percent of All 18- to
24-Year-Old High School Completers, %
NCES
2011
37.1
44.7
83%
0.00
Adult Education Participation, % of Adult Population
NCES
2004–2005
46.0
46.0
100%
0.00
High School Dropouts: Status Dropouts, % (Not Completed
HS and Not Enrolled, Regardless of When Dropped Out)
Census
2012
7.5
4.3
57%
(0.22)
Children in Poverty, %
Census
2013
38.3
10.7
28%
(0.05)
Children in All Families Below Poverty Level, %
Census
2013
38.0
10.1
27%
(0.05)
Children in Families Below Poverty Level (Female
Householder, No Spouse Present), %
Census
2013
53.9
33.6
62%
(0.06)
AECF
2013
49.0
25.0
51%
0.02
Census
2013
5.1
4.1
81%
0.00
STUDENT STATUS & RISK FACTORS (0.10)
Children With No Parent in The Labor Force, %
Children (Under 18) With a Disability, %
Public School Students (K–12): Repeated Grade, %
NCES
2007
20.9
8.7
42%
0.00
Public School Students (K–12): Suspended, %
NCES
2003
19.6
8.8
45%
0.00
Public School Students (K–12): Expelled, %
NCES
2003
5.0
1.4
28%
0.00
Center-Based Child Care of Preschool Children, %
NCES
2005
66.5
59.1
89%
0.00
Parental Care Only of Preschool Children, %
NCES
2005
19.5
24.1
81%
0.00
Teacher Stability: Remained in Public School,
High Vs. Low Minority Schools, %
NCES
2009
83.4
85.6
97%
0.00
Teacher Stability: Remained in Private School,
High Vs. Low Minority Schools, %
NCES
2009
77.0
78.9
98%
0.00
2015 STATE OF BLACK AMERICA¨
SAVE OUR CITIES
NATIONAL URBAN LEAGUE
2015 Equality Index™ : Black–White + 44
Updated
History Revised
Removed Weight in 2014
2015 EQUALITY INDEX OF
BLACK AMERICA
New Series 2014
No New Data
Source
Year
Zero Days Missed in School Year, % of 10th Graders
NCES
2002
3+ Days Late to School, % of 10th Graders
NCES
2002
Never Cut Classes, % of 10th Graders
NCES
2002
Read to 3 or More Times a Week
NCES
Told a Story at Least Once a Month
NCES
Black
White
Index
Diff.
(’15–’14)
28.3
12.1
234%
0.00
36.4
44.4
122%
0.00
68.9
70.3
98%
0.00
2007
78.0
90.6
86%
0.00
2007
60.9
85.0
72%
(0.30)
(0.14)
Home Literacy Activities (Age 3 to 5)
Taught Words or Numbers Three or More Times a Week
NCES
2007
81.2
88.1
92%
Visited a Library at Least Once in Last Month
NCES
2007
24.6
40.8
60%
0.00
76.1%
(0.007)
Education Weighted Index
SOCIAL JUSTICE (10%)
EQUALITY BEFORE THE LAW (0.70)
Stopped While Driving, %
BJS
2008
8.8
8.4
95%
0.00
Speeding
BJS
2002
50.0
57.0
114%
0.00
Vehicle Defect
BJS
2002
10.3
8.7
84%
0.00
Roadside Check for Drinking Drivers
BJS
2002
1.1
1.3
118%
0.00
Record Check
BJS
2002
17.4
11.3
65%
0.00
Seatbelt Violation
BJS
2002
3.5
4.4
126%
0.00
Illegal Turn/Lane Change
BJS
2002
5.1
4.5
88%
0.00
Stop Sign/Light Violation
BJS
2002
5.9
6.5
110%
0.00
Other
BJS
2002
3.7
4.0
108%
0.00
Mean Incarceration Sentence (In Average Months)
BJS
2006
42
37
88%
0.00
Average Sentence for Incarceration (All Offenses):
Male, Months
BJS
2006
45
40
89%
0.00
Average Sentence for Murder: Male, Months
BJS
2006
266
265
100%
0.00
Average Sentence for Sexual Assault
BJS
2006
125
115
92%
0.00
Average Sentence for Robbery
BJS
2006
101
89
88%
0.00
Average Sentence for Aggravated Assault
BJS
2006
48
42
88%
0.00
Average Sentence for Other Violent
BJS
2006
41
43
105%
0.00
Average Sentence for Burglary
BJS
2006
50
41
82%
0.00
Average Sentence for Larceny
BJS
2006
23
24
104%
0.00
Average Sentence for Fraud
BJS
2006
27
27
100%
0.00
Average Sentence for Drug Possession
BJS
2006
25
21
84%
0.00
Average Sentence for Drug Trafficking
BJS
2006
40
39
98%
0.00
Average Sentence for Weapon Offenses
BJS
2006
34
34
100%
0.00
Average Sentence for Other Offenses
BJS
2006
25
26
104%
0.00
BJS
2006
25
26
104%
0.00
Average Sentence for Murder
BJS
2006
175
225
129%
0.00
Average Sentence for Sexual Assault
BJS
2006
32
72
225%
0.00
Average Sentence for Robbery
BJS
2006
54
61
113%
0.00
Average Sentence for Incarceration (All Offenses):
Female, Months
2015 STATE OF BLACK AMERICA¨
SAVE OUR CITIES
NATIONAL URBAN LEAGUE
2015 Equality Index™ : Black–White + 45
Updated
History Revised
Removed Weight in 2014
2015 EQUALITY INDEX OF
BLACK AMERICA
New Series 2014
No New Data
Source
Year
Black
White
Index
Diff.
(’15–’14)
Average Sentence for Aggravated Assault
BJS
2006
29
Average Sentence for Other Violent
BJS
2006
17
30
103%
0.00
55
324%
Average Sentence for Burglary
BJS
2006
0.00
34
29
85%
Average Sentence for Larceny
BJS
0.00
2006
19
17
89%
Average Sentence for Fraud
0.00
BJS
2006
23
22
96%
Average Sentence for Drug Possession
0.00
BJS
2006
15
17
113%
0.00
Average Sentence for Drug Trafficking
BJS
2006
27
26
96%
0.00
Average Sentence for Weapon Offenses
BJS
2006
24
24
100%
0.00
Average Sentence for Other Offenses
BJS
2006
20
22
110%
0.00
BJS
2006
25
29
86%
0.00
Probation Sentence for Murder, %
BJS
2006
3
4
75%
0.00
Probation Sentence for Sexual Assault, %
BJS
2006
16
16
100%
0.00
Probation Sentence for Robbery, %
BJS
2006
12
15
80%
0.00
Probation Sentence for Burglary, %
BJS
2006
20
25
80%
0.00
Probation Sentence for Fraud, %
BJS
2006
35
35
100%
0.00
Probation Sentence for Drug Offenses, %
BJS
2006
25
34
74%
0.00
Probation Sentence for Weapon Offenses, %
BJS
2006
25
23
109%
0.00
BJS
2013
1,405
256
18%
0.00
Incarceration Rate: Prisoners Per 100,000 People: Male
BJS
2013
2,819
466
17%
0.00
Incarceration Rate: Prisoners Per 100,000 People: Female
BJS
2013
113
51
45%
0.03
FBI, BJS
2012
20.9
7.7
37%
0.00
0.00
Convicted Felons Sentenced to Probation, All Offenses, %
Incarceration Rate: Prisoners Per 100,000
Prisoners as a % of Arrests
VICTIMIZATION & MENTAL ANGUISH (0.20)
Homicide Rate Per 100,000
BJS
2011
17.3
2.8
16%
Homicide Rate Per 100,000: Firearm
NACJD
2012
15.3
2.0
13%
0.02
Homicide Rate Per 100,000: Stabbings
NACJD
2012
1.7
0.6
33%
0.08
Homicide Rate Per 100,000: Personal Weapons
NACJD
2012
0.6
0.3
45%
0.07
Homicide Rate Per 100,000: Male
CDC
2010
33.4
3.3
10%
0.00
Homicide Rate Per 100,000: Female
CDC
2010
5.1
1.7
33%
0.00
Murder Victims, Rate Per 100,000
USDJ
2013
16.0
2.8
17%
0.02
Hate Crimes Victims, Rate Per 100,000
USDJ
2013
6.1
0.4
6%
0.01
BJS
2013
25.1
22.2
88%
0.15
NCJJ
2011
3,979.9
2,008.9
50%
0.11
BJS
2013
4.3
1.0
24%
0.03
0.35
Victims of Violent Crimes, Rate Per 1,000 Persons Age
12 or Older
Delinquency Cases, Year of Disposition, Rate Per 100,000
Prisoners Under Sentence of Death, Rate Per 100,000
High School Students Carrying Weapons on School Property
CDC
2013
3.9
5.7
146%
High School Students Carrying Weapons Anywhere
CDC
2013
12.5
20.8
166%
0.47
Firearm-Related Death Rates Per 100,000: Males, All Ages
CDC
2007
40.4
16.1
40%
0.00
Ages 1–14
CDC
2007
2.4
0.7
29%
0.00
Ages 15–24
CDC
2007
91.5
13.4
15%
0.00
Ages 25–44
CDC
2007
64.8
18.3
28%
0.00
Ages 25–34
CDC
2007
88.1
18.0
20%
0.00
Ages 35–44
CDC
2007
40.7
18.7
46%
0.00
2015 STATE OF BLACK AMERICA¨
SAVE OUR CITIES
NATIONAL URBAN LEAGUE
2015 Equality Index™ : Black–White + 46
Updated
History Revised
Removed Weight in 2014
2015 EQUALITY INDEX OF
BLACK AMERICA
New Series 2014
No New Data
Source
Year
Black
Ages 45–64
CDC
2007
20.1
19.5
97%
0.00
Age 65 and Older
CDC
2007
11.4
27.3
241%
0.00
Firearm-Related Death Rates Per 100,000: Females, All Ages
White
Index
Diff.
(’15–’14)
CDC
2007
4.1
2.9
70%
0.00
Ages 1–14
CDC
2007
0.9
0.3
34%
0.00
Ages 15–24
CDC
2007
7.3
2.5
34%
0.00
Ages 25–44
CDC
2007
6.7
4.1
61%
0.00
Ages 25–34
CDC
2007
7.2
3.4
47%
0.00
Ages 35–44
CDC
2007
6.2
4.6
75%
0.00
Ages 45–64
CDC
2007
2.9
3.9
136%
0.00
Age 65 and Older
CDC
2007
1.3
2.2
172%
0.00
60.6%
0.037
Social Justice Weighted Index
CIVIC ENGAGEMENT (10%)
DEMOCRATIC PROCESS (0.4)
Registered Voters, % of Citizen Population
Census
2012
73.1
73.7
99%
0.00
Actually Voted, % of Citizen Population
Census
2012
66.2
64.1
103%
0.00
Census
2010
0.8
1.0
80%
0.00
BLS
2013
18.5
27.1
68%
(0.08)
COMMUNITY PARTICIPATION (0.3)
Percent of Population Volunteering for Military Reserves, %
Volunteerism, %
Civic and Political
BLS
2013
4.5
5.3
85%
0.06
Educational or Youth Service
BLS
2013
25.8
25.3
102%
0.04
Environmental or Animal Care
BLS
2013
0.5
3.0
17%
(0.26)
Hospital or Other Health
BLS
2013
5.0
7.3
68%
0.04
Public Safety
BLS
2013
0.6
1.2
50%
0.19
Religious
BLS
2013
44.6
32.2
139%
0.13
Social or Community Service
BLS
2013
12.2
15.0
81%
(0.12)
NCES
2000
40.9
32.2
127%
0.00
Unpaid Volunteering of Young Adults
COLLECTIVE BARGAINING (0.2)
Members of Unions, % of Employed
BLS
2013
13.6
11.0
124%
0.03
Represented By Unions, % of Employed
BLS
2013
15.0
12.2
123%
0.03
OPM
2008
1.2
0.8
145%
0.00
EEOC
2009
4.0
2.5
GOVERNMENTAL EMPLOYMENT (0.1)
Federal Executive Branch (Nonpostal) Employment,
% of Adult Population
State and Local Government Employment, %
Civic Engagement Weighted Index
2015 STATE OF BLACK AMERICA¨
SAVE OUR CITIES
158%
0.00
104.0%
(0.007)
NATIONAL URBAN LEAGUE
2015 Equality Index™ : Black–White + 47
SOURCE
ACRONYM
American Community Survey
ACS
U.S. Bureau of Justice Statistics
BJS
U.S. Bureau of Labor Statistics
BLS
College Board
CB
Centers for Disease Control and Prevention
CDC
U.S. Census Bureau
Census
Current Population Survey — Annual Social and Economic Supplement
CPS ASEC
Employee Benefit Research Institute
EBRI
U.S. Equal Employment Opportunity Commission
EEOC
Economic Policy Institute
EPI
The Education Trust
ET
Home Mortgage Disclosure Act
HMDA
Monitoring the Future
MTF
National Archive of Criminal Justice Data
NACJD
National Center for Education Statistics
NCES
National Center for Juvenile Justice
NCJJ
National Telecommunications and Information Administration
NTIA
Office of Personal Management
OPM
SRI International
SRI
Statistical Abstract of the United States
Stat. Ab.
State of Working America
SWA
U.S. Department of Defense
USDD
U.S. Department of Justice
USDJ
2015 STATE OF BLACK AMERICA¨
SAVE OUR CITIES
NATIONAL URBAN LEAGUE
2015 Equality Index™ : Black–White Unemployment Equality + 48
METRO AREA
UNEMPLOYMENT EQUALITY
Black–White
R ANKING OF METRO AREAS
FROM MOST TO LEAST EQUAL
2015
Rank
Black
Rate*
White
Rate*
Black–White
Index
2014
Rank
Black
White
Index
61%
Providence–Warwick, RI–MA
1
13
8.5
65%
7
14.5
8.8
Phoenix–Mesa–Scottsdale, AZ
2
10
6.4
64%
21
14.6
7.4
51%
Austin–Round Rock, TX
3
9.2
5.8
63%
25
11.9
5.9
50%
Riverside–San Bernardino–Ontario, CA
4
18.3
10.8
59%
2
19.2
12.2
64%
Greensboro–High Point, NC
5
13.1
7.7
59%
40
18.5
8.1
44%
Orlando–Kissimmee–Sanford, FL
6
13.4
7.8
58%
19
18.4
9.5
52%
Seattle–Tacoma–Bellevue, WA
7
11.7
6.6
56%
9
12.2
7
57%
Charleston–North Charleston, SC
8
12.4
6.9
56%
29
17.3
8.3
48%
Greenville–Anderson–Mauldin, SC
9
12.4
6.9
56%
17
15.2
8.2
54%
10
10.8
6
56%
14
12.3
6.8
55%
San Diego–Carlsbad, CA
11
14.4
7.9
55%
6
13.5
8.2
61%
Akron, OH
12
15.8
8.5
54%
67
21.9
7.8
36%
Augusta–Richmond County, GA–SC
13
16.5
8.7
53%
1
13.3
8.5
64%
Albany–Schenectady–Troy, NY**
14
12.8
6.7
52%
45
13
7.2
55%
Portland–Vancouver–Hillsboro, OR–WA
15
15.3
8
52%
NA
-
-
-
Omaha–Council Bluffs, NE–IA
16
7.5
3.8
51%
56
13.1
5.1
39%
56%
Nashville–Davidson–Murfreesboro–Franklin, TN
Tampa–St. Petersburg–Clearwater, FL
17
15
7.6
51%
12
17.2
9.6
Little Rock–North Little Rock–Conway, AR
18
11.5
5.8
50%
62
15.3
5.7
37%
Denver–Aurora–Lakewood, CO
19
11.3
5.6
50%
36
14.4
6.5
45%
Baton Rouge, LA
20
11
5.3
48%
72
12.8
4.1
32%
New Haven–Milford, CT
21
15.8
7.6
48%
38
20.4
9.1
45%
58%
Lakeland–Winter Haven, FL
22
18.1
8.7
48%
8
20.7
12.1
Sacramento—Roseville—Arden–Arcade, CA
23
21.4
10.2
48%
35
24.5
11.1
45%
New York–Newark–Jersey City, NY–NJ–PA
24
14.2
6.7
47%
34
15.7
7.2
46%
Columbus, OH
25
11.5
5.4
47%
49
14.6
5.9
40%
New Orleans–Metairie, LA
26
13
6.1
47%
43
15.3
6.6
43%
Miami–Fort Lauderdale–West Palm Beach, FL
27
16
7.5
47%
33
19.4
8.9
46%
44%
Philadelphia–Camden–Wilmington, PA–NJ–DE–MD
28
16
7.5
47%
41
18.3
8
Bridgeport–Stamford–Norwalk, CT
29
17.3
8.1
47%
63
19.6
7.2
37%
Oklahoma City, OK
30
9.9
4.6
46%
18
9
4.7
52%
Raleigh, NC
31
12.5
5.8
46%
37
12.9
5.8
45%
Boston–Cambridge–Newton, MA–NH
32
13.4
6.2
46%
23
13.3
6.7
50%
Los Angeles–Long Beach–Anaheim, CA
33
17.3
8
46%
11
16.8
9.4
56%
Dallas–Fort Worth–Arlington, TX
34
11.7
5.4
46%
22
12.7
6.4
50%
Durham–Chapel Hill, NC
35
12.6
5.8
46%
10
11.4
6.4
56%
2015 STATE OF BLACK AMERICA¨
SAVE OUR CITIES
NATIONAL URBAN LEAGUE
2015 Equality Index™ : Black–White Unemployment Equality + 49
R ANKING OF METRO AREAS
FROM MOST TO LEAST EQUAL
2015
Rank
Black
Rate*
White
Rate*
Black–White
Index
2014
Rank
Black
White
Index
Atlanta–Sandy Springs–Roswell, GA
36
14.8
6.8
Winston–Salem, NC
37
15.9
7.3
46%
30
17
8.1
48%
46%
NA
-
-
Birmingham–Hoover, AL
38
12.9
-
5.9
46%
27
13.7
6.7
49%
Jacksonville, FL
39
Tulsa, OK
40
16.4
7.5
46%
26
19.6
9.6
49%
11.6
5.3
46%
46
15.1
6.3
Las Vegas–Henderson–Paradise, NV
42%
41
21.1
9.6
45%
4
18.8
11.7
Baltimore–Columbia–Towson, MD
62%
42
11.9
5.4
45%
50
15.1
6.1
40%
Charlotte–Concord–Gastonia, NC–SC
43
16.5
7.1
43%
31
16.8
8
48%
Dayton, OH
44
17.5
7.5
43%
28
17.7
8.5
48%
Columbia, SC
45
15.7
6.7
43%
15
14.8
8.1
55%
Louisville/Jefferson County, KY–IN
46
14.6
6.2
42%
32
16.4
7.6
46%
Cincinnati, OH–KY–IN
47
15.6
6.6
42%
47
17.1
7.1
42%
Virginia Beach–Norfolk–Newport News, VA–NC
48
12.7
5.3
42%
24
13.1
6.5
50%
San Antonio–New Braunfels, TX
49
11.1
4.5
41%
20
11.5
5.9
51%
Richmond, VA
50
13.2
5.3
40%
42
13.3
5.8
44%
Chattanooga, TN–GA
51
16.3
6.5
40%
5
14.4
8.8
61%
Houston–The Woodlands–Sugar Land, TX
52
12.6
5
40%
39
14.8
6.5
44%
40%
Kansas City, MO–KS
53
12.6
5
40%
51
16
6.4
Washington–Arlington–Alexandria, DC–VA–MD–WV
54
11.5
4.5
39%
69
12
4.2
35%
Detroit–Warren–Dearborn, MI
55
20.3
7.6
37%
60
24
9
38%
Indianapolis–Carmel–Anderson, IN
56
18
6.7
37%
65
18.8
6.8
36%
Buffalo–Cheektowaga–Niagara Falls, NY
57
17.4
6.3
36%
55
16.1
6.3
39%
Memphis, TN–MS–AR
58
16.2
5.8
36%
54
16.6
6.5
39%
St. Louis, MO–IL
59
17.2
6.1
35%
68
19.6
6.9
35%
Toledo, OH
60
22.6
8
35%
53
23.7
9.4
40%
37%
Pittsburgh, PA
61
18
6.3
35%
64
16.9
6.2
Hartford–West Hartford–East Hartford, CT
62
19.4
6.6
34%
48
17.5
7.1
41%
Rochester, NY
63
18.8
6.2
33%
59
18
6.9
38%
San Francisco–Oakland–Hayward, CA
64
19
6.2
33%
66
18.6
6.7
36%
Chicago–Naperville–Elgin, IL–IN–WI
65
21.4
6.8
32%
70
23
7.6
33%
Minneapolis–St. Paul–Bloomington, MN–WI
66
14.2
4.5
32%
74
18
5.2
29%
Grand Rapids–Wyoming, MI**
67
20.1
6.3
31%
NA
-
-
-
Cleveland–Elyria, OH
68
20.4
6
29%
71
21.2
7
33%
Milwaukee–Waukesha–West Allis, WI
69
17.6
5.1
29%
75
20.1
5.6
28%
Jackson, MS
70
14
3.9
28%
58
15.6
6
38%
* 2013 Unemployment Rate; NA: Not available
** Black is Black or African American alone
*** White is White alone
**** Black is Black or African American alone or in combination with one or more other races, not Hispanic or Latino
Source: Census ACS 2013 1-year estimates (2015 Metro Index) and ACS 2012 1-year estimates (2014 Metro Index);
Black is Black or African American alone, not Hispanic
2015 STATE OF BLACK AMERICA¨
SAVE OUR CITIES
NATIONAL URBAN LEAGUE
2015 Equality Index™ : Black–White Income Equality + 50
METRO AREA
INCOME EQUALITY
Black–White
R ANKING OF METRO AREAS
FROM MOST TO LEAST EQUAL
2015
Rank
Black Income,
Dollars*
White Income,
Dollars*
Black–White
Index
2014
Rank
Black
White
Index
Riverside–San Bernardino–Ontario, CA
1
42,782
60,376
Nashville–Davidson–Murfreesboro–Franklin, TN
2
37,757
56,673
71%
1
45,205
58,065
78%
67%
13
35,708
57,511
62%
San Diego–Carlsbad, CA
3
46,524
70,302
66%
2
48,845
67,359
73%
San Antonio–New Braunfels, TX
4
42,239
65,435
65%
7
43,049
66,595
65%
Lakeland–Winter Haven, FL
5
29,771
46,512
64%
6
29,677
44,639
66%
Tampa–St. Petersburg–Clearwater, FL
6
31,633
49,974
63%
10
31,550
49,109
64%
Oklahoma City, OK
7
34,764
55,219
63%
34
30,646
55,459
55%
Hartford–West Hartford–East Hartford, CT
8
47,491
75,475
63%
55
39,135
76,334
51%
Phoenix–Mesa–Scottsdale, AZ
9
36,851
58,591
63%
8
37,815
58,580
65%
60%
10
36,869
58,672
63%
18
36,124
59,877
Charlotte–Concord–Gastonia, NC–SC
Miami–Fort Lauderdale–West Palm Beach, FL
11
36,630
58,539
63%
26
36,518
63,770
57%
Durham–Chapel Hill, NC
12
39,421
63,364
62%
36
34,553
63,152
55%
63%
Virginia Beach–Norfolk–Newport News, VA–NC
13
40,567
65,475
62%
12
41,478
66,066
Columbia, SC
14
35,890
58,162
62%
14
35,753
57,600
62%
Orlando–Kissimmee–Sanford, FL
15
33,906
55,082
62%
11
34,882
54,526
64%
Greensboro–High Point, NC
16
32,040
52,095
62%
4
32,697
47,847
68%
Atlanta–Sandy Springs–Roswell, GA
17
41,872
68,595
61%
15
42,052
68,150
62%
Austin–Round Rock, TX
18
43,536
71,501
61%
16
43,278
70,227
62%
Boston–Cambridge–Newton, MA–NH
19
48,326
79,700
61%
35
43,844
79,666
55%
Las Vegas–Henderson–Paradise, NV
20
34,168
56,584
60%
5
37,665
55,291
68%
Washington–Arlington–Alexandria, DC–VA–MD–WV
21
64,663
108,254
60%
20
63,617
108,111
59%
Baltimore–Columbia–Towson, MD
22
47,866
80,573
59%
39
44,283
81,630
54%
Raleigh, NC
23
42,357
71,462
59%
25
40,585
70,720
57%
Denver–Aurora–Lakewood, CO
24
41,498
70,593
59%
40
37,992
70,396
54%
58%
Birmingham–Hoover, AL
25
33,013
56,399
59%
22
32,542
55,781
Providence–Warwick, RI–MA
26
35,661
60,975
58%
9
38,609
59,842
65%
Richmond, VA
27
39,144
67,017
58%
24
39,566
68,232
58%
54%
Greenville–Anderson–Mauldin, SC
28
29,269
50,315
58%
41
26,858
49,809
Seattle–Tacoma–Bellevue, WA
29
41,314
71,699
58%
28
40,339
70,992
57%
Columbus, OH
30
33,704
58,582
58%
23
34,835
59,874
58%
59%
Augusta–Richmond County, GA–SC
31
30,421
52,980
57%
21
31,865
54,287
Kansas City, MO–KS
32
35,260
61,783
57%
58
31,316
61,747
51%
Jacksonville, FL
33
32,716
57,430
57%
29
31,057
54,966
57%
Dayton, OH
34
28,967
51,333
56%
33
27,842
49,806
56%
Dallas–Fort Worth–Arlington, TX
35
40,258
71,415
56%
32
40,084
71,672
56%
2015 STATE OF BLACK AMERICA¨
SAVE OUR CITIES
NATIONAL URBAN LEAGUE
2015 Equality Index™ : Black–White Income Equality + 51
R ANKING OF METRO AREAS
FROM MOST TO LEAST EQUAL
2015
Rank
Black Income,
Dollars*
White Income,
Dollars*
Black–White
Index
2014
Rank
Black
White
Index
Little Rock–North Little Rock–Conway, AR
36
31,645
56,445
56%
31
31,711
56,401
56%
Baton Rouge, LA
37
35,477
63,894
56%
46
33,698
63,328
53%
Indianapolis–Carmel–Anderson, IN
38
31,594
57,612
55%
57
31,074
61,142
51%
Winston–Salem, NC
39
26,746
49,451
54%
NA
-
-
-
Chattanooga, TN–GA
40
27,760
51,881
54%
27
27,663
48,644
57%
Akron, OH
41
28,168
53,090
53%
77
22,081
54,751
40%
Sacramento–Roseville–Arden–Arcade, CA
42
33,703
63,529
53%
38
35,725
65,768
54%
Los Angeles–Long Beach–Anaheim, CA
43
40,865
77,133
53%
47
39,643
74,914
53%
Houston–The Woodlands–Sugar Land, TX
44
40,668
76,775
53%
44
40,699
76,269
53%
New York–Newark–Jersey City, NY–NJ–PA
45
44,156
83,457
53%
37
45,105
83,027
54%
52%
New Haven–Milford, CT
46
36,860
70,365
52%
50
36,806
70,605
Portland–Vancouver–Hillsboro, OR–WA
47
32,633
62,474
52%
NA
-
-
-
Pittsburgh, PA
48
27,698
53,227
52%
42
28,593
53,114
54%
52%
Louisville/Jefferson County, KY–IN
49
28,810
55,463
52%
53
27,747
53,745
Philadelphia–Camden–Wilmington, PA–NJ–DE–MD
50
36,802
71,916
51%
60
36,500
72,132
51%
Tulsa, OK
51
26,996
52,949
51%
49
27,678
52,859
52%
St. Louis, MO–IL
52
31,214
61,254
51%
66
28,905
60,453
48%
Jackson, MS
53
29,103
57,937
50%
62
30,531
60,703
50%
Memphis, TN–MS–AR
54
31,945
63,611
50%
43
32,024
59,654
54%
Detroit–Warren–Dearborn, MI
55
30,152
60,079
50%
61
29,400
58,350
50%
49%
Rochester, NY
56
28,468
57,048
50%
65
27,596
55,783
Cincinnati, OH–KY–IN
57
28,601
58,779
49%
74
24,617
58,297
42%
Chicago–Naperville–Elgin, IL–IN–WI
58
34,320
71,910
48%
67
34,152
71,897
48%
43%
Buffalo–Cheektowaga–Niagara Falls, NY
59
26,136
55,626
47%
72
24,508
56,432
Cleveland–Elyria, OH
60
26,627
57,108
47%
70
25,100
55,866
45%
New Orleans–Metairie, LA
61
27,893
60,070
46%
63
29,747
59,145
50%
Charleston–North Charleston, SC
62
29,799
64,553
46%
51
31,578
60,733
52%
Omaha–Council Bluffs, NE–IA
63
27,716
60,529
46%
68
28,451
59,933
47%
Grand Rapids–Wyoming, MI
64
25,495
56,106
45%
NA
-
-
-
Milwaukee–Waukesha–West Allis, WI
65
27,425
62,031
44%
75
26,503
62,982
42%
Minneapolis–St. Paul–Bloomington, MN–WI
66
31,713
72,014
44%
78
29,193
72,389
40%
Toledo, OH
67
21,699
49,333
44%
73
21,352
49,445
43%
Bridgeport–Stamford–Norwalk, CT
68
42,111
98,697
43%
76
40,206
99,041
41%
Albany–Schenectady–Troy, NY**
69
26,714
63,491
42%
45
34,096
63,934
53%
San Francisco–Oakland–Hayward, CA
70
39,902
95,285
42%
69
41,332
91,736
45%
* Median Household Income, 2013 Dollars; NA: Not available
** Black is Black or African American alone, not Hispanic
Source: Census ACS 2013 1-year estimates (unless otherwise noted)
2015 STATE OF BLACK AMERICA¨
SAVE OUR CITIES
NATIONAL URBAN LEAGUE
2015 Equality Index™ : Hispanic–White + 52
2015 STATE OF BLACK AMERICA©
SAVE OUR CITIES
NATIONAL URBAN LEAGUE
2015 Equality Index™ : Hispanic–White + 53
Updated
Reincluded Weight in 2014
History Revised
2015 EQUALITY INDEX OF
HISPANIC AMERICA
New Series 2014
Source
No New Data
Year
Hispanic
White
Total Equality Weighted Index
Index
Diff.
(’15–’14)
77.7%
0.019
ECONOMICS (30%)
MEDIAN INCOME (0.25)
Median Household Income (Real), Dollars
ACS
2013
41,508
57,684
72%
0.005
Median Male Earnings, Dollars
ACS
2013
31,596
52,452
60%
(0.00)
Median Female Earnings, Dollars
ACS
2013
28,526
41,010
70%
0.01
POVERTY (0.15)
Population Living Below Poverty Line, %
ACS
2013
24.8
11.1
45%
0.01
Population Living Below 50% of Poverty Line, %
ACS
2013
9.7
5.0
52%
0.03
ACS
2013
32.8
14.7
45%
0.01
Population Living Below Poverty Line (Under 18), %
Population Living Below 125% of Poverty Line, %
CPS ASEC
2013
30.4
10.7
35%
(0.01)
Population Living Below Poverty Line (18–64), %
CPS ASEC
2013
20.2
9.9
49%
0.04
Population Living Below Poverty Line (65 and Older), %
CPS ASEC
2013
19.8
7.4
37%
0.04
BLS
2014
7.4
5.3
72%
0.00
EMPLOYMENT ISSUES (0.20)
Unemployment Rate, %
Unemployment Rate: Male, %
BLS
2014
6.8
5.4
79%
0.02
Unemployment Rate: Female, %
BLS
2014
8.2
5.2
63%
(0.02)
Unemployment Rate Persons Ages 16 to 19, %
BLS
2014
22.5
17.3
77%
0.03
Percent Not in Workforce: Ages 16 to 19, %
BLS
2014
69.7
63.8
92%
0.00
Percent Not in Workforce: Ages 16 and Older, %
BLS
2014
33.9
36.9
109%
0.01
Labor Force Participation Rate, %
BLS
2014
66.1
63.1
105%
0.01
LFPR 16 to 19, %
BLS
2014
30.3
36.2
84%
(0.00)
LFPR 20 to 24, %
BLS
2014
71.4
73.0
98%
(0.00)
LFPR Over 25: Less Than High School Grad, %
BLS
2014
59.8
46.2
129%
(0.01)
LFPR Over 25: High School Grad., No College, %
BLS
2014
69.8
57.6
121%
0.01
LFPR Over 25: Some College, No Degree, %
BLS
2014
75.2
63.6
118%
0.02
LFPR Over 25: Associate's Degree, %
BLS
2014
77.5
70.8
109%
0.03
0.02
LFPR Over 25: Some College or Associate Degree, %
BLS
2014
76.0
66.3
115%
LFPR Over 25: College Grad., %
BLS
2014
80.2
74.3
108%
0.01
BLS
2014
61.2
59.7
103%
0.02
Employment to Pop. Ratio, %
HOUSING & WEALTH (0.34)
Home Ownership Rate, %
Census
2013
46.1
73.3
63%
0.00
Mortgage Application Denial Rate (Total), %
HMDA
2013
23.2
12.0
52%
(0.02)
Mortgage Application Denial Rate (Male), %
HMDA
2013
23.4
14.0
60%
(0.03)
Mortgage Application Denial Rate (Female), %
HMDA
2013
24.1
13.9
58%
(0.02)
Mortgage Application Denial Rate (Joint), %
HMDA
2013
21.8
9.8
45%
(0.01)
Home Improvement Loans Denials (Total), %
HMDA
2013
54.2
30.8
57%
0.01
Home Improvement Loans Denials (Male), %
HMDA
2013
55.8
36.5
65%
0.00
Home Improvement Loans Denials (Female), %
HMDA
2013
59.1
38.2
65%
0.00
Home Improvement Loans Denials (Joint), %
HMDA
2013
44.1
22.6
51%
0.02
2015 STATE OF BLACK AMERICA¨
SAVE OUR CITIES
NATIONAL URBAN LEAGUE
2015 Equality Index™ : Hispanic–White + 54
Updated
Reincluded Weight in 2014
History Revised
2015 EQUALITY INDEX OF
HISPANIC AMERICA
New Series 2014
No New Data
Source
Year
Hispanic
White
Index
Diff.
(’15–’14)
HMDA
2012
8.5
3.2
37%
(0.00)
Median Home Value, 2000 Dollars
Census
2000
105,600
123,400
86%
0.00
Median Wealth, 2010 Dollars
Census
SIPP
2011
7,683
110,500
7%
0.00
Equity in Home, Dollars
Census
SIPP
2011
47,000
85,000
55%
0.05
Percent Investing in 401(K), %
EBRI
2009
18.0
36.9
49%
0.00
Percent Investing in IRA, %
EBRI
2009
6.0
25.6
23%
0.00
Census
2007
Percent of High-Priced Loans (More Than 3%
Above Treasury)
U.S. Firms By Race (% Compared to Employment Share)
83.4
DIGITAL DIVIDE (0.05)
Households With Computer at Home, %
Census
2013
79.7
85.4
93%
0.13
Households With the Internet, %
Census
2013
66.7
77.4
86%
0.10
Adult Users With Broadband Access, %
Census
2013
65.9
76.2
86%
0.11
TRANSPORTATION (0.01)
Census
2011
77.3
88.3
88%
0.00
Means of Transportation to Work: Drive Alone, %
Car Ownership, %
ACS
2013
68.9
79.9
86%
0.00
Means of Transportation to Work: Public Transportation, %
ACS
2013
7.7
3.1
Economic Weighted Index
41%
0.03
61.7%
0.011
HEALTH (25%)
DEATH RATES & LIFE EXPECTANCY (0.45)
Life Expectancy at Birth
Male
Female
CDC
2011
81.4
78.8
103%
0.00
CDC
2011
78.8
76.4
103%
0.00
CDC
2011
83.7
81.1
103%
(0.00)
CDC
2011
20.7
19.1
108%
0.01
Male at 65
CDC
2011
19.1
17.8
107%
0.01
Female at 65
CDC
2011
21.8
20.3
107%
(0.01)
CDC
2012
539.1
754.3
140%
0.05
Age-Adjusted Death Rates (Per 100,000): Male
CDC
2012
643.9
876.2
136%
0.04
Age-Adjusted Death Rates (Per 100,000): Female
CDC
2012
452.5
637.6
141%
0.02
CDC
2012
122.0
172.3
141%
0.06
Life Expectancy at 65 (Additional Expected Years)
Age-Adjusted Death Rates (Per 100,000): All Causes
Age-Adjusted Death Rates (Per 100,000): Heart Disease
CDC
2012
81.1
107.4
132%
0.08
Age-Adjusted Death Rates (Per 100,000): Stroke
(Cerebrovascular)
Ischemic Heart Disease
CDC
2012
30.0
35.8
119%
0.02
Age-Adjusted Death Rates (Per 100,000): Cancer
(0.02)
CDC
2012
116.9
170.6
146%
Trachea, Bronchus, and Lung
CDC
2012
19.2
48.0
250%
0.01
Colon, Rectum, and Anus
CDC
2012
11.7
14.7
126%
(0.00)
Prostate (Male)
CDC
2012
16.3
18.1
111%
0.01
Breast (Female)
CDC
2012
14.7
21.3
145%
(0.09)
CDC
2012
18.5
46.3
250%
0.13
Age-Adjusted Death Rates (Per 100,000):
Chronic Lower Respiratory
2015 STATE OF BLACK AMERICA¨
SAVE OUR CITIES
NATIONAL URBAN LEAGUE
2015 Equality Index™ : Hispanic–White + 55
Updated
Reincluded Weight in 2014
History Revised
2015 EQUALITY INDEX OF
HISPANIC AMERICA
New Series 2014
No New Data
Source
Year
Hispanic
White
Index
Diff.
(’15–’14)
Age-Adjusted Death Rates (Per 100,000): Influenza
and Pneumonia
CDC
2012
12.0
14.4
120%
0.11
Age-Adjusted Death Rates (Per 100,000): Chronic Liver
Disease and Cirrhosis
CDC
2012
14.1
10.0
71%
0.02
Age-Adjusted Death Rates (Per 100,000): Diabetes
CDC
2012
26.9
18.5
69%
0.02
Age-Adjusted Death Rates (Per 100,000): HIV
CDC
2012
2.2
1.0
45%
0.06
CDC
2012
26.5
43.9
166%
0.01
CDC
2012
10.2
12.1
119%
(0.05)
Unintentional Injuries
Motor Vehicle-Related Injuries
Age-Adjusted Death Rates (Per 100,000): Suicide
CDC
2012
5.8
15.7
271%
0.16
Age-Adjusted Death Rates (Per 100,000): Suicide Males
CDC
2012
9.5
25.2
265%
0.21
Death Rates (Per 100,000): Suicide Males Ages 15–24
CDC
2012
11.4
21.2
186%
(0.05)
Age-Adjusted Death Rates (Per 100,000): Suicide Females
CDC
2012
2.2
6.9
314%
0.18
CDC
2012
2.9
5.1
176%
0.34
Age-Adjusted Death Rates (Per 100,000): Homicide
CDC
2012
4.9
2.6
53%
0.06
Age-Adjusted Death Rates (Per 100,000): Homicide Male
CDC
2012
7.9
3.5
44%
0.06
CDC
2012
17.0
3.9
23%
0.02
CDC
2012
1.8
1.7
94%
(0.06)
CDC
2012
2.2
1.7
77%
0.08
Death Rates (Per 100,000) By Age Cohort: <1 Male
CDC
2012
509.1
558.2
110%
0.06
Death Rates (Per 100,000) By Age Cohort: 1–4 Male
CDC
2012
23.5
27.9
119%
0.09
Death Rates (Per 100,000) By Age Cohort: 5–14 Male
CDC
2012
12.3
13.3
108%
(0.17)
Death Rates (Per 100,000) By Age Cohort: 15–24 Male
CDC
2012
76.4
92.0
120%
0.03
Death Rates (Per 100,000) By Age Cohort: 25–34 Male
CDC
2012
100.0
149.0
149%
0.07
Death Rates (Per 100,000) By Age Cohort: 35–44 Male
CDC
2012
142.7
221.7
155%
0.05
0.04
Death Rates (Per 100,000): Suicide Females
Ages 15–24
Death Rates (Per 100,000): Homicide Males Ages 15–24
Age-Adjusted Death Rates (Per 100,000):
Homicide Female
Death Rates (Per 100,000): Homicide Females
Ages 15–24
Death Rates (Per 100,000) By Age Cohort: 45–54 Male
CDC
2012
342.7
508.0
148%
Death Rates (Per 100,000) By Age Cohort: 55–64 Male
CDC
2012
816.3
1,058.0
130%
0.01
Death Rates (Per 100,000) By Age Cohort: 65–74 Male
CDC
2012
1,679.1
2,175.8
130%
0.02
Death Rates (Per 100,000) By Age Cohort: 75–84 Male
CDC
2012
4,250.9
5,599.2
132%
0.02
Death Rates (Per 100,000) By Age Cohort: 85+ Male
CDC
2012
10,799.6
15,504.4
144%
0.09
Death Rates (Per 100,000) By Age Cohort: <1 Female
CDC
2012
428.9
469.2
109%
0.06
Death Rates (Per 100,000) By Age Cohort: 1–4 Female
CDC
2012
20.0
21.7
109%
0.01
Death Rates (Per 100,000) By Age Cohort: 5–14 Female
CDC
2012
10.0
10.1
101%
(0.21)
Death Rates (Per 100,000) By Age Cohort: 15–24 Female
CDC
2012
25.5
37.8
148%
0.02
Death Rates (Per 100,000) By Age Cohort: 25–34 Female
CDC
2012
40.0
70.7
177%
0.05
Death Rates (Per 100,000) By Age Cohort: 35–44 Female
CDC
2012
73.6
136.0
185%
0.08
Death Rates (Per 100,000) By Age Cohort: 45–54 Female
CDC
2012
192.0
315.2
164%
0.05
Death Rates (Per 100,000) By Age Cohort: 55–64 Female
CDC
2012
442.8
635.9
144%
0.03
Death Rates (Per 100,000) By Age Cohort: 65–74 Female
CDC
2012
1,046.7
1,480.2
141%
(0.00)
Death Rates (Per 100,000) By Age Cohort: 75–84 Female
CDC
2012
3,063.5
4,178.1
136%
(0.02)
Death Rates (Per 100,000) By Age Cohort: 85+Female
CDC
2012
9,805.6
13,437.0
137%
0.05
2015 STATE OF BLACK AMERICA¨
SAVE OUR CITIES
NATIONAL URBAN LEAGUE
2015 Equality Index™ : Hispanic–White + 56
Updated
Reincluded Weight in 2014
History Revised
2015 EQUALITY INDEX OF
HISPANIC AMERICA
New Series 2014
Source
No New Data
Year
Hispanic
White
Index
Diff.
(’15–’14)
PHYSICAL CONDITION (0.10)
Overweight: 18+ Years, % of Population
CDC
2013
37.1
35.8
96%
0.04
Overweight: Men 20 Years and Over, % of Population
CDC
2009–2012
41.3
38.7
94%
0.05
Overweight: Women 20 Years and Over, % of Population
CDC
2009–2012
33.5
28.6
85%
0.02
Obese, % of Population
CDC
2013
31.2
26.4
85%
(0.07)
Obese: Men 20 Years and Over, % of Population
CDC
2009–2012
38.0
34.0
89%
(0.06)
Obese: Women 20 Years and Over, % of Population
CDC
2009–2012
42.4
32.4
76%
(0.02)
Diabetes: Physician Diagnosed in Ages 20+,
% of Population
CDC
2009–2012
12.5
6.6
53%
(0.08)
AIDS Cases Per 100,000 Males Ages 13+
CDC
2012
22.1
7.1
32%
(0.01)
AIDS Cases Per 100,000 Females Ages 13+
CDC
2012
4.7
1.2
26%
0.02
Binge Alcohol (5 Drinks in 1 Day, 1X a Year) Ages 18+,
% of Population
CDC
2012
21.0
27.8
132%
0.09
Use of Illicit Drugs in the Past Month Ages 12+,
% of Population
CDC
2012
8.3
9.2
111%
0.00
Tobacco: Both Cigarette & Cigar Ages 12+, % of Population
CDC
2012
19.2
29.2
152%
0.00
SUBSTANCE ABUSE (0.10)
MENTAL HEALTH (0.02)
Students Who Consider Suicide: Male, %
CDC
2011
12.6
12.8
102%
0.00
Students Who Carry Out Intent and Require Medical
Attention: Male, %
CDC
2007
1.8
0.9
50%
(0.18)
Students That Act on Suicidal Feeling: Male, %
CDC
2007
6.3
3.4
54%
(0.13)
Students Who Consider Suicide: Female, %
CDC
2011
21.0
18.4
88%
0.00
Students Who Carry Out Intent and Require Medical
Attention: Female, %
CDC
2007
3.9
2.1
54%
0.00
Students That Act on Suicidal Feeling: Female, %
CDC
2007
14.0
7.7
55%
(0.04)
Private Insurance Payment for Health Care:
Under 65 Years Old, % of Distribution
CPS ASEC
2013
46.6
75.0
62%
0.04
People Without Health Insurance, % of Population
CPS ASEC
2013
24.3
11.1
46%
0.08
People 18 to 64 Without a Usual Source of Health
Insurance, % of Adults
CPS ASEC
2013
33.2
15.4
46%
0.08
People 18 to 64 and in Poverty Without a Usual Source
of Health Insurance, % of Adults
CPS ASEC
2013
46.3
33.0
71%
0.04
Population Under 65 Covered By Medicaid,
% of Population
CPS ASEC
2013
29.9
13.0
43%
(0.01)
ACCESS TO CARE (0.05)
ELDERLY HEALTH CARE (0.03)
Population Over 65 Covered By Medicaid, % of Population
Medicare Expenditures Per Beneficiary, Dollars
CPS ASEC
2013
17.7
4.2
24%
(0.00)
CDC
2010
14,029
16,474
117%
0.10
PREGNANCY ISSUES (0.04)
Prenatal Care Begins in 1st Trimester
CDC
2011
82.6
85.7
96%
0.03
Prenatal Care Begins in 3rd Trimester
CDC
2007
6.2
2.3
37%
0.00
Percent of Births to Mothers 18 and Under
CDC
2012
3.9
1.4
36%
(0.00)
Percent of Live Births to Unmarried Mothers
CDC
2012
53.5
29.3
55%
0.00
Infant Mortality Rates Among Mothers With Less Than
12 Years Education
CDC
2005
5.2
9.3
179%
0.00
2015 STATE OF BLACK AMERICA¨
SAVE OUR CITIES
NATIONAL URBAN LEAGUE
2015 Equality Index™ : Hispanic–White + 57
Updated
Reincluded Weight in 2014
History Revised
2015 EQUALITY INDEX OF
HISPANIC AMERICA
New Series 2014
No New Data
Source
Year
Hispanic
White
Index
Diff.
(’15–’14)
Infant Mortality Rates Among Mothers With
12 Years Education
CDC
2005
5.4
7.1
131%
0.00
Infant Mortality Rates Among Mothers With
13 or More Years Education
CDC
2005
4.6
4.1
89%
0.00
Mothers Who Smoked Cigarettes During Pregnancy, %
CDC
2011
2.1
22.0
1048%
5.18
Low Birth Weight, % of Live Births
CDC
2012
7.0
7.0
100%
(0.02)
Very Low Birth Weight, % of Live Births
CDC
2012
1.2
1.1
93%
(0.04)
REPRODUCTION ISSUES (0.01)
Abortions, Per 1,000 Live Births
CDC
2007
193.0
159.0
82%
0.00
Women Using Contraception, % of Population
CDC
2006–2010
59.7
65.6
91%
0.00
(0.00)
DELIVERY ISSUES (0.10)
All Infant Deaths: Neonatal and Post, Per 1,000 Live Births
CDC
2010
5.3
5.2
98%
Neonatal Deaths, Per 1,000 Live Births
CDC
2010
3.6
3.4
94%
0.02
Post Neonatal Deaths, Per 1,000 Live Births
CDC
2010
1.7
1.8
106%
(0.05)
CDC
2007
7.2
8.1
113%
0.00
Maternal Mortality, Per 100,000 Live Births
CHILDREN’S HEALTH (0.10)
Babies Breastfed, %
CDC
2011
83.8
81.1
103%
(0.02)
Children Without a Health Care Visit in Past 12 Months
(Up to 6 Years Old), %
CDC
2011–2012
6.0
4.2
70%
0.18
Vaccinations of Children Below Poverty: Combined Vacc.
Series 4:3:1:3:1:4, % of Children 19–35 Months
CDC
2012
68.0
58.0
117%
0.04
Uninsured Children, %
CPS ASEC
2013
11.7
5.3
45%
(0.01)
CDC
2009–2012
25.0
12.9
52%
(0.25)
Overweight Girls 6–11 Years Old, % of Population
CDC
2009–2012
23.1
14.2
61%
(0.01)
AIDS Cases Per 100,000 All Children Under 13
CDC
2012
0.0
0.0
30%
0.00
106.9%
0.045
Overweight Boys 6–11 Years Old, % of Population
Health Weighted Index
EDUCATION (25%)
QUALITY (0.25)
TEACHER QUALITY (0.10)
Middle Grades: Teacher Lacking at Least a College Minor
in Subject Taught (High Vs. Low Minority Schools), %
ET
2000
49.0
40.0
85%
0.00
HS: Teacher Lacking an Undergraduate Major in Subject
Taught (High Vs. Low Poverty Secondary Schools), %
ET
2007–2008
21.9
10.9
88%
0.00
Per Student Funding (High [30%] Vs. Low [0%] Poverty
Districts), Dollars
SFF
2009
10,948
10,684
102%
0.00
NCES
2007–2008
15.0
10.0
67%
0.00
SRI
2008–2009
5.0
1.0
20%
0.00
NCES
2004
50.1
61.5
81%
0.00
ET
1999
79.0
86.0
92%
(0.03)
Teachers With < 3 Years Experience (High Vs. Low
Minority Schools), %
Distribution of Underprepared Teachers (High Vs. Low
Minority Schools), % (California Only)
COURSE QUALITY (0.15)
College Completion, % of All Entrants
College Completion, % of Entrants With Strong HS
Curriculum (Algebra II Plus Other Courses)
2015 STATE OF BLACK AMERICA¨
SAVE OUR CITIES
NATIONAL URBAN LEAGUE
2015 Equality Index™ : Hispanic–White + 58
Updated
Reincluded Weight in 2014
History Revised
2015 EQUALITY INDEX OF
HISPANIC AMERICA
New Series 2014
No New Data
Source
Year
Hispanic
White
Index
HS Students: Enrolled in Chemistry, %
NCES
2009
HS Students: Enrolled in Algebra II, %
NCES
2009
65.7
71.5
92%
0.00
71.4
77.4
92%
(0.00)
Students Taking: Precalculus, %
NCES
Students Taking: Calculus, %
NCES
2009
26.5
37.9
70%
0.00
2009
8.6
17.5
49%
Students Taking: Physics, %
0.00
NCES
2009
28.6
37.6
76%
0.00
CB
2009
35.0
43.0
81%
0.00
Graduation Rates, 2-Year Institutions Where Students
Started as Full Time, First Time Students, %
NCES
2006
32.8
32.0
103%
0.00
Graduation Rates, 4-Year Institutions Where Students
Started as Full Time, First Time Students, %
NCES
2003
46.2
59.3
78%
0.00
0.00
Students Taking: English Composition, %
Diff.
(’15–’14)
ATTAINMENT (0.20)
NCAA Div. I College Freshmen Graduating Within 6 Years, %
NCAA
2005
42.0
52.0
81%
Degrees Earned: Associate, % of Population Aged 18–24 Yrs
NCES
2012–2013
2.4
3.5
69%
0.03
Degrees Earned: Bachelor's, % of Population Aged 18–29 Yrs
NCES
2012–2013
1.7
4.1
42%
0.03
Degrees Earned: Master's, % of Population Aged 18–34 Yrs
NCES
2012–2013
0.3
1.1
32%
0.02
Educational Attainment: at Least High School
(25 Yrs. and Over), % of Population
Census
2013
66.2
92.9
71%
0.01
Educational Attainment: at Least Bachelor's
(25 Yrs. and Over), % of Population
Census
2013
15.0
35.2
43%
0.01
Degrees Conferred, % Distribution, By Field
Agriculture/Forestry
NCES
2012
0.8
1.7
48%
0.00
Art/Architecture
NCES
2012
0.8
0.7
119%
0.00
Business/Management
NCES
2012
20.6
18.9
108%
0.00
Communications
NCES
2012
3.7
3.9
97%
0.00
Computer and Information Sciences
NCES
2012
2.1
2.1
101%
0.00
0.00
Education
NCES
2012
9.2
12.6
73%
Engineering
NCES
2012
4.2
4.9
86%
0.00
English/Literature
NCES
2012
2.5
2.7
89%
0.00
Foreign Languages
NCES
2012
2.1
1.0
211%
0.00
Health Sciences
NCES
2012
8.7
11.9
73%
0.00
Liberal Arts/Humanities
NCES
2012
2.3
1.9
121%
0.00
Mathematics/Statistics
NCES
2012
0.7
0.9
76%
0.00
Natural Sciences
NCES
2012
4.8
5.4
88%
0.00
Philosophy/Religion/Theology
NCES
2012
0.5
0.6
80%
0.00
Psychology
NCES
2012
7.0
5.2
136%
0.00
Social Sciences/History
NCES
2012
9.3
7.5
123%
0.00
Other Fields
NCES
2012
22.9
19.2
119%
0.04
NCES
2005
26.0
46.8
55%
0.00
SCORES (0.25)
PRESCHOOL 10% OF TOTAL SCORES (0.015)
Children’s School Readiness Skills (Ages 3–5),
% With 3 or 4 Skills*
*Recognizes all letters, counts to 20 or higher, writes name,
reads or pretends to read
2015 STATE OF BLACK AMERICA¨
SAVE OUR CITIES
NATIONAL URBAN LEAGUE
2015 Equality Index™ : Hispanic–White + 59
Updated
Reincluded Weight in 2014
History Revised
2015 EQUALITY INDEX OF
HISPANIC AMERICA
New Series 2014
Source
No New Data
Year
Hispanic
White
Index
Diff.
(’15–’14)
ELEMENTARY 40% OF TOTAL SCORES (0.06)
Average Scale Score in U.S. History, 8th Graders
NCES
2010
252
274
92%
0.00
Average Scale Score in U.S. History, 4th Graders
NCES
2010
198
224
88%
0.00
Average Scale Score in Math, 8th Graders
NCES
2013
272
294
93%
0.00
Average Scale Score in Math, 4th Graders
NCES
2013
231
250
92%
0.00
Average Scale Score in Reading, 8th Graders
NCES
2013
255
276
92%
(0.00)
Average Scale Score in Reading, 4th Graders
NCES
2013
206
232
89%
(0.00)
Average Scale Score in Science, 8th Graders
NCES
2011
137
163
84%
0.00
Average Scale Score in Science, 4th Graders
NCES
2009
131
163
80%
0.00
Average Scale Score (out of 300) in Writing, 8th Graders
NCES
2011
69
158
44%
(0.42)
Science Proficiency at or Above Proficient, 8th Graders,
% of Students
NCES
2002
77
43
178%
1.40
Science Proficiency at or Above Proficient, 4th Graders,
% of Students
NCES
2009
14
47
29%
0.00
Reading Proficiency at or Above Proficient, 8th Graders,
% of Students
NCES
2013
22
48
46%
0.00
Reading Proficiency at or Above Proficient, 4th Graders,
% of Students
NCES
2013
19
45
42%
0.00
Math Proficiency at or Above Proficient, 8th Graders,
% of Students
NCES
2013
21
44
48%
0.00
Math Proficiency at or Above Proficient, 4th Graders,
% of Students
NCES
2013
26
54
48%
0.00
Writing Proficiency at or Above Proficient, 8th Graders,
% of Students
NCES
2011
14
34
41%
0.00
Writing Proficiency at or Above Proficient, 4th Graders,
% of Students
NCES
2013
19
45
42%
0.00
Writing Proficiency at or Above Basic, 12th Graders,
% of Students
NCES
2011
66
86
77%
0.00
Average Scale Score (out of 300) in Science, 12th Graders
NCES
2005
128
156
82%
0.00
Average Scale Score (out of 500) in U.S. History, 12th Graders
NCES
2010
275
296
93%
0.00
Average Scale Score (out of 500) in Reading, 12th Graders
NCES
2013
276
296
93%
0.01
High School GPAs for Those Taking The SAT
CB
2009
3.2
3.4
93%
0.00
SAT Reasoning Test: Mean Scores
CB
2014
1,353
1,576
86%
(0.00)
CB
2014
459
534
86%
(0.00)
HIGH SCHOOL 50% OF TOTAL SCORES (0.075)
Mathematics, Joint
Mathematics, Male
CB
2014
476
552
86%
(0.01)
Mathematics, Female
CB
2014
445
519
86%
(0.00)
Critical Reading, Joint
CB
2014
451
527
86%
0.00
Critical Reading, Male
CB
2014
455
530
86%
(0.00)
Critical Reading, Female
CB
2014
447
525
85%
0.00
CB
2014
443
515
86%
0.00
CB
2014
438
508
86%
(0.00)
CB
2014
446
521
86%
0.00
ACT
2013
18.9
22.2
85%
0.00
Writing, Joint
Writing, Male
Writing, Female
ACT: Average Composite Score
2015 STATE OF BLACK AMERICA¨
SAVE OUR CITIES
NATIONAL URBAN LEAGUE
2015 Equality Index™ : Hispanic–White + 60
Updated
Reincluded Weight in 2014
History Revised
2015 EQUALITY INDEX OF
HISPANIC AMERICA
New Series 2014
No New Data
Source
Year
Hispanic
White
Index
Diff.
(’15–’14)
(0.00)
ENROLLMENT (0.10)
School Enrollment: ages 3–34, % of Population
Census
2013
55.5
54.7
101%
Preprimary School Enrollment
Census
2013
57.4
66.9
86%
(0.01)
3 and 4 Years Old
Census
2013
45.4
57.4
79%
(0.03)
5 and 6 Years Old
Census
2013
93.9
93.6
100%
0.02
7 to 13 Years Old
Census
2013
98.0
98.2
100%
(0.01)
14 and 15 Years Old
Census
2013
98.3
98.4
100%
(0.00)
16 and 17 Years Old
Census
2013
93.9
93.6
100%
0.02
18 and 19 Years Old
Census
2013
59.3
69.6
85%
(0.14)
20 and 21 Years Old
Census
2013
43.9
55.2
80%
(0.09)
22 to 24 Years Old
Census
2013
26.7
29.1
92%
0.02
25 to 29 Years Old
Census
2013
10.4
12.9
81%
0.16
30 to 34 Years Old
Census
2013
5.7
6.5
88%
(0.06)
35 and Over
Census
2013
1.9
1.6
122%
0.09
Census
2013
8.1
6.9
118%
(0.06)
14 to 17 Years Old
Census
2013
1.2
2.1
56%
(0.49)
18 to 19 Years Old
Census
2013
38.5
51.2
75%
(0.14)
20 to 21 Years Old
Census
2013
40.8
53.5
76%
(0.10)
22 to 24 Years Old
Census
2013
25.6
28.9
89%
0.02
25 to 29 Years Old
Census
2013
9.7
12.7
76%
0.17
30 to 34 Years Old
Census
2013
5.2
6.4
81%
(0.10)
35 Years Old and Over
College Enrollment (Graduate or Undergraduate):
Ages 14 and Over, % of Population
Census
2013
1.6
1.6
106%
0.07
College Enrollment Rate As a Percent of All 18- to
24-Year-Old High School Completers, %
NCES
2011
34.8
44.7
78%
0.00
Adult Education Participation, % of Adult Population
NCES
2004–2005
38.0
46.0
83%
0.00
High School Dropouts: Status Dropouts, % (Not Completed
HS and Not Enrolled, Regardless of When Dropped Out)
Census
2012
12.7
9.1
72%
0.28
Children in Poverty, %
Census
2013
30.4
12.3
40%
0.04
Children in All Families Below Poverty Level, %
Census
2013
30.0
11.8
39%
0.04
Children in Families Below Poverty Level
(Female Householder, No Spouse Present), %
Census
2013
52.2
36.5
70%
0.03
STUDENT STATUS & RISK FACTORS (0.10)
Children With No Parent in the Labor Force, %
AECF
2013
39.0
24.0
62%
(0.02)
Census
2013
3.9
4.1
106%
(0.02)
Public School Students (K–12): Repeated Grade, %
NCES
2007
11.8
8.7
74%
0.00
Public School Students (K–12): Suspended, %
NCES
2003
10.4
8.8
85%
0.00
Public School Students (K–12): Expelled, %
NCES
2003
1.4
1.4
100%
0.00
Center-Based Child Care of Preschool Children, %
NCES
2005
43.4
59.1
136%
0.00
Children (Under 18) With a Disability, %
Parental Care Only of Preschool Children, %
NCES
2005
38.0
24.1
158%
0.00
Teacher Stability: Remained in Public School,
High Vs. Low Minority Schools, %
NCES
2009
83.4
85.6
97%
0.00
Teacher Stability: Remained in Private School,
High Vs. Low Minority Schools, %
NCES
2009
77.0
78.9
98%
0.00
2015 STATE OF BLACK AMERICA¨
SAVE OUR CITIES
NATIONAL URBAN LEAGUE
2015 Equality Index™ : Hispanic–White + 61
Updated
Reincluded Weight in 2014
History Revised
2015 EQUALITY INDEX OF
HISPANIC AMERICA
New Series 2014
Source
Year
Zero Days Missed in School Year, % of 10th Graders
NCES
2002
3+ Days Late to School, % of 10th Graders
NCES
2002
Never Cut Classes, % of 10th Graders
NCES
2002
No New Data
Hispanic
White
Index
16.5
12.1
137%
0.00
46.1
44.4
96%
0.00
64.6
70.3
92%
0.00
Diff.
(’15–’14)
Home Literacy Activities (Age 3 to 5)
Read to 3 or More Times a Week
NCES
2007
67.6
90.6
75%
0.00
Told a Story at Least Once a Month
NCES
2007
74.6
53.3
140%
0.47
Taught Words or Numbers Three or More Times a Week
NCES
2007
86.3
75.7
114%
0.16
Visited a Library at Least Once in Last Month
NCES
2007
27.0
40.8
66%
0.00
74.6%
0.013
0.00
Education Weighted Index
SOCIAL JUSTICE (10%)
EQUALITY BEFORE THE LAW (0.70)
Stopped While Driving, %
BJS
2008
9.1
8.4
92%
Speeding
BJS
2002
44.4
57.0
128%
0.00
Vehicle Defect
BJS
2002
14.0
8.7
62%
0.00
Roadside Check for Drinking Drivers
BJS
2002
1.6
1.3
81%
0.00
Record Check
BJS
2002
7.8
11.3
145%
0.00
Seatbelt Violation
BJS
2002
5.5
4.4
80%
0.00
Illegal Turn/Lane Change
BJS
2002
5.7
4.5
79%
0.00
Stop Sign/Light Violation
BJS
2002
11.2
6.5
58%
0.00
Other
BJS
2002
6.2
4.0
65%
0.00
BJS
2013
614
256
42%
0.01
Incarceration Rate: Prisoners Per 100,000 People: Male
BJS
2013
1,146
466
41%
0.01
Incarceration Rate: Prisoners Per 100,000 People: Female
BJS
2013
66
51
78%
0.01
CDC
2010
9.5
3.3
35%
0.00
0.00
Incarceration Rate: Prisoners Per 100,000
VICTIMIZATION & MENTAL ANGUISH (0.20)
Homicide Rate Per 100,000: Male
Homicide Rate Per 100,000: Female
CDC
2010
1.8
1.7
94%
Murder Victims, Rate Per 100,000
USDJ
2013
3.2
2.8
88%
–
Hate Crimes Victims, Rate Per 100,000
USDJ
2013
0.8
0.4
48%
0.15
BJS
2013
24.8
22.2
90%
(0.13)
Prisoners Under Sentence of Death, Rate per 100,000
BJS
2013
1.1
1.0
97%
0.17
High School Students Carrying Weapons on School
Property
CDC
2013
4.7
5.7
121%
0.33
High School Students Carrying Weapons Anywhere
CDC
2013
15.5
20.8
134%
0.29
Firearm-Related Death Rates Per 100,000:
Males, All Ages
CDC
2007
13.4
16.1
120%
0.00
Victims of Violent Crimes, Rate Per 1,000 Persons
Age 12 or Older
Ages 1–14
CDC
2007
0.8
0.7
86%
0.00
Ages 15–24
CDC
2007
30.7
13.4
44%
0.00
0.00
Ages 25–44
CDC
2007
17.7
18.3
104%
Ages 25–34
CDC
2007
21.8
18.0
82%
0.00
Ages 35–44
CDC
2007
12.6
18.7
148%
0.00
2015 STATE OF BLACK AMERICA¨
SAVE OUR CITIES
NATIONAL URBAN LEAGUE
2015 Equality Index™ : Hispanic–White + 62
Updated
Reincluded Weight in 2014
History Revised
2015 EQUALITY INDEX OF
HISPANIC AMERICA
New Series 2014
Source
Year
Ages 45–64
CDC
2007
Age 65 and Older
CDC
2007
CDC
2007
Firearm-Related Death Rates Per 100,000:
Females, All Ages
No New Data
Hispanic
White
Index
Diff.
(’15–’14)
9.7
19.5
202%
0.00
10.8
27.3
253%
0.00
1.5
2.9
187%
0.00
Ages 1–14
CDC
2007
0.3
0.3
111%
0.00
Ages 15–24
CDC
2007
2.8
2.5
87%
0.00
Ages 25–44
CDC
2007
2.3
4.1
176%
0.00
Ages 25–34
CDC
2007
2.5
3.4
136%
0.00
Ages 35–44
CDC
2007
2.1
4.6
222%
0.00
0.00
Ages 45–64
CDC
2007
1.5
3.9
262%
Age 65 and Older
CDC
2007
0.6
2.2
393%
0.00
72.7%
0.066
Social Justice Weighted Index
CIVIC ENGAGEMENT (10%)
DEMOCRATIC PROCESS (0.4)
Registered Voters, % of Citizen Population
Census
2012
58.7
73.7
80%
0.00
Actually Voted, % of Citizen Population
Census
2012
48.0
64.1
75%
0.00
Census
2010
0.4
1.0
40%
0.00
COMMUNITY PARTICIPATION (0.3)
Percent of Population Volunteering for Military
Reserves, %
Volunteerism, %
BLS
2013
15.5
27.1
57%
0.03
Civic and Political
BLS
2013
2.8
5.3
53%
(0.12)
Educational or Youth Service
BLS
2013
31.4
25.3
124%
(0.00)
Environmental or Animal Care
BLS
2013
1.2
3.0
40%
(0.28)
Hospital or Other Health
BLS
2013
5.0
7.3
68%
(0.11)
0.05
Public Safety
BLS
2013
0.8
1.2
67%
Religious
BLS
2013
38.8
32.2
120%
0.12
Social or Community Service
BLS
2013
11.2
15.0
75%
(0.11)
NCES
2000
30.7
32.2
95%
0.00
Unpaid Volunteering of Young Adults
COLLECTIVE BARGAINING (0.2)
Members of Unions, % of Employed
BLS
2013
9.4
11.0
85%
(0.03)
Represented By Unions, % of Employed
BLS
2013
10.3
12.2
84%
(0.04)
OPM
2008
0.4
0.8
52%
0.00
EEOC
2009
1.8
2.5
GOVERNMENTAL EMPLOYMENT (0.1)
Federal Executive Branch (Nonpostal) Employment,
% of Adult Population
State and Local Government Employment, %
Civic Engagement Weighted Index
73%
0.00
71.0%
(0.003)
Note: Weights were adjusted proportionally within the five categories to account for missing Hispanic data.
2015 STATE OF BLACK AMERICA¨
SAVE OUR CITIES
NATIONAL URBAN LEAGUE
2015 Equality Index™ : Hispanic–White + 63
SOURCE
ACRONYM
American Community Survey
ACS
U.S. Bureau of Justice Statistics
BJS
U.S. Bureau of Labor Statistics
BLS
College Board
CB
Centers for Disease Control and Prevention
CDC
U.S. Census Bureau
Census
Current Population Survey — Annual Social and Economic Supplement
CPS ASEC
Employee Benefit Research Institute
EBRI
U.S. Equal Employment Opportunity Commission
EEOC
Economic Policy Institute
EPI
The Education Trust
ET
Home Mortgage Disclosure Act
HMDA
Monitoring the Future
MTF
National Archive of Criminal Justice Data
NACJD
National Center for Education Statistics
NCES
National Center for Juvenile Justice
NCJJ
National Telecommunications and Information Administration
NTIA
Office of Personal Management
OPM
SRI International
SRI
Statistical Abstract of the United States
Stat. Ab.
State of Working America
SWA
U.S. Department of Defense
USDD
U.S. Department of Justice
USDJ
2015 STATE OF BLACK AMERICA¨
SAVE OUR CITIES
NATIONAL URBAN LEAGUE
64
2015 Equality Index™ : Hispanic–White Unemployment Equality + 64
METRO AREA
UNEMPLOYMENT EQUALITY
Hispanic–White
R ANKING OF METRO AREAS
FROM MOST TO LEAST EQUAL
2015
Rank
Hisp.
Rate*
White
Rate*
Hisp.–White
Index
2014 Hispanic
Rank
White
Index
74%
Deltona–Daytona Beach–Ormond Beach, FL
1
5.8
8.6
148%
29
9.4
7
Indianapolis–Carmel–Anderson, IN
2
5.3
6.7
126%
3
6.1
6.8
111%
Lakeland–Winter Haven, FL
3
7.3
8.7
119%
11
13.5
12.1
90%
New Orleans–Metairie, LA
4
5.3
6.1
115%
54
11
6.6
60%
Nashville–Davidson–Murfreesboro–Franklin, TN
5
5.6
6
107%
4
6.3
6.8
108%
McAllen–Edinburg–Mission, TX **
6
9.5
9.3
98%
65
10.3
5.6
54%
North Port–Sarasota–Bradenton, FL
7
8.8
8.3
94%
6
10.7
10.3
96%
80%
El Paso, TX
8
8.7
8.2
94%
19
10.6
8.5
Columbus, OH
9
5.9
5.4
92%
17
7.2
5.9
82%
10
6.5
5.8
89%
38
8.4
5.9
70%
80%
Austin–Round Rock, TX
Orlando–Kissimmee–Sanford, FL
11
8.8
7.8
89%
20
11.9
9.5
Bridgeport–Stamford–Norwalk, CT
12
9.2
8.1
88%
60
12.7
7.2
57%
Las Vegas–Henderson–Paradise, NV
13
11.5
9.6
83%
9
12.7
11.7
92%
Oxnard–Thousand Oaks–Ventura, CA
14
8.7
7.2
83%
7
10.3
9.9
96%
Cape Coral–Fort Myers, FL
15
10.8
8.9
82%
32
15
10.9
73%
Oklahoma City, OK
16
5.7
4.6
81%
42
6.9
4.7
68%
Stockton–Lodi, CA
17
14.3
11.5
80%
18
16.7
13.5
81%
Riverside–San Bernardino–Ontario, CA
18
13.5
10.8
80%
21
15.3
12.2
80%
Colorado Springs, CO
19
9.9
7.9
80%
40
11.9
8.2
69%
Miami–Fort Lauderdale–West Palm Beach, FL
20
9.4
7.5
80%
13
10.4
8.9
86%
Sacramento–Roseville–Arden–Arcade, CA
21
12.8
10.2
80%
30
15.1
11.1
74%
San Diego–Carlsbad, CA
22
10
7.9
79%
43
12.2
8.2
67%
Tampa–St. Petersburg–Clearwater, FL
23
9.7
7.6
78%
27
12.7
9.6
76%
Dallas–Fort Worth–Arlington, TX
24
7
5.4
77%
14
7.5
6.4
85%
Portland–Vancouver–Hillsboro, OR–WA
25
10.4
8
77%
16
10.9
9.1
83%
Los Angeles–Long Beach–Anaheim, CA
26
10.7
8
75%
24
12.2
9.4
77%
Bakersfield, CA
27
13.4
9.9
74%
59
16.9
9.7
57%
Houston–The Woodlands–Sugar Land, TX
28
6.8
5
74%
23
8.2
6.5
79%
Kansas City, MO–KS
29
6.9
5
72%
52
10.2
6.4
63%
Charlotte–Concord–Gastonia, NC–SC
30
9.8
7.1
72%
34
11.2
8
71%
Boise City, ID
31
9
6.5
72%
63
13.1
7.2
55%
Jacksonville, FL
32
10.5
7.5
71%
2
8.5
9.6
113%
Memphis, TN–MS–AR
33
8.2
5.8
71%
1
3.8
6.5
171%
Baltimore–Columbia–Towson, MD
34
7.7
5.4
70%
41
8.9
6.1
69%
Ogden–Clearfield, UT
35
6.6
4.6
70%
68
7.9
4.2
53%
2015 STATE OF BLACK AMERICA¨
SAVE OUR CITIES
NATIONAL URBAN LEAGUE
2015 Equality Index™ : Hispanic–White Unemployment Equality + 65
R ANKING OF METRO AREAS
FROM MOST TO LEAST EQUAL
2015
Rank
Hisp.
Rate*
White
Rate*
Hisp.–White
Index
2014 Hispanic
Rank
White
Index
New Haven–Milford, CT
36
11
7.6
69%
58
15.7
9.1
58%
Raleigh, NC
37
8.4
5.8
69%
31
7.9
5.8
73%
San Francisco–Oakland–Hayward, CA
38
9
6.2
69%
53
10.9
6.7
61%
Virginia Beach–Norfolk–Newport News, VA–NC
39
7.7
5.3
69%
75
13.2
6.5
49%
Atlanta–Sandy Springs–Roswell, GA
40
9.9
6.8
69%
15
9.6
8.1
84%
Phoenix–Mesa–Scottsdale, AZ
41
9.4
6.4
68%
37
10.5
7.4
70%
Seattle–Tacoma–Bellevue, WA
42
9.8
6.6
67%
35
9.9
7
71%
St. Louis, MO–IL
43
9.1
6.1
67%
26
9.1
6.9
76%
Washington–Arlington–Alexandria, DC–VA–MD–WV
44
6.8
4.5
66%
47
6.6
4.2
64%
Worcester, MA–CT
45
10.8
7.1
66%
66
14.4
7.7
53%
Tulsa, OK
46
8.1
5.3
65%
10
6.9
6.3
91%
Salt Lake City, UT
47
7.7
5
65%
61
11.3
6.3
56%
Albuquerque, NM
48
9.3
6
65%
55
10.9
6.5
60%
Chicago–Naperville–Elgin, IL–IN–WI
49
10.6
6.8
64%
48
12
7.6
63%
Wichita, KS
50
8.9
5.6
63%
44
9.4
6.1
65%
New York–Newark–Jersey City, NY–NJ–PA
51
10.8
6.7
62%
49
11.4
7.2
63%
Richmond, VA
52
8.6
5.3
62%
79
12.9
5.8
45%
Denver–Aurora–Lakewood, CO
53
9.1
5.6
62%
36
9.2
6.5
71%
Tucson, AZ
54
13.7
8.3
61%
45
13.1
8.5
65%
80%
Fresno, CA
55
14.7
8.9
61%
22
16.6
13.2
Philadelphia–Camden–Wilmington, PA–NJ–DE–MD
56
12.4
7.5
60%
64
14.6
8
55%
Grand Rapids–Wyoming, MI
57
10.7
6.3
59%
73
15.2
7.6
50%
Minneapolis–St. Paul–Bloomington, MN–WI
58
7.8
4.5
58%
74
10.5
5.2
50%
Modesto, CA
59
20.8
12
58%
25
19.6
15
77%
Milwaukee–Waukesha–West Allis, WI
60
8.9
5.1
57%
67
10.5
5.6
53%
San Antonio–New Braunfels, TX
61
7.9
4.5
57%
46
9.1
5.9
65%
Boston–Cambridge–Newton, MA–NH
62
11.1
6.2
56%
78
14.2
6.7
47%
Detroit–Warren–Dearborn, MI
63
13.8
7.6
55%
51
14.3
9
63%
San Jose–Sunnyvale–Santa Clara, CA
64
11.3
6
53%
57
12.3
7.2
59%
Providence–Warwick, RI–MA
65
16.5
8.5
52%
62
16
8.8
55%
Cleveland–Elyria, OH
66
11.7
6
51%
81
16.7
7
42%
Urban Honolulu, HI
67
8
3.7
46%
NA
11.9
6.3
53%
Allentown–Bethlehem–Easton, PA–NJ
68
15.9
7.1
45%
56
13.3
7.9
59%
Omaha–Council Bluffs, NE–IA
69
8.6
3.8
44%
50
8.1
5.1
63%
Springfield, MA
70
17.7
7.4
42%
82
19.3
7.7
40%
Rochester, NY
71
16.2
6.2
38%
77
14.5
6.9
48%
Hartford–West Hartford–East Hartford, CT
72
17.3
6.6
38%
80
16.2
7.1
44%
* 2013 Unemployment Rate; NA: Not available
** White is White alone
Source: Census ACS 2013 1-year estimates (2015 Metro Index) and ACS 2012 1-year estimates (2014 Metro Index)
2015 STATE OF BLACK AMERICA¨
SAVE OUR CITIES
NATIONAL URBAN LEAGUE
2015 Equality Index™ : Hispanic–White Income Equality + 66
METRO AREA
INCOME EQUALITY
Hispanic–White
R ANKING OF METRO AREAS
FROM MOST TO LEAST EQUAL
2015
Rank
Hisp. Income,
Dollars*
White Income,
Dollars*
Hisp.–White
Index
2014 Hispanic
Rank
White
Index
67%
Deltona–Daytona Beach–Ormond Beach, FL
1
41,308
42,473
97%
4
38,473
47,217
McAllen–Edinburg–Mission, TX
2
32,136
35,185
91%
46
29,999
47,401
61%
Boise City, ID
3
45,179
50,260
90%
49
32,131
51,430
57%
Jacksonville, FL
4
50,171
57,430
87%
3
46,546
54,966
61%
St. Louis, MO–IL
5
50,570
61,254
83%
33
39,580
60,453
65%
Tampa–St. Petersburg–Clearwater, FL
6
39,757
49,974
80%
11
36,168
49,109
70%
Urban Honolulu, HI
7
60,962
77,038
79%
NA
58,987
74,563
62%
Riverside–San Bernardino–Ontario, CA
8
47,196
60,376
78%
5
46,564
58,065
49%
Lakeland–Winter Haven, FL
9
36,327
46,512
78%
1
39,994
44,639
50%
10
40,764
52,949
77%
15
37,332
52,859
62%
New Orleans–Metairie, LA
11
46,146
60,070
77%
42
37,820
59,145
63%
Virginia Beach–Norfolk–Newport News, VA–NC
12
50,197
65,475
77%
17
46,237
66,066
65%
Las Vegas–Henderson–Paradise, NV
13
42,789
56,584
76%
8
41,833
55,291
55%
Baltimore–Columbia–Towson, MD
14
59,939
80,573
74%
20
56,778
81,630
68%
Sacramento—Roseville—Arden–Arcade, CA
15
45,667
63,529
72%
43
41,837
65,768
60%
North Port–Sarasota–Bradenton, FL
16
36,173
50,733
71%
9
38,047
50,976
57%
Miami–Fort Lauderdale–West Palm Beach, FL
17
41,547
58,672
71%
22
41,057
59,877
81%
Albuquerque, NM
18
39,924
56,483
71%
26
38,470
57,029
60%
Orlando–Kissimmee–Sanford, FL
19
38,721
55,082
70%
31
36,339
54,526
71%
Modesto, CA
20
39,131
56,097
70%
7
40,737
53,658
65%
62%
Tulsa, OK
Ogden–Clearfield, UT
21
45,608
65,555
70%
66
36,981
65,672
El Paso, TX
22
35,596
51,598
69%
39
36,180
56,023
65%
Oklahoma City, OK
23
38,054
55,219
69%
56
33,545
55,459
43%
Detroit–Warren–Dearborn, MI
24
41,276
60,079
69%
14
41,629
58,350
56%
Cape Coral–Fort Myers, FL
25
33,980
49,633
68%
50
32,502
52,069
63%
Seattle–Tacoma–Bellevue, WA
26
48,903
71,699
68%
34
46,449
70,992
85%
Cleveland–Elyria, OH
27
38,762
57,108
68%
70
30,993
55,866
67%
Tucson, AZ
28
34,304
50,586
68%
35
34,121
52,278
90%
San Diego–Carlsbad, CA
29
46,875
70,302
67%
27
45,381
67,359
76%
Wichita, KS
30
36,560
54,838
67%
19
36,975
53,067
61%
Charlotte–Concord–Gastonia, NC–SC
31
38,843
58,539
66%
48
39,907
63,770
63%
Colorado Springs, CO
32
41,126
62,129
66%
23
41,132
60,198
60%
Phoenix–Mesa–Scottsdale, AZ
33
38,704
58,591
66%
29
39,293
58,580
69%
Columbus, OH
34
38,520
58,582
66%
57
36,189
59,874
56%
Kansas City, MO–KS
35
40,432
61,783
65%
28
41,582
61,747
59%
2015 STATE OF BLACK AMERICA¨
SAVE OUR CITIES
NATIONAL URBAN LEAGUE
2015 Equality Index™ : Hispanic–White Income Equality + 67
R ANKING OF METRO AREAS
FROM MOST TO LEAST EQUAL
2015
Rank
Hisp. Income,
Dollars*
White Income,
Dollars*
Hisp.–White
Index
2014 Hispanic
Rank
White
Index
Stockton–Lodi, CA
36
40,694
62,356
65%
10
43,798
59,109
76%
Portland–Vancouver–Hillsboro, OR–WA
37
40,486
62,474
65%
32
40,360
60,573
63%
49%
San Antonio–New Braunfels, TX
38
42,377
65,435
65%
40
42,642
66,595
Oxnard–Thousand Oaks–Ventura, CA
39
56,165
86,786
65%
18
55,528
79,571
64%
Bakersfield, CA
40
37,847
58,517
65%
37
37,662
57,998
50%
Nashville–Davidson–Murfreesboro–Franklin, TN
41
36,458
56,673
64%
44
36,471
57,511
75%
Salt Lake City, UT
42
42,232
65,976
64%
53
39,347
64,512
56%
Chicago–Naperville–Elgin, IL–IN–WI
43
45,349
71,910
63%
38
46,535
71,897
60%
Grand Rapids–Wyoming, MI
44
35,114
56,106
63%
36
35,803
54,874
68%
Omaha–Council Bluffs, NE–IA
45
37,811
60,529
62%
24
40,606
59,933
67%
Austin–Round Rock, TX
46
43,712
71,501
61%
54
42,774
70,227
70%
Washington–Arlington–Alexandria, DC–VA–MD–WV
47
65,736
108,254
61%
60
64,685
108,111
51%
Denver–Aurora–Lakewood, CO
48
42,071
70,593
60%
59
42,511
70,396
67%
Minneapolis–St. Paul–Bloomington, MN–WI
49
42,764
72,014
59%
61
42,369
72,389
67%
Allentown–Bethlehem–Easton, PA–NJ
50
35,687
60,395
59%
52
36,546
59,435
49%
San Francisco–Oakland–Hayward, CA
51
56,269
95,285
59%
64
52,150
91,736
51%
San Jose–Sunnyvale–Santa Clara, CA
52
59,150
100,281
59%
72
56,087
101,317
68%
Los Angeles–Long Beach–Anaheim, CA
53
45,202
77,133
59%
55
45,505
74,914
80%
Dallas–Fort Worth–Arlington, TX
54
41,622
71,415
58%
63
40,850
71,672
55%
Fresno, CA
55
33,643
57,805
58%
51
34,642
55,755
64%
Richmond, VA
56
38,186
67,017
57%
25
46,155
68,232
61%
Atlanta–Sandy Springs–Roswell, GA
57
38,919
68,595
57%
65
38,604
68,150
64%
Houston–The Woodlands–Sugar Land, TX
58
43,020
76,775
56%
68
42,759
76,269
67%
Raleigh, NC
59
37,572
71,462
53%
74
36,097
70,720
57%
Milwaukee–Waukesha–West Allis, WI
60
32,308
62,031
52%
67
35,389
62,982
55%
65%
New York–Newark–Jersey City, NY–NJ–PA
61
42,981
83,457
52%
76
41,685
83,027
Philadelphia–Camden–Wilmington, PA–NJ–DE–MD
62
36,365
71,916
51%
75
36,689
72,132
35%
Memphis, TN–MS–AR
63
32,041
63,611
50%
58
36,046
59,654
65%
Boston–Cambridge–Newton, MA–NH
64
39,080
79,700
49%
79
39,052
79,666
74%
Indianapolis–Carmel–Anderson, IN
65
27,293
57,612
47%
45
38,758
61,142
74%
65%
Bridgeport–Stamford–Norwalk, CT
66
46,696
98,697
47%
77
49,663
99,041
New Haven–Milford, CT
67
33,212
70,365
47%
80
34,461
70,605
71%
Providence–Warwick, RI–MA
68
28,622
60,975
47%
78
29,579
59,842
79%
Rochester, NY
69
26,315
57,048
46%
71
30,919
55,783
70%
Worcester, MA–CT
70
29,216
66,078
44%
81
31,953
68,030
60%
Springfield, MA
71
24,781
60,505
41%
83
21,057
59,380
70%
Hartford–West Hartford–East Hartford, CT
72
30,453
75,475
40%
82
32,569
76,334
47%
* Median Household Income, 2013 Dollars; NA: Not available
** Black is Black or African American alone, not Hispanic
Source: Census ACS 2013 1-year estimates (unless otherwise noted)
2015 STATE OF BLACK AMERICA¨
SAVE OUR CITIES
NATIONAL URBAN LEAGUE
2015 State Education Equality Index™ + 68
2015 STATE OF BLACK AMERICA©
SAVE OUR CITIES
NATIONAL URBAN LEAGUE
2015 State Education Equality Index™ + 69
2015 STATE EDUCATION EQUALITY INDEX
Source
Year
Black
White
Grade 4: At or Above Proficient: Reading, %
NAEP
2013
14.7
39.8
Grade 4: At or Above Proficient: Math, %
NAEP
2013
9.3
40.2
Grade 8: At or Above Proficient: Reading, %
NAEP
2013
9.4
33.6
Grade 8: At or Above Proficient: Math, %
NAEP
2013
5.5
Grade 4: Average Scale Score: Reading (Out of 500)
NAEP
2013
Grade 4: Average Scale Score: Mathematics (Out of 500)
NAEP
2013
Grade 8: Average Scale Score: Reading (Out of 500)
NAEP
Grade 8: Average Scale Score: Mathematics (Out of 500)
Average Freshman Graduation Rate
B–W
Index
Hispanic
Hisp.–White
Index
37%
14.9
37%
23%
23.0
57%
28%
19.3
58%
27.6
20%
6.0
22%
202.4
227.4
89%
205.7
90%
215.3
241.7
89%
228.1
94%
2013
241.3
266.5
91%
248.9
93%
NAEP
2013
250.2
279.6
89%
257.1
92%
NCES
2009–10
65.4
75.8
86%
66.5
88%
Percentage of Students Enrolled in Schools With More
Than 20% of First-Year Teachers
OCR
2011–12
2.0
1.0
50%
2.0
50%
Percentage of Students Attending Schools With More
Than 20% of Teachers Not Yet Certified
OCR
2011–12
0.9
0.7
78%
0.4
175%
ACS–Census
2013
26.5
23.6
112%
18.5
78%
OCR
2009–10
0.9
1.0
91%
0.6
78%
Percent of All Families With Related Children
Under 18 Years Only
ACS
2013
38.4
15.8
41%
33.6
47%
Percent of All Families With Related Children
Under 5 Years Only
ACS
2013
47.8
16.0
33%
16.9
95%
Out of School Suspensions, % Male
OCR
2011–12
22.0
8.0
36%
7.0
114%
Out of School Suspensions, % Female
OCR
2011–12
13.0
3.0
23%
3.0
100%
In Need of LEP, % of Population Over 3 Enrolled
OCR
2009–10
1.9
0.1
5%
36.4
0%
Enrolled in LEP, % of Population Over 3 Enrolled
OCR
2009–10
0.1
0.1
78%
32.6
0%
IDEA, % of Population Over 3 Enrolled
OCR
2009–10
8.1
6.6
81%
4.1
160%
Gifted-Talented, % of Population Over 3 Enrolled
OCR
2009–10
2.3
4.6
49%
2.3
50%
Grade 4: At or Above Proficient: Reading, %
NAEP
2013
14.7
39.8
37%
14.9
37%
Grade 4: At or Above Proficient: Math, %
NAEP
2013
9.3
40.2
23%
23.0
57%
Grade 8: At or Above Proficient: Reading, %
NAEP
2013
9.4
33.6
28%
19.3
58%
ALABAMA
ACHIEVEMENT INDICATORS
TEACHER QUALITY
ENROLLMENT
Nursery School, Preschool, % of Population Under 5
Enrolled in Alg 1 in Grade 7–Grade 8, % of Population
Over 3 Enrolled
STUDENT STATUS & RISK FACTORS
Families and People For Whom Poverty Status
is Determined:
ALASKA
ACHIEVEMENT INDICATORS
Grade 8: At or Above Proficient: Math, %
NAEP
2013
5.5
27.6
20%
6.0
22%
Grade 4: Average Scale Score: Reading (Out of 500)
NAEP
2013
202.4
227.4
89%
205.7
90%
Grade 4: Average Scale Score: Mathematics (Out of 500)
NAEP
2013
215.3
241.7
89%
228.1
94%
Grade 8: Average Scale Score: Reading (Out of 500)
NAEP
2013
241.3
266.5
91%
248.9
93%
Grade 8: Average Scale Score: Mathematics (Out of 500)
NAEP
2013
250.2
279.6
89%
257.1
92%
Average Freshman Graduation Rate
NCES
2009–10
65.4
75.8
86%
66.5
88%
2015 STATE OF BLACK AMERICA¨
SAVE OUR CITIES
NATIONAL URBAN LEAGUE
2015 State Education Equality Index™ + 70
2015 STATE EDUCATION EQUALITY INDEX
Source
Year
Black
White
B–W
Index
Hispanic
Hisp.–White
Index
Percentage of Students Enrolled in Schools With More
Than 20% of First-Year Teachers
OCR
2011–12
13.0
4.0
31%
11.0
36%
Percentage of Students Attending Schools With More
Than 20% of Teachers Not Yet Certified
OCR
2011–12
0.1
0.2
200%
0.1
200%
ACS–Census
2013
26.4
20.1
131%
18.2
91%
OCR
2009–10
1.3
2.1
65%
1.7
81%
Percent of All Families With Related Children
Under 18 Years Only
ACS
2013
10.2
6.5
64%
12.0
54%
Percent of All Families With Related Children
Under 5 Years Only
ACS
2013
NA
8.7
NA
21.1
41%
Out of School Suspensions, % Male
OCR
2011–12
15.0
6.0
40%
8.0
75%
Out of School Suspensions, % Female
OCR
2011–12
7.0
2.0
29%
4.0
50%
In Need of LEP, % of Population Over 3 Enrolled
OCR
2009–10
3.7
1.0
27%
12.9
8%
Enrolled in LEP, % of Population Over 3 Enrolled
OCR
2009–10
3.5
1.1
31%
11.8
9%
IDEA, % of Population Over 3 Enrolled
OCR
2009–10
11.7
7.7
66%
9.2
84%
Gifted-Talented, % of Population Over 3 Enrolled
OCR
2009–10
2.6
3.4
76%
2.4
71%
Grade 4: At or Above Proficient: Reading, %
NAEP
2013
19.0
42.4
45%
16.6
39%
Grade 4: At or Above Proficient: Math, %
NAEP
2013
23.9
55.0
43%
27.9
51%
Grade 8: At or Above Proficient: Reading, %
NAEP
2013
16.0
41.7
38%
17.1
41%
Grade 8: At or Above Proficient: Math, %
NAEP
2013
19.2
45.1
43%
18.5
41%
Grade 4: Average Scale Score: Reading (Out of 500)
NAEP
2013
205.7
228.3
90%
202.5
89%
Grade 4: Average Scale Score: Mathematics (Out of 500)
NAEP
2013
230.1
251.2
92%
232.1
92%
Grade 8: Average Scale Score: Reading (Out of 500)
NAEP
2013
248.2
272.3
91%
252.1
93%
Grade 8: Average Scale Score: Mathematics (Out of 500)
NAEP
2013
265.5
293.8
90%
269.1
92%
Average Freshman Graduation Rate
NCES
2009–10
81.0
76.5
106%
70.6
92%
Percentage of Students Enrolled in Schools With More
Than 20% of First-Year Teachers
OCR
2011–12
9.0
5.0
56%
10.0
50%
Percentage of Students Attending Schools With More
Than 20% of Teachers Not Yet Certified
OCR
2011–12
4.3
3.7
86%
3.4
109%
ACS–Census
2013
19.6
22.6
87%
15.2
67%
OCR
2009–10
0.7
0.7
107%
0.7
112%
ALASKA (CONTINUED)
TEACHER QUALITY
ENROLLMENT
Nursery School, Preschool, % of Population Under 5
Enrolled in Alg 1 in Grade 7–Grade 8, % of Population
Over 3 Enrolled
STUDENT STATUS & RISK FACTORS
Families and People For Whom Poverty Status
is Determined:
ARIZONA
ACHIEVEMENT INDICATORS
TEACHER QUALITY
ENROLLMENT
Nursery School, Preschool, % of Population Under 5
Enrolled in Alg 1 in Grade 7–Grade 8, % of Population
Over 3 Enrolled
2015 STATE OF BLACK AMERICA¨
SAVE OUR CITIES
NATIONAL URBAN LEAGUE
2015 State Education Equality Index™ + 71
2015 STATE EDUCATION EQUALITY INDEX
Source
Year
Black
White
B–W
Index
Hispanic
Hisp.–White
Index
Percent of All Families With Related Children
Under 18 Years Only
ACS
2013
27.0
11.9
44%
32.1
37%
Percent of All Families With Related Children
Under 5 Years Only
ACS
2013
33.4
14.4
43%
27.6
52%
Out of School Suspensions, % Male
OCR
2011–12
19.0
7.0
37%
10.0
70%
Out of School Suspensions, % Female
OCR
2011–12
9.0
3.0
33%
4.0
75%
In Need of LEP, % of Population Over 3 Enrolled
OCR
2009–10
2.2
0.2
9%
13.2
2%
ARIZONA (CONTINUED)
STUDENT STATUS & RISK FACTORS
Families and People For Whom Poverty Status
is Determined:
Enrolled in LEP, % of Population Over 3 Enrolled
OCR
2009–10
2.1
0.2
8%
11.9
1%
IDEA, % of Population Over 3 Enrolled
OCR
2009–10
8.6
3.9
45%
8.0
48%
Gifted-Talented, % of Population Over 3 Enrolled
OCR
2009–10
2.3
4.6
49%
2.3
50%
63%
ARKANSAS
ACHIEVEMENT INDICATORS
Grade 4: At or Above Proficient: Reading, %
NAEP
2013
14.7
38.0
39%
23.9
Grade 4: At or Above Proficient: Math, %
NAEP
2013
16.9
47.2
36%
30.5
65%
Grade 8: At or Above Proficient: Reading, %
NAEP
2013
12.5
37.3
33%
21.0
56%
Grade 8: At or Above Proficient: Math, %
NAEP
2013
9.0
34.2
26%
19.7
57%
Grade 4: Average Scale Score: Reading (Out of 500)
NAEP
2013
200.3
225.5
89%
210.9
94%
Grade 4: Average Scale Score: Mathematics (Out of 500)
NAEP
2013
222.7
245.7
91%
234.1
95%
Grade 8: Average Scale Score: Reading (Out of 500)
NAEP
2013
243.7
268.7
91%
255.7
95%
Grade 8: Average Scale Score: Mathematics (Out of 500)
NAEP
2013
255.0
285.5
89%
273.5
96%
Average Freshman Graduation Rate
NCES
2009–10
67.6
75.8
89%
77.0
102%
Percentage of Students Enrolled in Schools With More
Than 20% of First-Year Teachers
OCR
2011–12
3.0
1.0
33%
2.0
50%
Percentage of Students Attending Schools With More
Than 20% of Teachers Not Yet Certified
OCR
2011–12
2.1
0.9
43%
0.7
129%
ACS-Census
2013
24.7
28.4
87%
22.1
78%
OCR
2009–10
1.0
1.5
69%
0.9
60%
Percent of All Families With Related Children
Under 18 Years Only
ACS
2013
41.7
18.0
43%
37.0
49%
Percent of All Families With Related Children
Under 5 Years Only
ACS
2013
49.6
19.7
40%
45.0
44%
Out of School Suspensions, % Male
OCR
2011–12
24.0
8.0
33%
8.0
100%
Out of School Suspensions, % Female
OCR
2011–12
14.0
3.0
21%
3.0
100%
In Need of LEP, % of Population Over 3 Enrolled
OCR
2009–10
0.1
0.1
115%
41.2
0%
Enrolled in LEP, % of Population Over 3 Enrolled
OCR
2009–10
0.1
0.1
120%
37.6
0%
IDEA, % of Population Over 3 Enrolled
OCR
2009–10
7.3
6.2
85%
6.0
104%
Gifted-Talented, % of Population Over 3 Enrolled
OCR
2009–10
4.6
6.4
73%
2.8
43%
TEACHER QUALITY
ENROLLMENT
Nursery School, Preschool, % of Population Under 5
Enrolled in Alg 1 in Grade 7–Grade 8, % of Population
Over 3 Enrolled
STUDENT STATUS & RISK FACTORS
Families and People For Whom Poverty Status
is Determined:
2015 STATE OF BLACK AMERICA¨
SAVE OUR CITIES
NATIONAL URBAN LEAGUE
2015 State Education Equality Index™ + 72
2015 STATE EDUCATION EQUALITY INDEX
Source
Year
Black
Grade 4: At or Above Proficient: Reading, %
NAEP
2013
13.0
Grade 4: At or Above Proficient: Math, %
NAEP
2013
18.3
Grade 8: At or Above Proficient: Reading, %
NAEP
2013
14.8
Grade 8: At or Above Proficient: Math, %
NAEP
2013
Grade 4: Average Scale Score: Reading (Out of 500)
NAEP
2013
White
B–W
Index
Hispanic
Hisp.–White
Index
46.1
28%
15.6
34%
53.4
34%
18.7
35%
44.3
33%
18.4
41%
11.3
42.3
27%
14.5
34%
201.7
231.9
87%
200.8
87%
90%
CALIFORNIA
ACHIEVEMENT INDICATORS
Grade 4: Average Scale Score: Mathematics (Out of 500)
NAEP
2013
221.4
248.6
89%
223.6
Grade 8: Average Scale Score: Reading (Out of 500)
NAEP
2013
247.0
275.1
90%
252.1
92%
Grade 8: Average Scale Score: Mathematics (Out of 500)
NAEP
2013
258.0
291.3
89%
263.2
90%
Average Freshman Graduation Rate
NCES
2009–10
65.4
83.9
78%
71.7
85%
Percentage of Students Enrolled in Schools With More
Than 20% of First-Year Teachers
OCR
2011–12
4.0
1.0
25%
2.0
50%
Percentage of Students Attending Schools With More
Than 20% of Teachers Not Yet Certified
OCR
2011–12
1.5
0.5
33%
1.3
38%
ACS–Census
2013
22.3
27.4
81%
20.5
75%
OCR
2009–10
2.8
1.5
181%
3.0
194%
Percent of All Families With Related Children
Under 18 Years Only
ACS
2013
31.1
10.1
32%
27.5
37%
Percent of All Families With Related Children
Under 5 Years Only
ACS
2013
33.5
10.7
32%
23.5
46%
Out of School Suspensions, % Male
OCR
2011–12
17.0
6.0
35%
10.0
60%
Out of School Suspensions, % Female
OCR
2011–12
11.0
3.0
27%
4.0
75%
In Need of LEP, % of Population Over 3 Enrolled
OCR
2009–10
1.1
0.8
71%
27.9
3%
Enrolled in LEP, % of Population Over 3 Enrolled
OCR
2009–10
1.0
0.7
67%
24.3
3%
IDEA, % of Population Over 3 Enrolled
OCR
2009–10
8.8
2.9
33%
6.6
44%
Gifted-Talented, % of Population Over 3 Enrolled
OCR
2009–10
2.9
3.1
92%
3.5
112%
TEACHER QUALITY
ENROLLMENT
Nursery School, Preschool, % of Population Under 5
Enrolled in Alg 1 in Grade 7–Grade 8, % of Population
Over 3 Enrolled
STUDENT STATUS & RISK FACTORS
Families and People For Whom Poverty Status
is Determined:
COLORADO
ACHIEVEMENT INDICATORS
Grade 4: At or Above Proficient: Reading, %
NAEP
2013
19.2
51.8
37%
22.6
44%
Grade 4: At or Above Proficient: Math, %
NAEP
2013
22.3
62.3
36%
30.0
48%
Grade 8: At or Above Proficient: Reading, %
NAEP
2013
13.2
49.5
27%
23.1
47%
Grade 8: At or Above Proficient: Math, %
NAEP
2013
15.0
53.0
28%
22.9
43%
Grade 4: Average Scale Score: Reading (Out of 500)
NAEP
2013
203.0
237.2
86%
210.4
89%
Grade 4: Average Scale Score: Mathematics (Out of 500)
NAEP
2013
226.6
255.7
89%
232.8
91%
Grade 8: Average Scale Score: Reading (Out of 500)
NAEP
2013
247.1
279.4
88%
256.8
92%
Grade 8: Average Scale Score: Mathematics (Out of 500)
NAEP
2013
260.1
299.9
87%
272.8
91%
Average Freshman Graduation Rate
NCES
2009–10
75.9
85.4
89%
65.9
77%
2015 STATE OF BLACK AMERICA¨
SAVE OUR CITIES
NATIONAL URBAN LEAGUE
2015 State Education Equality Index™ + 73
2015 STATE EDUCATION EQUALITY INDEX
Source
Year
Black
White
B–W
Index
Hispanic
Hisp.–White
Index
Percentage of Students Enrolled in Schools With More
Than 20% of First-Year Teachers
OCR
2011–12
7.0
4.0
57%
8.0
50%
Percentage of Students Attending Schools With More
Than 20% of Teachers Not Yet Certified
OCR
2011–12
5.0
1.6
32%
3.7
43%
ACS-Census
2013
23.3
28.4
82%
21.5
75%
OCR
2009–10
2.7
1.7
161%
1.8
105%
Percent of All Families With Related Children
Under 18 Years Only
ACS
2013
28.1
8.4
30%
26.3
32%
Percent of All Families With Related Children
Under 5 Years Only
ACS
2013
38.5
9.2
24%
21.1
44%
Out of School Suspensions, % Male
OCR
2011–12
16.0
3.0
19%
11.0
27%
Out of School Suspensions, % Female
OCR
2011–12
9.0
2.0
22%
4.0
50%
COLORADO
(CONTINUED)
TEACHER QUALITY
ENROLLMENT
Nursery School, Preschool, % of Population Under 5
Enrolled in Alg 1 in Grade 7–Grade 8, % of Population
Over 3 Enrolled
STUDENT STATUS & RISK FACTORS
Families and People For Whom Poverty Status
is Determined:
In Need of LEP, % of Population Over 3 Enrolled
OCR
2009–10
6.7
0.5
8%
22.7
2%
Enrolled in LEP, % of Population Over 3 Enrolled
OCR
2009–10
6.1
0.5
8%
20.2
2%
IDEA, % of Population Over 3 Enrolled
OCR
2009–10
10.2
4.3
42%
6.9
62%
Gifted-Talented, % of Population Over 3 Enrolled
OCR
2009–10
3.2
4.0
80%
2.4
60%
Grade 4: At or Above Proficient: Reading, %
NAEP
2013
15.1
53.3
28%
20.4
38%
Grade 4: At or Above Proficient: Math, %
NAEP
2013
13.6
58.0
23%
18.6
32%
Grade 8: At or Above Proficient: Reading, %
NAEP
2013
21.8
54.4
40%
24.3
45%
Grade 8: At or Above Proficient: Math, %
NAEP
2013
12.9
47.6
27%
12.2
26%
Grade 4: Average Scale Score: Reading (Out of 500)
NAEP
2013
207.8
238.5
87%
209.4
88%
Grade 4: Average Scale Score: Mathematics (Out of 500)
NAEP
2013
219.1
253.1
87%
224.0
89%
Grade 8: Average Scale Score: Reading (Out of 500)
NAEP
2013
256.4
282.2
91%
255.9
91%
Grade 8: Average Scale Score: Mathematics (Out of 500)
NAEP
2013
260.4
296.6
88%
257.8
87%
Average Freshman Graduation Rate
NCES
2009–10
63.5
81.8
78%
55.5
68%
Percentage of Students Enrolled in Schools With More
Than 20% of First-Year Teachers
OCR
2011–12
4.0
2.0
50%
3.0
67%
Percentage of Students Attending Schools With More
Than 20% of Teachers Not Yet Certified
OCR
2011–12
9.1
0.6
7%
4.6
13%
ACS-Census
2013
36.6
33.1
111%
26.1
79%
OCR
2009–10
1.1
1.7
66%
0.8
48%
CONNECTICUT
ACHIEVEMENT INDICATORS
TEACHER QUALITY
ENROLLMENT
Nursery School, Preschool, % of Population Under 5
Enrolled in Alg 1 in Grade 7–Grade 8, % of Population
Over 3 Enrolled
2015 STATE OF BLACK AMERICA¨
SAVE OUR CITIES
NATIONAL URBAN LEAGUE
2015 State Education Equality Index™ + 74
2015 STATE EDUCATION EQUALITY INDEX
Source
Year
Black
White
B–W
Index
Hispanic
Hisp.–White
Index
Percent of All Families With Related Children
Under 18 Years Only
ACS
2013
24.3
5.3
22%
28.9
18%
Percent of All Families With Related Children
Under 5 Years Only
ACS
2013
20.6
6.3
31%
24.0
26%
Out of School Suspensions, % Male
OCR
2011–12
24.0
9.0
38%
13.0
69%
Out of School Suspensions, % Female
OCR
2011–12
10.0
1.0
10%
7.0
14%
In Need of LEP, % of Population Over 3 Enrolled
OCR
2009–10
1.2
0.5
42%
13.7
4%
CONNECTICUT
(CONTINUED)
STUDENT STATUS & RISK FACTORS
Families and People For Whom Poverty Status
is Determined:
Enrolled in LEP, % of Population Over 3 Enrolled
OCR
2009–10
1.1
0.4
39%
12.1
4%
IDEA, % of Population Over 3 Enrolled
OCR
2009–10
8.2
5.6
69%
8.2
69%
Gifted-Talented, % of Population Over 3 Enrolled
OCR
2009–10
0.9
1.5
59%
0.7
48%
DELAWARE
ACHIEVEMENT INDICATORS
Grade 4: At or Above Proficient: Reading, %
NAEP
2013
22.7
49.4
46%
25.0
51%
Grade 4: At or Above Proficient: Math, %
NAEP
2013
21.2
57.3
37%
27.2
47%
Grade 8: At or Above Proficient: Reading, %
NAEP
2013
18.9
41.8
45%
26.9
64%
Grade 8: At or Above Proficient: Math, %
NAEP
2013
13.5
44.7
30%
25.5
57%
Grade 4: Average Scale Score: Reading (Out of 500)
NAEP
2013
213.2
234.9
91%
215.8
92%
Grade 4: Average Scale Score: Mathematics (Out of 500)
NAEP
2013
229.4
252.4
91%
234.4
93%
Grade 8: Average Scale Score: Reading (Out of 500)
NAEP
2013
252.8
273.7
92%
260.8
95%
Grade 8: Average Scale Score: Mathematics (Out of 500)
NAEP
2013
264.4
293.5
90%
275.9
94%
Average Freshman Graduation Rate
NCES
2009–10
68.2
79.9
85%
67.3
84%
Percentage of Students Enrolled in Schools With More
Than 20% of First-Year Teachers
OCR
2011–12
7.0
1.0
14%
4.0
25%
Percentage of Students Attending Schools With More
Than 20% of Teachers Not Yet Certified
OCR
2011–12
2.8
2.7
96%
4.3
63%
ACS–Census
2013
24.1
25.5
95%
17.9
70%
OCR
2009–10
0.7
1.4
54%
0.8
59%
Percent of All Families With Related Children
Under 18 Years Only
ACS
2013
19.7
8.4
43%
37.1
23%
Percent of All Families With Related Children
Under 5 Years Only
ACS
2013
16.2
9.9
61%
22.0
45%
Out of School Suspensions, % Male
OCR
2011–12
21.0
2.0
10%
8.0
25%
Out of School Suspensions, % Female
OCR
2011–12
14.0
4.0
29%
6.0
67%
In Need of LEP, % of Population Over 3 Enrolled
OCR
2009–10
1.0
0.1
15%
22.2
1%
Enrolled in LEP, % of Population Over 3 Enrolled
OCR
2009–10
0.8
0.1
14%
17.7
1%
IDEA, % of Population Over 3 Enrolled
OCR
2009–10
16.7
5.6
33%
6.8
83%
Gifted-Talented, % of Population Over 3 Enrolled
OCR
2009–10
1.6
2.1
76%
1.1
56%
TEACHER QUALITY
ENROLLMENT
Nursery School, Preschool, % of Population Under 5
Enrolled in Alg 1 in Grade 7–Grade 8, % of Population
Over 3 Enrolled
STUDENT STATUS & RISK FACTORS
Families and People For Whom Poverty Status
is Determined:
2015 STATE OF BLACK AMERICA¨
SAVE OUR CITIES
NATIONAL URBAN LEAGUE
2015 State Education Equality Index™ + 75
2015 STATE EDUCATION EQUALITY INDEX
Source
Year
Black
White
B–W
Index
Hispanic
Hisp.–White
Index
30%
DISTRICT OF COLUMBIA
ACHIEVEMENT INDICATORS
Grade 4: At or Above Proficient: Reading, %
NAEP
2013
14.7
76.6
19%
22.8
Grade 4: At or Above Proficient: Math, %
NAEP
2013
18.9
87.7
22%
23.3
27%
Grade 8: At or Above Proficient: Reading, %
NAEP
2013
11.9
73.4
16%
20.5
28%
Grade 8: At or Above Proficient: Math, %
NAEP
2013
13.8
75.4
18%
19.6
26%
Grade 4: Average Scale Score: Reading (Out of 500)
NAEP
2013
196.9
258.8
76%
208.1
80%
Grade 4: Average Scale Score: Mathematics (Out of 500)
NAEP
2013
220.9
276.2
80%
227.5
82%
Grade 8: Average Scale Score: Reading (Out of 500)
NAEP
2013
243.3
297.1
82%
248.3
84%
Grade 8: Average Scale Score: Mathematics (Out of 500)
NAEP
2013
260.7
317.1
82%
265.0
84%
Average Freshman Graduation Rate
NCES
2009–10
59.0
87.8
67%
58.5
67%
Percentage of Students Enrolled in Schools With More
Than 20% of First-Year Teachers
OCR
2011–12
28.0
28.0
100%
27.0
104%
Percentage of Students Attending Schools With More
Than 20% of Teachers Not Yet Certified
OCR
2011–12
16.7
6.3
38%
15.9
40%
ACS-Census
2013
36.4
24.6
148%
35.6
144%
OCR
2009–10
0.4
0.2
191%
0.3
151%
Percent of All Families With Related Children
Under 18 Years Only
ACS
2013
36.0
4.8
13%
8.1
59%
Percent of All Families With Related Children
Under 5 Years Only
ACS
2013
33.5
NA
NA
NA
NA
Out of School Suspensions, % Male
OCR
2011–12
26.0
12.0
46%
16.0
75%
Out of School Suspensions, % Female
OCR
2011–12
13.0
1.0
8%
3.0
33%
1%
TEACHER QUALITY
ENROLLMENT
Nursery School, Preschool, % of Population Under 5
Enrolled in Alg 1 in Grade 7–Grade 8, % of Population
Over 3 Enrolled
STUDENT STATUS & RISK FACTORS
Families and People For Whom Poverty Status
is Determined:
In Need of LEP, % of Population Over 3 Enrolled
OCR
2009–10
0.5
0.3
54%
18.0
Enrolled in LEP, % of Population Over 3 Enrolled
OCR
2009–10
0.5
0.3
54%
18.0
1%
IDEA, % of Population Over 3 Enrolled
OCR
2009–10
7.9
0.5
6%
4.0
12%
Gifted-Talented, % of Population Over 3 Enrolled
OCR
2009–10
0.0
0.0
NA
0.0
NA
Grade 4: At or Above Proficient: Reading, %
NAEP
2013
20.3
49.3
41%
35.5
72%
Grade 4: At or Above Proficient: Math, %
NAEP
2013
20.0
53.5
37%
36.3
68%
FLORIDA
ACHIEVEMENT INDICATORS
Grade 8: At or Above Proficient: Reading, %
NAEP
2013
19.0
42.5
45%
26.9
63%
Grade 8: At or Above Proficient: Math, %
NAEP
2013
14.1
40.4
35%
24.1
60%
Grade 4: Average Scale Score: Reading (Out of 500)
NAEP
2013
212.5
236.1
90%
224.6
95%
Grade 4: Average Scale Score: Mathematics (Out of 500)
NAEP
2013
227.8
250.5
91%
238.3
95%
Grade 8: Average Scale Score: Reading (Out of 500)
NAEP
2013
253.8
273.8
93%
260.4
95%
Grade 8: Average Scale Score: Mathematics (Out of 500)
NAEP
2013
263.8
290.9
91%
274.4
94%
Average Freshman Graduation Rate
NCES
2009–10
63.6
72.3
88%
71.1
98%
2015 STATE OF BLACK AMERICA¨
SAVE OUR CITIES
NATIONAL URBAN LEAGUE
2015 State Education Equality Index™ + 76
2015 STATE EDUCATION EQUALITY INDEX
Source
Year
Black
White
B–W
Index
Hispanic
Hisp.–White
Index
Percentage of Students Enrolled in Schools With More
Than 20% of First-Year Teachers
OCR
2011–12
NA
NA
NA
NA
NA
Percentage of Students Attending Schools With More
Than 20% of Teachers Not Yet Certified
OCR
2011–12
24.3
11.4
47%
13.7
83%
ACS–Census
2013
26.5
28.7
92%
24.1
84%
OCR
2009–10
1.3
1.3
97%
1.5
112%
Percent of All Families With Related Children
Under 18 Years Only
ACS
2013
32.3
13.1
41%
25.3
52%
Percent of All Families With Related Children
Under 5 Years Only
ACS
2013
35.2
12.3
35%
21.5
57%
Out of School Suspensions, % Male
OCR
2011–12
19.0
7.0
37%
8.0
88%
Out of School Suspensions, % Female
OCR
2011–12
14.0
4.0
29%
6.0
67%
In Need of LEP, % of Population Over 3 Enrolled
OCR
2009–10
0.0
0.0
49%
0.1
6%
Enrolled in LEP, % of Population Over 3 Enrolled
OCR
2009–10
3.1
0.4
12%
14.8
3%
IDEA, % of Population Over 3 Enrolled
OCR
2009–10
2.8
1.1
41%
1.8
65%
Gifted-Talented, % of Population Over 3 Enrolled
OCR
2009–10
1.4
2.6
53%
2.9
114%
Grade 4: At or Above Proficient: Reading, %
NAEP
2013
20.5
45.4
45%
23.6
52%
Grade 4: At or Above Proficient: Math, %
NAEP
2013
20.4
53.0
38%
32.8
62%
FLORIDA
(CONTINUED)
TEACHER QUALITY
ENROLLMENT
Nursery School, Preschool, % of Population Under 5
Enrolled in Alg 1 in Grade 7–Grade 8, % of Population
Over 3 Enrolled
STUDENT STATUS & RISK FACTORS
Families and People For Whom Poverty Status
is Determined:
GEORGIA
ACHIEVEMENT INDICATORS
Grade 8: At or Above Proficient: Reading, %
NAEP
2013
17.2
42.5
40%
26.1
61%
Grade 8: At or Above Proficient: Math, %
NAEP
2013
12.4
42.1
30%
24.3
58%
Grade 4: Average Scale Score: Reading (Out of 500)
NAEP
2013
209.0
232.6
90%
213.1
92%
Grade 4: Average Scale Score: Mathematics (Out of 500)
NAEP
2013
226.3
249.8
91%
235.2
94%
Grade 8: Average Scale Score: Reading (Out of 500)
NAEP
2013
252.4
274.1
92%
260.4
95%
Grade 8: Average Scale Score: Mathematics (Out of 500)
NAEP
2013
262.3
291.5
90%
275.9
95%
Average Freshman Graduation Rate
NCES
2009–10
62.9
74.6
84%
66.3
89%
Percentage of Students Enrolled in Schools With More
Than 20% of First-Year Teachers
OCR
2011–12
2.0
0.4
20%
1.0
40%
Percentage of Students Attending Schools With More
Than 20% of Teachers Not Yet Certified
OCR
2011–12
1.5
1.2
80%
0.9
133%
ACS–Census
2013
30.5
28.6
107%
19.0
67%
OCR
2009–10
0.8
0.4
209%
0.3
72%
TEACHER QUALITY
ENROLLMENT
Nursery School, Preschool, % of Population Under 5
Enrolled in Alg 1 in Grade 7–Grade 8, % of Population
Over 3 Enrolled
2015 STATE OF BLACK AMERICA¨
SAVE OUR CITIES
NATIONAL URBAN LEAGUE
2015 State Education Equality Index™ + 77
2015 STATE EDUCATION EQUALITY INDEX
Source
Year
Black
White
B–W
Index
Hispanic
Hisp.–White
Index
Percent of All Families With Related Children
Under 18 Years Only
ACS
2013
31.5
13.0
41%
35.7
36%
Percent of All Families With Related Children
Under 5 Years Only
ACS
2013
34.7
12.9
37%
33.0
39%
Out of School Suspensions, % Male
OCR
2011–12
16.7
16.7
100%
16.7
100%
Out of School Suspensions, % Female
OCR
2011–12
10.0
2.0
20%
4.0
50%
In Need of LEP, % of Population Over 3 Enrolled
OCR
2009–10
0.4
0.3
63%
25.3
1%
GEORGIA
(CONTINUED)
STUDENT STATUS & RISK FACTORS
Families and People For Whom Poverty Status
is Determined:
Enrolled in LEP, % of Population Over 3 Enrolled
OCR
2009–10
0.3
0.2
61%
20.7
1%
IDEA, % of Population Over 3 Enrolled
OCR
2009–10
7.4
5.9
80%
6.6
90%
Gifted-Talented, % of Population Over 3 Enrolled
OCR
2009–10
3.0
8.1
37%
3.2
40%
Grade 4: At or Above Proficient: Reading, %
NAEP
2013
37.1
45.7
81%
25.9
57%
Grade 4: At or Above Proficient: Math, %
NAEP
2013
33.7
60.0
56%
42.5
71%
Grade 8: At or Above Proficient: Reading, %
NAEP
2013
26.7
44.9
59%
25.2
56%
Grade 8: At or Above Proficient: Math, %
NAEP
2013
NA
41.2
NA
27.7
67%
Grade 4: Average Scale Score: Reading (Out of 500)
NAEP
2013
222.8
231.1
96%
210.6
91%
Grade 4: Average Scale Score: Mathematics (Out of 500)
NAEP
2013
232.3
253.2
92%
241.3
95%
Grade 8: Average Scale Score: Reading (Out of 500)
NAEP
2013
258.2
273.7
94%
258.4
94%
Grade 8: Average Scale Score: Mathematics (Out of 500)
NAEP
2013
NA
290.4
NA
279.6
96%
Average Freshman Graduation Rate
NCES
2009–10
67.3
71.0
95%
72.4
102%
Percentage of Students Enrolled in Schools With More
Than 20% of First-Year Teachers
OCR
2011–12
8.0
4.0
50%
3.0
133%
Percentage of Students Attending Schools With More
Than 20% of Teachers Not Yet Certified
OCR
2011–12
4.7
1.6
34%
1.6
100%
ACS-Census
2013
29.0
18.5
156%
20.6
111%
OCR
2009–10
0.7
0.5
150%
0.1
26%
Percent of All Families With Related Children
Under 18 Years Only
ACS
2013
9.6
8.1
84%
13.5
60%
Percent of All Families With Related Children
Under 5 Years Only
ACS
2013
11.4
6.6
58%
15.6
42%
Out of School Suspensions, % Male
OCR
2011–12
14.0
5.0
36%
7.0
71%
Out of School Suspensions, % Female
OCR
2011–12
16.7
16.7
100%
16.7
100%
In Need of LEP, % of Population Over 3 Enrolled
OCR
2009–10
0.9
0.5
53%
2.8
18%
Enrolled in LEP, % of Population Over 3 Enrolled
OCR
2009–10
0.9
0.5
53%
2.8
18%
IDEA, % of Population Over 3 Enrolled
OCR
2009–10
0.0
0.0
NA
0.0
NA
Gifted-Talented, % of Population Over 3 Enrolled
OCR
2009–10
NA
NA
NA
NA
NA
HAWAII
ACHIEVEMENT INDICATORS
TEACHER QUALITY
ENROLLMENT
Nursery School, Preschool, % of Population Under 5
Enrolled in Alg 1 in Grade 7–Grade 8, % of Population
Over 3 Enrolled
STUDENT STATUS & RISK FACTORS
Families and People For Whom Poverty Status
is Determined:
2015 STATE OF BLACK AMERICA¨
SAVE OUR CITIES
NATIONAL URBAN LEAGUE
2015 State Education Equality Index™ + 78
2015 STATE EDUCATION EQUALITY INDEX
Source
Year
Black
White
B–W
Index
Grade 4: At or Above Proficient: Reading, %
NAEP
2013
Grade 4: At or Above Proficient: Math, %
NAEP
2013
Grade 8: At or Above Proficient: Reading, %
NAEP
2013
Grade 8: At or Above Proficient: Math, %
NAEP
2013
Grade 4: Average Scale Score: Reading (Out of 500)
NAEP
Grade 4: Average Scale Score: Mathematics (Out of 500)
Grade 8: Average Scale Score: Reading (Out of 500)
Hispanic
Hisp.–White
Index
NA
37.6
NA
13.1
35%
NA
44.2
NA
20.3
46%
NA
42.1
NA
19.4
46%
NA
41.0
NA
14.8
36%
2013
NA
224.4
NA
198.2
88%
NAEP
2013
NA
244.3
NA
225.2
92%
NAEP
2013
NA
273.6
NA
253.7
93%
Grade 8: Average Scale Score: Mathematics (Out of 500)
NAEP
2013
NA
290.7
NA
267.5
92%
Average Freshman Graduation Rate
NCES
2009–10
75.0
85.0
88%
80.4
95%
Percentage of Students Enrolled in Schools With More
Than 20% of First-Year Teachers
OCR
2011–12
2.0
2.0
100%
2.0
100%
Percentage of Students Attending Schools With More
Than 20% of Teachers Not Yet Certified
OCR
2011–12
0.6
0.5
83%
0.7
71%
ACS–Census
2013
16.0
19.8
81%
13.8
70%
OCR
2009–10
2.0
1.4
141%
0.9
62%
Percent of All Families With Related Children
Under 18 Years Only
ACS
2013
29.9
14.6
49%
22.7
64%
Percent of All Families With Related Children
Under 5 Years Only
ACS
2013
60.3
17.3
29%
22.2
78%
Out of School Suspensions, % Male
OCR
2011–12
19.0
5.0
26%
7.0
71%
Out of School Suspensions, % Female
OCR
2011–12
3.0
2.0
67%
3.0
67%
In Need of LEP, % of Population Over 3 Enrolled
OCR
2009–10
12.8
0.3
2%
22.8
1%
Enrolled in LEP, % of Population Over 3 Enrolled
OCR
2009–10
11.4
0.2
2%
18.6
1%
IDEA, % of Population Over 3 Enrolled
OCR
2009–10
12.9
5.0
39%
6.2
81%
Gifted-Talented, % of Population Over 3 Enrolled
OCR
2009–10
3.4
2.3
144%
0.8
33%
IDAHO
ACHIEVEMENT INDICATORS
TEACHER QUALITY
ENROLLMENT
Nursery School, Preschool, % of Population Under 5
Enrolled in Alg 1 in Grade 7–Grade 8, % of Population
Over 3 Enrolled
STUDENT STATUS & RISK FACTORS
Families and People For Whom Poverty Status
is Determined:
ILLINOIS
ACHIEVEMENT INDICATORS
Grade 4: At or Above Proficient: Reading, %
NAEP
2013
13.8
46.2
0.3
18.2
39%
Grade 4: At or Above Proficient: Math, %
NAEP
2013
15.6
51.4
0.3
24.8
48%
Grade 8: At or Above Proficient: Reading, %
NAEP
2013
14.0
46.7
0.3
23.8
51%
Grade 8: At or Above Proficient: Math, %
NAEP
2013
12.1
47.9
0.3
22.4
47%
Grade 4: Average Scale Score: Reading (Out of 500)
NAEP
2013
198.5
230.9
0.9
204.3
88%
Grade 4: Average Scale Score: Mathematics (Out of 500)
NAEP
2013
219.9
248.0
0.9
229.4
92%
Grade 8: Average Scale Score: Reading (Out of 500)
NAEP
2013
246.3
276.4
0.9
256.6
93%
Grade 8: Average Scale Score: Mathematics (Out of 500)
NAEP
2013
260.5
295.9
0.9
272.3
92%
Average Freshman Graduation Rate
NCES
2009–10
68.7
88.1
0.8
76.0
86%
2015 STATE OF BLACK AMERICA¨
SAVE OUR CITIES
NATIONAL URBAN LEAGUE
2015 State Education Equality Index™ + 79
2015 STATE EDUCATION EQUALITY INDEX
Source
Year
Black
White
B–W
Index
Hispanic
Hisp.–White
Index
Percentage of Students Enrolled in Schools With More
Than 20% of First-Year Teachers
OCR
2011–12
6.0
2.0
0.3
3.0
67%
Percentage of Students Attending Schools With More
Than 20% of Teachers Not Yet Certified
OCR
2011–12
2.9
0.3
0.1
1.3
23%
ACS-Census
2013
27.6
30.6
0.9
23.3
76%
OCR
2009–10
0.9
1.4
0.7
1.1
78%
Percent of All Families With Related Children
Under 18 Years Only
ACS
2013
37.5
10.4
0.3
24.6
42%
Percent of All Families With Related Children
Under 5 Years Only
ACS
2013
40.1
11.5
0.3
22.4
51%
Out of School Suspensions, % Male
OCR
2011–12
27.0
8.0
0.3
11.0
73%
Out of School Suspensions, % Female
OCR
2011–12
27.0
8.0
0.3
11.0
73%
In Need of LEP, % of Population Over 3 Enrolled
OCR
2009–10
13.0
2.0
0.2
4.0
50%
Enrolled in LEP, % of Population Over 3 Enrolled
OCR
2009–10
0.6
0.7
1.1
20.9
3%
IDEA, % of Population Over 3 Enrolled
OCR
2009–10
0.9
0.6
0.6
17.3
3%
Gifted-Talented, % of Population Over 3 Enrolled
OCR
2009–10
1.7
2.5
0.7
1.3
53%
Grade 4: At or Above Proficient: Reading, %
NAEP
2013
17.1
42.2
41%
24.1
57%
Grade 4: At or Above Proficient: Math, %
NAEP
2013
21.2
57.6
37%
39.5
69%
Grade 8: At or Above Proficient: Reading, %
NAEP
2013
11.1
39.3
28%
23.1
59%
ILLINOIS (CONTINUED)
TEACHER QUALITY
ENROLLMENT
Nursery School, Preschool, % of Population Under 5
Enrolled in Alg 1 in Grade 7–Grade 8, % of Population
Over 3 Enrolled
STUDENT STATUS & RISK FACTORS
Families and People For Whom Poverty Status
is Determined:
INDIANA
ACHIEVEMENT INDICATORS
Grade 8: At or Above Proficient: Math, %
NAEP
2013
14.7
43.9
33%
24.5
56%
Grade 4: Average Scale Score: Reading (Out of 500)
NAEP
2013
207.0
229.0
90%
215.5
94%
Grade 4: Average Scale Score: Mathematics (Out of 500)
NAEP
2013
227.4
252.1
90%
241.7
96%
Grade 8: Average Scale Score: Reading (Out of 500)
NAEP
2013
246.2
271.2
91%
259.0
95%
Grade 8: Average Scale Score: Mathematics (Out of 500)
NAEP
2013
265.1
292.9
91%
278.4
95%
Average Freshman Graduation Rate
NCES
2009–10
61.6
79.1
78%
71.8
91%
Percentage of Students Enrolled in Schools With More
Than 20% of First-Year Teachers
OCR
2011–12
4.0
2.0
50%
3.0
67%
Percentage of Students Attending Schools With More
Than 20% of Teachers Not Yet Certified
OCR
2011–12
1.7
0.6
35%
0.6
100%
ACS-Census
2013
24.0
24.2
99%
20.0
83%
OCR
2009–10
1.0
1.4
72%
0.8
54%
TEACHER QUALITY
ENROLLMENT
Nursery School, Preschool, % of Population Under 5
Enrolled in Alg 1 in Grade 7–Grade 8, % of Population
Over 3 Enrolled
2015 STATE OF BLACK AMERICA¨
SAVE OUR CITIES
NATIONAL URBAN LEAGUE
2015 State Education Equality Index™ + 80
2015 STATE EDUCATION EQUALITY INDEX
Source
Year
Black
White
B–W
Index
Hispanic
Hisp.–White
Index
Percent of All Families With Related Children
Under 18 Years Only
ACS
2013
41.0
14.7
36%
35.0
42%
Percent of All Families With Related Children
Under 5 Years Only
ACS
2013
47.7
16.6
35%
38.8
43%
Out of School Suspensions, % Male
OCR
2011–12
21.0
4.0
19%
8.0
50%
Out of School Suspensions, % Female
OCR
2011–12
16.0
3.0
19%
5.0
60%
In Need of LEP, % of Population Over 3 Enrolled
OCR
2009–10
1.0
0.3
27%
27.8
1%
Enrolled in LEP, % of Population Over 3 Enrolled
OCR
2009–10
0.8
0.2
23%
21.8
1%
IDEA, % of Population Over 3 Enrolled
OCR
2009–10
10.0
9.7
96%
6.4
152%
Gifted-Talented, % of Population Over 3 Enrolled
OCR
2009–10
3.4
7.2
48%
3.2
45%
Grade 4: At or Above Proficient: Reading, %
NAEP
2013
14.6
41.3
35%
22.8
55%
Grade 4: At or Above Proficient: Math, %
NAEP
2013
16.3
51.5
32%
30.3
59%
Grade 8: At or Above Proficient: Reading, %
NAEP
2013
14.9
39.5
38%
20.7
53%
Grade 8: At or Above Proficient: Math, %
NAEP
2013
10.0
39.6
25%
13.3
34%
Grade 4: Average Scale Score: Reading (Out of 500)
NAEP
2013
199.6
227.2
88%
209.8
92%
Grade 4: Average Scale Score: Mathematics (Out of 500)
NAEP
2013
218.3
248.7
88%
233.6
94%
94%
INDIANA (CONTINUED)
STUDENT STATUS & RISK FACTORS
Families and People For Whom Poverty Status
is Determined:
IOWA
ACHIEVEMENT INDICATORS
Grade 8: Average Scale Score: Reading (Out of 500)
NAEP
2013
248.2
271.6
91%
255.9
Grade 8: Average Scale Score: Mathematics (Out of 500)
NAEP
2013
254.5
288.9
88%
265.4
92%
Average Freshman Graduation Rate
NCES
2009–10
60.7
88.5
69%
86.3
98%
Percentage of Students Enrolled in Schools With More
Than 20% of First-Year Teachers
OCR
2011–12
3.0
1.0
33%
2.0
50%
Percentage of Students Attending Schools With More
Than 20% of Teachers Not Yet Certified
OCR
2011–12
0.0
0.2
NA
0.0
NA
ACS–Census
2013
28.3
29.5
96%
24.6
83%
OCR
2009–10
0.5
1.1
47%
0.5
42%
Percent of All Families With Related Children
Under 18 Years Only
ACS
2013
39.2
11.5
29%
28.2
41%
Percent of All Families With Related Children
Under 5 Years Only
ACS
2013
70.7
12.8
18%
29.0
44%
Out of School Suspensions, % Male
OCR
2011–12
18.0
4.0
22%
7.0
57%
Out of School Suspensions, % Female
OCR
2011–12
12.0
2.0
17%
5.0
40%
In Need of LEP, % of Population Over 3 Enrolled
OCR
2009–10
3.3
0.3
10%
26.2
1%
Enrolled in LEP, % of Population Over 3 Enrolled
OCR
2009–10
3.0
0.3
10%
23.6
1%
IDEA, % of Population Over 3 Enrolled
OCR
2009–10
11.5
6.6
58%
8.6
77%
Gifted-Talented, % of Population Over 3 Enrolled
OCR
2009–10
3.0
5.9
52%
2.9
49%
TEACHER QUALITY
ENROLLMENT
Nursery School, Preschool, % of Population Under 5
Enrolled in Alg 1 in Grade 7–Grade 8, % of Population
Over 3 Enrolled
STUDENT STATUS & RISK FACTORS
Families and People For Whom Poverty Status
is Determined:
2015 STATE OF BLACK AMERICA¨
SAVE OUR CITIES
NATIONAL URBAN LEAGUE
2015 State Education Equality Index™ + 81
2015 STATE EDUCATION EQUALITY INDEX
Source
Year
Black
White
B–W
Index
Hispanic
Hisp.–White
Index
Grade 4: At or Above Proficient: Reading, %
NAEP
Grade 4: At or Above Proficient: Math, %
NAEP
2013
17.1
43.6
39%
20.2
46%
2013
22.0
53.4
41%
31.1
Grade 8: At or Above Proficient: Reading, %
58%
NAEP
2013
13.5
42.2
32%
20.1
48%
Grade 8: At or Above Proficient: Math, %
NAEP
2013
17.8
46.8
38%
24.2
52%
Grade 4: Average Scale Score: Reading (Out of 500)
NAEP
2013
199.6
229.8
87%
207.6
90%
Grade 4: Average Scale Score: Mathematics (Out of 500)
NAEP
2013
228.2
250.0
91%
235.4
94%
Grade 8: Average Scale Score: Reading (Out of 500)
NAEP
2013
243.9
272.5
90%
254.1
93%
Grade 8: Average Scale Score: Mathematics (Out of 500)
NAEP
2013
267.9
295.1
91%
275.8
93%
Average Freshman Graduation Rate
NCES
2009–10
68.0
85.8
79%
78.8
92%
Percentage of Students Enrolled in Schools With More
Than 20% of First-Year Teachers
OCR
2011-12
2.0
1.0
50%
3.0
33%
Percentage of Students Attending Schools With More
Than 20% of Teachers Not Yet Certified
OCR
2011-12
0.2
0.1
50%
1.0
10%
ACS-Census
2013
24.0
24.5
98%
19.4
79%
OCR
2009–10
1.3
1.5
85%
1.1
75%
Percent of All Families With Related Children
Under 18 Years Only
ACS
2013
30.6
11.5
38%
29.5
39%
Percent of All Families With Related Children
Under 5 Years Only
ACS
2013
37.2
13.9
37%
29.3
47%
Out of School Suspensions, % Male
OCR
2011–12
18.0
7.0
39%
7.0
100%
Out of School Suspensions, % Female
OCR
2011–12
10.0
2.0
20%
3.0
67%
In Need of LEP, % of Population Over 3 Enrolled
OCR
2009–10
1.3
0.4
32%
31.7
1%
Enrolled in LEP, % of Population Over 3 Enrolled
OCR
2009–10
1.2
0.4
32%
28.7
1%
IDEA, % of Population Over 3 Enrolled
OCR
2009–10
12.8
6.9
53%
7.2
96%
Gifted-Talented, % of Population Over 3 Enrolled
OCR
2009–10
1.3
2.1
63%
0.7
34%
KANSAS
ACHIEVEMENT INDICATORS
TEACHER QUALITY
ENROLLMENT
Nursery School, Preschool, % of Population Under 5
Enrolled in Alg 1 in Grade 7–Grade 8, % of Population
Over 3 Enrolled
STUDENT STATUS & RISK FACTORS
Families and People For Whom Poverty Status
is Determined:
KENTUCKY
ACHIEVEMENT INDICATORS
Grade 4: At or Above Proficient: Reading, %
NAEP
2013
15.3
39.2
39%
29.4
75%
Grade 4: At or Above Proficient: Math, %
NAEP
2013
19.4
44.9
43%
29.9
67%
Grade 8: At or Above Proficient: Reading, %
NAEP
2013
15.5
40.6
38%
30.1
74%
Grade 8: At or Above Proficient: Math, %
NAEP
2013
10.7
32.7
33%
16.7
51%
Grade 4: Average Scale Score: Reading (Out of 500)
NAEP
2013
204.3
227.1
90%
220.1
97%
96%
Grade 4: Average Scale Score: Mathematics (Out of 500)
NAEP
2013
223.9
244.0
92%
233.9
Grade 8: Average Scale Score: Reading (Out of 500)
NAEP
2013
247.0
272.4
91%
263.3
97%
Grade 8: Average Scale Score: Mathematics (Out of 500)
NAEP
2013
260.2
283.4
92%
269.0
95%
Average Freshman Graduation Rate
NCES
2009–10
75.6
80.9
93%
81.1
100%
2015 STATE OF BLACK AMERICA¨
SAVE OUR CITIES
NATIONAL URBAN LEAGUE
2015 State Education Equality Index™ + 82
2015 STATE EDUCATION EQUALITY INDEX
Source
Year
Black
White
B–W
Index
Hispanic
Hisp.–White
Index
Percentage of Students Enrolled in Schools With More
Than 20% of First-Year Teachers
OCR
2011–12
6.0
2.0
33%
4.0
50%
Percentage of Students Attending Schools With More
Than 20% of Teachers Not Yet Certified
OCR
2011–12
0.6
0.1
17%
0.1
100%
ACS–Census
2013
23.7
22.7
104%
17.1
75%
OCR
2009–10
1.1
1.4
80%
0.9
61%
Percent of All Families With Related Children
Under 18 Years Only
ACS
2013
34.4
21.1
61%
38.4
55%
Percent of All Families With Related Children
Under 5 Years Only
ACS
2013
40.1
24.1
60%
47.6
51%
Out of School Suspensions, % Male
OCR
2011–12
18.0
9.0
50%
10.0
90%
Out of School Suspensions, % Female
OCR
2011–12
10.0
3.0
30%
3.0
100%
In Need of LEP, % of Population Over 3 Enrolled
OCR
2009–10
1.2
0.2
16%
20.0
1%
Enrolled in LEP, % of Population Over 3 Enrolled
OCR
2009–10
1.1
0.1
14%
17.1
1%
IDEA, % of Population Over 3 Enrolled
OCR
2009–10
12.3
9.4
76%
5.7
163%
Gifted-Talented, % of Population Over 3 Enrolled
OCR
2009–10
4.1
9.5
44%
2.9
31%
KENTUCKY (CONTINUED)
TEACHER QUALITY
ENROLLMENT
Nursery School, Preschool, % of Population Under 5
Enrolled in Alg 1 in Grade 7–Grade 8, % of Population
Over 3 Enrolled
STUDENT STATUS & RISK FACTORS
Families and People For Whom Poverty Status
is Determined:
LOUISIANA
ACHIEVEMENT INDICATORS
Grade 4: At or Above Proficient: Reading, %
NAEP
2013
11.3
34.9
33%
20.1
58%
Grade 4: At or Above Proficient: Math, %
NAEP
2013
13.1
40.0
33%
28.9
72%
Grade 8: At or Above Proficient: Reading, %
NAEP
2013
12.2
34.6
35%
25.7
74%
Grade 8: At or Above Proficient: Math, %
NAEP
2013
8.7
31.0
28%
25.1
81%
Grade 4: Average Scale Score: Reading (Out of 500)
NAEP
2013
197.6
223.2
89%
211.7
95%
Grade 4: Average Scale Score: Mathematics (Out of 500)
NAEP
2013
220.9
242.3
91%
231.8
96%
Grade 8: Average Scale Score: Reading (Out of 500)
NAEP
2013
245.4
268.7
91%
259.8
97%
Grade 8: Average Scale Score: Mathematics (Out of 500)
NAEP
2013
259.1
284.6
91%
277.2
97%
Average Freshman Graduation Rate
NCES
2009–10
61.9
74.0
84%
78.3
106%
Percentage of Students Enrolled in Schools With More
Than 20% of First-Year Teachers
OCR
2011–12
7.0
1.0
14%
3.0
33%
Percentage of Students Attending Schools With More
Than 20% of Teachers Not Yet Certified
OCR
2011–12
5.2
0.8
15%
1.9
42%
ACS–Census
2013
25.8
27.1
95%
29.2
108%
OCR
2009–10
0.3
0.4
64%
0.3
67%
TEACHER QUALITY
ENROLLMENT
Nursery School, Preschool, % of Population Under 5
Enrolled in Alg 1 in Grade 7–Grade 8, % of Population
Over 3 Enrolled
2015 STATE OF BLACK AMERICA¨
SAVE OUR CITIES
NATIONAL URBAN LEAGUE
2015 State Education Equality Index™ + 83
2015 STATE EDUCATION EQUALITY INDEX
Source
Year
Black
White
B–W
Index
Hispanic
Hisp.–White
Index
Percent of All Families With Related Children
Under 18 Years Only
ACS
2013
40.7
12.4
30%
28.5
44%
Percent of All Families With Related Children
Under 5 Years Only
ACS
2013
45.0
15.1
34%
23.0
66%
LOUISIANA (CONTINUED)
STUDENT STATUS & RISK FACTORS
Families and People For Whom Poverty Status
is Determined:
Out of School Suspensions, % Male
OCR
2011–12
15.0
6.0
40%
11.0
55%
Out of School Suspensions, % Female
OCR
2011–12
11.0
3.0
27%
4.0
75%
In Need of LEP, % of Population Over 3 Enrolled
OCR
2009–10
0.1
0.2
194%
16.2
1%
Enrolled in LEP, % of Population Over 3 Enrolled
OCR
2009–10
0.1
0.1
44%
7.6
1%
IDEA, % of Population Over 3 Enrolled
OCR
2009–10
8.8
5.6
63%
3.0
184%
Gifted-Talented, % of Population Over 3 Enrolled
OCR
2009–10
1.2
2.4
51%
1.4
60%
Grade 4: At or Above Proficient: Reading, %
NAEP
2013
10.9
37.7
29%
NA
NA
Grade 4: At or Above Proficient: Math, %
NAEP
2013
24.9
48.5
51%
NA
NA
Grade 8: At or Above Proficient: Reading, %
NAEP
2013
NA
38.7
NA
NA
NA
Grade 8: At or Above Proficient: Math, %
NAEP
2013
13.6
40.4
34%
NA
NA
Grade 4: Average Scale Score: Reading (Out of 500)
NAEP
2013
192.0
225.8
85%
NA
NA
Grade 4: Average Scale Score: Mathematics (Out of 500)
NAEP
2013
226.7
246.7
92%
NA
NA
Grade 8: Average Scale Score: Reading (Out of 500)
NAEP
2013
NA
269.8
NA
NA
NA
Grade 8: Average Scale Score: Mathematics (Out of 500)
NAEP
2013
261.8
289.7
90%
NA
NA
Average Freshman Graduation Rate
NCES
2009–10
86.9
82.4
105%
96.1
117%
Percentage of Students Enrolled in Schools With More
Than 20% of First-Year Teachers
OCR
2011–12
4.0
1.0
25%
2.0
50%
Percentage of Students Attending Schools With More
Than 20% of Teachers Not Yet Certified
OCR
2011–12
4.5
1.0
22%
2.0
50%
ACS-Census
2013
26.8
23.1
116%
30.0
130%
OCR
2009–10
0.8
1.1
75%
0.2
21%
Percent of All Families With Related Children
Under 18 Years Only
ACS
2013
39.8
15.2
38%
31.6
48%
Percent of All Families With Related Children
Under 5 Years Only
ACS
2013
32.1
15.2
47%
43.5
35%
MAINE
ACHIEVEMENT INDICATORS
TEACHER QUALITY
ENROLLMENT
Nursery School, Preschool, % of Population Under 5
Enrolled in Alg 1 in Grade 7–Grade 8, % of Population
Over 3 Enrolled
STUDENT STATUS & RISK FACTORS
Families and People For Whom Poverty Status
is Determined:
Out of School Suspensions, % Male
OCR
2011–12
12.0
6.0
50%
5.0
120%
Out of School Suspensions, % Female
OCR
2011–12
5.0
2.0
40%
6.0
33%
In Need of LEP, % of Population Over 3 Enrolled
OCR
2009–10
38.0
NA
NA
8.1
NA
Enrolled in LEP, % of Population Over 3 Enrolled
OCR
2009–10
37.8
NA
NA
7.7
NA
IDEA, % of Population Over 3 Enrolled
OCR
2009–10
13.5
9.7
72%
6.1
160%
Gifted-Talented, % of Population Over 3 Enrolled
OCR
2009–10
1.8
2.5
71%
0.9
38%
2015 STATE OF BLACK AMERICA¨
SAVE OUR CITIES
NATIONAL URBAN LEAGUE
2015 State Education Equality Index™ + 84
2015 STATE EDUCATION EQUALITY INDEX
Source
Year
Black
White
B–W
Index
Hispanic
Hisp.–White
Index
MARYLAND
ACHIEVEMENT INDICATORS
Grade 4: At or Above Proficient: Reading, %
NAEP
2013
21.9
60.2
36%
34.6
57%
Grade 4: At or Above Proficient: Math, %
NAEP
2013
21.9
66.8
33%
32.7
49%
Grade 8: At or Above Proficient: Reading, %
NAEP
2013
24.9
53.4
47%
30.4
57%
Grade 8: At or Above Proficient: Math, %
NAEP
2013
17.9
51.1
35%
30.4
60%
Grade 4: Average Scale Score: Reading (Out of 500)
NAEP
2013
213.8
244.4
87%
224.1
92%
Grade 4: Average Scale Score: Mathematics (Out of 500)
NAEP
2013
227.3
259.6
88%
234.3
90%
Grade 8: Average Scale Score: Reading (Out of 500)
NAEP
2013
259.4
282.7
92%
265.6
94%
Grade 8: Average Scale Score: Mathematics (Out of 500)
NAEP
2013
259.4
282.7
92%
265.6
94%
Average Freshman Graduation Rate
NCES
2009–10
74.1
87.5
85%
77.4
88%
Percentage of Students Enrolled in Schools With More
Than 20% of First-Year Teachers
OCR
2011–12
3.0
0.3
10%
1.0
30%
Percentage of Students Attending Schools With More
Than 20% of Teachers Not Yet Certified
OCR
2011–12
5.8
0.2
3%
3.3
6%
ACS–Census
2013
23.7
28.4
83%
18.9
67%
OCR
2009–10
1.9
2.3
80%
2.2
94%
Percent of All Families With Related Children
Under 18 Years Only
ACS
2013
16.7
6.7
40%
14.1
48%
Percent of All Families With Related Children
Under 5 Years Only
ACS
2013
19.2
7.2
38%
14.1
51%
Out of School Suspensions, % Male
OCR
2011–12
16.0
5.0
31%
12.0
42%
Out of School Suspensions, % Female
OCR
2011–12
7.0
2.0
29%
3.0
67%
In Need of LEP, % of Population Over 3 Enrolled
OCR
2009–10
1.0
0.3
30%
21.3
1%
Enrolled in LEP, % of Population Over 3 Enrolled
OCR
2009–10
0.9
0.2
26%
20.0
1%
IDEA, % of Population Over 3 Enrolled
OCR
2009–10
9.6
4.7
50%
6.4
74%
Gifted-Talented, % of Population Over 3 Enrolled
OCR
2009–10
7.3
10.0
73%
12.2
122%
TEACHER QUALITY
ENROLLMENT
Nursery School, Preschool, % of Population Under 5
Enrolled in Alg 1 in Grade 7–Grade 8, % of Population
Over 3 Enrolled
STUDENT STATUS & RISK FACTORS
Families and People For Whom Poverty Status
is Determined:
MASSACHUSETTS
ACHIEVEMENT INDICATORS
Grade 4: At or Above Proficient: Reading, %
NAEP
2013
20.8
56.7
37%
20.3
36%
Grade 4: At or Above Proficient: Math, %
NAEP
2013
26.1
68.1
38%
32.2
47%
Grade 8: At or Above Proficient: Reading, %
NAEP
2013
24.2
57.3
42%
19.9
35%
Grade 8: At or Above Proficient: Math, %
NAEP
2013
27.7
62.9
44%
27.8
44%
Grade 4: Average Scale Score: Reading (Out of 500)
NAEP
2013
209.1
240.6
87%
208.1
87%
Grade 4: Average Scale Score: Mathematics (Out of 500)
NAEP
2013
230.4
259.7
89%
234.2
90%
Grade 8: Average Scale Score: Reading (Out of 500)
NAEP
2013
254.7
284.9
89%
252.8
89%
Grade 8: Average Scale Score: Mathematics (Out of 500)
NAEP
2013
277.2
307.5
90%
277.4
90%
Average Freshman Graduation Rate
NCES
2009–10
72.1
86.6
83%
65.0
75%
2015 STATE OF BLACK AMERICA¨
SAVE OUR CITIES
NATIONAL URBAN LEAGUE
2015 State Education Equality Index™ + 85
2015 STATE EDUCATION EQUALITY INDEX
Source
Year
Black
White
B–W
Index
Hispanic
Hisp.–White
Index
Percentage of Students Enrolled in Schools With More
Than 20% of First-Year Teachers
OCR
2011–12
7.0
1.0
14%
6.0
17%
Percentage of Students Attending Schools With More
Than 20% of Teachers Not Yet Certified
OCR
2011–12
4.0
3.1
78%
2.1
148%
ACS-Census
2013
26.6
34.3
78%
21.2
62%
OCR
2009–10
0.9
1.8
48%
0.9
49%
Percent of All Families With Related Children
Under 18 Years Only
ACS
2013
25.8
8.9
34%
33.9
26%
Percent of All Families With Related Children
Under 5 Years Only
ACS
2013
25.0
8.1
32%
36.7
22%
Out of School Suspensions, % Male
OCR
2011–12
26.0
8.0
31%
12.0
67%
Out of School Suspensions, % Female
OCR
2011–12
8.0
2.0
25%
7.0
29%
In Need of LEP, % of Population Over 3 Enrolled
OCR
2009–10
5.1
0.6
11%
14.8
4%
Enrolled in LEP, % of Population Over 3 Enrolled
OCR
2009–10
4.0
0.5
13%
13.0
4%
IDEA, % of Population Over 3 Enrolled
OCR
2009–10
9.7
7.9
81%
12.5
63%
Gifted-Talented, % of Population Over 3 Enrolled
OCR
2009–10
0.4
NA
NA
0.2
NA
MASSACHUSETTS
(CONTINUED)
TEACHER QUALITY
ENROLLMENT
Nursery School, Preschool, % of Population Under 5
Enrolled in Alg 1 in Grade 7–Grade 8, % of Population
Over 3 Enrolled
STUDENT STATUS & RISK FACTORS
Families and People For Whom Poverty Status
is Determined:
MICHIGAN
ACHIEVEMENT INDICATORS
Grade 4: At or Above Proficient: Reading, %
NAEP
2013
12.2
36.6
33%
21.3
58%
Grade 4: At or Above Proficient: Math, %
NAEP
2013
9.9
45.3
22%
22.3
49%
Grade 8: At or Above Proficient: Reading, %
NAEP
2013
11.6
37.4
31%
21.5
58%
Grade 8: At or Above Proficient: Math, %
NAEP
2013
7.1
35.6
20%
14.0
39%
Grade 4: Average Scale Score: Reading (Out of 500)
NAEP
2013
196.2
224.3
87%
209.0
93%
Grade 4: Average Scale Score: Mathematics (Out of 500)
NAEP
2013
212.4
244.0
87%
225.8
93%
Grade 8: Average Scale Score: Reading (Out of 500)
NAEP
2013
245.5
270.6
91%
256.9
95%
Grade 8: Average Scale Score: Mathematics (Out of 500)
NAEP
2013
251.0
286.8
88%
261.1
91%
Average Freshman Graduation Rate
NCES
2009–10
59.2
81.5
73%
62.9
77%
Percentage of Students Enrolled in Schools With More
Than 20% of First-Year Teachers
OCR
2011–12
4.0
1.0
25%
2.0
50%
Percentage of Students Attending Schools With More
Than 20% of Teachers Not Yet Certified
OCR
2011–12
1.3
0.3
23%
0.2
150%
ACS-Census
2013
20.7
26.0
80%
20.4
79%
OCR
2009–10
0.8
1.5
54%
0.7
48%
TEACHER QUALITY
ENROLLMENT
Nursery School, Preschool, % of Population Under 5
Enrolled in Alg 1 in Grade 7–Grade 8, % of Population
Over 3 Enrolled
2015 STATE OF BLACK AMERICA¨
SAVE OUR CITIES
NATIONAL URBAN LEAGUE
2015 State Education Equality Index™ + 86
2015 STATE EDUCATION EQUALITY INDEX
Source
Year
Black
White
B–W
Index
Hispanic
Hisp.–White
Index
Percent of All Families With Related Children
Under 18 Years Only
ACS
2013
42.2
15.5
37%
31.6
49%
Percent of All Families With Related Children
Under 5 Years Only
ACS
2013
48.6
20.1
41%
26.7
75%
Out of School Suspensions, % Male
OCR
2011–12
19.0
4.0
21%
8.0
50%
Out of School Suspensions, % Female
OCR
2011–12
16.0
3.0
19%
6.0
50%
In Need of LEP, % of Population Over 3 Enrolled
OCR
2009–10
0.5
0.9
189%
18.1
5%
Enrolled in LEP, % of Population Over 3 Enrolled
OCR
2009–10
0.4
0.9
209%
17.3
5%
IDEA, % of Population Over 3 Enrolled
OCR
2009–10
9.9
7.4
75%
6.4
115%
Gifted-Talented, % of Population Over 3 Enrolled
OCR
2009–10
1.0
1.2
82%
0.6
52%
Grade 4: At or Above Proficient: Reading, %
NAEP
2013
20.8
46.7
45%
23.0
49%
Grade 4: At or Above Proficient: Math, %
NAEP
2013
31.8
67.2
47%
33.6
50%
Grade 8: At or Above Proficient: Reading, %
NAEP
2013
16.4
46.4
35%
19.6
42%
Grade 8: At or Above Proficient: Math, %
NAEP
2013
14.6
54.1
27%
20.2
37%
Grade 4: Average Scale Score: Reading (Out of 500)
NAEP
2013
208.0
232.7
89%
207.3
89%
Grade 4: Average Scale Score: Mathematics (Out of 500)
NAEP
2013
232.0
259.0
90%
233.6
90%
Grade 8: Average Scale Score: Reading (Out of 500)
NAEP
2013
247.9
276.6
90%
251.0
91%
Grade 8: Average Scale Score: Mathematics (Out of 500)
NAEP
2013
260.1
301.2
86%
273.2
91%
Average Freshman Graduation Rate
NCES
2009–10
69.5
92.3
75%
66.7
72%
Percentage of Students Enrolled in Schools With More
Than 20% of First-Year Teachers
OCR
2011–12
5.0
1.0
20%
3.0
33%
Percentage of Students Attending Schools With More
Than 20% of Teachers Not Yet Certified
OCR
2011–12
0.7
1.0
143%
1.2
83%
ACS–Census
2013
21.7
27.2
80%
22.5
83%
OCR
2009–10
2.0
2.1
92%
1.7
79%
Percent of All Families With Related Children
Under 18 Years Only
ACS
2013
38.7
8.0
21%
27.9
29%
Percent of All Families With Related Children
Under 5 Years Only
ACS
2013
36.2
9.9
27%
28.0
35%
Out of School Suspensions, % Male
OCR
2011–12
20.0
8.0
40%
8.0
100%
Out of School Suspensions, % Female
OCR
2011–12
10.0
1.0
10%
4.0
25%
In Need of LEP, % of Population Over 3 Enrolled
OCR
2009–10
10.1
0.3
3%
27.1
1%
Enrolled in LEP, % of Population Over 3 Enrolled
OCR
2009–10
8.1
0.3
3%
21.4
1%
IDEA, % of Population Over 3 Enrolled
OCR
2009–10
14.3
7.1
50%
10.3
69%
Gifted-Talented, % of Population Over 3 Enrolled
OCR
2009–10
3.3
4.5
74%
2.7
59%
MICHIGAN (CONTINUED)
STUDENT STATUS & RISK FACTORS
Families and People For Whom Poverty Status
is Determined:
MINNESOTA
ACHIEVEMENT INDICATORS
TEACHER QUALITY
ENROLLMENT
Nursery School, Preschool, % of Population Under 5
Enrolled in Alg 1 in Grade 7–Grade 8, % of Population
Over 3 Enrolled
STUDENT STATUS & RISK FACTORS
Families and People For Whom Poverty Status
is Determined:
2015 STATE OF BLACK AMERICA¨
SAVE OUR CITIES
NATIONAL URBAN LEAGUE
2015 State Education Equality Index™ + 87
2015 STATE EDUCATION EQUALITY INDEX
Source
Year
Black
White
B–W
Index
Hispanic
Hisp.–White
Index
MISSISSIPPI
ACHIEVEMENT INDICATORS
Grade 4: At or Above Proficient: Reading, %
NAEP
2013
10.7
33.3
32%
15.9
48%
Grade 4: At or Above Proficient: Math, %
NAEP
2013
11.3
42.4
27%
26.6
63%
Grade 8: At or Above Proficient: Reading, %
NAEP
2013
8.0
31.2
26%
17.8
57%
Grade 8: At or Above Proficient: Math, %
NAEP
2013
7.9
32.6
24%
23.5
72%
Grade 4: Average Scale Score: Reading (Out of 500)
NAEP
2013
196.5
222.2
88%
206.2
93%
Grade 4: Average Scale Score: Mathematics (Out of 500)
NAEP
2013
220.3
243.2
91%
230.4
95%
Grade 8: Average Scale Score: Reading (Out of 500)
NAEP
2013
239.0
266.0
90%
251.7
95%
Grade 8: Average Scale Score: Mathematics (Out of 500)
NAEP
2013
254.9
284.8
90%
279.1
98%
Average Freshman Graduation Rate
NCES
2009–10
59.3
68.4
87%
61.8
90%
Percentage of Students Enrolled in Schools With More
Than 20% of First-Year Teachers
OCR
2011–12
7.0
1.0
14%
4.0
25%
Percentage of Students Attending Schools With More
Than 20% of Teachers Not Yet Certified
OCR
2011–12
1.4
0.8
57%
0.3
267%
ACS-Census
2013
30.9
22.0
141%
17.9
82%
OCR
2009–10
0.5
0.7
72%
0.4
57%
Percent of All Families With Related Children
Under 18 Years Only
ACS
2013
44.2
17.7
40%
31.6
56%
Percent of All Families With Related Children
Under 5 Years Only
ACS
2013
44.1
16.9
38%
NA
NA
Out of School Suspensions, % Male
OCR
2011–12
27.0
7.0
26%
10.0
70%
Out of School Suspensions, % Female
OCR
2011–12
11.0
3.0
27%
3.0
100%
In Need of LEP, % of Population Over 3 Enrolled
OCR
2009–10
0.0
0.1
467%
27.3
0%
Enrolled in LEP, % of Population Over 3 Enrolled
OCR
2009–10
0.0
0.0
418%
23.5
0%
IDEA, % of Population Over 3 Enrolled
OCR
2009–10
7.4
6.5
88%
4.3
151%
Gifted-Talented, % of Population Over 3 Enrolled
OCR
2009–10
2.7
6.2
43%
3.4
54%
TEACHER QUALITY
ENROLLMENT
Nursery School, Preschool, % of Population Under 5
Enrolled in Alg 1 in Grade 7–Grade 8, % of Population
Over 3 Enrolled
STUDENT STATUS & RISK FACTORS
Families and People For Whom Poverty Status
is Determined:
MISSOURI
ACHIEVEMENT INDICATORS
Grade 4: At or Above Proficient: Reading, %
NAEP
2013
13.5
40.6
33%
30.4
75%
Grade 4: At or Above Proficient: Math, %
NAEP
2013
13.4
45.9
29%
28.8
63%
Grade 8: At or Above Proficient: Reading, %
NAEP
2013
13.2
41.4
32%
32.1
78%
Grade 8: At or Above Proficient: Math, %
NAEP
2013
11.6
37.6
31%
23.1
61%
Grade 4: Average Scale Score: Reading (Out of 500)
NAEP
2013
200.1
227.9
88%
218.8
96%
Grade 4: Average Scale Score: Mathematics (Out of 500)
NAEP
2013
219.3
245.0
90%
233.1
95%
Grade 8: Average Scale Score: Reading (Out of 500)
NAEP
2013
244.9
272.7
90%
266.5
98%
Grade 8: Average Scale Score: Mathematics (Out of 500)
NAEP
2013
260.4
288.3
90%
275.8
96%
Average Freshman Graduation Rate
NCES
2009–10
71.2
86.5
82%
81.2
94%
2015 STATE OF BLACK AMERICA¨
SAVE OUR CITIES
NATIONAL URBAN LEAGUE
2015 State Education Equality Index™ + 88
2015 STATE EDUCATION EQUALITY INDEX
Source
Year
Black
White
B–W
Index
Hispanic
Hisp.–White
Index
Percentage of Students Enrolled in Schools With More
Than 20% of First-Year Teachers
OCR
2011–12
12.0
2.0
17%
6.0
33%
Percentage of Students Attending Schools With More
Than 20% of Teachers Not Yet Certified
OCR
2011–12
3.1
2.8
90%
4.1
68%
ACS–Census
2013
25.4
27.4
93%
29.0
106%
OCR
2009–10
1.2
1.1
103%
0.7
57%
Percent of All Families With Related Children
Under 18 Years Only
ACS
2013
35.7
15.4
43%
33.9
45%
Percent of All Families With Related Children
Under 5 Years Only
ACS
2013
32.7
17.7
54%
31.6
56%
Out of School Suspensions, % Male
OCR
2011–12
13.0
5.0
38%
10.0
50%
Out of School Suspensions, % Female
OCR
2011–12
16.0
2.0
13%
4.0
50%
In Need of LEP, % of Population Over 3 Enrolled
OCR
2009–10
0.7
0.3
46%
15.2
2%
Enrolled in LEP, % of Population Over 3 Enrolled
OCR
2009–10
0.6
0.3
44%
12.6
2%
IDEA, % of Population Over 3 Enrolled
OCR
2009–10
9.2
7.4
80%
4.8
153%
Gifted-Talented, % of Population Over 3 Enrolled
OCR
2009–10
1.4
2.4
56%
1.0
40%
58%
MISSOURI (CONTINUED)
TEACHER QUALITY
ENROLLMENT
Nursery School, Preschool, % of Population Under 5
Enrolled in Alg 1 in Grade 7–Grade 8, % of Population
Over 3 Enrolled
STUDENT STATUS & RISK FACTORS
Families and People For Whom Poverty Status
is Determined:
MONTANA
ACHIEVEMENT INDICATORS
Grade 4: At or Above Proficient: Reading, %
NAEP
2013
NA
39.3
NA
22.7
Grade 4: At or Above Proficient: Math, %
NAEP
2013
NA
50.2
NA
33.8
67%
Grade 8: At or Above Proficient: Reading, %
NAEP
2013
NA
45.0
NA
28.4
63%
Grade 8: At or Above Proficient: Math, %
NAEP
2013
NA
44.1
NA
28.2
64%
Grade 4: Average Scale Score: Reading (Out of 500)
NAEP
2013
NA
227.5
NA
213.9
94%
Grade 4: Average Scale Score: Mathematics (Out of 500)
NAEP
2013
NA
247.7
NA
236.6
96%
Grade 8: Average Scale Score: Reading (Out of 500)
NAEP
2013
NA
276.2
NA
262.5
95%
Grade 8: Average Scale Score: Mathematics (Out of 500)
NAEP
2013
NA
293.5
NA
281.8
96%
Average Freshman Graduation Rate
NCES
2009–10
71.9
84.7
85%
74.9
88%
Percentage of Students Enrolled in Schools With More
Than 20% of First-Year Teachers
OCR
2011–12
1.0
2.0
200%
2.0
100%
Percentage of Students Attending Schools With More
Than 20% of Teachers Not Yet Certified
OCR
2011–12
0.0
0.2
0%
0.1
200%
ACS–Census
2013
30.5
21.8
140%
14.8
68%
OCR
2009–10
0.7
1.2
58%
0.7
60%
TEACHER QUALITY
ENROLLMENT
Nursery School, Preschool, % of Population Under 5
Enrolled in Alg 1 in Grade 7–Grade 8, % of Population
Over 3 Enrolled
2015 STATE OF BLACK AMERICA¨
SAVE OUR CITIES
NATIONAL URBAN LEAGUE
2015 State Education Equality Index™ + 89
2015 STATE EDUCATION EQUALITY INDEX
Source
Year
Black
White
B–W
Index
Hispanic
Hisp.–White
Index
Percent of All Families With Related Children
Under 18 Years Only
ACS
2013
39.1
16.1
41%
30.7
52%
Percent of All Families With Related Children
Under 5 Years Only
ACS
2013
34.5
16.4
48%
31.7
52%
Out of School Suspensions, % Male
OCR
2011–12
24.0
5.0
21%
8.0
63%
Out of School Suspensions, % Female
OCR
2011–12
4.0
2.0
50%
3.0
67%
In Need of LEP, % of Population Over 3 Enrolled
OCR
2009–10
1.4
0.6
42%
2.2
27%
Enrolled in LEP, % of Population Over 3 Enrolled
OCR
2009–10
NA
3.4
NA
1.9
183%
IDEA, % of Population Over 3 Enrolled
OCR
2009–10
12.8
5.9
46%
4.9
120%
Gifted-Talented, % of Population Over 3 Enrolled
OCR
2009–10
6.2
3.9
160%
1.5
40%
MONTANA
(CONTINUED)
STUDENT STATUS & RISK FACTORS
Families and People For Whom Poverty Status
is Determined:
NEBRASKA
ACHIEVEMENT INDICATORS
Grade 4: At or Above Proficient: Reading, %
NAEP
2013
15.7
42.8
37%
21.6
51%
Grade 4: At or Above Proficient: Math, %
NAEP
2013
12.4
54.3
23%
20.5
38%
Grade 8: At or Above Proficient: Reading, %
NAEP
2013
16.3
42.7
38%
19.1
45%
Grade 8: At or Above Proficient: Math, %
NAEP
2013
7.8
42.1
19%
16.7
40%
90%
Grade 4: Average Scale Score: Reading (Out of 500)
NAEP
2013
202.1
229.3
88%
207.2
Grade 4: Average Scale Score: Mathematics (Out of 500)
NAEP
2013
214.7
250.5
86%
227.3
91%
Grade 8: Average Scale Score: Reading (Out of 500)
NAEP
2013
250.7
274.6
91%
254.0
92%
Grade 8: Average Scale Score: Mathematics (Out of 500)
NAEP
2013
250.5
292.2
86%
266.9
91%
Average Freshman Graduation Rate
NCES
2009–10
57.6
88.8
65%
71.3
80%
Percentage of Students Enrolled in Schools With More
Than 20% of First-Year Teachers
OCR
2011–12
1.0
1.0
100%
2.0
50%
Percentage of Students Attending Schools With More
Than 20% of Teachers Not Yet Certified
OCR
2011–12
0.1
0.2
200%
0.1
200%
ACS-Census
2013
19.4
27.0
72%
22.3
83%
OCR
2009–10
1.4
1.4
100%
1.1
81%
Percent of All Families With Related Children
Under 18 Years Only
ACS
2013
39.9
10.2
26%
30.6
33%
Percent of All Families With Related Children
Under 5 Years Only
ACS
2013
35.0
15.7
45%
31.5
50%
Out of School Suspensions, % Male
OCR
2011–12
18.0
7.0
39%
8.0
88%
Out of School Suspensions, % Female
OCR
2011–12
15.0
2.0
13%
3.0
67%
In Need of LEP, % of Population Over 3 Enrolled
OCR
2009–10
4.2
0.3
7%
25.1
1%
Enrolled in LEP, % of Population Over 3 Enrolled
OCR
2009–10
3.8
0.2
6%
23.4
1%
IDEA, % of Population Over 3 Enrolled
OCR
2009–10
13.0
7.3
56%
9.4
78%
Gifted-Talented, % of Population Over 3 Enrolled
OCR
2009–10
3.4
6.0
56%
2.8
47%
TEACHER QUALITY
ENROLLMENT
Nursery School, Preschool, % of Population Under 5
Enrolled in Alg 1 in Grade 7–Grade 8, % of Population
Over 3 Enrolled
STUDENT STATUS & RISK FACTORS
Families and People For Whom Poverty Status
is Determined:
2015 STATE OF BLACK AMERICA¨
SAVE OUR CITIES
NATIONAL URBAN LEAGUE
2015 State Education Equality Index™ + 90
2015 STATE EDUCATION EQUALITY INDEX
Source
Year
Black
White
B–W
Index
Hispanic
Hisp.–White
Index
42%
NEVADA
ACHIEVEMENT INDICATORS
Grade 4: At or Above Proficient: Reading, %
NAEP
2013
14.1
39.5
36%
16.4
Grade 4: At or Above Proficient: Math, %
NAEP
2013
17.0
46.1
37%
24.4
53%
Grade 8: At or Above Proficient: Reading, %
NAEP
2013
17.6
42.6
41%
19.2
45%
Grade 8: At or Above Proficient: Math, %
NAEP
2013
12.3
40.1
31%
17.2
43%
Grade 4: Average Scale Score: Reading (Out of 500)
NAEP
2013
200.7
226.5
89%
202.1
89%
Grade 4: Average Scale Score: Mathematics (Out of 500)
NAEP
2013
221.2
245.1
90%
230.0
94%
Grade 8: Average Scale Score: Reading (Out of 500)
NAEP
2013
247.8
272.7
91%
251.9
92%
Grade 8: Average Scale Score: Mathematics (Out of 500)
NAEP
2013
262.7
288.8
91%
268.0
93%
Average Freshman Graduation Rate
NCES
2009–10
46.7
65.5
71%
47.2
72%
Percentage of Students Enrolled in Schools With More
Than 20% of First-Year Teachers
OCR
2011–12
2.0
3.0
150%
1.0
300%
Percentage of Students Attending Schools With More
Than 20% of Teachers Not Yet Certified
OCR
2011–12
0.0
0.2
0%
0.0
NA
ACS–Census
2013
15.8
20.5
77%
13.9
68%
OCR
2009–10
0.8
0.9
95%
0.9
100%
Percent of All Families With Related Children
Under 18 Years Only
ACS
2013
30.6
11.0
36%
26.7
41%
Percent of All Families With Related Children
Under 5 Years Only
ACS
2013
29.1
9.2
32%
28.6
32%
Out of School Suspensions, % Male
OCR
2011–12
23.0
8.0
35%
12.0
67%
Out of School Suspensions, % Female
OCR
2011–12
9.0
2.0
22%
4.0
50%
1%
TEACHER QUALITY
ENROLLMENT
Nursery School, Preschool, % of Population Under 5
Enrolled in Alg 1 in Grade 7–Grade 8, % of Population
Over 3 Enrolled
STUDENT STATUS & RISK FACTORS
Families and People For Whom Poverty Status
is Determined:
In Need of LEP, % of Population Over 3 Enrolled
OCR
2009–10
1.5
0.4
28%
33.7
Enrolled in LEP, % of Population Over 3 Enrolled
OCR
2009–10
1.2
0.3
25%
26.5
1%
IDEA, % of Population Over 3 Enrolled
OCR
2009–10
11.1
4.5
40%
6.9
65%
Gifted-Talented, % of Population Over 3 Enrolled
OCR
2009–10
0.6
1.4
47%
0.6
47%
NEW HAMPSHIRE
ACHIEVEMENT INDICATORS
Grade 4: At or Above Proficient: Reading, %
NAEP
2013
26.6
46.2
58%
18.4
40%
Grade 4: At or Above Proficient: Math, %
NAEP
2013
NA
60.3
NA
34.5
57%
Grade 8: At or Above Proficient: Reading, %
NAEP
2013
NA
44.8
NA
18.3
41%
Grade 8: At or Above Proficient: Math, %
NAEP
2013
NA
47.9
NA
19.9
42%
Grade 4: Average Scale Score: Reading (Out of 500)
NAEP
2013
215.3
233.4
92%
208.8
89%
Grade 4: Average Scale Score: Mathematics (Out of 500)
NAEP
2013
NA
254.1
NA
235.9
93%
Grade 8: Average Scale Score: Reading (Out of 500)
NAEP
2013
NA
275.4
NA
250.6
91%
Grade 8: Average Scale Score: Mathematics (Out of 500)
NAEP
2013
NA
296.9
NA
270.2
91%
Average Freshman Graduation Rate
NCES
2009–10
78.5
85.9
91%
89.9
105%
2015 STATE OF BLACK AMERICA¨
SAVE OUR CITIES
NATIONAL URBAN LEAGUE
2015 State Education Equality Index™ + 91
2015 STATE EDUCATION EQUALITY INDEX
Source
Year
Black
White
B–W
Index
Hispanic
Hisp.–White
Index
Percentage of Students Enrolled in Schools With More
Than 20% of First-Year Teachers
OCR
2011–12
1.0
1.0
100%
2.0
50%
Percentage of Students Attending Schools With More
Than 20% of Teachers Not Yet Certified
OCR
2011–12
0.5
0.9
180%
0.3
300%
ACS-Census
2013
29.5
30.2
98%
14.2
47%
OCR
2009–10
0.9
1.3
69%
0.4
29%
Percent of All Families With Related Children
Under 18 Years Only
ACS
2013
35.1
8.0
23%
22.3
36%
Percent of All Families With Related Children
Under 5 Years Only
ACS
2013
36.0
10.3
29%
16.8
61%
Out of School Suspensions, % Male
OCR
2011–12
15.0
4.0
27%
8.0
50%
Out of School Suspensions, % Female
OCR
2011–12
10.0
3.0
30%
5.0
60%
In Need of LEP, % of Population Over 3 Enrolled
OCR
2009–10
13.1
0.3
2%
12.8
2%
Enrolled in LEP, % of Population Over 3 Enrolled
OCR
2009–10
11.6
0.2
2%
11.4
2%
NEW HAMPSHIRE
(CONTINUED)
TEACHER QUALITY
ENROLLMENT
Nursery School, Preschool, % of Population Under 5
Enrolled in Alg 1 in Grade 7–Grade 8, % of Population
Over 3 Enrolled
STUDENT STATUS & RISK FACTORS
Families and People For Whom Poverty Status
is Determined:
IDEA, % of Population Over 3 Enrolled
OCR
2009–10
13.0
9.3
72%
8.0
117%
Gifted-Talented, % of Population Over 3 Enrolled
OCR
2009–10
0.3
0.9
35%
0.2
22%
NEW JERSEY
ACHIEVEMENT INDICATORS
Grade 4: At or Above Proficient: Reading, %
NAEP
2013
22.4
52.5
0.4
20.5
39%
Grade 4: At or Above Proficient: Math, %
NAEP
2013
24.2
61.0
0.4
29.8
49%
Grade 8: At or Above Proficient: Reading, %
NAEP
2013
25.6
55.0
0.5
30.7
56%
Grade 8: At or Above Proficient: Math, %
NAEP
2013
23.7
57.7
0.4
33.6
58%
Grade 4: Average Scale Score: Reading (Out of 500)
NAEP
2013
211.3
237.8
0.9
211.6
89%
Grade 4: Average Scale Score: Mathematics (Out of 500)
NAEP
2013
229.0
254.4
0.9
234.4
92%
Grade 8: Average Scale Score: Reading (Out of 500)
NAEP
2013
259.6
283.1
0.9
264.4
93%
Grade 8: Average Scale Score: Mathematics (Out of 500)
NAEP
2013
274.2
303.3
0.9
282.9
93%
Average Freshman Graduation Rate
NCES
2009–10
74.8
91.8
0.8
77.1
84%
Percentage of Students Enrolled in Schools With More
Than 20% of First-Year Teachers
OCR
2011–12
5.0
1.0
0.2
3.0
33%
Percentage of Students Attending Schools With More
Than 20% of Teachers Not Yet Certified
OCR
2011–12
0.7
0.8
1.1
0.5
160%
ACS-Census
2013
27.4
34.0
0.8
28.9
85%
OCR
2009–10
1.0
1.7
0.6
1.0
62%
TEACHER QUALITY
ENROLLMENT
Nursery School, Preschool, % of Population Under 5
Enrolled in Alg 1 in Grade 7–Grade 8, % of Population
Over 3 Enrolled
2015 STATE OF BLACK AMERICA¨
SAVE OUR CITIES
NATIONAL URBAN LEAGUE
2015 State Education Equality Index™ + 92
2015 STATE EDUCATION EQUALITY INDEX
Source
Year
Black
White
B–W
Index
Hispanic
Hisp.–White
Index
Percent of All Families With Related Children
Under 18 Years Only
ACS
2013
25.5
6.7
0.3
25.2
27%
Percent of All Families With Related Children
Under 5 Years Only
ACS
2013
25.4
6.4
0.3
24.0
27%
NEW JERSEY (CONTINUED)
STUDENT STATUS & RISK FACTORS
Families and People For Whom Poverty Status
is Determined:
Out of School Suspensions, % Male
OCR
2011–12
18.0
8.0
0.4
11.0
73%
Out of School Suspensions, % Female
OCR
2011–12
9.0
2.0
0.2
4.0
50%
In Need of LEP, % of Population Over 3 Enrolled
OCR
2009–10
0.8
0.3
0.4
9.2
4%
Enrolled in LEP, % of Population Over 3 Enrolled
OCR
2009–10
0.8
0.3
0.4
8.7
3%
IDEA, % of Population Over 3 Enrolled
OCR
2009–10
10.0
6.9
0.7
8.0
87%
Gifted-Talented, % of Population Over 3 Enrolled
OCR
2009–10
3.0
4.7
0.6
2.6
56%
NEW MEXICO
ACHIEVEMENT INDICATORS
Grade 4: At or Above Proficient: Reading, %
NAEP
2013
24.1
38.0
63%
16.8
44%
Grade 4: At or Above Proficient: Math, %
NAEP
2013
24.3
47.9
51%
25.7
54%
Grade 8: At or Above Proficient: Reading, %
NAEP
2013
14.5
39.9
36%
16.5
41%
Grade 8: At or Above Proficient: Math, %
NAEP
2013
12.0
40.2
30%
16.8
42%
Grade 4: Average Scale Score: Reading (Out of 500)
NAEP
2013
210.1
225.0
93%
200.5
89%
Grade 4: Average Scale Score: Mathematics (Out of 500)
NAEP
2013
225.0
245.5
92%
229.4
93%
Grade 8: Average Scale Score: Reading (Out of 500)
NAEP
2013
245.2
271.2
90%
251.7
93%
Grade 8: Average Scale Score: Mathematics (Out of 500)
NAEP
2013
258.4
289.4
89%
267.8
93%
Average Freshman Graduation Rate
NCES
2009–10
59.4
70.5
84%
65.3
93%
Percentage of Students Enrolled in Schools With More
Than 20% of First-Year Teachers
OCR
2011–12
3.0
2.0
67%
2.0
100%
Percentage of Students Attending Schools With More
Than 20% of Teachers Not Yet Certified
OCR
2011–12
0.1
0.2
200%
0.2
100%
ACS–Census
2013
11.4
21.7
52%
20.2
93%
OCR
2009–10
0.8
0.6
138%
1.0
157%
Percent of All Families With Related Children
Under 18 Years Only
ACS
2013
30.3
14.4
48%
31.6
46%
Percent of All Families With Related Children
Under 5 Years Only
ACS
2013
53.4
11.9
22%
31.0
38%
Out of School Suspensions, % Male
OCR
2011–12
9.0
5.0
56%
4.0
125%
Out of School Suspensions, % Female
OCR
2011–12
10.0
3.0
30%
6.0
50%
In Need of LEP, % of Population Over 3 Enrolled
OCR
2009–10
1.6
0.3
17%
14.0
2%
Enrolled in LEP, % of Population Over 3 Enrolled
OCR
2009–10
1.6
0.2
14%
11.9
2%
IDEA, % of Population Over 3 Enrolled
OCR
2009–10
9.8
3.1
32%
8.0
39%
Gifted-Talented, % of Population Over 3 Enrolled
OCR
2009–10
2.3
2.0
112%
1.7
85%
TEACHER QUALITY
ENROLLMENT
Nursery School, Preschool, % of Population Under 5
Enrolled in Alg 1 in Grade 7–Grade 8, % of Population
Over 3 Enrolled
STUDENT STATUS & RISK FACTORS
Families and People For Whom Poverty Status
is Determined:
2015 STATE OF BLACK AMERICA¨
SAVE OUR CITIES
NATIONAL URBAN LEAGUE
2015 State Education Equality Index™ + 93
2015 STATE EDUCATION EQUALITY INDEX
Source
Year
Black
White
B–W
Index
Hispanic
Hisp.–White
Index
Grade 4: At or Above Proficient: Reading, %
NAEP
2013
21.2
47.0
Grade 4: At or Above Proficient: Math, %
NAEP
2013
17.0
50.4
45%
21.5
46%
34%
23.6
Grade 8: At or Above Proficient: Reading, %
NAEP
2013
17.8
46.1
39%
47%
19.2
42%
Grade 8: At or Above Proficient: Math, %
NAEP
2013
12.3
43.9
28%
14.5
33%
Grade 4: Average Scale Score: Reading (Out of 500)
NAEP
2013
210.6
232.9
90%
210.0
90%
92%
NEW YORK
ACHIEVEMENT INDICATORS
Grade 4: Average Scale Score: Mathematics (Out of 500)
NAEP
2013
224.7
248.1
91%
228.8
Grade 8: Average Scale Score: Reading (Out of 500)
NAEP
2013
251.9
276.5
91%
251.9
91%
Grade 8: Average Scale Score: Mathematics (Out of 500)
NAEP
2013
261.5
293.7
89%
265.2
90%
Average Freshman Graduation Rate
NCES
2009–10
61.7
86.7
71%
60.7
70%
Percentage of Students Enrolled in Schools With More
Than 20% of First-Year Teachers
OCR
2011–12
4.0
0.5
13%
3.0
17%
Percentage of Students Attending Schools With More
Than 20% of Teachers Not Yet Certified
OCR
2011–12
9.8
0.5
5%
7.7
6%
ACS-Census
2013
26.7
26.7
100%
22.2
83%
OCR
2009–10
0.4
1.1
37%
0.3
32%
Percent of All Families With Related Children
Under 18 Years Only
ACS
2013
27.6
11.1
40%
31.0
36%
Percent of All Families With Related Children
Under 5 Years Only
ACS
2013
25.4
11.6
46%
23.9
49%
Out of School Suspensions, % Male
OCR
2011–12
23.0
8.0
35%
11.0
73%
Out of School Suspensions, % Female
OCR
2011–12
5.0
2.0
40%
2.0
100%
In Need of LEP, % of Population Over 3 Enrolled
OCR
2009–10
0.6
0.2
42%
4.9
5%
Enrolled in LEP, % of Population Over 3 Enrolled
OCR
2009–10
0.5
0.2
42%
4.7
5%
TEACHER QUALITY
ENROLLMENT
Nursery School, Preschool, % of Population Under 5
Enrolled in Alg 1 in Grade 7–Grade 8, % of Population
Over 3 Enrolled
STUDENT STATUS & RISK FACTORS
Families and People For Whom Poverty Status
is Determined:
IDEA, % of Population Over 3 Enrolled
OCR
2009–10
4.4
5.5
125%
3.0
185%
Gifted-Talented, % of Population Over 3 Enrolled
OCR
2009–10
1.8
1.4
130%
1.5
109%
NORTH CAROLINA
ACHIEVEMENT INDICATORS
Grade 4: At or Above Proficient: Reading, %
NAEP
2013
19.6
46.8
42%
23.3
50%
Grade 4: At or Above Proficient: Math, %
NAEP
2013
22.5
60.4
37%
34.6
57%
Grade 8: At or Above Proficient: Reading, %
NAEP
2013
16.4
42.9
38%
23.5
55%
Grade 8: At or Above Proficient: Math, %
NAEP
2013
17.0
48.1
35%
26.8
56%
Grade 4: Average Scale Score: Reading (Out of 500)
NAEP
2013
209.7
232.4
90%
210.1
90%
Grade 4: Average Scale Score: Mathematics (Out of 500)
NAEP
2013
230.3
254.0
91%
239.0
94%
Grade 8: Average Scale Score: Reading (Out of 500)
NAEP
2013
250.7
273.4
92%
257.9
94%
Grade 8: Average Scale Score: Mathematics (Out of 500)
NAEP
2013
268.3
296.1
91%
278.9
94%
Average Freshman Graduation Rate
NCES
2009–10
69.5
80.6
86%
67.4
84%
2015 STATE OF BLACK AMERICA¨
SAVE OUR CITIES
NATIONAL URBAN LEAGUE
2015 State Education Equality Index™ + 94
2015 STATE EDUCATION EQUALITY INDEX
Source
Year
Black
White
B–W
Index
Hispanic
Hisp.–White
Index
Percentage of Students Enrolled in Schools With More
Than 20% of First-Year Teachers
OCR
2011–12
5.0
1.0
20%
4.0
25%
Percentage of Students Attending Schools With More
Than 20% of Teachers Not Yet Certified
OCR
2011–12
2.2
1.1
50%
0.7
157%
ACS–Census
2013
23.8
25.7
93%
20.2
79%
OCR
2009–10
0.7
1.2
59%
0.6
54%
Percent of All Families With Related Children
Under 18 Years Only
ACS
2013
32.8
13.3
41%
37.2
36%
Percent of All Families With Related Children
Under 5 Years Only
ACS
2013
37.9
13.4
35%
30.0
45%
Out of School Suspensions, % Male
OCR
2011–12
6.0
2.0
33%
5.0
40%
Out of School Suspensions, % Female
OCR
2011–12
12.0
3.0
25%
4.0
75%
In Need of LEP, % of Population Over 3 Enrolled
OCR
2009–10
0.5
0.4
66%
34.6
1%
Enrolled in LEP, % of Population Over 3 Enrolled
OCR
2009–10
0.3
0.2
72%
25.7
1%
IDEA, % of Population Over 3 Enrolled
OCR
2009–10
9.7
5.7
59%
5.9
97%
Gifted-Talented, % of Population Over 3 Enrolled
OCR
2009–10
3.1
8.1
38%
2.6
33%
NORTH CAROLINA (CONTINUED)
TEACHER QUALITY
ENROLLMENT
Nursery School, Preschool, % of Population Under 5
Enrolled in Alg 1 in Grade 7–Grade 8, % of Population
Over 3 Enrolled
STUDENT STATUS & RISK FACTORS
Families and People For Whom Poverty Status
is Determined:
NORTH DAKOTA
ACHIEVEMENT INDICATORS
Grade 4: At or Above Proficient: Reading, %
NAEP
2013
23.3
36.6
64%
29.0
79%
Grade 4: At or Above Proficient: Math, %
NAEP
2013
34.6
52.1
66%
27.2
52%
Grade 8: At or Above Proficient: Reading, %
NAEP
2013
23.0
37.0
62%
NA
NA
Grade 8: At or Above Proficient: Math, %
NAEP
2013
25.0
44.4
56%
NA
NA
Grade 4: Average Scale Score: Reading (Out of 500)
NAEP
2013
210.6
227.2
93%
217.3
96%
Grade 4: Average Scale Score: Mathematics (Out of 500)
NAEP
2013
239.4
249.3
96%
237.3
95%
Grade 8: Average Scale Score: Reading (Out of 500)
NAEP
2013
254.8
270.5
94%
NA
NA
Grade 8: Average Scale Score: Mathematics (Out of 500)
NAEP
2013
271.6
294.3
92%
NA
NA
Average Freshman Graduation Rate
NCES
2009–10
100.0
91.3
110%
66.7
73%
Percentage of Students Enrolled in Schools With More
Than 20% of First-Year Teachers
OCR
2011–12
1.0
2.0
200%
2.0
100%
Percentage of Students Attending Schools With More
Than 20% of Teachers Not Yet Certified
OCR
2011–12
0.0
0.2
0%
0.2
100%
ACS–Census
2013
25.0
24.3
103%
10.1
41%
OCR
2009–10
0.4
0.9
47%
NA
NA
TEACHER QUALITY
ENROLLMENT
Nursery School, Preschool, % of Population Under 5
Enrolled in Alg 1 in Grade 7–Grade 8, % of Population
Over 3 Enrolled
2015 STATE OF BLACK AMERICA¨
SAVE OUR CITIES
NATIONAL URBAN LEAGUE
2015 State Education Equality Index™ + 95
2015 STATE EDUCATION EQUALITY INDEX
Source
Year
Black
White
B–W
Index
Hispanic
Hisp.–White
Index
Percent of All Families With Related Children
Under 18 Years Only
ACS
2013
NA
6.2
NA
22.2
28%
Percent of All Families With Related Children
Under 5 Years Only
ACS
2013
26.2
9.0
34%
14.4
63%
Out of School Suspensions, % Male
OCR
2011–12
24.0
7.0
29%
12.0
58%
Out of School Suspensions, % Female
OCR
2011–12
1.0
1.0
100%
2.0
50%
In Need of LEP, % of Population Over 3 Enrolled
OCR
2009–10
23.4
0.3
1%
15.6
2%
NORTH DAKOTA
(CONTINUED)
STUDENT STATUS & RISK FACTORS
Families and People For Whom Poverty Status
is Determined:
Enrolled in LEP, % of Population Over 3 Enrolled
OCR
2009–10
20.2
0.2
1%
16.8
1%
IDEA, % of Population Over 3 Enrolled
OCR
2009–10
11.6
7.2
62%
8.5
85%
Gifted-Talented, % of Population Over 3 Enrolled
OCR
2009–10
1.8
1.9
96%
0.5
25%
OHIO
ACHIEVEMENT INDICATORS
Grade 4: At or Above Proficient: Reading, %
NAEP
2013
11.3
44.1
26%
25.2
57%
Grade 4: At or Above Proficient: Math, %
NAEP
2013
15.6
56.5
28%
35.9
64%
Grade 8: At or Above Proficient: Reading, %
NAEP
2013
16.4
42.8
38%
34.2
80%
Grade 8: At or Above Proficient: Math, %
NAEP
2013
15.7
45.2
35%
27.1
60%
Grade 4: Average Scale Score: Reading (Out of 500)
NAEP
2013
195.4
231.1
85%
213.6
92%
Grade 4: Average Scale Score: Mathematics (Out of 500)
NAEP
2013
221.6
251.7
88%
237.1
94%
Grade 8: Average Scale Score: Reading (Out of 500)
NAEP
2013
247.0
273.1
90%
265.8
97%
Grade 8: Average Scale Score: Mathematics (Out of 500)
NAEP
2013
266.7
294.2
91%
277.0
94%
Average Freshman Graduation Rate
NCES
2009–10
60.2
86.5
70%
67.7
78%
Percentage of Students Enrolled in Schools With More
Than 20% of First-Year Teachers
OCR
2011–12
5.0
1.0
20%
2.0
50%
Percentage of Students Attending Schools With More
Than 20% of Teachers Not Yet Certified
OCR
2011–12
5.4
0.5
9%
1.0
50%
ACS-Census
2013
24.8
27.8
89%
22.0
79%
OCR
2009–10
0.7
1.4
54%
0.5
38%
Percent of All Families With Related Children
Under 18 Years Only
ACS
2013
40.2
15.5
39%
33.9
46%
Percent of All Families With Related Children
Under 5 Years Only
ACS
2013
47.2
16.8
36%
40.0
42%
Out of School Suspensions, % Male
OCR
2011–12
24.0
7.0
29%
10.0
70%
Out of School Suspensions, % Female
OCR
2011–12
14.0
3.0
21%
6.0
50%
2%
TEACHER QUALITY
ENROLLMENT
Nursery School, Preschool, % of Population Under 5
Enrolled in Alg 1 in Grade 7–Grade 8, % of Population
Over 3 Enrolled
STUDENT STATUS & RISK FACTORS
Families and People For Whom Poverty Status
is Determined:
In Need of LEP, % of Population Over 3 Enrolled
OCR
2009–10
2.1
0.2
11%
13.0
Enrolled in LEP, % of Population Over 3 Enrolled
OCR
2009–10
1.1
0.2
17%
11.6
2%
IDEA, % of Population Over 3 Enrolled
OCR
2009–10
10.8
7.3
68%
5.1
145%
Gifted-Talented, % of Population Over 3 Enrolled
OCR
2009–10
1.5
2.6
58%
1.0
36%
2015 STATE OF BLACK AMERICA¨
SAVE OUR CITIES
NATIONAL URBAN LEAGUE
2015 State Education Equality Index™ + 96
2015 STATE EDUCATION EQUALITY INDEX
Source
Year
Black
Grade 4: At or Above Proficient: Reading, %
NAEP
2013
14.2
Grade 4: At or Above Proficient: Math, %
NAEP
2013
13.6
Grade 8: At or Above Proficient: Reading, %
NAEP
2013
14.0
Grade 8: At or Above Proficient: Math, %
NAEP
2013
Grade 4: Average Scale Score: Reading (Out of 500)
NAEP
2013
Grade 4: Average Scale Score: Mathematics (Out of 500)
NAEP
2013
Grade 8: Average Scale Score: Reading (Out of 500)
NAEP
2013
Grade 8: Average Scale Score: Mathematics (Out of 500)
NAEP
2013
255.6
Average Freshman Graduation Rate
NCES
2009–10
68.8
Percentage of Students Enrolled in Schools With More
Than 20% of First-Year Teachers
OCR
2011–12
Percentage of Students Attending Schools With More
Than 20% of Teachers Not Yet Certified
OCR
White
B–W
Index
Hispanic
Hisp.–White
Index
36.0
39%
16.5
46%
45.0
30%
21.3
47%
34.8
40%
18.2
52%
9.4
29.4
32%
14.9
51%
200.6
223.5
90%
204.4
91%
219.4
245.1
90%
229.2
94%
245.3
268.1
91%
251.7
94%
281.0
91%
264.9
94%
80.7
85%
70.7
88%
6.0
2.0
33%
6.0
33%
2011–12
0.6
0.2
33%
0.9
22%
ACS–Census
2013
26.7
26.4
101%
24.1
91%
OCR
2009–10
0.9
1.0
93%
0.6
61%
Percent of All Families With Related Children
Under 18 Years Only
ACS
2013
40.6
16.0
39%
26.3
61%
Percent of All Families With Related Children
Under 5 Years Only
ACS
2013
48.9
18.2
37%
23.0
79%
Out of School Suspensions, % Male
OCR
2011–12
20.0
7.0
35%
9.0
78%
Out of School Suspensions, % Female
OCR
2011–12
13.0
3.0
23%
4.0
75%
In Need of LEP, % of Population Over 3 Enrolled
OCR
2009–10
0.7
0.3
41%
31.4
1%
Enrolled in LEP, % of Population Over 3 Enrolled
OCR
2009–10
0.6
0.2
29%
25.1
1%
IDEA, % of Population Over 3 Enrolled
OCR
2009–10
13.8
8.7
63%
7.2
120%
Gifted-Talented, % of Population Over 3 Enrolled
OCR
2009–10
6.2
9.0
69%
4.9
55%
Grade 4: At or Above Proficient: Reading, %
NAEP
2013
11.4
38.1
30%
16.1
42%
Grade 4: At or Above Proficient: Math, %
NAEP
2013
16.4
46.3
35%
20.3
44%
Grade 8: At or Above Proficient: Reading, %
NAEP
2013
NA
43.5
NA
17.7
41%
OKLAHOMA
ACHIEVEMENT INDICATORS
TEACHER QUALITY
ENROLLMENT
Nursery School, Preschool, % of Population Under 5
Enrolled in Alg 1 in Grade 7–Grade 8, % of Population
Over 3 Enrolled
STUDENT STATUS & RISK FACTORS
Families and People For Whom Poverty Status
is Determined:
OREGON
ACHIEVEMENT INDICATORS
Grade 8: At or Above Proficient: Math, %
NAEP
2013
NA
40.1
NA
16.0
40%
Grade 4: Average Scale Score: Reading (Out of 500)
NAEP
2013
200.2
225.0
89%
199.1
88%
Grade 4: Average Scale Score: Mathematics (Out of 500)
NAEP
2013
220.3
244.9
90%
224.2
92%
Grade 8: Average Scale Score: Reading (Out of 500)
NAEP
2013
NA
273.9
NA
252.7
92%
Grade 8: Average Scale Score: Mathematics (Out of 500)
NAEP
2013
NA
289.7
NA
265.9
92%
Average Freshman Graduation Rate
NCES
2009–10
65.9
77.3
85%
75.6
98%
2015 STATE OF BLACK AMERICA¨
SAVE OUR CITIES
NATIONAL URBAN LEAGUE
2015 State Education Equality Index™ + 97
2015 STATE EDUCATION EQUALITY INDEX
Source
Year
Black
White
B–W
Index
Hispanic
Hisp.–White
Index
Percentage of Students Enrolled in Schools With More
Than 20% of First-Year Teachers
OCR
2011–12
2.0
2.0
100%
1.0
200%
Percentage of Students Attending Schools With More
Than 20% of Teachers Not Yet Certified
OCR
2011–12
0.3
0.5
167%
0.3
167%
ACS-Census
2013
25.2
24.5
103%
18.0
74%
OCR
2009–10
1.6
1.6
105%
1.1
67%
Percent of All Families With Related Children
Under 18 Years Only
ACS
2013
36.9
15.0
41%
29.7
51%
Percent of All Families With Related Children
Under 5 Years Only
ACS
2013
41.1
19.9
48%
29.0
69%
Out of School Suspensions, % Male
OCR
2011–12
22.0
5.0
23%
14.0
36%
Out of School Suspensions, % Female
OCR
2011–12
10.0
3.0
30%
4.0
75%
In Need of LEP, % of Population Over 3 Enrolled
OCR
2009–10
5.5
0.7
13%
31.1
2%
Enrolled in LEP, % of Population Over 3 Enrolled
OCR
2009–10
4.8
0.6
13%
28.5
2%
IDEA, % of Population Over 3 Enrolled
OCR
2009–10
11.9
6.7
56%
8.8
76%
Gifted-Talented, % of Population Over 3 Enrolled
OCR
2009–10
3.0
4.1
74%
1.8
44%
OREGON (CONTINUED)
TEACHER QUALITY
ENROLLMENT
Nursery School, Preschool, % of Population Under 5
Enrolled in Alg 1 in Grade 7–Grade 8, % of Population
Over 3 Enrolled
STUDENT STATUS & RISK FACTORS
Families and People For Whom Poverty Status
is Determined:
PENNSYLVANIA
ACHIEVEMENT INDICATORS
Grade 4: At or Above Proficient: Reading, %
NAEP
2013
19.8
46.9
42%
18.6
40%
Grade 4: At or Above Proficient: Math, %
NAEP
2013
18.8
52.1
36%
24.4
47%
Grade 8: At or Above Proficient: Reading, %
NAEP
2013
17.0
49.1
35%
17.4
35%
Grade 8: At or Above Proficient: Math, %
NAEP
2013
13.0
49.5
26%
15.6
31%
Grade 4: Average Scale Score: Reading (Out of 500)
NAEP
2013
207.9
232.6
89%
208.5
90%
Grade 4: Average Scale Score: Mathematics (Out of 500)
NAEP
2013
225.8
249.6
90%
229.2
92%
Grade 8: Average Scale Score: Reading (Out of 500)
NAEP
2013
249.7
278.6
90%
249.2
89%
Grade 8: Average Scale Score: Mathematics (Out of 500)
NAEP
2013
261.7
297.0
88%
264.4
89%
Average Freshman Graduation Rate
NCES
2009–10
68.3
87.9
78%
70.4
80%
Percentage of Students Enrolled in Schools With More
Than 20% of First-Year Teachers
OCR
2011–12
3.0
0.2
7%
1.0
20%
Percentage of Students Attending Schools With More
Than 20% of Teachers Not Yet Certified
OCR
2011–12
34.5
2.1
6%
20.9
10%
ACS-Census
2013
25.4
27.1
94%
18.6
69%
OCR
2009–10
2.3
2.2
107%
1.9
85%
TEACHER QUALITY
ENROLLMENT
Nursery School, Preschool, % of Population Under 5
Enrolled in Alg 1 in Grade 7–Grade 8, % of Population
Over 3 Enrolled
2015 STATE OF BLACK AMERICA¨
SAVE OUR CITIES
NATIONAL URBAN LEAGUE
2015 State Education Equality Index™ + 98
2015 STATE EDUCATION EQUALITY INDEX
Source
Year
Black
White
B–W
Index
Hispanic
Hisp.–White
Index
Percent of All Families With Related Children
Under 18 Years Only
ACS
2013
31.9
11.0
34%
39.1
28%
Percent of All Families With Related Children
Under 5 Years Only
ACS
2013
30.0
12.2
41%
35.0
35%
Out of School Suspensions, % Male
OCR
2011–12
23.0
9.0
39%
17.0
53%
Out of School Suspensions, % Female
OCR
2011–12
13.0
2.0
15%
7.0
29%
In Need of LEP, % of Population Over 3 Enrolled
OCR
2009–10
1.2
0.3
21%
12.8
2%
Enrolled in LEP, % of Population Over 3 Enrolled
OCR
2009–10
0.9
0.2
21%
10.5
2%
IDEA, % of Population Over 3 Enrolled
OCR
2009–10
10.0
7.7
77%
8.5
90%
Gifted-Talented, % of Population Over 3 Enrolled
OCR
2009–10
1.2
2.3
54%
0.9
39%
Grade 4: At or Above Proficient: Reading, %
NAEP
2013
18.1
48.0
38%
16.9
35%
Grade 4: At or Above Proficient: Math, %
NAEP
2013
18.6
53.4
35%
22.8
43%
Grade 8: At or Above Proficient: Reading, %
NAEP
2013
18.2
44.1
41%
17.8
40%
Grade 8: At or Above Proficient: Math, %
NAEP
2013
14.5
45.2
32%
15.4
34%
Grade 4: Average Scale Score: Reading (Out of 500)
NAEP
2013
205.4
233.1
88%
201.5
86%
Grade 4: Average Scale Score: Mathematics (Out of 500)
NAEP
2013
224.1
249.8
90%
225.7
90%
Grade 8: Average Scale Score: Reading (Out of 500)
NAEP
2013
249.3
274.6
91%
248.7
91%
Grade 8: Average Scale Score: Mathematics (Out of 500)
NAEP
2013
262.8
293.6
90%
262.9
90%
Average Freshman Graduation Rate
NCES
2009–10
74.2
78.3
95%
69.1
88%
Percentage of Students Enrolled in Schools With More
Than 20% of First-Year Teachers
OCR
2011–12
3.0
0.3
10%
5.0
6%
Percentage of Students Attending Schools With More
Than 20% of Teachers Not Yet Certified
OCR
2011–12
0.6
0.2
33%
0.6
33%
ACS–Census
2013
19.7
27.6
71%
12.3
44%
OCR
2009–10
0.7
1.1
59%
0.8
68%
Percent of All Families With Related Children
Under 18 Years Only
ACS
2013
NA
9.6
NA
48.7
20%
Percent of All Families With Related Children
Under 5 Years Only
ACS
2013
34.9
12.3
35%
34.9
35%
Out of School Suspensions, % Male
OCR
2011–12
22.0
9.0
41%
10.0
90%
Out of School Suspensions, % Female
OCR
2011–12
13.0
4.0
31%
9.0
44%
In Need of LEP, % of Population Over 3 Enrolled
OCR
2009–10
4.5
0.3
7%
12.0
3%
Enrolled in LEP, % of Population Over 3 Enrolled
OCR
2009–10
4.3
0.3
7%
11.6
3%
IDEA, % of Population Over 3 Enrolled
OCR
2009–10
12.4
7.0
56%
10.3
67%
Gifted-Talented, % of Population Over 3 Enrolled
OCR
2009–10
1.4
1.0
139%
0.7
67%
PENNSYLVANIA
(CONTINUED)
STUDENT STATUS & RISK FACTORS
Families and People For Whom Poverty Status
is Determined:
RHODE ISLAND
ACHIEVEMENT INDICATORS
TEACHER QUALITY
ENROLLMENT
Nursery School, Preschool, % of Population Under 5
Enrolled in Alg 1 in Grade 7–Grade 8, % of Population
Over 3 Enrolled
STUDENT STATUS & RISK FACTORS
Families and People For Whom Poverty Status
is Determined:
2015 STATE OF BLACK AMERICA¨
SAVE OUR CITIES
NATIONAL URBAN LEAGUE
2015 State Education Equality Index™ + 99
2015 STATE EDUCATION EQUALITY INDEX
Source
Year
Black
White
B–W
Index
Hispanic
Hisp.–White
Index
55%
SOUTH CAROLINA
ACHIEVEMENT INDICATORS
Grade 4: At or Above Proficient: Reading, %
NAEP
2013
13.2
38.7
34%
21.2
Grade 4: At or Above Proficient: Math, %
NAEP
2013
15.3
48.8
31%
24.9
51%
Grade 8: At or Above Proficient: Reading, %
NAEP
2013
13.9
38.6
36%
24.2
63%
Grade 8: At or Above Proficient: Math, %
NAEP
2013
12.7
42.6
30%
23.2
54%
Grade 4: Average Scale Score: Reading (Out of 500)
NAEP
2013
197.5
224.3
88%
211.3
94%
Grade 4: Average Scale Score: Mathematics (Out of 500)
NAEP
2013
221.8
246.8
90%
228.8
93%
Grade 8: Average Scale Score: Reading (Out of 500)
NAEP
2013
246.7
270.6
91%
256.9
95%
Grade 8: Average Scale Score: Mathematics (Out of 500)
NAEP
2013
261.0
291.8
89%
272.2
93%
Average Freshman Graduation Rate
NCES
2009–10
61.5
72.8
84%
65.7
90%
Percentage of Students Enrolled in Schools With More
Than 20% of First-Year Teachers
OCR
2011–12
2.0
1.0
50%
1.0
100%
Percentage of Students Attending Schools With More
Than 20% of Teachers Not Yet Certified
OCR
2011–12
0.9
0.4
44%
0.2
200%
ACS-Census
2013
24.0
21.5
111%
17.2
80%
OCR
2009–10
0.9
1.6
55%
0.8
50%
Percent of All Families With Related Children
Under 18 Years Only
ACS
2013
37.7
14.4
38%
33.9
42%
Percent of All Families With Related Children
Under 5 Years Only
ACS
2013
48.1
15.8
33%
30.1
52%
Out of School Suspensions, % Male
OCR
2011–12
13.0
4.0
31%
9.0
44%
Out of School Suspensions, % Female
OCR
2011–12
13.0
4.0
31%
4.0
100%
1%
TEACHER QUALITY
ENROLLMENT
Nursery School, Preschool, % of Population Under 5
Enrolled in Alg 1 in Grade 7–Grade 8, % of Population
Over 3 Enrolled
STUDENT STATUS & RISK FACTORS
Families and People For Whom Poverty Status
is Determined:
In Need of LEP, % of Population Over 3 Enrolled
OCR
2009–10
0.1
0.4
269%
43.1
Enrolled in LEP, % of Population Over 3 Enrolled
OCR
2009–10
0.1
0.3
253%
38.0
1%
IDEA, % of Population Over 3 Enrolled
OCR
2009–10
10.1
6.7
66%
5.9
114%
Gifted-Talented, % of Population Over 3 Enrolled
OCR
2009–10
4.1
9.7
42%
3.6
38%
Grade 4: At or Above Proficient: Reading, %
NAEP
2013
17.0
37.9
45%
19.2
51%
Grade 4: At or Above Proficient: Math, %
NAEP
2013
13.8
48.0
29%
16.2
34%
Grade 8: At or Above Proficient: Reading, %
NAEP
2013
NA
39.7
NA
21.5
54%
Grade 8: At or Above Proficient: Math, %
NAEP
2013
10.5
44.6
23%
27.2
61%
Grade 4: Average Scale Score: Reading (Out of 500)
NAEP
2013
201.5
224.8
90%
206.8
92%
Grade 4: Average Scale Score: Mathematics (Out of 500)
NAEP
2013
221.2
247.0
90%
225.7
91%
Grade 8: Average Scale Score: Reading (Out of 500)
NAEP
2013
NA
271.9
NA
259.0
95%
Grade 8: Average Scale Score: Mathematics (Out of 500)
NAEP
2013
254.4
293.6
87%
274.4
93%
Average Freshman Graduation Rate
NCES
2009–10
80.1
86.0
93%
73.4
85%
SOUTH DAKOTA
ACHIEVEMENT INDICATORS
2015 STATE OF BLACK AMERICA¨
SAVE OUR CITIES
NATIONAL URBAN LEAGUE
2015 State Education Equality Index™ + 100
2015 STATE EDUCATION EQUALITY INDEX
Source
Year
Black
White
B–W
Index
Hispanic
Hisp.–White
Index
Percentage of Students Enrolled in Schools With More
Than 20% of First-Year Teachers
OCR
2011–12
2.0
3.0
150%
3.0
100%
Percentage of Students Attending Schools With More
Than 20% of Teachers Not Yet Certified
OCR
2011–12
2.9
5.8
200%
5.8
100%
ACS–Census
2013
13.2
23.1
57%
6.6
29%
OCR
2009–10
NA
1.1
NA
0.2
15%
Percent of All Families With Related Children
Under 18 Years Only
ACS
2013
30.1
10.1
34%
33.1
31%
Percent of All Families With Related Children
Under 5 Years Only
ACS
2013
21.6
9.5
44%
51.8
18%
Out of School Suspensions, % Male
OCR
2011–12
25.0
6.0
24%
9.0
67%
Out of School Suspensions, % Female
OCR
2011–12
7.0
1.0
14%
4.0
25%
In Need of LEP, % of Population Over 3 Enrolled
OCR
2009–10
21.1
NA
NA
12.3
NA
Enrolled in LEP, % of Population Over 3 Enrolled
OCR
2009–10
21.0
0.4
2%
9.3
4%
IDEA, % of Population Over 3 Enrolled
OCR
2009–10
12.8
6.8
53%
9.3
74%
Gifted-Talented, % of Population Over 3 Enrolled
OCR
2009–10
1.2
1.5
77%
0.5
33%
Grade 4: At or Above Proficient: Reading, %
NAEP
2013
15.2
39.8
38%
20.7
52%
Grade 4: At or Above Proficient: Math, %
NAEP
2013
15.1
49.6
30%
21.8
44%
Grade 8: At or Above Proficient: Reading, %
NAEP
2013
16.4
37.9
43%
27.7
73%
Grade 8: At or Above Proficient: Math, %
NAEP
2013
9.7
32.6
30%
21.2
65%
Grade 4: Average Scale Score: Reading (Out of 500)
NAEP
2013
200.7
226.7
89%
203.0
90%
Grade 4: Average Scale Score: Mathematics (Out of 500)
NAEP
2013
220.7
246.5
90%
228.9
93%
Grade 8: Average Scale Score: Reading (Out of 500)
NAEP
2013
250.6
269.8
93%
261.7
97%
Grade 8: Average Scale Score: Mathematics (Out of 500)
NAEP
2013
256.7
283.9
90%
270.4
95%
Average Freshman Graduation Rate
NCES
2009–10
75.6
82.0
92%
78.1
95%
Percentage of Students Enrolled in Schools With More
Than 20% of First-Year Teachers
OCR
2011–12
4.0
2.0
50%
4.0
50%
Percentage of Students Attending Schools With More
Than 20% of Teachers Not Yet Certified
OCR
2011–12
21.2
0.7
3%
7.0
10%
ACS–Census
2013
26.8
21.0
127%
15.1
72%
OCR
2009–10
0.8
0.8
105%
0.7
82%
SOUTH DAKOTA
(CONTINUED)
TEACHER QUALITY
ENROLLMENT
Nursery School, Preschool, % of Population Under 5
Enrolled in Alg 1 in Grade 7–Grade 8, % of Population
Over 3 Enrolled
STUDENT STATUS & RISK FACTORS
Families and People For Whom Poverty Status
is Determined:
TENNESSEE
ACHIEVEMENT INDICATORS
TEACHER QUALITY
ENROLLMENT
Nursery School, Preschool, % of Population Under 5
Enrolled in Alg 1 in Grade 7–Grade 8, % of Population
Over 3 Enrolled
2015 STATE OF BLACK AMERICA¨
SAVE OUR CITIES
NATIONAL URBAN LEAGUE
2015 State Education Equality Index™ + 101
2015 STATE EDUCATION EQUALITY INDEX
Source
Year
Black
White
B–W
Index
Hispanic
Hisp.–White
Index
Percent of All Families With Related Children
Under 18 Years Only
ACS
2013
36.3
17.1
47%
38.4
45%
Percent of All Families With Related Children
Under 5 Years Only
ACS
2013
39.7
18.3
46%
42.8
43%
Out of School Suspensions, % Male
OCR
2011–12
14.6
7.1
49%
29.6
24%
Out of School Suspensions, % Female
OCR
2011–12
51.9
52.7
102%
76.0
69%
In Need of LEP, % of Population Over 3 Enrolled
OCR
2009–10
4.0
5.0
125%
5.0
100%
Enrolled in LEP, % of Population Over 3 Enrolled
OCR
2009–10
0.1
0.2
146%
0.2
99%
IDEA, % of Population Over 3 Enrolled
OCR
2009–10
0.1
0.1
137%
0.2
89%
Gifted-Talented, % of Population Over 3 Enrolled
OCR
2009–10
0.8
1.6
50%
0.7
43%
TENNESSEE (CONTINUED)
STUDENT STATUS & RISK FACTORS
Families and People For Whom Poverty Status
is Determined:
TEXAS
ACHIEVEMENT INDICATORS
Grade 4: At or Above Proficient: Reading, %
NAEP
2013
18.3
46.1
40%
17.1
37%
Grade 4: At or Above Proficient: Math, %
NAEP
2013
24.1
61.5
39%
30.3
49%
Grade 8: At or Above Proficient: Reading, %
NAEP
2013
17.3
49.5
35%
19.9
40%
Grade 8: At or Above Proficient: Math, %
NAEP
2013
21.5
52.8
41%
28.5
54%
Grade 4: Average Scale Score: Reading (Out of 500)
NAEP
2013
209.4
233.3
90%
206.0
88%
Grade 4: Average Scale Score: Mathematics (Out of 500)
NAEP
2013
230.8
255.1
90%
234.7
92%
Grade 8: Average Scale Score: Reading (Out of 500)
NAEP
2013
252.8
278.8
91%
254.8
91%
Grade 8: Average Scale Score: Mathematics (Out of 500)
NAEP
2013
272.5
300.0
91%
281.4
94%
Average Freshman Graduation Rate
NCES
2009–10
69.4
82.8
84%
77.4
93%
Percentage of Students Enrolled in Schools With More
Than 20% of First-Year Teachers
OCR
2011–12
4.0
2.0
50%
3.0
67%
Percentage of Students Attending Schools With More
Than 20% of Teachers Not Yet Certified
OCR
2011–12
2.9
1.4
48%
1.3
108%
ACS-Census
2013
27.0
25.4
106%
21.8
86%
OCR
2009–10
0.8
0.7
110%
0.8
121%
Percent of All Families With Related Children
Under 18 Years Only
ACS
2013
29.2
9.6
33%
29.1
33%
Percent of All Families With Related Children
Under 5 Years Only
ACS
2013
31.3
10.1
32%
26.8
38%
Out of School Suspensions, % Male
OCR
2011–12
14.0
3.0
21%
6.0
50%
Out of School Suspensions, % Female
OCR
2011–12
10.0
2.0
20%
3.0
67%
In Need of LEP, % of Population Over 3 Enrolled
OCR
2009–10
2.4
0.3
11%
23.0
1%
Enrolled in LEP, % of Population Over 3 Enrolled
OCR
2009–10
2.2
0.2
11%
21.1
1%
IDEA, % of Population Over 3 Enrolled
OCR
2009–10
8.0
2.9
36%
6.3
47%
Gifted-Talented, % of Population Over 3 Enrolled
OCR
2009–10
3.2
3.4
95%
4.4
131%
TEACHER QUALITY
ENROLLMENT
Nursery School, Preschool, % of Population Under 5
Enrolled in Alg 1 in Grade 7–Grade 8, % of Population
Over 3 Enrolled
STUDENT STATUS & RISK FACTORS
Families and People For Whom Poverty Status
is Determined:
2015 STATE OF BLACK AMERICA¨
SAVE OUR CITIES
NATIONAL URBAN LEAGUE
2015 State Education Equality Index™ + 102
2015 STATE EDUCATION EQUALITY INDEX
Source
Year
Black
White
B–W
Index
Hispanic
Hisp.–White
Index
UTAH
ACHIEVEMENT INDICATORS
Grade 4: At or Above Proficient: Reading, %
NAEP
2013
NA
42.8
NA
14.0
33%
Grade 4: At or Above Proficient: Math, %
NAEP
2013
NA
51.0
NA
16.4
32%
Grade 8: At or Above Proficient: Reading, %
NAEP
2013
NA
43.7
NA
22.1
51%
Grade 8: At or Above Proficient: Math, %
NAEP
2013
NA
41.9
NA
12.7
30%
Grade 4: Average Scale Score: Reading (Out of 500)
NAEP
2013
NA
229.5
NA
196.5
86%
Grade 4: Average Scale Score: Mathematics (Out of 500)
NAEP
2013
NA
248.2
NA
221.3
89%
Grade 8: Average Scale Score: Reading (Out of 500)
NAEP
2013
NA
273.6
NA
255.9
94%
Grade 8: Average Scale Score: Mathematics (Out of 500)
NAEP
2013
NA
290.6
NA
257.9
89%
Average Freshman Graduation Rate
NCES
2009–10
69.8
81.7
85%
60.6
74%
Percentage of Students Enrolled in Schools With More
Than 20% of First-Year Teachers
OCR
2011–12
4.0
3.0
75%
4.0
75%
Percentage of Students Attending Schools With More
Than 20% of Teachers Not Yet Certified
OCR
2011–12
2.2
3.7
168%
2.5
148%
ACS–Census
2013
35.8
24.2
148%
16.8
69%
OCR
2009–10
1.5
2.1
70%
1.4
64%
Percent of All Families With Related Children
Under 18 Years Only
ACS
2013
26.8
9.4
35%
28.3
33%
Percent of All Families With Related Children
Under 5 Years Only
ACS
2013
19.4
10.0
52%
27.0
37%
Out of School Suspensions, % Male
OCR
2011–12
15.0
7.0
47%
11.0
64%
Out of School Suspensions, % Female
OCR
2011–12
5.0
1.0
20%
3.0
33%
In Need of LEP, % of Population Over 3 Enrolled
OCR
2009–10
13.1
0.4
3%
36.5
1%
Enrolled in LEP, % of Population Over 3 Enrolled
OCR
2009–10
12.9
0.4
3%
34.8
1%
IDEA, % of Population Over 3 Enrolled
OCR
2009–10
11.5
6.7
58%
8.2
82%
Gifted-Talented, % of Population Over 3 Enrolled
OCR
2009–10
3.1
2.1
148%
2.4
115%
TEACHER QUALITY
ENROLLMENT
Nursery School, Preschool, % of Population Under 5
Enrolled in Alg 1 in Grade 7–Grade 8, % of Population
Over 3 Enrolled
STUDENT STATUS & RISK FACTORS
Families and People For Whom Poverty Status
is Determined:
VERMONT
ACHIEVEMENT INDICATORS
Grade 4: At or Above Proficient: Reading, %
NAEP
2013
NA
43.3
NA
NA
NA
Grade 4: At or Above Proficient: Math, %
NAEP
2013
NA
52.6
NA
NA
NA
Grade 8: At or Above Proficient: Reading, %
NAEP
2013
24.8
45.3
55%
NA
NA
Grade 8: At or Above Proficient: Math, %
NAEP
2013
18.0
47.6
38%
NA
NA
Grade 4: Average Scale Score: Reading (Out of 500)
NAEP
2013
NA
229.1
NA
NA
NA
Grade 4: Average Scale Score: Mathematics (Out of 500)
NAEP
2013
NA
248.5
NA
NA
NA
Grade 8: Average Scale Score: Reading (Out of 500)
NAEP
2013
257.4
274.8
94%
NA
NA
Grade 8: Average Scale Score: Mathematics (Out of 500)
NAEP
2013
258.2
296.5
87%
NA
NA
Average Freshman Graduation Rate
NCES
2009–10
100.0
89.9
111%
100.0
111%
2015 STATE OF BLACK AMERICA¨
SAVE OUR CITIES
NATIONAL URBAN LEAGUE
2015 State Education Equality Index™ + 103
2015 STATE EDUCATION EQUALITY INDEX
Source
Year
Black
White
B–W
Index
Hispanic
Hisp.–White
Index
Percentage of Students Enrolled in Schools With More
Than 20% of First-Year Teachers
OCR
2011–12
1.0
1.0
100%
0.4
250%
Percentage of Students Attending Schools With More
Than 20% of Teachers Not Yet Certified
OCR
2011–12
0.6
2.1
350%
2.9
72%
ACS-Census
2013
11.0
25.2
44%
24.1
96%
OCR
2009–10
0.8
1.4
60%
0.3
19%
Percent of All Families With Related Children
Under 18 Years Only
ACS
2013
NA
14.3
NA
18.8
76%
Percent of All Families With Related Children
Under 5 Years Only
ACS
2013
27.1
17.9
66%
7.6
236%
Out of School Suspensions, % Male
OCR
2011–12
19.0
7.0
37%
7.0
100%
Out of School Suspensions, % Female
OCR
2011–12
6.0
3.0
50%
6.0
50%
In Need of LEP, % of Population Over 3 Enrolled
OCR
2009–10
17.4
0.4
2%
4.7
8%
Enrolled in LEP, % of Population Over 3 Enrolled
OCR
2009–10
16.3
0.3
2%
3.4
8%
IDEA, % of Population Over 3 Enrolled
OCR
2009–10
12.6
7.8
62%
3.6
218%
Gifted-Talented, % of Population Over 3 Enrolled
OCR
2009–10
0.2
0.2
107%
0.2
92%
Grade 4: At or Above Proficient: Reading, %
NAEP
2013
23.1
50.8
0.5
25.2
50%
Grade 4: At or Above Proficient: Math, %
NAEP
2013
22.5
55.8
0.4
32.1
58%
Grade 8: At or Above Proficient: Reading, %
NAEP
2013
16.7
44.6
0.4
26.2
59%
Grade 8: At or Above Proficient: Math, %
NAEP
2013
15.0
47.2
0.3
25.3
54%
Grade 4: Average Scale Score: Reading (Out of 500)
NAEP
2013
210.8
235.8
0.9
210.8
89%
Grade 4: Average Scale Score: Mathematics (Out of 500)
NAEP
2013
229.2
251.6
0.9
236.4
94%
Grade 8: Average Scale Score: Reading (Out of 500)
NAEP
2013
249.1
274.9
0.9
262.1
95%
Grade 8: Average Scale Score: Mathematics (Out of 500)
NAEP
2013
266.7
295.9
0.9
279.2
94%
Average Freshman Graduation Rate
NCES
2009–10
71.0
84.9
0.8
75.9
89%
Percentage of Students Enrolled in Schools With More
Than 20% of First-Year Teachers
OCR
2011–12
1.0
1.0
1.0
1.0
100%
Percentage of Students Attending Schools With More
Than 20% of Teachers Not Yet Certified
OCR
2011–12
3.9
1.3
0.3
6.8
19%
ACS-Census
2013
23.9
26.6
0.9
15.7
59%
OCR
2009–10
1.8
2.2
0.8
1.4
66%
VERMONT (CONTINUED)
TEACHER QUALITY
ENROLLMENT
Nursery School, Preschool, % of Population Under 5
Enrolled in Alg 1 in Grade 7–Grade 8, % of Population
Over 3 Enrolled
STUDENT STATUS & RISK FACTORS
Families and People For Whom Poverty Status
is Determined:
VIRGINIA
ACHIEVEMENT INDICATORS
TEACHER QUALITY
ENROLLMENT
Nursery School, Preschool, % of Population Under 5
Enrolled in Alg 1 in Grade 7–Grade 8, % of Population
Over 3 Enrolled
2015 STATE OF BLACK AMERICA¨
SAVE OUR CITIES
NATIONAL URBAN LEAGUE
2015 State Education Equality Index™ + 104
2015 STATE EDUCATION EQUALITY INDEX
Source
Year
Black
White
B–W
Index
Hispanic
Hisp.–White
Index
Percent of All Families With Related Children
Under 18 Years Only
ACS
2013
25.6
9.6
0.4
17.4
55%
Percent of All Families With Related Children
Under 5 Years Only
ACS
2013
26.3
11.3
0.4
18.6
61%
Out of School Suspensions, % Male
OCR
2011–12
18.0
7.0
0.4
10.0
70%
Out of School Suspensions, % Female
OCR
2011–12
10.0
3.0
0.3
3.0
100%
In Need of LEP, % of Population Over 3 Enrolled
OCR
2009–10
1.2
0.5
0.4
28.0
2%
Enrolled in LEP, % of Population Over 3 Enrolled
OCR
2009–10
1.1
0.5
0.4
25.7
2%
IDEA, % of Population Over 3 Enrolled
OCR
2009–10
11.0
6.8
0.6
8.1
84%
Gifted-Talented, % of Population Over 3 Enrolled
OCR
2009–10
4.3
7.7
0.6
4.2
55%
Grade 4: At or Above Proficient: Reading, %
NAEP
2013
24.8
46.2
54%
18.5
40%
Grade 4: At or Above Proficient: Math, %
NAEP
2013
28.8
55.9
51%
23.9
43%
Grade 8: At or Above Proficient: Reading, %
NAEP
2013
22.1
49.5
45%
20.6
42%
Grade 8: At or Above Proficient: Math, %
NAEP
2013
22.7
48.0
47%
22.6
47%
Grade 4: Average Scale Score: Reading (Out of 500)
NAEP
2013
211.0
231.5
91%
205.1
89%
Grade 4: Average Scale Score: Mathematics (Out of 500)
NAEP
2013
230.6
251.2
92%
229.4
91%
Grade 8: Average Scale Score: Reading (Out of 500)
NAEP
2013
257.6
278.8
92%
253.3
91%
Grade 8: Average Scale Score: Mathematics (Out of 500)
NAEP
2013
268.7
295.9
91%
273.2
92%
Average Freshman Graduation Rate
NCES
2009–10
63.0
77.7
81%
64.1
82%
Percentage of Students Enrolled in Schools With More
Than 20% of First-Year Teachers
OCR
2011–12
1.0
0.3
30%
1.0
30%
Percentage of Students Attending Schools With More
Than 20% of Teachers Not Yet Certified
OCR
2011–12
2.4
2.3
96%
1.6
144%
ACS–Census
2013
27.6
22.9
121%
16.1
70%
OCR
2009–10
1.4
1.4
105%
1.0
69%
Percent of All Families With Related Children
Under 18 Years Only
ACS
2013
29.3
11.2
38%
29.9
37%
Percent of All Families With Related Children
Under 5 Years Only
ACS
2013
30.7
11.3
37%
29.0
39%
Out of School Suspensions, % Male
OCR
2011–12
24.0
11.0
46%
13.0
85%
Out of School Suspensions, % Female
OCR
2011–12
9.0
3.0
33%
4.0
75%
In Need of LEP, % of Population Over 3 Enrolled
OCR
2009–10
6.1
0.9
15%
22.3
4%
Enrolled in LEP, % of Population Over 3 Enrolled
OCR
2009–10
5.4
0.8
14%
21.1
4%
IDEA, % of Population Over 3 Enrolled
OCR
2009–10
13.5
6.8
50%
8.0
85%
Gifted-Talented, % of Population Over 3 Enrolled
OCR
2009–10
1.4
2.0
70%
1.2
58%
VIRGINIA
(CONTINUED)
STUDENT STATUS & RISK FACTORS
Families and People For Whom Poverty Status
is Determined:
WASHINGTON
ACHIEVEMENT INDICATORS
TEACHER QUALITY
ENROLLMENT
Nursery School, Preschool, % of Population Under 5
Enrolled in Alg 1 in Grade 7–Grade 8, % of Population
Over 3 Enrolled
STUDENT STATUS & RISK FACTORS
Families and People For Whom Poverty Status
is Determined:
2015 STATE OF BLACK AMERICA¨
SAVE OUR CITIES
NATIONAL URBAN LEAGUE
2015 State Education Equality Index™ + 105
2015 STATE EDUCATION EQUALITY INDEX
Source
Year
Black
White
B–W
Index
Hispanic
Hisp.–White
Index
WEST VIRGINIA
ACHIEVEMENT INDICATORS
Grade 4: At or Above Proficient: Reading, %
NAEP
2013
14.3
27.6
52%
NA
NA
Grade 4: At or Above Proficient: Math, %
NAEP
2013
24.7
35.6
69%
NA
NA
Grade 8: At or Above Proficient: Reading, %
NAEP
2013
23.2
25.1
92%
NA
NA
Grade 8: At or Above Proficient: Math, %
NAEP
2013
13.2
24.0
55%
NA
NA
Grade 4: Average Scale Score: Reading (Out of 500)
NAEP
2013
203.4
215.1
95%
NA
NA
Grade 4: Average Scale Score: Mathematics (Out of 500)
NAEP
2013
228.3
237.7
96%
NA
NA
Grade 8: Average Scale Score: Reading (Out of 500)
NAEP
2013
254.7
257.4
99%
NA
NA
Grade 8: Average Scale Score: Mathematics (Out of 500)
NAEP
2013
263.7
275.0
96%
NA
NA
Average Freshman Graduation Rate
NCES
2009–10
74.4
78.2
95%
74.9
96%
Percentage of Students Enrolled in Schools With More
Than 20% of First-Year Teachers
OCR
2011–12
1.0
1.0
100%
1.0
100%
Percentage of Students Attending Schools With More
Than 20% of Teachers Not Yet Certified
OCR
2011–12
2.2
2.3
105%
1.4
164%
ACS-Census
2013
25.6
20.6
124%
26.3
128%
OCR
2009–10
2.6
1.9
139%
0.9
50%
Percent of All Families With Related Children
Under 18 Years Only
ACS
2013
40.6
22.7
56%
28.5
80%
Percent of All Families With Related Children
Under 5 Years Only
ACS
2013
45.4
26.4
58%
47.2
56%
Out of School Suspensions, % Male
OCR
2011–12
32.0
4.0
13%
10.0
40%
Out of School Suspensions, % Female
OCR
2011–12
14.0
5.0
36%
4.0
125%
In Need of LEP, % of Population Over 3 Enrolled
OCR
2009–10
0.5
0.1
15%
11.3
1%
Enrolled in LEP, % of Population Over 3 Enrolled
OCR
2009–10
0.5
0.1
16%
11.3
1%
IDEA, % of Population Over 3 Enrolled
OCR
2009–10
14.4
11.8
82%
6.2
191%
Gifted-Talented, % of Population Over 3 Enrolled
OCR
2009–10
1.2
1.3
99%
0.3
26%
Grade 4: At or Above Proficient: Reading, %
NAEP
2013
11.4
40.9
28%
16.6
41%
Grade 4: At or Above Proficient: Math, %
NAEP
2013
12.1
56.9
21%
23.1
41%
Grade 8: At or Above Proficient: Reading, %
NAEP
2013
9.1
41.9
22%
23.1
55%
Grade 8: At or Above Proficient: Math, %
NAEP
2013
8.2
46.8
18%
19.2
41%
Grade 4: Average Scale Score: Reading (Out of 500)
NAEP
2013
192.6
228.3
84%
200.8
88%
Grade 4: Average Scale Score: Mathematics (Out of 500)
NAEP
2013
216.1
252.1
86%
227.7
90%
Grade 8: Average Scale Score: Reading (Out of 500)
NAEP
2013
237.3
272.8
87%
257.6
94%
Grade 8: Average Scale Score: Mathematics (Out of 500)
NAEP
2013
252.4
295.6
85%
272.7
92%
Average Freshman Graduation Rate
NCES
2009–10
66.0
95.6
69%
78.2
82%
TEACHER QUALITY
ENROLLMENT
Nursery School, Preschool, % of Population Under 5
Enrolled in Alg 1 in Grade 7–Grade 8, % of Population
Over 3 Enrolled
STUDENT STATUS & RISK FACTORS
Families and People For Whom Poverty Status
is Determined:
WISCONSIN
ACHIEVEMENT INDICATORS
2015 STATE OF BLACK AMERICA¨
SAVE OUR CITIES
NATIONAL URBAN LEAGUE
2015 State Education Equality Index™ + 106
2015 STATE EDUCATION EQUALITY INDEX
Source
Year
Black
White
B–W
Index
Hispanic
Hisp.–White
Index
Percentage of Students Enrolled in Schools With More
Than 20% of First-Year Teachers
OCR
2011–12
5.0
2.0
40%
3.0
67%
Percentage of Students Attending Schools With More
Than 20% of Teachers Not Yet Certified
OCR
2011–12
23.2
0.8
3%
8.4
10%
ACS–Census
2013
12.0
23.8
50%
17.4
73%
OCR
2009–10
0.7
1.2
56%
0.7
63%
Percent of All Families With Related Children
Under 18 Years Only
ACS
2013
46.3
10.8
23%
30.9
35%
Percent of All Families With Related Children
Under 5 Years Only
ACS
2013
53.7
12.9
24%
24.7
52%
Out of School Suspensions, % Male
OCR
2011–12
14.0
5.0
36%
8.0
63%
Out of School Suspensions, % Female
OCR
2011–12
21.0
2.0
10%
4.0
50%
In Need of LEP, % of Population Over 3 Enrolled
OCR
2009–10
0.6
0.3
41%
24.9
1%
Enrolled in LEP, % of Population Over 3 Enrolled
OCR
2009–10
0.5
0.2
41%
20.1
1%
IDEA, % of Population Over 3 Enrolled
OCR
2009–10
14.7
6.9
47%
8.7
79%
Gifted-Talented, % of Population Over 3 Enrolled
OCR
2009–10
3.5
3.9
88%
3.5
89%
WISCONSIN (CONTINUED)
TEACHER QUALITY
ENROLLMENT
Nursery School, Preschool, % of Population Under 5
Enrolled in Alg 1 in Grade 7–Grade 8, % of Population
Over 3 Enrolled
STUDENT STATUS & RISK FACTORS
Families and People For Whom Poverty Status
is Determined:
WYOMING
ACHIEVEMENT INDICATORS
Grade 4: At or Above Proficient: Reading, %
NAEP
2013
NA
40.9
NA
24.2
59%
Grade 4: At or Above Proficient: Math, %
NAEP
2013
NA
52.1
NA
29.4
56%
Grade 8: At or Above Proficient: Reading, %
NAEP
2013
NA
40.4
NA
24.5
61%
Grade 8: At or Above Proficient: Math, %
NAEP
2013
NA
40.4
NA
25.8
64%
Grade 4: Average Scale Score: Reading (Out of 500)
NAEP
2013
NA
229.2
NA
215.2
94%
Grade 4: Average Scale Score: Mathematics (Out of 500)
NAEP
2013
NA
249.2
NA
234.9
94%
96%
Grade 8: Average Scale Score: Reading (Out of 500)
NAEP
2013
NA
273.2
NA
261.1
Grade 8: Average Scale Score: Mathematics (Out of 500)
NAEP
2013
NA
290.5
NA
277.8
96%
Average Freshman Graduation Rate
NCES
2009–10
57.4
82.6
69%
74.3
90%
Percentage of Students Enrolled in Schools With More
Than 20% of First-Year Teachers
OCR
2011–12
3.0
3.0
100%
3.0
100%
Percentage of Students Attending Schools With More
Than 20% of Teachers Not Yet Certified
OCR
2011–12
0.0
0.0
100%
0.0
100%
ACS–Census
2013
14.2
24.9
57%
20.6
83%
OCR
2009–10
1.0
1.4
68%
1.1
80%
TEACHER QUALITY
ENROLLMENT
Nursery School, Preschool, % of Population Under 5
Enrolled in Alg 1 in Grade 7–Grade 8, % of Population
Over 3 Enrolled
2015 STATE OF BLACK AMERICA¨
SAVE OUR CITIES
NATIONAL URBAN LEAGUE
2015 State Education Equality Index™ + 107
2015 STATE EDUCATION EQUALITY INDEX
Source
Year
Black
White
B–W
Index
Hispanic
Hisp.–White
Index
Percent of All Families With Related Children
Under 18 Years Only
ACS
2013
32.2
9.0
28%
25.1
36%
Percent of All Families With Related Children
Under 5 Years Only
ACS
2013
0.0
11.5
0%
22.0
52%
Out of School Suspensions, % Male
OCR
2011–12
20.0
6.0
30%
9.0
67%
Out of School Suspensions, % Female
OCR
2011–12
NA
NA
NA
NA
NA
In Need of LEP, % of Population Over 3 Enrolled
OCR
2009–10
0.5
0.1
24%
14.3
1%
Enrolled in LEP, % of Population Over 3 Enrolled
OCR
2009–10
0.5
0.1
24%
13.7
1%
IDEA, % of Population Over 3 Enrolled
OCR
2009–10
12.0
7.6
63%
10.0
76%
Gifted-Talented, % of Population Over 3 Enrolled
OCR
2009–10
6.4
2.5
253%
0.9
35%
WYOMING (CONTINUED)
STUDENT STATUS & RISK FACTORS
Families and People For Whom Poverty Status
is Determined:
2015 STATE OF BLACK AMERICA¨
SAVE OUR CITIES
NATIONAL URBAN LEAGUE
Essay 1 + 108
2015 STATE OF BLACK AMERICA¨
SAVE OUR CITIES
NATIONAL URBAN LEAGUE
Essay 1 + 109
Transportation is a reflection of any society’s value
system. Roads can be built to divide or they can be built
to bring communities together. Every transportation
decision is crucial because, once a project is built, it is
likely to be there for a long time. That’s why we must learn
from past mistakes so that we can build an infrastructure
system that gives everyone a real shot at success.
2015 STATE OF BLACK AMERICA¨
SAVE OUR CITIES
NATIONAL URBAN LEAGUE
Essay 1 + 110
Five decades ago, residents of the first public
a Black man to its school board). In the 1980s,
housing development in Syracuse, New
however, an airport expansion began
York—the vast majority of whom were African
to uproot families and frayed the economic
American—saw their homes torn down and a
fabric that made the town so prosperous.
massive highway constructed in their place.
Over the next two decades, the town lost 80
The highway was a 1.4-mile stretch of I-81
percent of its population. Today, the airport
called “the viaduct,” but to some residents,
remains extremely underutilized, and many
it became known by a different name.
former Kinloch residents have landed in a
They called it “The Berlin Wall.”
nearby St. Louis suburb named Ferguson.
For half a century, the I-81 has quite clearly
separated the haves from the have-nots
NOW, IN THIS YOUNG
in Syracuse. It has turned the surrounding
CENTURY, WE HAVE AN
community into a “dead zone,” a neighborhood
without even a grocery store in reach.
In too many places in this country, not just in
Syracuse, the injustices of an earlier time are
OPPORTUNITY TO BUILD
BETTER THAN WE EVER
HAVE: HIGHWAYS THAT
literally still part of the map. Two generations
ENHANCE CONNECTIONS,
ago, when many of our rails, transit systems and
NOT DIVISIONS; TRANSIT
roads were built, they were built like the I-81.
Yes, they connected some Americans to better
SYSTEMS THAT BRING
schools and better jobs. But they left other
PEOPLE TO JOBS—AND
Americans—particularly African Americans—
EVEN JOBS TO PEOPLE…
locked out of those opportunities.
Nearly 500 miles from Syracuse in Columbus,
Ohio, there was a stretch of I-71 that did the
Can we take an American transportation network
same thing as the I-81. It cut off an African-
that, in some cases, was built in an environment
American community called the King-Lincoln
of divisiveness and turn it into an inclusive
district from the jobs downtown.
network that knits together our society?
Then, there’s Atlanta, a largely Black city with
I believe we can.
largely white suburbs and a transit system—
MARTA—that does not link one with the other.
(The segregation is so apparent that some have
claimed MARTA is really an offensive acronym:
“Moving Africans Rapidly Through Atlanta.”)
Or there’s Kinloch, Missouri, which for almost
100 years was a largely Black and very
prosperous town. (Teddy Roosevelt took the
first presidential flight from the Kinloch airfield,
and the town was the first in the state to elect
2015 STATE OF BLACK AMERICA¨
SAVE OUR CITIES
At the U.S. Department of Transportation,
building this vision of America is our daily work.
I often tell the story of LeDaya Epps. Up until
recently, LeDaya couldn’t find secure work to
provide for her three kids. Then, the USDOT
loaned half a billion dollars to help fund a new
light rail line in Crenshaw, one of the poorest
neighborhoods in Los Angeles. This transit
project was the result of a 20-year effort by
NATIONAL URBAN LEAGUE
Essay 1 + 111
the Los Angeles Urban League and other
Additionally, we’re expecting 70 million more
community organizations to provide greater
people in America over the next 30 years, many
access to transit-dependent residents.
of them in cities. 2 If we are not careful, as these
LeDaya had signed up for one of the
apprenticeship programs supported by the
Department of Labor, and the apprenticeship she
populations grow, lower-income residents could
get pushed out to more car-dependent suburbs
that lack good transportation options.
landed was helping build that Crenshaw transit
This is a future we cannot afford. Now, in this
system. Ever since, LeDaya hasn’t just had a good
young century, we have an opportunity to
job, she’s been building something that will help
build better than we ever have: highways that
connect her fellow Angelenos with them.
enhance connections, not divisions; transit
“I’m so blessed,” she says, “I don’t have
to worry about the little things as much
[anymore]. I can even take my kids out for
dinner once in a while.”
systems that bring people to jobs—and even
jobs to people; air service and rail service
that moves us ever faster, cheaper and safer;
neighborhoods that are always safe to walk and
bike in, in part, because there are sidewalks,
LeDaya’s story, as amazing as it is, is not unique.
In other places, we’ve worked to bring equality
to our transportation system. We’ve helped
the mayor of Columbus cap that highway and
reconnect the King-Lincoln district with the
crosswalks and streetlights.
That’s the work ahead, building a transportation
system that reflects not our past—but our
brightest ideals. +
rest of the city. We’re working with Syracuse to
NOTES
help the city improve its aging infrastructure.
1
.S. Department of Transportation, Beyond Traffic
U
2045: Trends and Choices, p. 23 (February 2015)
(http://www.dot.gov/sites/dot.gov/files/docs/
Draft_Beyond_Traffic_Framework.pdf); see also,
Federal Highway Administration. Livability Initiative;
“Transportation and Housing Costs.” (http://www.
fhwa.dot.gov/livability/fact_sheets/transandhousing.
cfm) (January 2013); and Bureau of Labor Statistics,
Consumer Expenditures in 2011 (April 2013) (http://
www.bls.gov/cex/csxann11.pdf)
2
Beyond Traffic 2045, p. 13.
Further, in Houston, we’ve helped fund a light rail
system—like the one in Los Angeles—that bridges
old economic and racial divides in that city.
In doing this, I believe we’ve built more than
foundations of concrete and steel. We’ve built
the foundation for better lives.
“Transit systems,” Dr. Martin Luther King, Jr.
wrote a few weeks before his death, “are a
civil rights issue—and a valid one—because…
they determine the accessibility of jobs to the
Black community.”
Fifty years later, Dr. King’s point remains true.
Today, aside from housing, transportation
is the most costly item in a family’s budget.
Low-income families, many of them AfricanAmerican, spend almost one-third of their
income on transportation.1
2015 STATE OF BLACK AMERICA¨
SAVE OUR CITIES
NATIONAL URBAN LEAGUE
Essay 2 + 112
2015 STATE OF BLACK AMERICA¨
SAVE OUR CITIES
NATIONAL URBAN LEAGUE
Essay 2 + 113
Mayors of major American cities are on the front lines of
ensuring that the state of Black America is strong. In 2015,
we continue to confront issues that challenge our cities—
African-American unemployment, affordable housing,
unequal justice and gaps in educational opportunity.
2015 STATE OF BLACK AMERICA¨
SAVE OUR CITIES
NATIONAL URBAN LEAGUE
Essay 2 + 114
Just this past January, I had the privilege of
pervasive in America today. DC answered
being sworn in as the seventh elected mayor of
President Obama’s call in several ways.
Washington, DC—my hometown.
After my November 2014 victory, I challenged a
In Washington, DC, we are a city, a county
group of 100 boys and men of color to take the
and a state all wrapped up in one. We are
Audacity of Hope Challenge. I gave participants
over 600,000 residents and hundreds of
a copy of the President’s book before their
great neighborhoods—fast-growing and fast-
winter break because I wanted them to look to
changing. We are attracting jobs, businesses
him as an example of someone who got ahead
and people of every background and belief.
by looking for ways to improve his community.
When I look at our city today, I know that we
All participants were asked to read the book,
have come a long way in a short time, and I see
talk to their classmates about what we as a
our great promise within grasp. We are a city,
city could do better and come back to me with
however, both rich with prosperity and rife with
suggestions on how we could improve their
inequality. I was elected to focus on growing
neighborhoods. Their ideas have inspired me to
the middle class. While growing gaps in income,
fight even harder to ensure that they and their
good jobs, education, housing and opportunity
peers are not just part of the progress our city is
stand in the breach, my administration is
experiencing, but the very measure of it.
committed to developing an agenda to turn
them around.
THEY ARE NOT AS TOUGH
I share President Obama’s vision to fight
for policies that help the middle class—and
AS THEY THINK OR AS
those fighting to get into the middle class. I
SOME OTHERS MAKE THEM
understand the great responsibility of leading
OUT TO BE. NONE OF THE
the Nation’s Capital at this time. It is my duty to
PARTICIPANTS ARE LOOKING
focus on those who have been left behind, as
well as to find hope where it is missing and the
FOR A HAND OUT; THEY ARE
path to opportunity where it has been lost.
LOOKING FOR A HAND UP.
In the 2013 State of the Union, President
Obama challenged states and cities to raise
the minimum wage. DC answered his call, and
today its minimum wage stands at $9.50—and
will rise to $11.50 by 2016. We are also proud of
and will continue to implement an earlier law
that requires contractors who do work for our
government to pay a living wage.
A year ago, President Obama announced the
My Brother’s Keeper initiative to ensure that
we engage boys and men of color and begin
to narrow the achievement gap that is all too
2015 STATE OF BLACK AMERICA¨
SAVE OUR CITIES
Each time I meet with the participants, I am
struck by their tenderness and desire to be
engaged. They are not as tough as they think
or as some others make them out to be. None
of the participants are looking for a hand out;
they are looking for a hand up. As a result,
I launched the 500 for 500 program—an
initiative to recruit 500 volunteers to mentor
500 young men of color. By the time you read
this essay, we will have exceeded our goal, and
500 young men of color will be shown that
their success is our mission.
NATIONAL URBAN LEAGUE
Essay 2 + 115
I have also partnered with DC Public Schools
term development. That is why I will appoint the
Chancellor Kaya Henderson to launch
first-ever Deputy Mayor for Greater Economic
Empowering Males of Color, an initiative that
Opportunity who will work alongside a newly
will invest $20 million to advance achievement
appointed Director of African-American Affairs
and opportunity and reduce racial disparities for
to rally government agencies, non-profits and
boys and men of color across Washington, DC.
community leaders to create innovative ways to
In Washington, nearly 70 percent of all males
expand economic opportunity and narrow the
between the ages of 5 and 24 are Black and
achievement gap. With sustained and quality
Latino, and too many of these young men are
investment, we can curb the three decades-
not reaching their full potential. By the fourth
long exodus of middle-class families from the
grade, nearly 50 percent of Black and Latino
District’s historically African-American, culturally
males are reading below grade level. We need
vibrant neighborhoods and ensure that these
to fundamentally change that dynamic. My
neighborhoods are safe and amenity-rich.
administration is committed to looking for new,
innovative ways to engage with our young men
of color and improve outcomes throughout their
lives. Empowering young men of color helps
strengthen families—the girls and women, too.
My family has called Washington home for five
generations, and I am committed to its future.
The challenges are great, but our resolve to
make all Washingtonians part of our progress
is stronger. +
An investment in our youth is a down payment
on our city’s future, our nation’s future. That is
why I have allocated an additional $5 million to
rededicate the Mayor Marion S. Barry Summer
Youth Employment Program and to expand
workplace programs for District youth ages
22 to 24. The latter will ensure young women
and men have the skills needed to transition
from summer jobs to long-term sustainable
employment, reaching a core group of young
people who need help finding pathways to
good-paying jobs.
Right now, my Administration is creating
a Public Works Academy to ensure all DC
residents—including our returning citizens—are
able to take advantage of the opportunities
that exist in our government workforce. My
administration is committed to investing in our
young people to ensure they have the skills they
need to find pathways to good-paying jobs and
long-term, sustainable employment.
We must also invest in historically overlooked
corridors and work to foster sustainable, long-
2015 STATE OF BLACK AMERICA¨
SAVE OUR CITIES
NATIONAL URBAN LEAGUE
Essay 3 + 116
2015 STATE OF BLACK AMERICA¨
SAVE OUR CITIES
NATIONAL URBAN LEAGUE
Essay 3 + 117
Over the last two years, the tragic deaths of Trayvon
Martin, Michael Brown and Eric Garner have been seared
into the American conscience. They’ve also drawn bright,
and sometimes disturbing, lines in our society.
2015 STATE OF BLACK AMERICA¨
SAVE OUR CITIES
NATIONAL URBAN LEAGUE
Essay 3 + 118
There is no doubt that race relations and
18 percent of African-American fourth graders
community policing have become “issues of
are reading at or above grade level—the lowest
the day.” As such, you might expect me, as the
rate among any other racial/ethnic group in the
President of the U.S. Conference of Mayors, to
U.S.4 Of the 82 percent of children below grade
focus on public safety and race in this essay. But
level, 75 percent of them will never catch up.
I’m not. Instead, I’m going to spend these next
pages writing on education and the problems
that we, as African Americans, should be
+ Completing Algebra in 8th grade is often
considered a “gateway” to higher education;
focused on in our public schools.
yet as of 2013, only 14 percent of African-
Why? Because it’s become abundantly clear
above grade level.5
American eighth graders can do math at or
that as a nation, we don’t value young Black
lives. You may think that this has never been
more evident than when 12-year-old Tamir Rice
was gunned down for playing with a toy gun
in a Cleveland park. But I propose that there is
an even more pervasive, more persistent and
more institutional devaluing of Black lives and
futures, one that is taking place everyday in our
public schools.
+ A high school drop-out will make $1.3 million
dollars less over his or her lifetime than a
college graduate.6 African Americans drop
out of high school at twice the rate of their
white peers.7
There’s no more compelling data to show how
little we value the lives of Black children in this
country than the statistics that show the current
Don’t take my word for it. Instead, look at the
facts. In today’s world, a college education is
nearly a prerequisite for a well-paying job. In
fact, by 2020 it is estimated that 65 percent of
all jobs will require postsecondary education
and training beyond high school. Yet, as of 2013,
1
only 20 percent of Black adults hold a bachelor’s
degree, compared to 40 percent of their white
peers. 2 This level of attainment is not surprising
considering that our African-American children
are the lowest performing students in the
nation. The data should startle, disgust and spur
us into immediate action.
state of their academic achievement. Essentially,
we are systematically denying young Black kids
the quality education that will ensure they can
grow to be productive members of society.
After all, U.S. schools are twice as likely to pair
poor and minority students with brand new
teachers and almost four times more likely to
suspend Black students than white students. 8
Our present education system is dooming our
children’s future. There’s no other way to say it.
The good news is it doesn’t have to be this
way. Over the last 10 years, there have been
significant breakthroughs at the school and
Consider this:
district level to show that systemic change
+ For every 100 African-American children who
for Black children is possible. Whether it’s Dr.
that radically improves academic outcomes
begin kindergarten, only 20 will graduate from
Steve Perry’s “Capitol Prep” in Hartford, CT,
college with at least a Bachelor’s degree.3
which serves mostly poor and minority children
+ If a child is not reading on grade level by the
third grade, the chances that they will ever
catch up are slim-to-none. Yet, as of 2013, only
2015 STATE OF BLACK AMERICA¨
SAVE OUR CITIES
and sends 100 percent of its young Black
male graduates to college9; or Eric Mahmoud’s
“Harvest Prep” Charter School in Minneapolis,
MN, which serves predominantly low-income
NATIONAL URBAN LEAGUE
Essay 3 + 119
and African-American youth and boasts reading
everyday are about valuing each and every
and math scores well above the local district and
Black life that comes through their school
statewide averages10; or Tim King’s “Urban Prep”
building doors because the consequences of not
High School in Chicago, IL, where the student
being effective are dire.
body is composed of 100 percent AfricanAmerican males and all are accepted to college
at the end of their high school program—many
with generous scholarships and grants to attend
our nation’s most prestigious universities,11 we
are now seeing schools in urban communities
that value young Black lives by providing these
students with the education they need to
succeed in college and life.
While we have these models to show that
different outcomes are possible for our children,
I do not mean to imply that the work is easy.
These leaders have their students in school for
longer school days and school years; they have
high and unrelenting expectations for student
behavior and effort; they’ve put together teams
of highly effective and committed teachers; and
they require parents to be dedicated to their
children’s education. Their school environments
ONE CLEAR AND POWERFUL
look radically different from what we see in
most public schools across the country, and
WAY TO CHANGE THE
that fact is something that must be exposed
TREND IN OUR NATION
and explored.
OF THE DEVALUING OF
Because of the recent events in Ferguson,
BLACK LIVES IS TO INVEST
MO, New York City, and Cleveland, OH, it’s
IN SIGNIFICANTLY
REFORMING OUR NATION’S
PUBLIC SCHOOLS.
become clearer than ever that our nation
must engage in new (and undoubtedly
uncomfortable) conversations about police,
race and community. Equally necessary and
important are the discussions that must take
place about how our nation’s public schools
One reason for optimism is that all three of the
examples cited above are schools or systems
that were founded and continue to be run by
Black men who have a keen focus on serving
African-American youth. Their motivation
goes beyond the desire to simply see kids in
good schools. It stems from their knowledge
that what they do every day is, quite literally, a
matter of life or death. If they can educate their
students at the highest levels, the children’s
likelihood of graduating high school, going
to college and moving into a well-paying job
increases dramatically. Likewise, their likelihood
of being a teen parent or being incarcerated
decreases. Steve, Eric and Tim know their jobs
2015 STATE OF BLACK AMERICA¨
SAVE OUR CITIES
are systematically underserving too many of
our African-American children. Just as there
are many who push back on the “real” race
conversations out of a misguided belief that
we’re living in a post-racial society, there are
many who will resist school reform and insist
that our nation’s public schools are doing just
fine because their own local schools seem to be
serving their students well.
We must fight against this belief that the
status quo is working to prepare all our youth
for success in college, career and life. We
must question the notion that the problems in
education are those of poverty and parenting
alone (though those certainly have an impact).
NATIONAL URBAN LEAGUE
Essay 3 + 120
We must push to create an environment where
through 2012. Retrieved from http://nces.ed.gov/
programs/digest/d13/tables/dt13_219.70.asp
every family, regardless of their zip code, has
the opportunity to send their child to a high-
8
he State of Education for African Americans. The
T
Education Trust-Midwest. Retrieved from http://www.
edtrust.org/sites/edtrust.org/files/AfricanAm%20
Booklet.pdf
9
apitol Prep Magnet School. (2014). Academics.
C
Retrieved from http://www.capitalprep.org/
academics/
performing school to get a quality education.
One clear and powerful way to change the trend
in our nation of the devaluing of Black lives is
to invest in significantly reforming our nation’s
public schools. When we allow our children to
10
languish in dropout factories with no hope of a
better future, we’re making a demoralizing value
statement. However, when we provide children
with the opportunity to be successful in life by
giving them a high quality education, we are
11
udubon Center of the North Woods. (2013).
A
Academic performance report: Harvest Preparatory
School. Retrieved from http://www.seed-harvest.
org/site_res_view_folder.aspx?id=2f8290f9-90bc4221-82d5-15bfc23a1387
014 Urban Academies: We believe. Retrieved
2
from http://www.urbanprep.org/pdf/
urbanprepbrochure2014.pdf
sending them the strongest message we can
about our belief in their potential.
So, the real question is: Are we, as the AfricanAmerican community, willing to have that
difficult conversation about the real value we
put on the lives of our youth? +
NOTES
1
arnevale, A.P., Smith, N., Strolh, J. (2013). Recovery:
C
Job growth and education requirements through
2020. Center on Education and the Workforce,
Georgetown University. Retrieved from https://cew.
georgetown.edu/wp-content/uploads/2014/11/
Recovery2020.FR_.Web_.pdf
2
014, Digest of Education Statistics 2013, Table
2
104.20. Percentage of persons 25 to 29 years old with
selected levels of educational attainment, by race/
ethnicity and sex: Selected years, 1920 through 2013.
Retrieved from http://nces.ed.gov/programs/digest/
d13/tables/dt13_104.20.asp
3
Ibid.
4
013 National Assessment of Educational Progress.
2
Retrieved from http://www.nationsreportcard.gov/
reading_math_2013/#/student-groups
5
Ibid.
6
arnevale, A.P., Rose, S.J., Cheah, B. (2011). The
C
college payoff: Education, occupations, lifetime
earnings. Center on Education and the Workforce,
Georgetown University. Retrieved from https://
cew.georgetown.edu/wp-content/uploads/2014/11/
collegepayoff-complete.pdf
7
014, Digest of Education Statistics 2013, Table
2
219.70. Percentage of high school dropouts among
persons 16 through 24 years old (status dropout
rate), by sex and race/ethnicity: Selected years, 1960
2015 STATE OF BLACK AMERICA¨
SAVE OUR CITIES
NATIONAL URBAN LEAGUE
Essay 4 + 121
2015 STATE OF BLACK AMERICA¨
SAVE OUR CITIES
NATIONAL URBAN LEAGUE
Essay 4 + 122
Gary, Indiana has often been referred to as one of the
country’s legacy cities. This term recognizes the city’s
contribution as the birthplace of the world’s largest steel
mill and the devastating impact associated with the
decline of steel and related industries.
2015 STATE OF BLACK AMERICA¨
SAVE OUR CITIES
NATIONAL URBAN LEAGUE
Essay 4 + 123
While Gary’s legacy has been a double-edged
of unoccupied property and generating a
sword, since 2012 our New Day Administration
developer’s fee. This plan recognizes the need
has been building on the rich history of this
to cultivate new industry while at the same
city and creating new opportunities. Our work
time acknowledging the continuing viability of
has focused on the development of existing
industrial concerns in the city of Gary. It also
assets, investment in current residents and the
highlights a strategy of incremental growth of
attraction of new residents and patrons.
new businesses and existing business expansion
Gary is located in the population center of North
America less than 35 miles from Chicago, the
third-largest city in the country. Because of
this strategic location, the city has unparalleled
($1–20 million) rather than focusing solely on
$100–200 million game-changers. This strategy
has resulted in a total of $100 million in actual
investment over the course of the past 3 years.
transportation assets—many of which have
In 2014, Gary was designated as a Strong City,
been sorely underutilized. Last year, officials
Strong Community (SC2) by the White House.
at the Gary/Chicago International Airport
This distinction allowed the city to target
completed one of the only airport public/
other development areas along the north side
private partnership (P3) transactions to be done
of the city. The Gary Northside development
at an airport in 2014. AFCO/AvPorts, Michael
incorporates three areas anchored by city hall,
Mullen (formerly of Centerpoint Properties),
a minor league stadium and a hospital with one
Guggenheim and Loop Capital agreed to
of the only trauma designations in Northwest
manage the airport under the auspices of the
Indiana. Additionally, the SC2 plan focuses on
board and invest $100 million over a 40-year
the development of University Park, an area
period on airport property and the surrounding
anchored by Indiana University Northwest, one
footprint. Part of that agreement includes job
of the largest commuter campuses in Indiana.
training and local business hiring. In addition
In 2014, IUN announced a new $45 million
to the P3, B. Coleman Aviation opened a $9
performing arts, office and classroom building
million new hangar and became the second
that will fit well into the city’s planned retail,
fixed base operator at the airport. The New
demolition and other revitalization in the IUN
Day Administration has also been instrumental
footprint. The city is also creating a full-scale
in assisting in the creation or expansion of
blight elimination plan that will incorporate the
businesses related to the trucking industry and
targeted demolition, code enforcement and
has plans to explore the development of a port.
zoning changes that have occurred to date. One
Closely aligned with the cultivation of Gary’s
transportation assets is the administration’s
focus on an industrial corridor adjacent to the
airport. Carmeuse Lime announced the opening
of the most significant buildings demolished in
2014 was the former Sheraton Hotel, a 14-story
building that had cast a shadow in the middle of
downtown for more than 20 years.
of a $20 million waste-to-energy facility in
The investment in current residents of Gary is
this corridor, as well as its intention to invest
seen in the administration’s effort to reduce
an additional $200 million in the expansion of
crime, poverty and unemployment. The city’s
its existing facility. The city has also partnered
struggle with crime is well documented. More
with Carmeuse on a land development deal that
than 35 percent of the residents of Gary live in
will allow the parties to recruit new industrial
poverty, and the city’s unemployment rate is
tenants, thus raising the assessed valuation
estimated to be nearly 40 percent. The plan to
2015 STATE OF BLACK AMERICA¨
SAVE OUR CITIES
NATIONAL URBAN LEAGUE
Essay 4 + 124
address these issues entails a comprehensive
There is also a nascent tourism and recreation
crime strategy called Gary for Life, a plan that
industry developing in Gary. In 2014, our
reduces crime through prevention, education
administration initiated a community
and community engagement. The city also
development plan that is anchored by Michael
partners with the Gary Community School
Jackson’s birth home. The Jackson Street of
Corporation and other educational providers
Dreams was born out of the recognition that
to improve student achievement, an effort to
thousands of people travel to Gary each year.
incorporate a training and local employment
It also acknowledges that the residential area
component into new and expanding Gary
around the home needs extensive revitalization.
businesses, new housing programs that promote
The city administration has partnered with the
home ownership among local residents and
Fuller Center for Housing in Gary, Indiana, local
increased youth programming that expands the
banks and other corporate entities to develop
horizons of Gary youth.
the area. The ultimate goal is to create an urban
site that will be attractive for partnership with
the National Park Service.
IN 2014, GARY WAS
DESIGNATED AS A STRONG
Additionally, non-residents often forget that
Gary is on the southern tip of Lake Michigan.
CITY, STRONG COMMUNITY
The lakefront neighborhood of Miller is fueled by
(SC2) BY THE WHITE HOUSE.
the activity of the Miller Beach Arts and Creative
THIS DISTINCTION ALLOWED
District, which has been the catalyst for the
development of a brewery and new restaurants.
THE CITY TO TARGET
These locales are frequented by local residents
OTHER DEVELOPMENT
and an increasing number of tourists who
AREAS ALONG THE NORTH
SIDE OF THE CITY.
travel to Gary on the convenient commuter
rail line that extends between Chicago and
South Bend, Indiana. The community is also
home to the National Lakeshore and the Paul
Douglas Environmental Center, giving the city
During the past three years, contractors
an opportunity to highlight the local habitat to
entrusted with public projects have been
thousands of visitors each year while leveraging
pressed to meet local hiring ordinances.
the federal government as a partner.
Additionally, businesses that move into Gary
or expand their business have worked with the
city to hire local residents. These efforts are
reflective of the reality that new businesses in
Gary have the greatest long-term impact when
they create employment opportunities for Gary
residents. During the course of the past three
years, more than 1000 new jobs have been
added to the city. At least 65 percent of these
The partnership that exists on the lakefront
allows us to emphasize the greatest way to
resurrect and preserve Gary’s return as a
legacy city. Through the cultivation of partners
in government, the private sector and the
non-profit arena, the New Day Administration
is working to create a new legacy for Gary,
Indiana—one that will sustain generations. +
jobs have employed city residents.
2015 STATE OF BLACK AMERICA¨
SAVE OUR CITIES
NATIONAL URBAN LEAGUE
Essay 5 + 125
2015 STATE OF BLACK AMERICA¨
SAVE OUR CITIES
NATIONAL URBAN LEAGUE
Essay 5 + 126
Dr. Martin Luther King, Jr. said that “law and order exist
for the purpose of establishing justice and that when
they fail in this purpose they become the dangerously
structured dams that block the flow of social progress,”
and I would add, that obstruct the efforts of moral,
fair-minded individuals who seek such.
2015 STATE OF BLACK AMERICA¨
SAVE OUR CITIES
NATIONAL URBAN LEAGUE
Essay 5 + 127
Many believe that the grand jury process,
When this information was revealed, one of
as administered by prosecutors within the
the jurors in Ferguson sued the prosecutor for
American legal system in cases where the police
misleading the grand jury. Grand Juror Doe
have used excessive, deadly force, has become
raised concerns in a Section 1983 civil rights
“a dangerously structured dam” that obstructs
lawsuit. Doe began serving as a grand juror
the efforts of moral, fair-minded individuals
in the circuit court for St. Louis County in May
seeking justice.
2014, approximately four months prior to the
When I first got called by the family of Michael
Brown, an unarmed Black teenager shot and
killed by a policeman in Ferguson, MO in broad
shooting of Michael Brown. (See Grand Juror
Doe v. Robert P. McCulloch, Complaint for
Prospective Relief, Case: 4:15-cv-00006.)
daylight, and I saw his body lying on the ground
on CNN, I wondered what could have possibly
caused another Black man to be shot and killed
THE FERGUSON CASE WAS
by the police. I hoped that the criminal justice
THE FIRST TIME THAT WE
system would provide the answers, would
HAD AN OPPORTUNITY TO
provide the justice that its name implies, but as
in other cases such as this one, the officer (e.g.
the shooter) was exonerated by the grand jury.
More often than not, grand juries exonerate
SEE THE INNER WORKINGS
OF A GRAND JURY, AND THE
LIBERTIES WE SAW THE
police officers who kill minorities. These grand
PROSECUTING ATTORNEY
juries are composed of ordinary citizens that
TAKE SHOULD CAUSE ALL
follow the lead of the Prosecuting Attorney
OF US CONCERN.
and usually have no experience in the law.
Grand jury proceedings are by law secret
proceedings. So it was very unusual for the
Prosecuting Attorney in Ferguson—St. Louis
County’s Robert McCulloch—to disclose the
evidence and publicly discuss the proceeding.
The Ferguson case was the first time that we
had an opportunity to see the inner workings
of a grand jury, and the liberties we saw the
Prosecuting Attorney take should cause all of
us concern. He allowed a witness to testify to
what her boyfriend saw, while knowing she had
perjured herself. Another witness (#40), who
has been coined the main witness for the police
officer, was allowed to testify before the grand
jury when the prosecutor now admits knowing
she was never actually on scene to witness the
shooting of Mike Brown. Instead, her entire
account came from television interviews.
2015 STATE OF BLACK AMERICA¨
SAVE OUR CITIES
Doe stated that “the presentation of evidence
to the grand jury investigating Wilson differed
markedly and in a significant way from how
evidence was presented in the hundreds of
matters presented to the grand jury earlier in his
term.” Doe also stated that “the presentation of
the law to which the grand jurors were to apply
the facts was made in a muddled and untimely
manner compared to the presentation of the
law in other cases presented to the grand jury.”
Doe’s impression was that the Brown case was
presented to the grand jury with the insinuation
that Brown, not Wilson, was the wrongdoer. It
was also noted that the shooter, Officer Wilson,
was allowed to testify before the grand jury
without being cross-examined. The prosecutor’s
unbridled discretion with no oversight or
NATIONAL URBAN LEAGUE
Essay 5 + 128
accountability allowed him to change the rules
a person, a hearing before a judge will be held
along the way. This should not occur.
to determine whether there is probable cause
Justice Antonin Scalia, in the 1992 Supreme
Court case of United States v. Williams,
explained what the role of a grand jury has
been for hundreds of years. It is the grand jury’s
function not “to enquire…upon what foundation
[the charge may be] denied,” or otherwise to
try the suspect’s defenses, but only to examine
“upon what foundation [the charge] is made” by
the prosecutor. (Respublica v. Shaffer, 1 Dall. 236
[O. T. Phila. 1788]; see also F. Wharton, Criminal
Pleading and Practice § 360, pp. 248-249 [8th
ed. 1880]).
the law enforcement officer relating to the
death. In addition, the governor of the state in
which the death occurred shall appoint a special
prosecutor to present evidence on behalf of
the state at the hearing. The judge shall make
the determination whether probable cause
exists for an indictment, and most importantly,
the proceeding is to remain open to the public
except in instances where it may be deemed
appropriate to close the proceedings.
The United States is one of few countries in the
As a consequence, neither in this country nor
in England has the suspect under investigation
by the grand jury ever been thought to have a
right to testify or to have exculpatory evidence
presented. In contrast, McCulloch allowed Wilson
to testify for hours and presented them with
every scrap of exculpatory evidence available.
A week after the decision to not indict was
announced in Ferguson, America was further
shocked when a grand jury in New York elected
not to indict the police officer responsible for
killing another unarmed Black man, 43-year-old
Eric Garner—an incident that was recorded on
video. We don’t know what the prosecutor did
in New York when presenting evidence in the
Garner case. What testimony or evidence was
even presented? Were members of the grand
jury properly counseled and instructed about
the law? Were members of the grand jury led to
exonerate the officer by an insinuation on the
part of the prosecutor that the victim, and not
the officer, was the wrongdoer?
Congressman Hank Johnson (D-GA) has
initiated the “Grand Jury Reform Act of 2014.”
The bill states that in cases where a law
enforcement officer uses deadly force against
2015 STATE OF BLACK AMERICA¨
for the State to bring criminal charges against
SAVE OUR CITIES
world that still has grand jury proceedings, and
some states do not require them. What began in
16th century England as a mechanism to protect
the people against the unbridled power of the
monarchy to initiate unmerited prosecutions
has become, in the 21st century, unbridled
autonomy of the Prosecuting Attorney to
protect rogue police officers who use excessive
and deadly force and kill unarmed Black men.
This is unacceptable, and a crescendo of
unnecessary and senseless killings should not
be a prerequisite to effect change.
From Eric Garner, who was killed by NYPD
on July 17, 2014, to Michael Brown, who was
killed by a Ferguson police officer on August
9, 2014, the results are the same—an unarmed,
Black man, child or teenager is killed during
an interaction with law enforcement. There is
no indictment of the offending officer and no
due process for the families of the victims; but
there is unbridled and unjust protection for
law enforcement—even those who engage in
wrongdoing and misconduct.
Now, America turns its attention to Tamir Rice,
a 12-year-old kid killed by Cleveland PD on
November 23, 2014, and at the time of this
publishing, we await the outcome of the grand
NATIONAL URBAN LEAGUE
Essay 5 + 129
jury decision there. When I got the call from
Tamir’s family, I was struck to hear that this
tragedy also occurred in broad daylight and was
also captured on video.
Sadly, it should no longer be a surprise when
the grand jury does not indict the police officer
when people of color are killed at the hands of
law enforcement. The symbiotic relationship
between the Prosecuting Attorney and law
enforcement, as well as the unbridled autonomy
of the Prosecuting Attorney in the secrecy of
a grand jury proceeding, often bars access
to justice for people of color in these cases.
We cannot afford to continue to trust their
discretion. If we do not reform the grand jury
process, then our communities will continue
to suffer fatalities not only from insensitive,
unconcerned and uncompassionate law
enforcement officers, but worse than that,
we will suffer fatal circumstances from an
insensitive, unconcerned, uncompassionate—
and unjust—American legal system. +
2015 STATE OF BLACK AMERICA¨
SAVE OUR CITIES
NATIONAL URBAN LEAGUE
Essay 6 + 130
2015 STATE OF BLACK AMERICA¨
SAVE OUR CITIES
NATIONAL URBAN LEAGUE
Essay 6 + 131
What is the state of Black America in 2015? The data
may tell us that little has changed. African-American
communities are ravaged by crime and violence; children
attend schools that aren’t providing adequate education;
unemployment is well above the national average; infant
mortality remains high for Black mothers; and young
Black men are routinely victimized by unconscious as
well as intentional bias.
2015 STATE OF BLACK AMERICA¨
SAVE OUR CITIES
NATIONAL URBAN LEAGUE
Essay 6 + 132
For Black children, the poverty rate was 39
icons. This is the type of public-private coalition
percent in 2012, compared to 13 percent for
that can bring real change to our communities!
whites, according to the U.S. Census. The
statistics paint a bleak picture, but they may
Moreover, collaborative efforts to bring societal
not tell the entire story.
change are consistent with the goals of the
What I clearly see is hope. The barriers created
Keith Kellogg, was dedicated to improving
through racism are as prevalent as ever in the
life outcomes for children and communities.
United States, but I sense that this is a special
His powerful words, “I’ll invest my money in
moment for our nation. We seem, finally, to
people,” bring hope to many disadvantaged
be poised to acknowledge and address the
communities and continue to be our guiding
bias that is creating widespread disparities for
force today, as the foundation supports
people of color. Throughout the 1950s and 60s,
community-led efforts that help children reach
it took pain and suffering by many before the
their full potential.
W.K. Kellogg Foundation. Our founder, Will
nation passed civil rights laws that sought to
end public discrimination.
As the nation moves towards a population
In August 2014, the fatal shooting of Michael
disproportionate conditions faced by Black
Brown, following the deaths of Trayvon Martin,
children and other children of color must be a
Eric Garner and countless other unarmed
national priority. Otherwise, the gaps in health,
Black teenagers and men seemed to arouse
education, housing and wealth will continue to
the conscience of the nation. It has unleashed
expand, deepening rifts that tear at the very
mobilization activities unseen since the days
fabric of our nation.
that is majority-minority, the adversity and
when young Addie Mae Collins, Denise McNair,
Carole Robertson and Cynthia Wesley died in
the bombing of the 16th Street Baptist Church
in Birmingham, AL. Today, the deaths of Brown,
Martin, Garner and others are a catalyst for
action—people of all colors and all walks of
life banding together to not only end police
injustices, but to find comprehensive ways
to create pathways to success for vulnerable
In 2014, when WKKF commissioned a
poll of African-American families, the
results underscored the challenges that
Black households face in an era of high
unemployment, attacks on affirmative action
and restraints on government spending
for social programs. The survey found that
regardless of their socio-economic status,
families and children.
Blacks are concerned about their children’s
A year ago, I first saw the seeds for this new
their children, that good paying jobs will be
commitment. When President Obama launched
available and that the wealth gap will close
the My Brother’s Keeper initiative, it included
between Blacks and whites. Specifically, in
a powerful coalition to broaden opportunities
the survey, which empowered Blacks to voice
for young men and boys of color. That coalition
their concerns on issues, 85 percent said the
included not only philanthropic foundations
nation is not closing the wealth gap between
and organizations, such as the W.K. Kellogg
rich and poor; 69 percent said crime is not
Foundation (WKKF), but also CEOs of Fortune
being reduced; 68 percent said good paying
500 companies, government officials, religious
jobs are not being created; and 60 percent said
and civic leaders, and sports and entertainment
education is not being improved.
2015 STATE OF BLACK AMERICA¨
education and doubt that schools will educate
SAVE OUR CITIES
NATIONAL URBAN LEAGUE
Essay 6 + 133
The results demonstrate that if we want Black
positive stories about Black men, portrayals that
children to have opportunities to succeed, we
present positive images rather than the negative
must intensify efforts to address the root causes
perceptions often generated by the news and
of the education, health, housing and wealth
entertainment industries.
disparities that their families face. We also
cannot overlook the need to confront the racism
that erects barriers in our communities. Multiple
sectors in our society can mobilize to break
down the barriers. It is happening in isolated
instances and communities; now we must join
together to initiate ways to expand it.
Five years ago, WKKF launched America
Healing, an effort which has now invested more
than $100 million helping grantees bring racial
healing to their communities and dismantle
structural racism across the U.S. In Mississippi,
grantees are putting young males of color on a
path to success. In Chicago, we invested in the
North Lawndale Employment Network, which
FIVE YEARS AGO, WKKF
LAUNCHED AMERICA
operates a unique transitional jobs program
that trains formerly incarcerated men to harvest
honey from bees at local apiaries and make
HEALING, AN EFFORT
all-natural skin care products. The results
WHICH HAS NOW INVESTED
are extraordinary: the recidivism rate for the
MORE THAN $100 MILLION
HELPING GRANTEES BRING
RACIAL HEALING TO
THEIR COMMUNITIES AND
honey harvesting program known as “Sweet
Beginnings” is below four percent, compared to
the national average of 67.8 percent.1
Other innovative programs funded by WKKF
and others are having an impact across America.
DISMANTLE STRUCTURAL
This is why I have hope. Change is happening,
RACISM ACROSS THE U.S.
block by block, neighborhood by neighborhood.
But racial healing is also needed. By
More than 40 foundations have united as the
Executives’ Alliance to Expand Opportunities
for Boys and Men of Color. One of the priorities
for the Kellogg Foundation is “changing the
narrative”—overcoming bias, especially involving
Black men and boys, ending damaging racial
stereotypes and moving towards racial equity.
We seek a society where the color of one’s skin
does not trigger tension and anxiety that can
lead to senseless violence.
helping communities better understand the
consequences of centuries of racism, it bonds
them together, and they begin embracing
changes that can create more equitable
opportunities. It puts neighborhoods on a path
towards racial equity. This is a pathway to hope
and progress for all children. +
NOTES
1
Bureau of Justice Statistics studies have found that
within three years of release, about two-thirds (67.8
percent) of released prisoners were rearrested.
It’s inspiring to see the work of people like
Trabian Shorters, who founded the BMe
Networks that celebrate Black men who make
positive differences in the lives of others. It’s
a way to change the narrative by promoting
2015 STATE OF BLACK AMERICA¨
SAVE OUR CITIES
NATIONAL URBAN LEAGUE
Essay 7 + 134
2015 STATE OF BLACK AMERICA¨
SAVE OUR CITIES
NATIONAL URBAN LEAGUE
Essay 7 + 135
One of the main reasons I went into the entertainment
business was to create positive images of African
Americans in film and television.
2015 STATE OF BLACK AMERICA¨
SAVE OUR CITIES
NATIONAL URBAN LEAGUE
Essay 7 + 136
I grew up watching television and going to the
made were largely about the inner-city Black
movies. While I was conscious of the fact that
community—New Jack City (1991), Boyz n the
I seldom saw myself in the images that were
Hood (1991), and Menace II Society (1993), to
projected on screen, it wasn’t until I was older
name a few. Successful in their own right and
that I understood what that really meant. Those
universal in their messages about courage and
images did not just dictate how I viewed myself,
defining oneself within and against the odds,
I eventually learned that they very clearly
these movies still only highlighted one part
influenced how the outside world viewed me
of the African-American experience. Further,
and others like me.
in many of these movies, the women had
When I graduated from college in 1977, I spent
the summer in Spain with one of my best
friends. This being a different time, we decided
to hitchhike and were picked up by a couple
one-dimensional, subservient, or sexualized
roles in support of a male lead. By and large, I
still was not seeing the full scope of the Black
experience, and I still was not seeing me.
of guys. Using what was then my fairly fluent
There was also resistance and debate in
Spanish, we began a casual dialogue and one of
Hollywood at that time about casting a Black
them asked where we were from. My friend told
person—male or female—in a part that was
them “New York,” to which he responded, “Oh,
not a designated “Black” role. Think about
Harlem.” He subsequently asked us about drugs
Whitney Houston as the interracial love interest
and clearly assumed that we were selling sex
of Kevin Costner in The Bodyguard (1992);
and shooting drugs. (Needless to say, we bolted
Denzel Washington opposite Julia Roberts in
from the car as soon as we could.)
The Pelican Brief (1993); or Denzel, again, as a
I soon realized that their perception of
Americans—and particularly of my friend and
me as African-American women—was rooted
solely in movie and television depictions of
the time that failed to represent the diversity
and breadth of the Black experience. More
lawyer representing Tom Hanks in Philadelphia
(1993). It almost seems implausible today
that intense, behind-the-scenes battles would
need to be waged on behalf of A-list talent like
Whitney and Denzel to secure roles like these.
But at the time, we were indeed fighting.
importantly, they failed to represent who we
Today, diverse casting has been embraced,
were. This was one of my first experiences
particularly in television, and we see a
in realizing the true power of images and
tremendous difference. Most people now
stereotypes. In a world that preceded the
know the vast diversity of Black culture—that
Internet, television and film images were how
we live in all neighborhoods, that we do
stereotypes were either reinforced or torn
everything—and more importantly, are capable
down, how we became familiar with people
of doing everything that others do; that we are
and how we got to “know” each other without
successful; and that we, too, live global lives.
ever crossing borders—whether international or
simply the other side of town.
From President Barack Obama, Neil deGrasse
When I started in Hollywood in the early 1990s,
Wells and Jay Z, there are a great number of
stereotypes, particularly of Black women, were
role models and examples of African Americans
largely reinforced. We were in a renaissance
who have been incredibly successful in every
of Black filmmaking and the movies being
walk of life. So, to the extent that this is what is
2015 STATE OF BLACK AMERICA¨
SAVE OUR CITIES
Tyson and Ursula Burns to Kamala Harris, Ted
NATIONAL URBAN LEAGUE
Essay 7 + 137
going on in the world, this is what we’re finally
and 2002 was 16 percent. With this as the
seeing reflected more in Hollywood as well.
overall context, and given Hollywood’s history,
Now, whether some of the early images that
we fought for here in Hollywood helped African
it’s not surprising that an even more difficult
environment exists for Black actresses.
Americans be better accepted in the world
Thankfully, television is progressing more
at large, or vice versa, is debatable. However,
quickly than film, and we have seen an explosion
regardless of being the chicken or the egg, we
of fabulous Black female leads on the small
can claim some victory that the images of Blacks
screen. With the Shonda Rhimes creations of
in Hollywood have significantly diversified.
Olivia Pope (Kerry Washington) and Annalise
Keating (Viola Davis) as stellar examples, the
enormous successes of “Scandal” and “How
MOST PEOPLE NOW KNOW
THE VAST DIVERSITY
OF BLACK CULTURE—
THAT WE LIVE IN ALL
NEIGHBORHOODS, THAT WE
to Get Away With Murder” have proven that
embracing a Black female lead on a series can
result in resounding and replicable success.
Still, initial resistance to this concept was a
challenge. However, now it was not about
race, but economics. The question was
DO EVERYTHING—AND MORE
“Would America embrace a Black female
IMPORTANTLY, ARE CAPABLE
lead of a show?” The networks asked, the
OF DOING EVERYTHING THAT
viewers answered, and Rhimes (who, in full
disclosure, was my former intern while a
OTHERS DO; THAT WE ARE
graduate student at USC and continues to
SUCCESSFUL; AND THAT WE,
be a good friend) has completely changed
TOO, LIVE GLOBAL LIVES.
the game, cultural expectations and our
collective imagination about the power—and
universality—of who we are.
Still, for women, the evolution has been a slow
process. Even 20-plus years after I started
in production, finding well-rounded and
substantial leading roles for women—beyond
the girlfriend, wife or mother—is still a challenge.
Quite simply, strong roles for women of any race
On the movie front, it’s simply harder to
get movies made that are about a specific
group—African Americans, women, LGBTs,
Latinos—because fewer studios are making
fewer films. They are now focused on franchises
and blockbusters that will also play well in
are sadly rare.
the international box office and can be sold
In fact, a recent study by the Center for the
direction is not about race or a disinterest in
Study of Women in Television and Film at
telling smaller, character-driven stories. It simply
San Diego State University found that women
represents the new business model for the
comprised a dismal 12 percent of leading roles
movie business.
as products across various platforms. This
in the top-grossing films of 2014. The situation
seems to be getting worse over the long- and
short-term, as the 2013 figure was 15 percent,
2015 STATE OF BLACK AMERICA¨
SAVE OUR CITIES
While there are some financing entities and
distribution companies that will focus on the
NATIONAL URBAN LEAGUE
Essay 7 + 138
smaller movies, they are few in number—which
students to see the movie Selma for free at local
leaves filmmakers with the difficult feat of
theaters. I co-chaired the effort in Los Angeles,
raising their own money, completing the movie
and the national movement, which to date has
and trying to secure distribution.
spread to more than 30 cities, has raised more
In the Hollywood landscape of recent years,
financing a movie is a challenge for everyone,
even the most established names. This is why
I have such respect for Ava DuVernay—as a
filmmaker and a businesswoman. She raised
the financing for her first couple of films and
took the extraordinary step of creating her
own distribution network. This self-generated
platform allowed her to gain the experience and
acclaim that ultimately put her in a position to
be selected to direct a film like Selma. Similarly,
Lee Daniels was an independent king for years,
raising the money for the smaller movies he
than $2.3 million and sent more than 300,000
students to see the movie. We not only made
it possible for African-American students to
learn more about our history, but we impacted
the box office for the movie. I was amazed and
truly thrilled as I watched this effort unfold—
the emails that went out and the people who
immediately joined in. It happened so quickly,
and I know that we can do the same around
other causes and to support other movies.
When we harness our power and our resources,
combined with real leadership and cooperation,
we can accomplish anything.
produced and/or directed as well as for Precious
This is what we can begin to do, as a Hollywood
and Lee Daniels’ The Butler.
community and a community-at-large, to
So for those who have a story to tell, but who
do not have a financial network or the required
business acumen to wear the many hats that it
takes to get a movie made, the hill is that much
support artists and films that tell our stories,
have a meaningful impact on our lives and
encourage the world to see us through the
positive and complex images we create.
steeper. I recently gave a speech at the African-
I can now, finally, see more of myself on the big
American Film Critics Association dinner where
and small screens. +
I said that we must start helping ourselves
more. We—in Black Hollywood—need to have
an infrastructure in our own community so that
we can effectively support new filmmakers,
exchange information, and share financing
opportunities. Charles King, formerly co-head
of the Talent department at the William Morris
Endeavor Agency, recently took a big step in
this direction by establishing Macro Ventures, a
financing company for African-American films
and television.
Another example of self-help in action is the
recent “Selma for Students” campaign. A group
of my good friends—business executives, civic
leaders and philanthropists—in New York City
developed this idea to allow African-American
2015 STATE OF BLACK AMERICA¨
SAVE OUR CITIES
NATIONAL URBAN LEAGUE
Essay 8 + 139
2015 STATE OF BLACK AMERICA¨
SAVE OUR CITIES
NATIONAL URBAN LEAGUE
Essay 8 + 140
We grew up in the blighted community of Newark,
New Jersey surrounded by drugs, crime and poverty.
Newark, with its working-class base bursting with great
potential and talent, is unfortunately perhaps best
known as one of the most dangerous cities in America.
2015 STATE OF BLACK AMERICA¨
SAVE OUR CITIES
NATIONAL URBAN LEAGUE
Essay 8 + 141
As children, the three of us possessed tons of
the success friends could achieve when paired
ambition, optimism and an unbelievable desire
together with common interests and the
to make something positive of our lives. What
promise to look out for one another. Our pact
we lacked in support and a blueprint, we found
was not only a win for us individually, but a
in our collective spirit of hope, faith and belief.
triumph for all inner-city communities across
Raised in single parent homes, we soon
the country.
discovered that a great deal of what we needed
Our Black communities continue to face
to rise and overcome our circumstances rested
inconceivable hardships and struggles. From
in the support we had for one another. The
the outside looking in, it often appears we are
reality was that our friendship was the key that
frozen in a state of non-progress. We are faced
not only unlocked the doors to our potential,
with a lack of job opportunities, inadequate
but that also gave us the strength we needed
educational facilities and resources and ongoing
to walk through them. We realized this early
violence. Daily, our young men face life-
on when we first met in the 9th grade in the
snatching disagreements where arguments end
hallways at University High School. So, we
in gun violence; where lives are far too often lost
decided on something unconventional. We
at the hands of those who look like the victims;
decided to make a boyhood promise to one
and where, as of late, the seeming barrage of
another to stick together and find a way to
lives snatched by law enforcement has played
success. There were no contracts or finger-
out on an international stage—exposing our
cutting blood pact oaths, but rather an eye-
nation’s incomplete journey to liberty and
to-eye stare, a nod of heads and our individual
justice for all. We need not look far to see that
word that we would have each other’s back
our communities are in crisis.
no matter what. Our promise to one another
was iron-clad and stood as strong as any
binding legal agreement. We wanted more than
anything to survive the streets and rise above
the lure of fast money, cars and jewelry that had
attracted and destroyed so many of the people
So we want to offer a solution—one that is very
simple and practical, one that we all can work
collectively to enforce:
+ Let solidarity take front seat.
we loved.
+ Form strong, positive friendships and networks.
In the midst of uncertainty, we made a choice to
+ Form a forward-looking pact with friends,
invest in the one thing we knew for certain—our
family, neighbors, a higher power.
friendship—and with that, the pact was born.
With the focus on higher education as our
aspiration and friendship as our foundation, we
stepped out to achieve the unimaginable. We
set our sights on becoming doctors.
+ Use education as a tool to build a better
community.
Without an education today, a state of
impoverishment is the most likely outcome. Yet,
Today, we have achieved what many naysayers,
an astonishing, unfathomable 1.2 million high
onlookers and even well-wishers labeled
school students drop out of school each year.1
impossible and anomalous for inner-city youth
We can do better. We must do better—and
like us. Today, we are doctors. We always
education is the lifeline.
understood the power of our friendship and
2015 STATE OF BLACK AMERICA¨
SAVE OUR CITIES
NATIONAL URBAN LEAGUE
Essay 8 + 142
WE NEED TO START
Our children cannot aspire to be what they
cannot see. They need to see the many options
GLORIFYING PEOPLE
before them of what they can do and who they
WHO HAVE BECOME
can be. They need to know that they can make
SUCCESSFUL THROUGH
pacts like we did and understand that when they
focus on education and college or university
EDUCATION, JUST AS WE
completion, they too can rise above and
APPLAUD AND CELEBRATE
overcome their circumstances. But they cannot
THOSE WHO HAVE BECOME
do this on their own. We need to help them
by ensuring they get the proper messaging
SUCCESSFUL THROUGH
through media and social platforms, even when
ATHLETIC PROWESS OR
those around them doubt their chances to
ENTERTAINMENT.
succeed. With a campaign such as “I Wanna be
Like…,” we can inspire our kids to dream beyond
anything they’ve imagined. Their dreams should
We need to foster these positive peer groups of
friends. We need to start glorifying people who
have become successful through education, just
as we applaud and celebrate those who have
become successful through athletic prowess
or entertainment. It’s not surprising that our
young people “want to be like Mike” (or to catch
up with the times “like LeBron”) because let’s
face it, those lifestyles look appealing. But so
do ours, and our kids need to understand that.
Unfortunately, what they see when thinking
about becoming a doctor is the hard work,
long hours and years of schooling that go into
becoming one. But what they don’t know is the
hard work that it also takes to be a successful
entertainer or athlete. Instead, they primarily
see the glorifying results. From the outside
looking in, it’s all fun with little effort. Who
wouldn’t want that? They don’t realize they
not be limited to just being a celebrity. Let’s
broaden their horizons and expose them to
dreams of becoming a scientist or engineer—
and most importantly, get them excited about
it! We need everyone—parents, teachers,
mentors, celebrities—to help us do this. Like
most things, so much lies in the messaging. Let’s
get better control of the messages our children
are getting. We compete daily with negative
messaging from every side telling our children
what they cannot achieve. Let’s fight back with
the innovative, inspirational messaging that our
children deserve.
Let’s make education that New Cool. Want to
see change? Well, we need to be the doctors;
we need to be the teachers; we need to be the
prosecutors; we need to be the police. We need
to be the change we want to see.
have better odds of becoming one of The Three
Nowadays, everybody wants to be a celebrity,
Doctors than they do of becoming the next
but what we really need are more heroes. In
LeBron James. We need media campaigns
fact, today’s classified ads should read: “Heroes
and sports and entertainment collaboration
Wanted: Only the Serious Need Apply.” Let’s
to glorify success stories beyond those we
answer the call. +
typically see in the headlines. We should have
broad-reaching campaigns that proclaim “I
want to be like…The Three Doctors…or the two
astronauts…or the four teachers,” and so on.
2015 STATE OF BLACK AMERICA¨
SAVE OUR CITIES
NOTES
1
iller, Tony. “Partnering for Education Reform.”
M
U.S. Department of Education (2011).
NATIONAL URBAN LEAGUE
Essay 9 + 143
2015 STATE OF BLACK AMERICA¨
SAVE OUR CITIES
NATIONAL URBAN LEAGUE
Essay 9 + 144
I am a second generation African-American male
entrepreneur. It’s 2015, and unfortunately, I’m still
a virtual anomaly. According to the U.S. Census Bureau,
things are rapidly improving, but we have decades of
entrepreneurial and economic disparity to contend with
in the African-American community.
2015 STATE OF BLACK AMERICA¨
SAVE OUR CITIES
NATIONAL URBAN LEAGUE
Essay 9 + 145
From 2002 to 2007, the number of Black-owned
businesses increased by 60.5 percent. Over the
same period, receipts generated by Blackowned businesses increased 55.1 percent to
In short, the true color of freedom is green.
Before desegregation, Black-owned businesses
weren’t a rarity. Blacks couldn’t eat in the
$137.5 billion.1
same restaurants and go to many of the same
Census Bureau Deputy Director Thomas
our community needed were apparent. The
places as whites, so the kinds of businesses
Mesenbourg notes that “Black-owned
businesses continued to be one of the fastest
growing segments of our economy, showing
NOW, THE AVERAGE
rapid growth in both the number of businesses
AFRICAN-AMERICAN
and total sales during this time period.”
It’s peculiar. In the midst of seemingly
improved economic conditions and increased
entrepreneurial rates, I still stand in the few
HOUSEHOLD MAY HAVE
MORE, BUT WE CERTAINLY
DON’T OWN MORE.
amongst my peers. I look around Capitol Hill,
board rooms, financial institutions, business
networks, and I don’t see enough people who
look like me. I venture to say if we asked young,
impressionable African Americans who their role
models are, we’d find a disproportionate share
of them naming athletes and entertainers—not
business owners.
void was obvious and our people filled the
gap. From the National Negro Business League
to pulpits across America, Black people were
inspired and supported in entrepreneurship. We
owned restaurants, salons, barber shops, child
care facilities, and more. Our people mastered
a trade, sharpened their business savvy, and
It’s saddening, but I understand.
The images of successful Black people that our
youth continue to be bombarded with are of our
incredible athletes and gifted entertainers. Too
few were blessed as I was to have a personal
relationship with a business owner who was my
role model—and mother.
created our own business ecosystem.
Now, with access to education, we support
careers in fields including medicine and law, as
these weren’t early options for us. Now, with
increased economic power and desegregation,
we spend our “professional” dollars in the
mainstream and minority-owned businesses of
Asians and Hispanics that we once owned. Now,
Unfortunately, post desegregation, African
the average African-American household may
Americans have been reticent starters of
have more, but we certainly don’t own more.
businesses. This doesn’t change the reality that
the only sustainable economic passage to wealth
and power is entrepreneurship. I believe that
business ownership is a must to truly dictate
the long-term success and trajectory of one’s
life, family and generations to come. In fact, it
is African-American business ownership that
will save our communities by stimulating the
economy, generating jobs and decreasing crime.
2015 STATE OF BLACK AMERICA¨
SAVE OUR CITIES
This begs the age-old question: Why haven’t
African Americans embraced entrepreneurship
at the rate of other ethnic minorities?
1. Business ownership has not been engraved
in our family culture. Much of who we are
derives from our upbringing. My mother was a
business owner. Entrepreneurship was all that
I knew—I was groomed for this. Many African
NATIONAL URBAN LEAGUE
Essay 9 + 146
Americans not only don’t have family images of
of longevity and revenue, begin to expand
business ownership, but there isn’t a combined
your circle to include the number of aspiring
family wealth that can support a first-time
and inexperienced African-American
entrepreneur. We see many immigrants
entrepreneurs with whom you can share your
pooling resources to make the American
wealth of knowledge.
dream come true via their family-owned and
operated businesses. This communal model of
2. Plant a seed. Financial resources continue
to be one of the leading reasons why Black
business ownership simply hasn’t been largely
people don’t start businesses. Not only do we
embraced by our community.
have to stop being afraid to ask for financial
2. T
here is a limited perception of success.
support, but we must begin to step up and
When one defines success as either being a
be private investors for and consumers of our
doctor, lawyer, athlete or entertainer, then
own businesses.
the ability to envision new possibilities has
already been stifled. Entrepreneurship is
3. Free your mind. Release yourself to the
possibility of owning your future. Look within
about being an answer to someone’s want or
and around you so business opportunities
need. It’s that simple—supply and demand.
and possibilities manifest. Free yourself from
What can you supply that is needed or
the fear of failure by acknowledging it and
wanted enough for someone to pay you for
having the faith in yourself to take the next
it? The next step is to determine how you
step anyway.
can do it or provide it so well that you can
be successful and change the course of your
family and community.
As the President and CEO of the only African
American-owned multi-media conglomerate in
3. A clear definition of business opportunities
does not exist. Today, it is no longer
overwhelmingly obvious which kind of
business to open. Perhaps some of the delayed
entrance of African Americans into business
ownership stems from simply not knowing
what kind of business to launch or not knowing
how their skills and abilities can be monetized.
In a time where science and technology are so
critical to our global economy, we must plant
the seed of achievement in our children for
STEM academics in addition to the hunger
for entrepreneurship.
the country, Radio One, Inc., I realize my role in
helping to rebuild the Black financial ecosystem.
Our mission is to be the most trusted source
in the African-American community that
informs, entertains and inspires our audiences
by providing culturally relevant, integrated
content through our radio, television and digital
platforms. Realizing how critical it is for people
to see an image of themselves as successful,
we are committed to shaking up the traditional
perspective and providing alternative images on
all forms of media.
I’m a second generation African-American
So, how do we continue to change the tide,
rebuild the Black financial ecosystem and
sustain Black-owned businesses?
male entrepreneur. It’s 2015, and I’m tired of
being an anomaly. +
NOTES
1
1. Each one teach ten. For those who have
achieved entrepreneurial success in terms
2015 STATE OF BLACK AMERICA¨
SAVE OUR CITIES
nited States Census Bureau, Census Bureau Reports
U
the Number of Black-Owned Businesses Increased at
Triple the National Rate.
NATIONAL URBAN LEAGUE
Essay 10 + 147
2015 STATE OF BLACK AMERICA¨
SAVE OUR CITIES
NATIONAL URBAN LEAGUE
Essay 10 + 148
In the summer of 1857, 43 educators gathered in
Philadelphia, answering a national call to unite as one voice
in the cause of public education. At the time, learning to
read and write was a privilege reserved for the fortunate few.
But almost 160 years later, the voice of the once fledgling
National Education Association has risen to represent more
than three million educators, and a free and public education
has become a rite of passage for every American child.
2015 STATE OF BLACK AMERICA¨
SAVE OUR CITIES
NATIONAL URBAN LEAGUE
Essay 10 + 149
Over the last 15 decades, the National Education
environments, minority children have remained
Association (NEA) has led the country in
disproportionately vulnerable to the legacy of
advocating for children and the educators who
racial bias and poverty.
teach and nurture them. Through the power of
the collective, the union gave voice to some of
the defining issues of our times: establishing
the civil rights of Black children and educators,
granting women the right to vote and leading
This disparity in opportunity is illegal, immoral
and costly for our nation. These opportunity
gaps become even more urgent as the face of
American public education is changing. Today,
the charge against child labor.
ethnic minority students comprise nearly
Ours is a history of people who inspired change.
schools. It is anticipated that during the next 20
Today’s challenges require the same kind of
years, that figure may well reach 50 percent. 2
40 percent of the population in our nation’s
leadership and moral courage demonstrated by
the women and men who built our union.
I was born one year after the Supreme Court of
EQUAL OPPORTUNITY
the United States issued its landmark Brown v.
IN EDUCATION IS A
Board of Education opinion 60 years ago. By the
CONSTITUTIONAL RIGHT
time I began my career as an educator, I hoped
that we would soon realize the promise of equal
opportunity in education for every student.
Unfortunately, although the Court outlawed
OF ALL STUDENTS. YET
THAT RIGHT TO EQUAL
OPPORTUNITY IS STILL
segregation, it is still a reality today—and
BEING DENIED TO
Brown wasn’t simply about segregation.
MILLIONS OF STUDENTS.
The Court wrote:
“In these days, it is doubtful that any child may
reasonably be expected to succeed in life if he
is denied the opportunity of an education. Such
an opportunity…is a right which must be made
available to all on equal terms…”
If we are to preserve and advance America’s
public schools, we must meet the needs of these
children, support ethnic minority community
commitment to public education, work
collaboratively to improve the quality of their
The Justices were unanimous and they were
schools and assure that all children receive the
unequivocal: equal opportunity in education is
education they need and deserve.
a constitutional right of all students. Yet that
right to equal opportunity is still being denied to
millions of students.
Reauthorization of the Elementary and
Secondary Education Act (ESEA) is a unique
opportunity to fulfill America’s promise of
Most Hispanic and Black students are in
equal opportunity to all students. It has been
classrooms in which at least two-thirds of their
more than 12 years now since No Child Left
peers are also minorities, and virtually half are
Behind (NCLB)—the last reauthorization of
poor.1 These schools often have inexperienced
ESEA—became law. The most crucial element
teachers, inadequate resources and dilapidated
of that iteration of the law was the introduction
facilities. Plagued by segregated learning
of disaggregated data to spotlight gaps
2015 STATE OF BLACK AMERICA¨
SAVE OUR CITIES
NATIONAL URBAN LEAGUE
Essay 10 + 150
in achievement for specific populations of
We know that every child can learn. We know
students, including those in high-poverty
that every child can reach the highest of heights
schools, African Americans, Latinos, Asian
when given the opportunity and resources
Americans, Native Americans and students
to learn. To fulfill at last America’s promise
with disabilities.
of equal opportunity, the centerpiece of the
The theory: spotlighting achievement gaps
would prompt the appropriate diagnosis and
infusion of resources and interventions targeted
to groups of students who most needed it. In
reality, that has not occurred.
accountability system in the next Elementary
and Secondary Education Act must include an
“opportunity dashboard” that will finally lead to
the delivery of the supports and interventions
to students who need it the most. +
NOTES
Now is the time to fix that deficiency. This time
1
ational Center for Education Statistics’ Early
N
Childhood Longitudinal Study, Kindergarten Class
of 2010-11 (ECLS-K:2011).
2
U.S. Census Bureau.
3
National Center for Children in Poverty.
around, ESEA’s accountability system should
revolve around an “opportunity dashboard”
composed of key indicators of school quality
disaggregated—largely data already captured
by the Department of Education’s Office of
Civil Rights—on students’ access to, among
other things:
+ Advanced coursework (AP/IB, dual enrollment,
college gateway math and science)
+ Fully-qualified teachers
+ Specialized instructional support personnel
(school counselors, nurses and psychologists)
+ High-quality early education
+ Arts and athletic programs
+ Community health care and wellness programs
The federal role in ensuring equal educational
opportunity is as essential today as it was 60
years ago, when the Supreme Court decided
Brown v. Board of Education. One in five of our
children—more than 16 million—are living in
households below the official poverty threshold
(an income of $23,850 for a family of four).
Remarkably, more than half of our public school
students are now eligible for free- and reducedprice meals. 3
2015 STATE OF BLACK AMERICA¨
SAVE OUR CITIES
NATIONAL URBAN LEAGUE
Appendix 1 + 151
About the Authors
MAYOR MURIEL BOWSER
schools and recreation centers, and created consumer
Mayor Muriel Bowser brings a
protections for homeowners facing foreclosure. As
pragmatic, hands-on
Chair of the Washington Metropolitan Transit Authority
approach to finding solutions
(Metro) Board’s Planning, Program, and Real Estate
to address the needs of
Committee, Bowser led the adoption of comprehensive
residents in Washington, DC.
revisions to joint development policies that promote
She was first elected Ward 4
more transparency, competition, higher quality transit
Councilmember in a special
oriented development, and include Metro’s first-ever
election in 2007, re-elected in 2008, and again in
affordable housing policy. She also previously served as
2012. On November 4, 2014, voters elected Bowser as
Chair of the regional Metropolitan Washington Council
the seventh elected, and only second woman, mayor
of Governments’ Transportation Planning Board.
of the District of Columbia. Voters have strongly
endorsed Bowser’s ambitious agenda focused on an
Bowser’s strong message of representing all eight
open and ethical government, rebuilding quality
wards won the hearts of voters and an endorsement
neighborhoods and transforming DC’s schools and
from President Obama, who described her as “a
commercial corridors.
champion for working and middle-class families,
and a passionate proponent of Washington, DC.”
During Bowser’s tenure as Councilmember, Ward 4’s
She is committed to improving the lives of all
population grew, quality school choices and public
Washingtonians, whether they have been there for
spaces increased, and hundreds of units of housing
five minutes or five generations. Bowser’s fierce
were created. Dozens of new stores, restaurants,
advocacy to improve the District won her the
and small businesses opened, and violent crime
endorsement of the Washington Post which wrote:
plummeted. Positive and sustainable change is visible
“Smart, hardworking and independent-minded, Ms.
on every corner of Ward 4.
Bowser has shown herself to be an effective advocate
for the interests of her demanding ward and a leading
Throughout her career, Bowser has focused her
voice for education reform and good government.”
attention on enhancing the lives of residents District-
She was also honored with the Democratic State
wide. She was selected by her colleagues on the
Committee’s Legislator of the Year Award (2012), the
Council as Chairwoman of the Committee on Economic
Phyllis Campbell Newsome Public Policy Leadership
Development and created more than 5,000 units
Award (2012), and the NoMa Business Improvement
of affordable housing, passed legislation to build a
District Public Sector Award (2012).
new soccer stadium and secured the best portion
of the Walter Reed campus for DC. Previously, as
Bowser, a native Washingtonian, earned a Bachelor
Chairwoman of the Committee on Government
of Arts degree in History from Chatham College
Operations, Bowser worked with her colleagues to
and a Master’s degree in Public Policy from
pass comprehensive ethics reform in the District,
American University.
improved the safety and efficiency of the Metro
system, and increased transparency in government
contracting. As Chair of the Committee on Libraries,
Parks and Recreation and the Committee on Public
Services and Consumer Affairs, Bowser championed
the causes of increasing the revenue generating
potential of DC’s public spaces, curbed bullying in its
2015 STATE OF BLACK AMERICA¨
SAVE OUR CITIES
NATIONAL URBAN LEAGUE
Appendix 1 + 152
DEBRA MARTIN CHASE
Ms. Chase was the motion picture and television
Debra Martin Chase is an
producing partner of Whitney Houston in BrownHouse
Emmy-nominated and
Productions from 1995 to 2000. She ran Mundy Lane
Peabody Award-winning
Entertainment, Denzel Washington’s production
television and motion picture
company, from 1992 to 1995.
producer whose company,
Martin Chase Productions, has
Ms. Chase graduated Phi Beta Kappa, Magna Cum
been affiliated with the Walt
Laude from Mount Holyoke College and the Harvard
Disney Company since 2001 and been based at the
Law School. In 2007, she received an honorary
ABC Television Network since 2012.
Doctorate of Arts from Mount Holyoke and is a
member of its Board of Trustees. She also serves on
She was the first African-American female producer
the board of the New York City Ballet and is on the
to have a deal at a major studio. Much of her work has
Women at NBC/Universal Advisory Board and the
focused upon women, tweens, dance and music.
Producing Mentor Board of USC’s Peter Stark Program.
She has co-chaired the Athena Film Festival in New
Her filmography includes three beloved franchises: The
York City, a collaboration between Barnard College
Princess Diaries, The Sisterhood of the Traveling Pants
and the website Women and Hollywood, for the past
and The Cheetah Girls. The Princess Diaries and its hit
four years. Ms. Chase is also a member of the Academy
sequel jointly grossed over $300 million in worldwide
of Television Arts and Sciences.
box office receipts and launched the movie career of
actress Anne Hathaway. According to Variety, the first
Among her numerous awards and honors, in 2007,
Sisterhood of the Traveling Pants was one of the best
2008 and 2009, Ebony Magazine named Ms. Chase
reviewed movies of 2005 and began the career of
one of the 150 Most Influential African Americans in
another young actress, Blake Lively. The soundtrack
America. In December 2012, Black Enterprise Magazine
for The Cheetah Girls, which Ms. Chase also executive
named her one of the Ten Most Bankable African
produced, went double platinum. Its first sequel was the
American Movie Producers in Hollywood based upon
most watched movie debut in the history of the Disney
worldwide box office, the only woman on the list.
Channel and the singing group had one of the most
In 2013, she was awarded the Entertainment Award
successful U.S. concert tours of the 2006–2007 season.
by the Trumpet Awards Foundation for her career
Her other motion picture producing credits include
achievements. In 2015, she was similarly honored by
Sparkle, a dramatic musical starring Jordin Sparks and
the African American Film Critics’ Association and
the late Whitney Houston; Just Wright starring Queen
received its Ashley Boone Award.
Latifah, which won the 2011 NAACP Image Award for
Best Screenplay; Courage Under Fire starring Denzel
Washington; and the perennial holiday favorite, The
Preacher’s Wife starring Washington and Houston. Her
television credits include the Emmy-winning Rodgers
& Hammerstein’s Cinderella with Brandy and Houston;
the Lifetime Television series Missing, which had the
most watched series debut in the network’s history;
the Disney Channel’s original musical Lemonade Mouth,
which featured a number one Billboard soundtrack
that Ms. Chase executive produced; and the Oscar
and Emmy-nominated and Peabody Award-winning
documentary Hank Aaron: Chasing The Dream. She
has also produced four movies in her partnership with
Mattel’s American Girl Company.
2015 STATE OF BLACK AMERICA¨
SAVE OUR CITIES
BENJAMIN LLOYD CRUMP, ESQUIRE
Distinguished lawyers whose
names are on the pages of
American History books are
not there because of their
pedigree, their alma mater,
or even their affluence. It is
because of the landmark
cases they won and how their success has changed
jurisprudence. Attorney Benjamin Crump and his legal
prowess and success have created a significant legal
legacy that ensures that the promise found in our
nation’s constitution is indeed real in every state,
municipality and neighborhood. His legal acumen as
NATIONAL URBAN LEAGUE
Appendix 1 + 153
both a litigator and advocate has ensured that those
very critical victory as lead attorney on what has been
most frequently marginalized are protected by their
characterized as a landmark voter’s rights case of this
nation’s contract with its constituency. The conspectus
millennium when nine African-American women were
of his constitutional battles at both the local, state and
arrested with guns drawn for voter fraud in Madison,
federal levels will be the textbook most frequently
Florida. In 2012, Crump led the fight for justice as the
referenced by this and future generations of civil rights
lead attorney for the family of Trayvon Martin, who
law and the protection of constitutional freedoms.
was killed by a neighborhood watch volunteer, George
Zimmerman, in Sanford, Florida while walking home
Benjamin Crump has been recognized as one
with a bag of Skittles and a can of iced tea. Presently,
of The National Trial Lawyers Top 100 Lawyers,
Crump is the lead attorney for the family of Michael
Ebony Magazine Power 100 Most Influential African
Brown, the young man that was killed by a Ferguson,
Americans, and bestowed the NAACP Thurgood
MO police officer, in broad daylight while holding his
Marshall Award and the SCLC Martin Luther King
hands in the air.
Servant Leader Award. He and his law partner,
Daryl Parks, have provided legal representation and
Attorney Crump understands that the practice
recovered millions of dollars for their clients in some
of law is a privilege that carries with it certain
of the most high-profile cases in the United States.
responsibilities and obligations to our society and
In 2001, the firm represented Zaniyah Hinson, a case
to our democracy. He gives freely and unselfishly of
discussed on the Oprah Winfrey Show where a two
his time and legal talent to represent the poor, the
year-old died after being left in a daycare van for four
powerless, the defenseless and the oppressed among
hours in 104 degree temperatures. ESPN SportsCenter
us. He strives through his work to fulfill the promise
broadcast another case the firm handled which
of equal justice for all. He is married to Dr. Genae
documented Leeronnie Ogletree, a 39 year-old who
Angelique Crump and is the proud father of Brooklyn
had been sexually molested by the Boston Red Sox
Zeta Crump and legal guardian to Chancellor Isiah
Clubhouse manager when he was a ball boy as a youth.
Crump and Jemarcus Crump.
In January 2006, Crump relentlessly pursued justice
on behalf of the parents of Martin Lee Anderson,
the 14 year-old boy who died the day after he was
MAYOR KAREN FREEMAN-WILSON
On December 31, 2011, Karen
restrained, beaten and suffocated at the Bay County
Freeman-Wilson became the
juvenile boot camp. The camp’s security cameras
first woman to lead the steel
captured the incident on videotape. The case was
city of Gary, Indiana and the
featured on television shows including NBC’s Today
first African-American female
Show, ABC’s 20/20 and CNN’s Anderson Cooper 360,
mayor in Indiana.
as well as chronicled in Essence, Jet, and Newsweek
magazines. In December 2009, Crump served as lead
Along with her husband,
attorney for a class of plaintiffs who were fatally and
Carmen Wilson, and their daughter Jordan, Freeman-
critically injured when the Berkman Plaza Parking
Wilson resides in her native city of Gary, Indiana.
Garage collapsed in Jacksonville, Florida. Also in 2009,
She was valedictorian of her graduating class at
he became co-counsel of a class-action case that
Gary’s storied Roosevelt High School and went on to
had been pending for more than a decade on behalf
graduate from Harvard College (cum laude) and from
of families who sued the St. Joe Paper Company for
Harvard Law School.
selling them wetland in Port St. Joe, Florida. Due to
their homes being built on wetlands, their houses
Despite her breadth of travel and influence throughout
began to fall apart as they sank into the ground
the United States, Freeman-Wilson’s loyalty and
allowing insects and pests to come though the walls as
commitment to her home city has never wavered.
water pipes cracked, causing them to be without heat
Indeed, her passion for Gary, coupled with her
or hot water in the winter. Crump recently achieved a
experience and training, have positioned her for
2015 STATE OF BLACK AMERICA¨
SAVE OUR CITIES
NATIONAL URBAN LEAGUE
Appendix 1 + 154
leadership and prepared her to tackle the major
and gun control. As chair of the committee, Freeman-
challenges facing the city. She is the immediate
Wilson will play a key role in shaping NLC’s policy
past CEO of The National Association of Drug Court
positions and advocating on behalf of America’s cities
Professionals and Executive Director of The National
and towns before Congress, with the Administration
Drug Court Institute based in Washington, DC. With
and at home. Freeman-Wilson also chairs the U.S.
Freeman-Wilson at the helm, the number of drug
Conference of Mayors—Mayors/Police Chiefs Working
courts in the U.S. doubled to 1,700 and NADCP
Group on Police Community Relations.
became the premier organizational advocate for drug
treatment in the judicial arena. Freeman-Wilson has
When asked about her commitment to her hometown,
consulted with the Office of White House Drug Control
Freeman-Wilson often acknowledges that Gary has a
Policy, the Department of Justice and the National
history of many obstacles, but quickly notes that the
Highway Traffic Safety Administration in the creation
city’s challenges pale in comparison to its potential.
and implementation of drug policy. As the twice-
“Our city is a diamond in the rough and we simply
elected Gary City Judge, she helped pioneer the drug
need the right leadership.”
court movement in Indiana.
Freeman-Wilson has also demonstrated public service
and leadership in state government. During her
tenure as Indiana Attorney General, Freeman-Wilson
fought passionately on behalf of youth, seniors and
SECRETARY ANTHONY FOXX
Anthony Foxx became the 17th
United States Secretary of
Transportation on July 2, 2013.
abused nursing home patients. She was one of the
In nominating him, President
first Attorneys General in the country to combat gas
Obama said, “I know
price gouging and to ensure that tobacco settlement
Anthony’s experience will
dollars were directed towards smoking cessation and
make him an outstanding
health care. While she was the Executive Director of
Transportation Secretary. He’s got the respect of his
The Indiana Civil Rights Commission, Indiana was one
peers, mayors, and governors all across the country.
of the first states to pass legislation comparable to the
And as a consequence, I think that he’s going to be
American with Disabilities Act.
extraordinarily effective.”
Her capabilities, intellect and stellar record of success
As U.S. Secretary of Transportation, Foxx leads an
have not gone unnoticed by national party leaders. In
agency with more than 55,000 employees and a
2000, she was named as one of the top 100 to watch by
$70 billion budget that oversees air, maritime, and
the National Democratic Leadership Council. That was
surface transportation. His primary goal is to ensure
followed with the honor of being asked to address the
that America maintains the safest, most efficient
2000 National Democratic Convention in Los Angeles.
transportation system in the world.
Her contributions have also been acknowledged by
U.S. Drug Czars, Indiana Governors and Supreme Court
Foxx joined the U.S. Department of Transportation
Justices throughout the United States.
after serving as the mayor of Charlotte, North Carolina,
from 2009 to 2013. During that time, he made efficient
In January 2015, Freeman-Wilson was appointed chair
and innovative transportation investments the
of the National League of Cities (NLC) Public Safety
centerpiece of Charlotte’s job creation and economic
& Crime Prevention Committee. This committee has
recovery efforts. These investments included
the lead responsibility for developing NLC federal
extending the LYNX light rail system, the largest
policy positions on issues involving crime prevention,
capital project ever undertaken by the city, which will
corrections, substance abuse, municipal fire policy,
build new roads, bridges, transit as well as bicycle and
juvenile justice, disaster preparedness and relief,
pedestrian facilities; expanding Charlotte-Douglas
homeland security, domestic terrorism, court systems
International Airport, the sixth busiest in the world;
2015 STATE OF BLACK AMERICA¨
SAVE OUR CITIES
NATIONAL URBAN LEAGUE
Appendix 1 + 155
working with North Carolina Governor Beverly Perdue
movement and raised alarms on the outsize role that
to accelerate the I-485 outer belt loop using a creative
testing is playing in public education: taking over the
design-build-finance approach, the first major project
time students spend in the classroom, being used as
of its kind in North Carolina; and starting the Charlotte
a weapon against their teachers, and distracting from
Streetcar project.
real problem of inequality.
Prior to being elected mayor, Foxx served two
Her new role is an extension of her teaching days
terms on the Charlotte City Council as an At-Large
in Utah. She was named Utah Teacher of the Year
Representative. As a Council Member, Foxx chaired
in 1989 after nine years in the classroom. She also
the Transportation Committee, where he helped
worked with homeless children and gifted children;
shepherd the largest transportation bond package
as a mentor for student teachers; and as a peer
in the city’s history, enabling Charlotte to take
assistance team leader at Orchard Elementary School
advantage of record low interest rates and favorable
in the suburbs of Salt Lake City.
construction pricing to stretch city dollars beyond
initial projections. Foxx also chaired the Mecklenburg-
In 1998, she attempted to put her 20 years of
Union Metropolitan Planning Organization.
experience working with small children to practical
use by becoming her party’s nominee for the U.S.
Foxx is an attorney and has spent much of his career
Congress. The rookie effort didn’t work out but she
in private practice. He also worked as a law clerk for
made her mark: she was the first Hispanic to run for
the U.S. Sixth Circuit Court of Appeals, a trial attorney
Congress in her state and earned 45 percent of the
for the Civil Rights Division of the U.S. Department
vote against the incumbent.
of Justice and staff counsel to the U.S. House of
Representatives Committee on the Judiciary.
Lily is a sought-after speaker and has keynoted
hundreds of education events across the country,
Foxx received a law degree from New York University’s
earning her recognition by Education World in their
School of Law as a Root-Tilden Scholar, the University’s
“Best Conference Speakers” edition. She also blogs at
prestigious public service scholarship. He earned a
“Lily’s Blackboard” bringing a teacher’s voice to topical
bachelor’s degree in History from Davidson College.
education issues. Her advice has been published in
Parenting magazine, and she has been featured on
Foxx and his wife, Samara, have two children, Hillary
MSNBC, CNN en Español and as the noble opposition
and Zachary.
on Fox & Friends.
Lily believes in the sacred duty of all educators to be
LILY ESKELSEN GARCÍA
Lily Eskelsen García is
president of the National
Education Association, the
nation’s largest labor union.
Lily began her career in
education as a school lunch
lady and now leads a
professional association of three million educators—
she is the first Latina to lead the NEA and one of the
country’s most influential Hispanic educators.
Prior to assuming the top post, Lily served two terms
as NEA Vice President and Secretary-Treasurer. She
became a vocal critic of the standardized testing
2015 STATE OF BLACK AMERICA¨
SAVE OUR CITIES
professionals and to care for the whole student—mind,
body and character—no matter how students arrive
and no matter their learning conditions, their home
conditions or their health conditions. She believes
that professionalism carries the responsibility to
take action, individually and collectively, to fight to
make the promise of public education a reality and
to prepare the whole and happy child to succeed in
becoming a whole and happy adult.
Lily is a graduate of the University of Utah,
graduating magna cum laude in elementary
education and later earning her Master’s degree
in instructional technology.
NATIONAL URBAN LEAGUE
Appendix 1 + 156
MAYOR KEVIN JOHNSON
In his prior career, Johnson played professional
Kevin Johnson was elected
basketball in the National Basketball Association. After
as the 55th mayor of the City
earning a B.A. in Political Science from the University
of Sacramento in November
of California at Berkeley, he was drafted as the 7th pick
2008 and re-elected to a
in the 1987 NBA Draft by the Cleveland Cavaliers. He
second term in June 2012.
went on to play twelve seasons with the Cavaliers and
He is the first African
Phoenix Suns, earning honors as a three-time All-Star
American to be elected to
and five-time selection to All-NBA teams. The Mayor
the office. His vision is for Sacramento to become
was inducted into the Phoenix Suns Ring of Honor in
“a city that works for everyone.”
2001 and is a member of the UC Berkeley Athletic Hall
of Fame, Pac-10 Hall of Honor, Sacramento Sports Hall
Since taking office, Mayor Johnson has embarked on
of Fame, Bay Area Sports Hall of Fame, Sac-Joaquin
an ambitious plan to reshape how city government
Section Hall of Fame, National High School Hall of
serves the citizens of Sacramento. His top priorities
Fame and World Sports Humanitarian Hall of Fame.
include improving public safety, creating jobs
and economic development, launching green and
Mayor Johnson has served on the Board of Directors
sustainability initiatives, reforming public education,
for LISC National, the California Charter School
promoting good government and enhancing the
Association, the UC Berkeley Foundation, Teach
quality of life for all Sacramentans.
for America, the Institute of Governmental Studies
National Advisory Council and the Harvard Divinity
Beyond his policy goals for Sacramento, Mayor
School SLI Advisory Board. His concern and
Johnson is committed to elevating Sacramento’s
compassion for children and education prompted
profile as the capital city of California—the 8th largest
President George H. W. Bush to honor Johnson with
economy in the world. To that end, the Mayor has
the 411th Point of Light. In addition, Johnson was
taken on a range of national leadership positions,
selected as one of the “15 Greatest Men on Earth”
including his current roles as President of the U.S.
by McCall’s Magazine and has received the NBA’s
Conference of Mayors, Chair of U.S. Secretary of
J. Walter Kennedy Citizenship Award, the Good
Education Arne Duncan’s Mayors Advisory Council,
Morning America Award from Sports Illustrated,
Chair of the National Resilient Communities for
NCAA Silver Anniversary award and the “Most Caring
America Campaign, and member of the White House
American” award by the Caring Institute.
Task Force on Climate Preparedness and Resilience.
Mayor Johnson has appeared on several national
Before taking public office, Mayor Johnson led a
television programs including CNN Newsroom,
diverse career as a professional athlete, entrepreneur
The Oprah Winfrey Show, Dateline NBC, Larry King
and nonprofit executive. Johnson served as Chief
Live, The Colbert Report, Fox Business Network and
Executive Officer of St. HOPE (Helping Others Pursue
Tom Brokaw’s “American Character.”
Excellence), a nonprofit organization he founded in
1989 and led until January 2008. Originally focused
around providing afterschool programs to at-risk
youth in the Mayor’s native Oak Park neighborhood,
St. HOPE expanded to pursue a broader program of
urban revitalization through public education, civic
leadership, economic development and the arts.
Today, St. HOPE consists of three divisions: St. HOPE
Academy, St. HOPE Development Company, and St.
HOPE Public Schools.
2015 STATE OF BLACK AMERICA¨
SAVE OUR CITIES
NATIONAL URBAN LEAGUE
Appendix 1 + 157
ALFRED C. LIGGINS, III
the performing arts, Mr. Liggins serves on the Board of
Mr. Alfred C. Liggins, III is the
Directors for the Apollo Theatre.
CEO and President of Radio
One, Inc. and the Chairman
and CEO of TV One, LLC. Mr.
MARC H. MORIAL
Entrepreneur. Lawyer.
Liggins sits at the helm of a
Professor. Legislator. Mayor.
family dynasty with his
President, U.S. Conference of
mother, Ms. Cathy Hughes,
Mayors. President and CEO of
which is the only African-American owned multi-media
the National Urban League,
and entertainment company in the country.
the nation’s largest historic
Radio One, Inc. is the largest multi-media company
civil rights and urban
that primarily targets African-American and urban
advocacy organization.
listeners, viewers, readers and Internet users. In
his role as CEO and President of Radio One, Mr.
Liggins has led the Company’s transformation into
a diversified multi-media platform that owns and/
or operates the following assets: 54 radio stations
located in 16 urban markets in the United States,
Interactive One (urbandaily.com, newsone.com,
hellobeautiful.com, blackplanet.com and globalgrind.
com), a majority interest in TV One, LLC (tvoneonline.
com), a cable/satellite network and Reach Media, Inc.
(blackamericaweb.com), owner of the Tom Joyner
Morning Show and other nationally syndicated
radio hosts. Mr. Liggins is responsible for the overall
management and operating performance of Radio
One’s assets, pursuing new business ventures,
In a distinguished professional career that has
spanned 25 years, Marc Morial has performed all of
these roles with excellence and is one of the most
accomplished servant-leaders in the nation. As
President and CEO of the National Urban League
since 2003, he has been the primary catalyst for an
era of change—a transformation for the 105-year old
civil rights organization. His energetic and skilled
leadership has expanded the League’s work around
an Empowerment agenda, which is redefining civil
rights in the 21st century with a renewed emphasis
on closing the economic gaps between whites and
Blacks, as well as other communities of color, and rich
and poor Americans.
identifying acquisitions, managing an integrated
During his tenure, the League had record fundraising
business plan and attracting key talent.
success with a 280MM, five-year fundraising effort. He
TV One is a cable network that reaches 57 million
homes and offers a broad mix of original and
existing programming from all entertainment genres,
including scripted and unscripted dramas, sitcoms,
music shows, lifestyle programs and movies with
a portion of the programming devoted to public
affairs and news documentaries. Mr. Liggins was
has secured the BBB nonprofit certification, which has
established the NUL as a leading national nonprofit,
and the coveted 4-star rating from Charity Navigator,
which has placed the NUL in the top 10 percent of all
U.S. charities for adhering to good governance and
other best practices, as well as executing its mission in
a fiscally responsible way.
instrumental in attracting Comcast as a strategic
Under his stewardship, the League launched a historic
partner in the network. As Chairman and CEO of TV
$100 million, five-year “Jobs Rebuild America: Educate,
One, his responsibility is to lead the overall continued
Employ, Empower” initiative in 2013—a solutions-
expansion of the network, both in terms of subscribers
based, comprehensive approach to the nation’s
and advertising revenues.
employment and education crisis that brings together
Mr. Liggins received his MBA in May 1995 from the
Wharton School of The University of Pennsylvania.
Committed to the African-American community and
2015 STATE OF BLACK AMERICA¨
SAVE OUR CITIES
federal government, business, and nonprofit resources
to create economic opportunity in 50 cities across the
country through the Urban League affiliate network.
NATIONAL URBAN LEAGUE
Appendix 1 + 158
His creativity has led to initiatives such as the Urban
the Top 50 Nonprofit Executives by the Nonprofit Times,
Youth Empowerment Program to assist young adults
and one of the Top 100 Black Lawyers in America.
in securing sustainable jobs and Entrepreneurship
Centers in 10 cities to help the growth of small
businesses. Also, Morial helped create the Urban
Empowerment Fund, which will lend to urban impact
businesses, and helped create the League’s New
Markets Tax Credits initiative, which has pumped
nearly $500 million into urban impact businesses,
including minority business, through both debt and
equity investments.
LA JUNE MONTGOMERY TABRON
La June Montgomery Tabron
is the President and CEO of
the W.K. Kellogg Foundation
(WKKF) in Battle Creek,
Michigan, one of the largest
private foundations in the
United States.
As mayor of New Orleans, Morial was a popular chief
executive with a broad multi-racial coalition who led
New Orleans’ 1990’s renaissance and left office with a
70 percent approval rating.
As a champion for vulnerable children and for creating
the conditions necessary for them to thrive, Tabron
leads the Kellogg Foundation and its work to ensure
the optimal development of young children from
As a lawyer, Morial won the Louisiana State Bar
birth to age 8, heal the profound racial inequities in
Association’s Pro Bono Publico Award for his legal
communities and cultivate community leaders and
service to the poor and disadvantaged. He was also
community-led solutions that support educated kids,
one of the youngest lawyers, at age 26, to argue and
healthy kids and economically secure families.
win a major case before the Louisiana Supreme Court.
Prior to becoming the first African American president
As a professor, Morial served on the adjunct faculty
and CEO to lead the foundation in its 84 year history,
of Xavier University in Louisiana, where he taught
she served in a variety of positions at the Kellogg
Constitutional Law and Business Law.
Foundation after joining the organization as the
controller in 1987. Most recently, she was the executive
As a Louisiana state senator, Morial was named
vice president of operations and treasurer, which
Legislative Rookie of the Year, Education Senator of
included oversight of all financial plans, policies
the Year, and Environmental Senator of the Year, while
and relationships within the financial community
authoring laws on a wide range of important subjects.
and WKKF’s Technology, Human Resources and
Administration, Finance, Program Services and Quality
A graduate of the University of Pennsylvania
& Organizational Effectiveness functions. In this
with a degree in Economics and African American
role, she was pivotal in connecting and integrating
Studies, he also holds a law degree from the
WKKF’s leadership committees: the Executive
Georgetown University Law Center in Washington, DC,
Council, Program Leadership Council, Talent Board
as well as numerous honorary degrees including Xavier
and Organizational Advisory Team, ensuring unified
University and Howard University.
execution of the organization’s mission and strategic
Under appointment by President Obama, Morial has
served as Chair of the Census Advisory Committee,
a member of the President’s Advisory Council on
Financial Capability, and on the Department of
Education’s Equity and Excellence Commission. He was
framework across all programmatic and priority place
areas. She also provided leadership for WKKF’s placebased grantmaking in Mississippi and New Orleans
since 2011, launching a significant effort to help set
young males of color on the path to success in 2013.
also appointed to the Twenty-First Century Workforce
Tabron has played an active leadership role in the
Commission by President Bill Clinton.
Kellogg Foundation’s racial equity, diversity and
Morial has been recognized as one of the 100 Most
Influential Black Americans by Ebony Magazine, one of
2015 STATE OF BLACK AMERICA¨
SAVE OUR CITIES
inclusion work for more than two decades—both
internally through work with its board and staff, and
NATIONAL URBAN LEAGUE
Appendix 1 + 159
externally through its work with grantees, partners
realize their full potential in school, work and life.
and vendors.
The Kellogg Foundation is based in Battle Creek,
Other earlier positions at WKKF included: chief
Michigan, and works throughout the United States
operating officer and treasurer; senior vice president/
and internationally, as well as with sovereign tribes.
chief financial officer and treasurer; vice president—
Special emphasis is paid to priority places where there
finance and treasurer; and assistant vice president for
are high concentrations of poverty and where children
finance and assistant treasurer. Prior to joining WKKF,
face significant barriers to success. WKKF priority
she was an auditor for Plante & Moran CPAs.
places in the U.S. are in Michigan, Mississippi,
New Mexico and New Orleans; and internationally,
Throughout her more than 26 years in philanthropy,
are in Mexico and Haiti. For more information,
Tabron has participated in numerous sector efforts to
visit www.wkkf.org.
enhance philanthropy, including: the policy and annual
conference committees for the Council on Foundations
THE THREE DOCTORS
and the board development and transparency
Drs. Sampson Davis,
committees for Independent Sector.
Rameck Hunt and
George Jenkins,
As a community and civic leader, Tabron serves
known as The Three
as president of the board of the Western Michigan
Doctors, made a
University Foundation and is a member of the
pact as teenage
Kalamazoo Chapter of the Links, Incorporated. She
boys growing up on
serves on the boards of the Battle Creek Community
the tough inner-city streets of Newark: they would
Health Partners, Southwest Michigan First, Bronson
stick together, go to college, graduate, and become
Healthcare Group and the Douglass Community
doctors. Despite being surrounded by negative
Association, all in Michigan. She also serves on the
influences and having few positive role models, these
board of the Kellogg Company and the Mississippi
three men overcame countless obstacles and today
Center for Education Innovation. Tabron is also the
each proudly bear the distinction of “doctor”—serving
chair of the W.K. Kellogg Foundation Trust.
as the face of health and education for youth and
Tabron holds a bachelor’s degree in business
families across America.
administration from the University of Michigan—
Together, the doctors have authored three inspiring
Ann Arbor and a master’s degree in business
and New York Times best-selling books about
administration from the Kellogg Graduate School
their lives: The Pact (autobiography), We Beat the
of Management at Northwestern University. She
Street (children’s book), and The Bond (highlighting
also received an honorary doctorate of humane
fatherhood relationships). Dr. Davis also released a
letters from Marygrove College in Detroit. She is a
new book, Living & Dying in Brick City, which provides
certified public accountant and certified management
a rare, real-life glimpse into the inner workings of an
accountant licensed in Michigan. She is also a
urban emergency room, while offering practical health
graduate of the inaugural class of the Council on
advice for our communities. Drs. Davis, Hunt and
Foundations’ Career Pathways Program.
Jenkins also find time to give back to the community
The W.K. Kellogg Foundation (WKKF), founded in 1930
as an independent, private foundation by breakfast
cereal pioneer Will Keith Kellogg, is among the largest
philanthropic foundations in the United States. Guided
through their non-profit organization, The Three
Doctors Foundation, which has offered free health,
education and mentoring programs for youth and
families in the NY/NJ area for more than a decade.
by the belief that all children should have an equal
opportunity to thrive, WKKF works with communities
to create conditions for vulnerable children so they can
2015 STATE OF BLACK AMERICA¨
SAVE OUR CITIES
NATIONAL URBAN LEAGUE
Appendix 1 + 160
The Three Doctors have received many awards for
DR. GEORGE JENKINS
their accomplishments and leadership, including the
Dr. Jenkins is Assistant Professor of Clinical Dentistry
prestigious Essence Award and a BET Honors award.
at Columbia University. Dr. Jenkins received his
They have also been featured medical experts for
bachelor’s degree from Seton Hall University. He
CNN and the Tom Joyner Morning Show. The doctors
received his Doctor of Dental Medicine (D.M.D.) from
continue to make numerous television appearances
the University of Medicine and Dentistry of New
in support of their message of health, education and
Jersey (UMDNJ)—New Jersey Dental School, where
youth mentoring. This includes their past appearance
he also completed his General practice residency and
on the Oprah Winfrey Show, where Ms. Winfrey
Oral medicine fellowship. He is currently studying for
remarked, “You guys are bigger than rock stars…I think
his masters in healthcare administration, policy and
you guys are the premier role models of the world!”
management (MHA).
DR. SAMPSON DAVIS
Dr. Davis is a Board Certified Emergency Medicine
Physician at several emergency departments in
New Jersey. Graduating with honors, Dr. Davis received
his bachelor’s degree from Seton Hall University, his
medical degree from Robert Wood Johnson Medical
School and completed his residency in Emergency
Medicine at the same hospital where he was born,
Newark Beth Israel Medical Center. He is the youngest
physician to receive the National Medical Association’s
highest honor, The Scroll of Merit.
DR. RAMECK HUNT
Dr. Hunt is a Board Certified Internist at University
Medical Center at Princeton and Assistant Professor
of Medicine at Robert Wood Johnson Medical School.
He has also started and is the medical director of
the medical weight management program at the
University Medical Center of Princeton. Dr. Hunt
received his Bachelor of Science from Seton Hall
University, his Doctor of Medicine from Robert
Wood Johnson Medical School and completed his
residency in internal medicine at Robert Wood
Johnson University Hospital. In 2015, he received
the prestigious “Healthcare Professional of the Year
Award” from the New Jersey Hospital Association.
2015 STATE OF BLACK AMERICA¨
SAVE OUR CITIES
NATIONAL URBAN LEAGUE
Appendix 2 + 161
Index of Authors + Articles
In 1987, the National Urban League
began publishing the State of Black
America in a smaller, typeset format.
By doing so, it became easier to catalog
and archive the various essays by
author and article.
The 2015 edition of the State of Black
America is the twentieth to feature an
Index of the Authors and Articles that
have appeared since 1987. The articles
have been divided by topic and are listed
in alphabetical order by authors’ names.
Reprints of the articles cataloged herein
are available through the National Urban
League Washington Bureau, 1805 7th
Street, N.W., Washington, DC 20005.
2015 STATE OF BLACK AMERICA¨
SAVE OUR CITIES
NATIONAL URBAN LEAGUE
Appendix 2 + 162
AFFIRMATIVE ACTION
Arnwine, Barbara R., “The Battle Over Affirmative
Action: Legal Challenges and Outlook,” 2007,
pp. 159–172.
Ifill, Sherrilyn, “Standing in the Breach: The Supreme
Court and Shelby,” 2014, pp. 118–123.
Holzer, Harry J., “Reconnecting Young Black Men:
What Policies Would Help,” 2007, pp. 75–87.
Ifill, Sherrilyn, “Standing in the Breach: The Supreme
Court and Shelby,” 2014, pp. 118–123.
Lomax, Dr. Michael, “Getting Kids To and Through
College: Our Kids, Our Jobs,” 2014, pp. 142–147.
Johns, David J., “Re-Imagining Black Masculine
Identity: An Investigation of the ‘Problem’ Surrounding
the Construction of Black Masculinity in America,”
2007, pp. 59–73.
Special Section, “Affirmative Action/National Urban
League Columns and Amici Brief on the Michigan
Case,” 2003, pp. 225–268.
Johnson, Kevin M., “Real Talk: Demonstrate the
Value of Black Lives Through Quality Education,”
2015, pp. 116–120.
Tabron, La June Montgomery, “Clearing a Pathway to
Progress for All Children,” 2015, pp. 130–133.
Lanier, James R., “The Empowerment Movement and
the Black Male,” 2004, pp. 143–148.
AFTERWORD
Daniels, Lee A., “Praising the Mutilated World,” 2002,
pp. 181–188.
Jones, Stephanie J., “Women’s Voices, Women’s
Power,” 2008, pp. 203–204.
———, “The National Urban League’s Commission on
the Black Male: Renewal, Revival and Resurrection
Feasibility and Strategic Planning Study,” 2005,
pp. 107–109.
———, “The Journey Continues,” 2009, pp. 221–223.
McGhee, David, “Mentoring Matters: Why Young
Professionals and Others Must Mentor,” 2013,
pp. 162–165.
AIDS
Morial, Marc H., “Empowering Black Males to Reach
Their Full Potential,” 2007, pp. 13–15.
Rockeymoore, Maya, “AIDS in Black America and the
World,” 2002, pp. 123–146.
AN APPRECIATION
Jones, Stephanie J., “Rosa Parks: An Ordinary Woman,
An Extraordinary Life,” 2006, pp. 245–246.
National Urban League, “Ossie Davis: Still Caught in
the Dream,” 2005, pp. 137–138.
BLACK MALES
Bell, William C., “How are the Children? Foster Care
and African–American Boys,” 2007, pp. 151–157.
Bowser, Muriel E., “Answering the Call to Action,” 2015,
pp. 112–115.
Carnethon, Mercedes R., “Black Male Life Expectancy
in the United States: A Multi-Level Exploration of
Causes,” 2007, pp. 137–150.
Crump, Benjamin Lloyd, “It’s Time to Pass the Grand
Jury Reform Act of 2014,” 2015, pp. 125–129.
Davis, Sampson; Hunt, Rameck and Jenkins, George, “I
Wanna Be Like…Education, Pacts and the Potential of
Youth,” 2015, pp. 139–142.
Dyson, Eric Michael, “Sexual Fault Lines: Robbing the
Love Between Us,” 2007, pp. 229–237.
Edelman, Marian Wright, “Time to Wake Up and Act:
The State of Black America,” 2013, pp. 68–69.
Hanson, Renee, Mark McArdle, and Valerie Rawlston
Wilson, “Invisible Men: The Urgent Problems of
Low-Income African-American Males,” 2007, pp.
209–216.
Harper, Hill, “America Incarcerated: Who Pays and
Who Profits,” 2014, pp. 112–113.
2015 STATE OF BLACK AMERICA¨
SAVE OUR CITIES
Nutter, Michael A., “Black Men Are Killing Black Men.
There, I Said It.” 2012, pp. 106–109.
Reed, James, and Aaron Thomas, “The National Urban
League: The National Urban League: Empowering
Black Males to Reach Their Full Potential,” 2007,
pp. 217–218.
Rodgers III, William M., “Why Should African
Americans Care About Macroeconomic Policy,” 2007,
pp. 89–103.
Wilson, Valerie Rawlston, “On Equal Ground: Causes
and Solutions for Lower College Completion Rates
Among Black Males,” 2007, pp. 123–135.
BUSINESS
Blankfein, Lloyd, “Creating Jobs and Opportunities
Through Minority Owned Businesses,” 2012, pp. 70–73.
Bryant, John Hope, “Financial Dignity in an Economic
Age,” 2013, pp. 134–138.
Cofield, Natalie M. “What’s in it for Us? How Federal
Business Inclusion Programs and Legislation Affect
Minority Entrepreneurs,” 2011, pp. 100–109.
Emerson, Melinda F., “Five Things You Must Have to
Run a Successful Business,” 2004, pp. 153–156.
Glasgow, Douglas G., “The Black Underclass in
Perspective,” 1987, pp. 129–144.
Henderson, Lenneal J., “Empowerment through
Enterprise: African-American Business Development,”
1993, pp. 91–108.
Humphries, Frederick S., “The National Talent Strategy:
Ideas to Secure U.S. Competitiveness and Economic
Growth,” 2013, pp. 86–90.
NATIONAL URBAN LEAGUE
Appendix 2 + 163
Liggins III, Alfred C., “Successful Black Entrepreneurs
Should Not Be an Anomaly,” 2015, pp. 143–146.
Marshall, Cynthia, “Digitizing the Dream: The Role
of Technology in Empowering Communities,” 2013,
pp. 130–133.
Cox, Kenya L. Covington, “The Childcare Imbalance:
Impact on Working Opportunities for Poor Mothers,”
2003, pp. 197–224.
Dallas Highlight, “Urban Youth Empowerment
Program,” 2011, pp. 84–86.
Price, Hugh B., “Beacons in a New Millennium:
Reflections on 21st-Century Leaders and Leadership,”
2000, pp. 13–39.
Davis, Sampson; Hunt, Rameck and Jenkins, George, “I
Wanna Be Like…Education, Pacts and the Potential of
Youth,” 2015, pp. 139–142.
Tidwell, Billy J., “Black Wealth: Facts and Fiction,”
1988, pp. 193–210.
Edelman, Marian Wright, “The State of Our Children,”
2006, pp. 133–141.
Turner, Mark D., “Escaping the ‘Ghetto’ of
Subcontracting,” 2006, pp. 117–131.
———, “Losing Our Children in America’s Cradle to
Prison Pipeline,” 2007, pp. 219–227.
Walker, Juliet E.K., “The Future of Black Business
in America: Can It Get Out of the Box?,” 2000,
pp. 199–226.
———, “Time to Wake Up and Act: The State of Black
America,” 2013, pp. 68–69.
CASE STUDIES
Allen, V., Brown, L., Ray, J., Slash, J., “Preparing
Indiana’s Children for College, Work and Life—Indiana
Urban League Affiliates,” 2014, pp. 148–151.
Cleaver II, Emanuel, “Green Impact Zone of Kansas
City, MO,” 2011, pp. 88–93.
Freeman-Wilson, Karen, “A New Day, New Legacy for
Gary, Indiana,” 2015, pp. 121–124.
McConduit-Diggs, Erika, “Winning TrifE 3cta for
Community Empowerment: Education, Employment,
Entrepreneurship,” 2014, pp. 164–167.
Patrick, Deval L., “Growing an Innovative Economy in
Massachusetts,” 2011, pp. 154–158.
Shumate, Jabar, “The Affordable Care Act and How
It Can Fuel Entrepreneurism in Urban Communities,”
2014, pp. 130–133.
CHILDREN AND YOUTH
Allen, V., Brown, L., Ray, J., Slash, J., “Preparing
Indiana’s Children for College, Work and Life—Indiana
Urban League Affiliates,” 2014, pp. 148–151.
Bell, William C., “How are the Children? Foster Care
and African-American Boys,” 2007, pp. 151–157.
———, “Community Based Organizations and Child
Welfare: Building Communities of Hope,” 2013,
pp. 166–169.
Fulbright-Anderson, Karen, “Developing Our Youth:
What Works,” 1996, pp. 127–143.
García, Lily Eskelsen, “Education’s Opportunity
Dashboard,” 2015, pp. 147–150.
Hare, Bruce R., “Black Youth at Risk,” 1988, pp. 81–93.
Harris, Dot, “Diversity in STEM: An Economic
Imperative,” 2013, pp. 92–95.
Honda, Mike, “Equity and Excellence Lead to
Opportunity,” 2014, pp. 104–105.
Howard, Jeff P., “The Third Movement: Developing
Black Children for the 21st Century,” 1993, pp. 11–34.
Hrabowski III, Dr. Freeman A., “The Power of Education
to Empower Our Children,” 2013, pp. 82–85.
Humphries, Frederick S., “The National Talent Strategy:
Ideas to Secure U.S. Competitiveness and Economic
Growth,” 2013, pp. 86–90.
Johnson, Kevin M., “Real Talk: Demonstrate the
Value of Black Lives Through Quality Education,”
2015, pp. 116–120.
Kirk, Ron, “Education: The Critical Link between Trade
and Jobs,” 2013, pp. 76–80.
Knaus, Christopher B., “Still Segregated, Still Unequal:
Analyzing the Impact of No Child Left Behind on
African-American Students,” 2007, pp. 105–121.
Lomax, Dr. Michael, “Getting Kids To and Through
College: Our Kids, Our Jobs,” 2014, pp. 142–147.
Bowser, Muriel E., “Answering the Call to Action,” 2015,
pp. 112–115.
Marsalis, Wynton, “Making the Grade: Put the Arts
Back in Education,” 2014, pp. 158–163.
Bryant, John Hope, “Financial Dignity in an Economic
Age,” 2013, pp. 134–138.
McConduit-Diggs, Erika, “Winning TrifE 3cta for
Community Empowerment: Education, Employment,
Entrepreneurship,” 2014, pp. 164–167.
Burns, Ursula, “Leaving No Brains Behind,” 2014,
pp. 152–157.
Chávez, Anna Maria, “Helping Girls Make Healthy
Choices,” 2012, pp. 124–126.
Comer, James P., “Leave No Child Behind: Preparing
Today’s Youth for Tomorrow’s World,” 2005, pp. 75–84.
2015 STATE OF BLACK AMERICA¨
SAVE OUR CITIES
McGhee, David, “Mentoring Matters: Why Young
Professionals and Others Must Mentor,” 2013,
pp. 162–165.
McMurray, Georgia L., “Those of Broader Vision: An
African-American Perspective on Teenage Pregnancy
and Parenting,” 1990, pp. 195–211.
NATIONAL URBAN LEAGUE
Appendix 2 + 164
Moore, Evelyn K., “The Call: Universal Child Care,”
1996, pp. 219–244.
Watts, Vincent and White, Edith, “Project Advocate:
A Roadmap to Civic Engagement,” 2013 pp. 140–143.
Murphy, Laura, “Stop the Fast Track to Prison,” 2013,
pp. 96–100.
White, Edith and Watts, Vincent, “Project Advocate:
A Roadmap to Civic Engagement,” 2013 pp. 140–143.
Obama, Michelle, “Let’s Move Initiative on Healthier
Schools,” 2011, pp. 138–140.
Wijewardena, Madura and Kirk Clay, “Government with
the Consent of All: Redistricting Strategies for Civil
Rights Organizations,” 2011, pp. 196–201.
Shaw, Jr., Lee, “Healthy Boys Stand SCOUTStrong™,”
2012, pp. 126–128.
Scott, Kimberly A., “A Case Study: African-American
Girls and Their Families,” 2003, pp. 181–195.
Special Report. “Partnering to Empower Healthy Kids,”
2012, pp. 120–123.
Tabron, La June Montgomery, “Clearing a Pathway to
Progress for All Children,” 2015, pp. 130–133.
Williams, Terry M., and William Kornblum, “A Portrait
of Youth: Coming of Age in Harlem Public Housing,”
1991, pp. 187–207.
CIVIC ENGAGEMENT
Alton, Kimberley, “The State of Civil Rights 2008,”
2008, pp. 157–161.
Brazile, Donna, “Fallout from the Mid-Term Elections:
Making the Most of the Next Two Years,” 2011,
pp. 180–190.
Brown James, Stefanie, “Black Civic Engagement 2.0:
In with the Old, in with the New,” 2013, pp. 67–68.
Campbell, Melanie L., “Election Reform: Protecting
Our Vote from the Enemy That Never Sleeps,” 2008,
pp. 149–156.
Capehart, Jonathan, “Race Still Does Matter—A Lot,”
2013, pp. 150–153.
Chappell, Kevin, “‘Realities’ of Black America,” 2011,
pp. 192–195.
Fauntroy, Michael K., “The New Arithmetic of Black
Political Power,” 2013, pp. 154–157.
Fudge, Marcia L., “Unfinished Business,” 2013, pp. 65.
Wijewardena, Madura, “Understanding the Equality
Index,” 2012, pp. 16–19.
———, “Understanding the Equality Index,” 2013,
pp. 22–25.
Wilson, Valerie Rawlston, “Introduction to the 2011
Equality Index,” 2011, pp. 14–22.
———, “Introduction to the 2012 Equality Index,” 2012,
pp. 10–15.
———, “Introduction to the 2013 Equality Index,” 2013,
pp. 12–21.
Yearwood, Jr., Lennox,“The Rise and Fall and Rise
Again of Jim Crow Laws,” 2012, pp. 48–53.
CIVIL RIGHTS
Alton, Kimberley, “The State of Civil Rights 2008,”
2008, pp. 157–161.
Archer, Dennis W., “Security Must Never Trump
Liberty,” 2004, pp. 139–142.
Brown James, Stefanie, “Black Civic Engagement 2.0:
In with the Old, in with the New,” 2013, pp. 67–68.
Burnham, David, “The Fog of War,” 2005, pp. 123–127.
Campbell, Melanie L., “Election Reform: Protecting
Our Vote from the Enemy That Never Sleeps,” 2008,
pp. 149–156.
Chappell, Kevin, “ ‘Realities’ of Black America,” 2011,
pp. 192–195.
Edelman, Marian Wright, “Time to Wake Up and Act:
The State of Black America,” 2013, pp. 68–69.
Fudge, Marcia L., “Unfinished Business,” 2013, pp. 65.
Hardy, Chanelle P., “Introduction to Lift Ev’ry Voice:
A Special Collection of Articles and Op-Eds.,” 2013,
pp. 60–61.
Grant, Gwen, “The Fullness of Time for a More Perfect
Union: The Movement Continues,” 2009, pp. 171–177.
Holder, Jr., Eric H., “Civil Rights Enforcement in the 21st
Century,” 2013, pp. 144–148.
Hardy, Chanelle P., “Introduction to Lift Ev’ry Voice:
A Special Collection of Articles and Op-Eds.,” 2013,
pp. 60–61.
House, Tanya Clay, “The Evolving Fight to Protect the
Vote,” 2014, pp. 114–115.
Lewis, John, “New Tactics, Same Old Taint,” 2013, pp.
62–63.
Lindsay, Tiffany, “Weaving the Fabric: The Political
Activism of Young African-American Women,” 2008,
pp. 47–50.
Scott, Robert C. “Bobby,” “Minority Voter Participation:
Reviewing Past and Present Barriers to the Polls,” 2012,
pp. 44–47.
2015 STATE OF BLACK AMERICA¨
SAVE OUR CITIES
———, “Introduction to the 21 Century Agenda for Jobs
and Freedom.” 2013, pp. 102–103.
Harper, Hill, “America Incarcerated: Who Pays and
Who Profits,” 2014, pp. 112–113.
Henderson, Wade, “A Watershed Year for
Bipartisanship in Criminal Justice Reform,” 2014,
pp. 110–111.
Hernández, Rufina, “The Civil Rights Voice in Education
Reform,” 2014, pp. 138–141.
NATIONAL URBAN LEAGUE
Appendix 2 + 165
Holder, Jr., Eric H., “Civil Rights Enforcement in the 21st
Century,” 2013, pp. 144–148.
Murphy, Laura, “Stop the Fast Track to Prison,” 2013,
pp. 96–100.
Honda, Mike, “Equity and Excellence Lead to
Opportunity,” 2014, pp. 104–105.
DIVERSITY
House, Tanya Clay, “The Evolving Fight to Protect the
Vote,” 2014, pp. 114–115.
Bell, Derrick, “The Elusive Quest for Racial Justice:
The Chronicle of the Constitutional Contradiction,”
1991, pp. 9–23.
Ifill, Sherrilyn, “Standing in the Breach: The Supreme
Court and Shelby,” 2014, pp. 118–123.
Burns, Ursula, “Leaving No Brains Behind,” 2014,
pp. 152–157.
Jones, Nathaniel R., “The State of Civil Rights,” 2006,
pp. 165–170.
Capehart, Jonathan, “Race Still Does Matter—A Lot,”
2013, pp. 150–153.
———, “Did I Ever” 2009, pp. 213–219.
Chase, Debra Martin, “Creating the Change the World
Needs to See,” 2015, pp. 134–138.
Jones-DeWeever, Avis A., “The Enduring Icon: Dr.
Dorothy Height,” 2013, pp. 64.
Lewis, John, “New Tactics, Same Old Taint,” 2013,
pp. 62–63.
Mack, John W., “Reflections on National Urban
League’s Legacy and Service,” 2013, pp. 66.
Ogletree, Jr., Charles J., “Brown at 50: Considering the
Continuing Legal Struggle for Racial Justice,” 2004,
pp. 81–96.
Sebelius, Kathleen, “Affordable Health Care is a Civil
Right,” 2014, pp. 124–129.
Sharpton, Al, “Though We Have Achieved Much, the
Battle Continues,” 2013, pp. 63–64.
Shaw, Theodore M., “The State of Civil Rights,” 2007,
pp. 173–183.
Wijewardena, Madura and Kirk Clay, “Government with
the Consent of All: Redistricting Strategies for Civil
Rights Organizations,” 2011, pp. 196–201.
CRIMINAL JUSTICE
Crump, Benjamin Lloyd, “It’s Time to Pass the Grand
Jury Reform Act of 2014,” 2015, pp. 125–129.
Curry, George E., “Racial Disparities Drive Prison
Boom,” 2006, pp. 171–187.
Drucker, Ernest M., “The Impact of Mass Incarceration
on Public Health in Black Communities,” 2003, pp.
151–168.
Edelman, Marian Wright, “Losing Our Children in
America’s Cradle to Prison Pipeline,” 2007, pp.
219–227.
Cobbs, Price M., “Critical Perspectives on the
Psychology of Race,” 1988, pp. 61–70.
———, “Valuing Diversity: The Myth and the Challenge,”
1989, pp. 151–159.
Darity, Jr., William, “History, Discrimination and Racial
Inequality,” 1999, pp. 153–166.
Harris, Dot, “Diversity in STEM: An Economic
Imperative,” 2013, pp. 92–95.
Humphries, Frederick S., “The National Talent Strategy:
Ideas to Secure U.S. Competitiveness and Economic
Growth,” 2013, pp. 86–90.
Jones, Stephanie J., “Sunday Morning Apartheid: A
Diversity Study of the Sunday Morning Talk Shows,”
2006, pp. 189–228.
Liggins III, Alfred C., “Successful Black Entrepreneurs
Should Not Be an Anomaly,” 2015, pp. 143–146.
Stoute, Steve, “Tanning of America Makes Growth,
Prosperity and Empowerment Easier,” 2012, pp. 84–89.
Watson, Bernard C., “The Demographic Revolution:
Diversity in 21st-Century America,” 1992, pp. 31–59.
Wiley, Maya, “Hurricane Katrina Exposed the Face of
Diversity,” 2006, pp. 143–153.
DRUG TRADE
Lanier, James R., “The Harmful Impact of the Criminal
Justice System and War on Drugs on the AfricanAmerican Family,” 2003, pp. 169–179.
ECONOMICS
———, “Time to Wake Up and Act: The State of Black
America,” 2013, pp. 68–69.
Alexis, Marcus and Geraldine R. Henderson, “The
Economic Base of African-American Communities:
A Study of Consumption Patterns,” 1994, pp. 51–82.
Henderson, Wade, “A Watershed Year for
Bipartisanship in Criminal Justice Reform,” 2014,
pp. 110–111.
Anderson, Bernard, “Lessons Learned from the
Economic Crisis: Job Creation and Economy Recovery,”
2010, pp. 60–65.
Johnson, Kevin M., “Real Talk: Demonstrate the
Value of Black Lives Through Quality Education,”
2015, pp. 116–120.
———, “William M. Rodgers III, Lucy J. Reuben,
and Valerie Rawlston Wilson, “The New Normal?
Opportunities for Prosperity in a ‘Jobless Recovery,’”
2011, pp. 54–63.
Lanier, James R., “The Harmful Impact of the Criminal
Justice System and War on Drugs on the AfricanAmerican Family,” 2003, pp. 169–179.
2015 STATE OF BLACK AMERICA¨
SAVE OUR CITIES
NATIONAL URBAN LEAGUE
Appendix 2 + 166
Anderson, Maggie, “Facts Versus Fiction: Buying
Black as an Economic Empowerment Strategy,” 2014,
pp. 182–187.
Atlanta Highlight, “Economic Empowerment Tour,”
2011, pp. 118–120.
Baker, Donna Jones, “Driving Economic SelfSufficiency to Transform the Next Generation,” 2014,
pp. 178–181.
Bowser, Muriel E., “Answering the Call to Action,” 2015,
pp. 112–115.
Bradford, William, “Black Family Wealth in the United
States,” 2000, pp. 103–145.
———, “Money Matters: Lending Discrimination in
African-American Communities,” 1993, pp. 109–134.
Bryant, John Hope, “Financial Dignity in an Economic
Age,” 2013, pp. 134–138.
Buckner, Marland and Chanelle P. Hardy, “Leveraging
the Greening of America to Strengthen the Workforce
Development System,” 2011, pp. 76–83.
Burbridge, Lynn C., “Toward Economic Self-Sufficiency:
Independence Without Poverty,” 1993, pp. 71–90.
Cleaver II, Emanuel, “Green Impact Zone of Kansas
City, MO,” 2011, pp. 88–93.
Corbett, Keith, “Economic Innovation: Finance and
Lending Initiatives Point Paths to Prosperity for
Underserved Communities,” 2011, pp. 122–129.
Edwards, Harry, “Playoffs and Payoffs: The AfricanAmerican Athlete as an Institutional Resource,” 1994,
pp. 85–111.
Foxx, Anthony, “Civil Rights…and Lefts: Building a
Transportation System for All,” 2015 pp. 108–111.
Freeman-Wilson, Karen, “A New Day, New Legacy for
Gary, Indiana,” 2015, pp. 121–124.
Graves, Jr., Earl, “Wealth for Life,” 2009, pp. 165–170.
Hamilton, Darrick, “The Racial Composition of
American Jobs,” 2006, pp. 77–115.
Harris, Andrea, “The Subprime Wipeout: Unsustainable
Loans Erase Gains Made by African-American
Women,” 2008, pp. 125–133.
Harris, Dot, “Diversity in STEM: An Economic
Imperative,” 2013, pp. 92–95.
Henderson, Lenneal J., “Blacks, Budgets, and Taxes:
Assessing the Impact of Budget Deficit Reduction and
Tax Reform on Blacks,” 1987, pp. 75–95.
———, “Budget and Tax Strategy: Implications for
Blacks,” 1990, pp. 53–71.
———, “Public Investment for Public Good: Needs,
Benefits, and Financing Options,” 1992, pp. 213–229.
Herman, Alexis, “African-American Women and Work:
Still a Tale of Two Cities,” 2008, pp. 109–113.
2015 STATE OF BLACK AMERICA¨
SAVE OUR CITIES
Hinojosa, Ruben, “Financial Literacy: Investing to
Empower,” 2014, pp. 108–109.
Holzer, Harry J., “Reconnecting Young Black Men:
What Policies Would Help,” 2007, pp. 75–87.
Humphries, Frederick S., “The National Talent Strategy:
Ideas to Secure U.S. Competitiveness and Economic
Growth,” 2013, pp. 86–90.
Jeffries, John M., and Richard L. Schaffer, “Changes
in Economy and Labor Market Status of Black
Americans,” 1996, pp. 12–77.
Jones, Stephanie J., “The Subprime Meltdown:
Disarming the ‘Weapons of Mass Deception,’” 2009,
pp. 157–164.
Kirk, Ron, “Education: The Critical Link Between Trade
and Jobs,” 2013, pp. 76–80.
Liggins III, Alfred C., “Successful Black Entrepreneurs
Should Not Be an Anomaly,” 2015, pp. 143–146.
Malveaux, Julianne, “Shouldering the Third Burden:
The Status of African-American Women,” 2008,
pp. 75–81.
———, “The Parity Imperative: Civil Rights, Economic
Justice, and the New American Dilemma,” 1992,
pp. 281–303.
McConduit-Diggs, Erika, “Winning TrifE3cta for
Community Empowerment: Education, Employment,
Entrepreneurship,” 2014, pp. 164–167.
Mensah, Lisa, “Putting Homeownership Back Within
Our Reach,” 2008, pp. 135–142.
Morial, Marc H. and Marvin Owens, “The National
Urban League Economic Empowerment Initiative,”
2005, pp. 111–113.
Myers, Jr., Samuel L., “African-American Economic
Well-Being During the Boom and Bust,” 2004,
pp. 53–80.
National Urban League, “The National Urban League’s
Homebuyer’s Bill of Rights,” 2008, pp. 143–147.
National Urban League Research Staff, “African
Americans in Profile: Selected Demographic, Social
and Economic Data,” 1992, pp. 309–325.
———, “The Economic Status of African Americans
During the Reagan-Bush Era Withered Opportunities,
Limited Outcomes, and Uncertain Outlook,” 1993,
pp. 135–200.
———, “The Economic Status of African Americans:
Limited Ownership and Persistent Inequality,” 1992,
pp. 61–117.
———, “The Economic Status of African Americans:
‘Permanent’ Poverty and Inequality,” 1991, pp. 25–75.
———, “Economic Status of Black Americans During
the 1980s: A Decade of Limited Progress,” 1990,
pp. 25–52.
NATIONAL URBAN LEAGUE
Appendix 2 + 167
———, “Economic Status of Black Americans,” 1989,
pp. 9–39.
———, “Economic Status of Black 1987,” 1988,
pp. 129–152.
———, “Economic Status of Blacks 1986,” 1987,
pp. 49–73.
Patrick, Deval L., “Growing an Innovative Economy
in Massachusetts,” 2011, pp. 154–158.
Pinkett, Dr. Randal, Robinson, Dr. Jeffrey,
“Entrepreneurship and Economic Development,” 2014,
pp. 174–177.
Reuben, Lucy J., “Make Room for the New ‘She’EOs:
An Analysis of Businesses Owned by Black Females,”
2008, pp. 115–124.
Webb, Michael B., “Programs for Progress and
Empowerment: The Urban League’s National Education
Initiative,” 1993, pp. 203–216.
EDUCATION
Allen, V., Brown, L., Ray, J., Slash, J., “Preparing
Indiana’s Children for College, Work and Life—Indiana
Urban League Affiliates,” 2014, pp. 148–151.
Allen, Walter R., “The Struggle Continues: Race, Equity
and Affirmative Action in U.S. Higher Education,” 2001,
pp. 87–100.
Bailey, Deirdre, “School Choice: The Option of
Success,” 2001, pp. 101–114.
Bowser, Muriel E., “Answering the Call to Action,” 2015,
pp. 112–115.
Richardson, Cy, “What Must Be Done: The Case
for More Homeownership and Financial Education
Counseling,” 2009, pp. 145–155.
Bradford, William D., “Dollars for Deeds: Prospects
and Prescriptions for African-American Financial
Institutions,” 1994, pp. 31–50.
Rivlin, Alice M., “Pay Now or Pay Later: Jobs, Fiscal
Responsibility and the Future of Black America,” 2011,
pp. 202–206.
Burns, Ursula, “Leaving No Brains Behind,” 2014,
pp. 152–157.
Rodgers III, William, M., “Why Should African
Americans Care About Macroeconomic Policy,” 2007,
pp. 89–103.
Shapiro, Thomas M., “The Racial Wealth Gap,” 2005,
pp. 41–48.
———, “Policies of Exclusion Perpetuate the Racial
Wealth Gap” 2014, pp. 106–107.
Sharpe, Rhonda, “Preparing a Diverse and Competitive
STEM Workforce,” 2011, pp. 142–152.
Shepherd, Dr. J. Marshall, “21st Century Jobs and
Climate Change: A Curse and Blessing for African
Americans,” 2014, pp. 168–173.
Shumate, Jabar, “The Affordable Care Act and How
It Can Fuel Entrepreneurism in Urban Communities,”
2014, pp. 130–133.
Spriggs, William, “Nothing Trickled Down: Why
Reaganomics Failed America,” 2009, pp. 123–133.
Stoute, Steve, “Tanning of America Makes Growth,
Prosperity and Empowerment Easier,” 2012, pp. 84–89.
Taylor, Robert D., “Wealth Creation: The Next
Leadership Challenge,” 2005, pp. 119–122.
Thompson, J. Phil, “The Coming Green Economy,”
2009, pp. 135–142.
Tidwell, Billy J., “Economic Costs of American Racism,”
1991, pp. 219–232.
Turner, Mark D., “Escaping the ‘Ghetto’ of
Subcontracting,” 2006, pp. 117–131.
Watkins, Celeste, “The Socio-Economic Divide Among
Black Americans Under 35,” 2001, pp. 67–85.
2015 STATE OF BLACK AMERICA¨
SAVE OUR CITIES
Bush, Esther and Stokes, Patricia, “The Equity and
Excellence Project: Community-Driven Education
Reform,” 2013, pp. 70–74.
Carr, Gregory E., “Sacrifice If You Must—The Reward Is
Clear,” 2012, pp. 137–139.
Chauhan, Shree, “Bringing Higher Education to the
Masses: A Conversation with Coursera Co-Founder
Andrew Ng,” 2013, pp. 102–106.
Cole, Johnnetta Betsch, “The Triumphs and Challenges
of Historically Black Colleges and Universities,” 2008,
pp. 99–107.
Comer, James P., Norris Haynes, and Muriel HamiltonLeel, “School Power: A Model for Improving Black
Student Achievement,” 1990, pp. 225–238.
———, “Leave No Child Behind: Preparing Today’s
Youth for Tomorrow’s World,” 2005, pp. 75–84.
Davis, Sampson; Hunt, Rameck and Jenkins, George, “I
Wanna Be Like…Education, Pacts and the Potential of
Youth,” 2015, pp. 139–142.
Dilworth, Mary E. “Historically Black Colleges and
Universities: Taking Care of Home,” 1994, pp. 127–151.
Duncan, Arne, “The Path to Success for African
Americans,” 2010, pp. 92–96.
Edelman, Marian Wright, “Black Children in America,”
1989, pp. 63–76.
———, “Time to Wake Up and Act: The State of Black
America,” 2013, pp. 68–69.
Enyia, Amara, C. “College for All?” 2012, pp. 149–151.
Fattah, Chaka, “Needed: Equality in Education,” 2009,
pp. 57–60.
NATIONAL URBAN LEAGUE
Appendix 2 + 168
Freeman, Dr. Kimberly Edelin, “African-American Men
and Women in Higher Education: ‘Filling the Glass’ in
the New Millennium,” 2000, pp. 61–90.
McBay, Shirley M. “The Condition of African American
Education: Changes and Challenges,” 1992, pp. 141–156.
García, Lily Eskelsen, “Education’s Opportunity
Dashboard,” 2015, pp. 147–150.
McConduit-Diggs, Erika, “Winning TrifE3cta for
Community Empowerment: Education, Employment,
Entrepreneurship,” 2014, pp. 164–167.
Gordon, Edmund W., “The State of Education in Black
America,” 2004, pp. 97–113.
McKenzie, Floretta Dukes with Patricia Evans,
“Education Strategies for the 90s,” 1991, pp. 95–109.
Guinier, Prof. Lani, “Confirmative Action in a Multiracial
Democracy,” 2000, pp. 333–364.
Morial, Marc H. and Hal Smith, “Education is a Jobs
Issue,” 2011, pp. 130–137.
Hanson, Renee R., “A Pathway to School Readiness:
The Impact of Family on Early Childhood Education,”
2008, pp. 89–98.
Murphy, Laura, “Stop the Fast Track to Prison,” 2013,
pp. 96–100.
Hardy, Chanelle P., “Introduction: The Value of
College,” 2012, pp. 132–135.
Harris, Dot, “Diversity in STEM: An Economic
Imperative,” 2013, pp. 92–95.
Hernández, Rufina, “The Civil Rights Voice in Education
Reform,” 2014, pp. 138–141.
Patrick, Deval L., “Growing an Innovative Economy in
Massachusetts,” 2011, pp. 154–158.
Perry, Dr. Steve, “Real Reform is Getting Kids One Step
Closer to Quality Schools,” 2012, pp. 147–149.
Powell, Kevin, “Why A College Education Matters,”
2012, pp. 136–137.
Honda, Mike, “Equity and Excellence Lead to
Opportunity,” 2014, pp. 104–105.
Ransom, Tafaya and John Michael Lee, “College
Readiness and Completion for Young Men of Color,”
2012, pp. 141–147.
Hrabowski III, Dr. Freeman A., “The Power of Education
to Empower Our Children,” 2013, pp. 82–85.
Ribeau, Sidney, “Foreword: A Competitive Foundation
for the Future,” 2011, pp. 8–9.
Humphries, Frederick S., “The National Talent Strategy:
Ideas to Secure U.S. Competitiveness and Economic
Growth,” 2013, pp. 86–90.
Robinson, Sharon P., “Taking Charge: An Approach
to Making the Educational Problems of Blacks
Comprehensible and Manageable,” 1987, pp. 31–47.
IHS Global Insight, “National Urban League 2015 State
Education Equality Index,” 2015, pp. 68.
Rose, Dr. Stephanie Bell, “African-American High
Achievers: Developing Talented Leaders,” 2000,
pp. 41–60.
Jackson, John, “From Miracle to Movement: Mandating
a National Opportunity to Learn, 2009, pp. 61–70.
Jackson, Maria Rosario, “Arts, Culture, and
Communities: Do Our Neighborhoods Inspire Our
Children to Reach Higher?” 2012, pp. 153–154.
Johnson, Kevin M., “Real Talk: Demonstrate the
Value of Black Lives Through Quality Education,”
2015, pp. 116–120.
Journal of Blacks in Higher Education (reprint), “The
‘Acting White’ Myth,” 2005, pp. 115–117.
Kirk, Ron, “Education: The Critical Link between Trade
and Jobs,” 2013, pp. 76–80.
Knaus, Christopher B., “Still Segregated, Still Unequal:
Analyzing the Impact of No Child Left Behind on
African American Students,” 2007, pp. 105–121.
Legend, John, “The Show Me Campaign: A
Conversation with John Legend,” 2012, pp. 151–153.
Lomax, Dr. Michael, “Getting Kids To and Through
College: Our Kids, Our Jobs,” 2014, pp. 142–147.
Luckey, Desireé, “Communities, Schools and Families
Make the Education-Career Connection,” 2012,
pp. 139–141.
Ross, Ronald O., “Gaps, Traps and Lies: AfricanAmerican Students and Test Scores,” 2004,
pp. 157–161.
Sharpe, Rhonda, “Preparing a Diverse and Competitive
STEM Workforce,” 2011, pp. 142–152.
Smith, Hal, “The Questions Before Us: Opportunity,
Education and Equity,” 2009, pp. 45–55.
Smith, Hal, Jacqueline Ayers, and Darlene Marlin,
“Ready to Succeed: The National Urban League Project
Ready: Post-Secondary Success Program,” 2012,
pp. 114–119.
Stokes, Patricia and Bush, Esther, “The Equity and
Excellence Project: Community-Driven Education
Reform,” 2013, pp. 70–74.
Sudarkasa, Niara, “Black Enrollment in Higher
Education: The Unfulfilled led Promise of Equality,”
1988, pp. 7–22.
Tabron, La June Montgomery, “Clearing a Pathway to
Progress for All Children,” 2015, pp. 130–133.
Thornton, Alvin, “The Nation’s Higher Education
Agenda: The Continuing Role of HBCUs,” 2011,
pp. 160–167.
Marsalis, Wynton, “Making the Grade: Put the Arts
Back in Education,” 2014, pp. 158–163.
2015 STATE OF BLACK AMERICA¨
SAVE OUR CITIES
NATIONAL URBAN LEAGUE
Appendix 2 + 169
Watson, Bernard C., with Fasaha M. Traylor,
“Tomorrow’s Teachers: Who Will They Be, What Will
They Know?” 1988, pp. 23–37.
Darity, Jr., William M., and Samuel L. Myers, Jr., “Racial
Earnings Inequality into the 21st Century,” 1992,
pp. 119–139.
Willie, Charles V., “The Future of School
Desegregation,” 1987, pp. 37–47.
Dodd, Christopher, “Infrastructure as a Job Creation
Mechanism,” 2009, pp. 101–108.
Wilson, Reginald, “Black Higher Education: Crisis and
Promise,” 1989, pp. 121–135.
Gillibrand, Kirsten, “A Dream Not Deferred,” 2012,
pp. 60–63.
Wilson, Valerie Rawlston, “On Equal Ground: Causes
and Solutions for Lower College Completion Rates
Among Black Males,” 2007, pp. 123–135.
Hamilton, Darrick, “The Racial Composition of
American Jobs,” 2006, pp. 77–115.
———, “Introduction to the 2011 Equality Index,” 2011,
pp. 14–22.
Wirschem, David, “Community Mobilization for
Education in Rochester, New York: A Case Study,” 1991,
pp. 243–248.
Hammond, Theresa A., “African Americans in WhiteCollar Professions,” 2002, pp. 109–121.
Herman, Alexis, “African-American Women and Work:
Still a Tale of Two Cities,” 2008, pp. 109–113.
EMERGING IDEAS
Marshall, Cynthia, “Digitizing the Dream: The Role
of Technology in Empowering Communities,” 2013,
pp. 130–133.
Clyburn, Mignon, “Challenges and Opportunities for
African Americans In Communications Technology,”
2014, pp. 192–195.
McConduit-Diggs, Erika, “Winning TrifE3cta for
Community Empowerment: Education, Employment,
Entrepreneurship,” 2014, pp. 164–167.
Huggins, Sheryl, “The Rules of the Game,” 2001, pp.
65–66.
Morial, Marc H. and Hal Smith, “Education is a Jobs
Issue,” 2011, pp. 130–137.
Shepherd, Dr. J. Marshall, “21st Century Jobs and
Climate Change: A Curse and Blessing for African
Americans,” 2014, pp. 168–173.
National Urban League, “12 Point Urban Jobs Plan,”
2011, pp. 46–52.
Shumate, Jabar, “The Affordable Care Act and How
It Can Fuel Entrepreneurism in Urban Communities,”
2014, pp. 130–133.
EMPLOYMENT
Anderson, Bernard E., “The Black Worker: Continuing
Quest for Economic Parity, 2002, pp. 51–67.
———, “William M. Rodgers III, Lucy J. Reuben,
and Valerie Rawlston Wilson, “The New Normal?
Opportunities for Prosperity in a ‘Jobless Recovery,’”
2011, pp. 54–63.
National Urban League Policy Institute, “Where Do
We Go From Here? Projected Employment Growth
Industries and Occupations,” 2011, pp. 64–75.
———, The National Urban League 8-Point Education
and Employment Plan: Employment and Education
Empower the Nation, 2012, pp. 54–59.
Nightingale, Demetra S., “Intermediaries in the
Workforce Development System,” 2010, pp. 84–91.
Patrick, Deval L., “Growing an Innovative Economy in
Massachusetts,” 2011, pp. 154–158.
Atlanta Highlight, “Economic Empowerment Tour,”
2011, pp. 118–120.
Reuben, Lucy J., “Make Room for the New ‘She’EOs:
An Analysis of Businesses Owned by Black Females,”
2008, pp. 115–124.
Baker, Donna Jones, “Driving Economic SelfSufficiency to Transform the Next Generation,” 2014,
pp. 178–181.
Rivlin, Alice M., “Pay Now or Pay Later: Jobs, Fiscal
Responsibility and the Future of Black America,” 2011,
pp. 202–206.
Bowser, Muriel E., “Answering the Call to Action,” 2015,
pp. 112–115.
Rodgers, William, “Why Reduce African-American
Male Unemployment?,” 2009, pp. 109–121.
Burns, Ursula, “Leaving No Brains Behind,” 2014,
pp. 152–157.
Sharpe, Rhonda, “Preparing a Diverse and Competitive
STEM Workforce,” 2011, pp. 142–152.
Cleaver II, Emanuel, “Green Impact Zone of Kansas
City, MO,” 2011, pp. 88–93.
Shepherd, Dr. J. Marshall, “21st Century Jobs and
Climate Change: A Curse and Blessing for African
Americans,” 2014, pp. 168–173.
Coulter, Patricia, “Small Business Growth = Job
Growth,” 2010, pp. 118–124.
Dallas Highlight, “Urban Youth Empowerment
Program,” 2011, pp. 84–86.
2015 STATE OF BLACK AMERICA¨
SAVE OUR CITIES
Solis, Hilda, “Creating Good Jobs for Everyone,” 2010,
pp. 66–72.
Taylor, Barton, “Opening New Doors Through
Volunteerism,” 2010, pp. 126–131.
NATIONAL URBAN LEAGUE
Appendix 2 + 170
Thomas, Jr., R. Roosevelt, “Managing Employee
Diversity: An Assessment,” 1991, pp. 145–154.
Tidwell, Billy, J., “Parity Progress and Prospects:
Racial Inequalities in Economic Well-Being,” 2000,
pp. 287–316.
Raines, Franklin D., “What Equality Would Look Like:
Reflections on the Past, Present and Future, 2002,
pp. 13–27.
Shapiro, Dr. Thomas, “Policies of Exclusion Perpetuate
the Racial Wealth Gap” 2014, pp. 106–107.
———, “African Americans and the 21st-Century Labor
Market: Improving the Fit,” 1993, pp. 35–57.
Sharpton, Al, “Though We Have Achieved Much, the
Battle Continues,” 2013, pp. 63–64.
———, “The Unemployment Experience of African
Americans: Some Important Correlates and
Consequences,” 1990, pp. 213–223.
Tabron, La June Montgomery, “Clearing a Pathway to
Progress for All Children,” 2015, pp. 130–133.
———, “A Profile of the Black Unemployed,” 1987,
pp. 223–237.
Wilkins, Ray, “Jobs, the Internet, and Our Exciting
Future,” 2011, pp. 94–99.
Wilson, Valerie Rawlston, “Introduction to the 2011
Equality Index,” 2011, pp. 14–22.
ENVIRONMENT
Buckner, Marland and Chanelle P. Hardy, “Leveraging
the Greening of America to Strengthen the Workforce
Development System,” 2011, pp. 76–83.
Cleaver II, Emanuel, “Green Impact Zone of Kansas
City, MO,” 2011, pp. 88–93.
McDuffie, Brenda, “The Strategic Alliances for
Addressing the Skills Gap: The Buffalo Urban League
Green Jobs Construction Training Program,” 2013,
pp. 158–161.
Brown, Alvin, “Commentary on the Jacksonville
Equality Index,” 2014, pp. 71–72.
Christopher, Gail, “Commentary on 2013 Black–White
Equality Index: Mobilizing our Nation toward Racial
Healing and Equity,” 2013, pp. 28–29.
Global Insight, Inc., “The National Urban League
Equality Index,” 2004, pp. 15–34.
———, “The National Urban League Equality Index,”
2005, pp. 15–40.
———, “The National Urban League Equality Index,”
2010, pp. 18–39.
———, “The National Urban League 2012 Equality
Index,” 2012, pp. 20–43.
Hancock, Michael, “Commentary on the Denver
Equality Index,” 2014, pp. 66–67.
IHS Global Insight, “The National Urban League 2013
1963 to Now Equality Index,” 2013, pp. 26–27.
EQUALITY
Capehart, Jonathan, “Race Still Does Matter—A Lot,”
2013, pp. 150–153.
Edelman, Marian Wright, “Time to Wake Up and Act:
The State of Black America,” 2013, pp. 68–69.
Fudge, Marcia L., “Unfinished Business,” 2013, pp. 65.
García, Lily Eskelsen, “Education’s Opportunity
Dashboard,” 2015, pp. 147–150.
Hardy, Chanelle P., “Introduction to Lift Ev’ry Voice:
A Special Collection of Articles and Op-Eds.,” 2013,
pp. 60–61.
Holder, Jr., Eric H., “Civil Rights Enforcement in the
21st Century,” 2013, pp. 144–148.
House, Tanya Clay, “The Evolving Fight to Protect the
Vote,” 2014, pp. 114–115.
Ifill, Sherrilyn, “Standing in the Breach: The Supreme
Court and Shelby,” 2014, pp. 118–123.
Jones-DeWeever, Avis A., “The Enduring Icon:
Dr. Dorothy Height,” 2013, pp. 64.
Lewis, John, “New Tactics, Same Old Taint,” 2013,
pp. 62–63.
Mack, John W., “Reflections on National Urban
League’s Legacy and Service,” 2013, pp. 66.
2015 STATE OF BLACK AMERICA¨
EQUALITY INDEX
SAVE OUR CITIES
———, “The National Urban League 2013 Black–White
Equality Index,” 2013, pp. 32–43.
———, “The National Urban League 2013 Hispanic–
White Equality Index,” 2013, pp. 46–57.
———, “The National Urban League 2014 Equality
Index,” 2014, pp. 28–61.
———, “The National Urban League 2014 Black–White
Equality Index,” 2014, pp. 26–45.
———, “The National Urban League 2014 Hispanic–
White Equality Index,” 2014, pp. 46–61.
———, “The National Urban League 2014 Metropolitan
Areas Index,” 2014 pp. 62–99.
IHS Global Insight, Inc., “The National Urban League
2015 Equality Index,” 2015, pp. 14–28.
———, “The National Urban League 2015 Equality
Index: Black-White,” 2015, pp. 35–47
———, “Metro Area Black-White Unemployment
Equality,” 2015, pp. 48–49.
———, “Metro Area Black-White Income Equality,”
2015, pp. 50–51.
———, “The National Urban League 2015 Equality
Index: Hispanic–White,” 2015, pp. 52–53.
NATIONAL URBAN LEAGUE
Appendix 2 + 171
———, “Metro Area Hispanic-White Unemployment
Equality,” 2015, pp. 64–65.
———, “Metro Area Black-White Income Equality,”
2015, pp. 66–67.
———, “National Urban League 2015 State Education
Equality Index,” 2015, pp. 68–107.
Murguía, Janet, “Commentary on 2013 Hispanic–White
Equality Index: Partners in a Shared Plight,” 2013,
pp. 44–45.
powell, john a., “Commentary on 2013 Black–White
Equality Index: A Theory of Change,” 2013, pp. 30–31.
Rawlings-Blake, Stephanie, “Commentary on the
Baltimore Equality Index,” 2014, pp. 62–63.
Thompson, Rondel and Sophia Parker of Global Insight,
Inc., The National Urban League Equality Index, 2006,
pp. 13–60.
Thompson, Rondel and Sophia Parker of Global Insight,
Inc., The National Urban League Equality Index, 2007
pp. 17–58.
Wharton, AC, “Commentary on the Memphis Equality
Index,” 2014, pp. 74–75.
Wijewardena, Madura, “Understanding the Equality
Index,” 2013, pp. 22–25.
Wilson, Valerie Rawlston, “The National Urban League
2008 Equality Index: Analysis,” 2008, pp. 15–24.
———, “The National Urban League 2008 Equality
Index,” 2009, pp. 15–24.
———, “Introduction to the 2013 Equality Index,” 2013,
pp. 12–21.
———, “Introduction to the 2015 Equality Index,” 2015,
pp. 14–28.
———, “Understanding the 2015 Equality Index,” 2015,
pp. 29–34.
FAMILIES
Anderson, Maggie, “Facts Versus Fiction: Buying
Black as an Economic Empowerment Strategy,” 2014,
pp. 182–187.
Battle, Juan, Cathy J. Cohen, Angelique Harris, and
Beth E. Richie, “We Are Family: Embracing Our
Lesbian, Gay, Bisexual, and Transgender (LGBT) Family
Members,” 2003, pp. 93–106.
Bell, William C., “Community Based Organizations and
Child Welfare: Building Communities of Hope,” 2013,
pp. 166–169.
Billingsley, Andrew, “Black Families in a Changing
Society,” 1987, pp. 97–111.
Drucker, Ernest M., “The Impact of Mass Incarceration
on Public Health in Black Communities,” 2003,
pp. 151–168.
Dyson, Eric Michael, “Sexual Fault Lines: Robbing the
Love Between Us,” 2007, pp. 229–237.
Hanson, Renee R., “A Pathway to School Readiness:
The Impact of Family on Early Childhood Education,”
2008, pp. 89–98.
Hill, Robert B., “Critical Issues for Black Families by the
Year 2000,” 1989, pp. 41–61.
———, “The Strengths of Black Families’ Revisited,”
2003, pp. 107–149.
Ivory, Steven, “Universal Fatherhood: Black Men
Sharing the Load,” 2007, pp. 243–247.
Lorain County Highlight, “Save Our Sons,” 2011,
pp. 176–178.
Rawlston, Valerie A., “The Impact of Social Security on
Child Poverty,” 2000, pp. 317–331.
Scott, Kimberly A., “A Case Study: African-American
Girls and Their Families,” 2003, pp. 181–195.
Shapiro, Thomas M., “The Racial Wealth Gap,” 2005,
pp. 41–48.
Stafford, Walter, Angela Dews, Melissa Mendez, and
Diana Salas, “Race, Gender and Welfare Reform:
The Need for Targeted Support,” 2003, pp. 41–92.
Stockard, Jr., Russell L. and M. Belinda Tucker, “Young
African-American Men and Women: Separate Paths?,”
2001, pp. 143–159.
Teele, James E., “E. Franklin Frazier: The Man and His
Intellectual Legacy,” 2003, pp. 29–40.
Thompson, Dr. Linda S. and Georgene Butler, “The
Role of the Black Family in Promoting Healthy Child
Development,” 2000, pp. 227–241.
West, Carolyn M., “Feminism is a Black Thing?”:
Feminist Contribution to Black Family Life, 2003,
pp. 13–27.
Willie, Charles V. “The Black Family: Striving Toward
Freedom,” 1988, pp. 71–80.
FOREWORD
Height, Dorothy I., “Awakenings,” 2008, pp. 9–10.
Obama, Barack, Foreword, 2007, pp. 9–12.
King III, Martin Luther, Foreword, 2009, pp. 9–10.
Ribeau, Sidney, “A Competitive Foundation for the
Future,” 2011, pp. 8–9.
FROM THE PRESIDENT’S DESK
———, “Understanding African-American Family
Diversity,” 1990, pp. 85–108.
Morial, Marc H., “The State of Black America: The
Complexity of Black Progress,” 2004, pp. 11–14.
Cox, Kenya L. Covington, “The Childcare Imbalance:
Impact on Working Opportunities for Poor Mothers,”
2003, pp. 197–224.
———, “The State of Black America 2012: Occupy the
Vote to Educate, Employ & Empower,” 2012, pp. 6–9.
2015 STATE OF BLACK AMERICA¨
SAVE OUR CITIES
NATIONAL URBAN LEAGUE
Appendix 2 + 172
———, “The State of Black America: Prescriptions for
Change,” 2005, pp. 11–14.
——— and Lisa Bland Malone, “Healthy Housing,” 2009,
pp. 87–98.
———, “The National Urban League Opportunity
Compact,” 2006, pp. 9–11.
Nobles, Wade W., and Lawford L. Goddard, “Drugs in
the African-American Community: A Clear and Present
Danger,” 1989, pp. 161–181.
———, “Empowering Black Males to Reach Their Full
Potential,” 2007, pp. 13–15.
———, From the President’s Desk, 2008, pp. 11–14.
———, From the President’s Desk, 2009, pp. 11–13.
———, From the President’s Desk, 2010, pp. 6–7.
———, From the President’s Desk, 2011, pp. 10–12.
———, From the President’s Desk, 2012, pp. 6–9.
———, From the President’s Desk, 2013, pp. 8–11.
———, From the President’s Desk, 2014, pp. 8–13.
———, From the President’s Desk, 2015, pp. 8–13.
HEALTH
Browne, Doris, “The Impact of Health Disparities in
African-American Women,” 2008, pp. 163–171.
Carnethon, Mercedes R., “Black Male Life Expectancy
in the United States: A Multi-Level Exploration of
Causes,” 2007, pp. 137–150.
Chávez, Anna Maria “Helping Girls Make Healthy
Choices,” 2012, pp. 124–126.
Christensen, Donna, “A Healthier Nation,” 2014,
pp. 115–117.
Christmas, June Jackson, “The Health of African
Americans: Progress Toward Healthy People 2000,”
1996, pp. 95–126.
Cooper, Maudine R., “The Invisibility Blues’ of Black
Women in America,” 2008, pp. 83–87.
Gaskin, Darrell, “Improving African Americans Access
to Quality Healthcare,” 2009, pp. 73–86.
Gaskins, Darrell J., LaVeist, Thomas A. and Richard,
Patrick, “The State of Urban Health: Eliminating Health
Disparities to Save Lives and Cut Costs,” 2013,
pp. 108–128.
Hamilton, Darrick, Goldsmith, Arthur H., and Darity,
William, “An Alternative ‘Public Option’,” 2010,
pp. 98–110.
Johnston, Haile, and Tatiana Garcia-Granados,
“Common Market: The New Black Farmer,” 2012,
pp. 100–105.
Leffall, Jr., LaSalle D., “Health Status of Black
Americans,” 1990, pp. 121–142.
Lorain County Highlight, “Save Our Sons,” 2011,
pp. 176–178.
McAlpine, Robert, “Toward Development of a National
Drug Control Strategy,” 1991, pp. 233–241.
Morris, Eboni D., “By the Numbers: Uninsured AfricanAmerican Women,” 2008, pp. 173–177.
2015 STATE OF BLACK AMERICA¨
SAVE OUR CITIES
Obama, Michelle, “Let’s Move Initiative on Healthier
Schools,” 2011, pp. 138–140.
Patrick, Deval L., “Growing an Innovative Economy in
Massachusetts,” 2011, pp. 154–158.
Primm, Annelle and Marisela B. Gomez, “The Impact of
Mental Health on Chronic Disease,” 2005, pp. 63–73.
Primm, Beny J., “AIDS: A Special Report,” 1987,
pp. 159–166.
———, “Drug Use: Special Implications for Black
America,” 1987, pp. 145–158.
Ribeau, Sidney, “Foreword: A Competitive Foundation
for the Future,” 2011, pp. 8–9.
Richard, Patrick, Gaskins, Darrell J. and LaVeist,
Thomas A., “The State of Urban Health: Eliminating
Health Disparities to Save Lives and Cut Costs,” 2013,
pp. 108–128.
Sebelius, Kathleen, “Affordable Health Care is a Civil
Right,” 2014, pp. 124–129.
Shaw, Jr., Lee, “Healthy Boys Stand SCOUTStrong™,”
2012, pp. 126–128.
Shumate, Jabar, “The Affordable Care Act and How
It Can Fuel Entrepreneurism in Urban Communities,”
2014, pp. 130–133.
Smedley, Brian D., “In the Wake of National Health
Reform: Will the Affordable Care Act Eliminate Health
Inequities?” 2011, pp. 168–175.
———, “Race, Poverty, and Healthcare Disparities,”
2006, pp. 155–164.
Watson, Elnora, “Urban League of Hudson County
(ULOHC) Health Care Initiatives in a ‘Sankofa’
Moment,” 2014, pp. 134–137.
Williams, David R., “Health and the Quality of Life
Among African Americans,” 2004, pp. 115–138.
Wilson, Valerie Rawlston, “Introduction to the 2011
Equality Index,” 2011, pp. 14–22.
———, “Introduction to the 2012 Equality Index,” 2012,
pp. 10–15.
Wijewardena, Madura ,“Understanding the Equality
Index,” 2012, pp. 16–19.
HIGHLIGHTS
Allen, V., Brown, L., Ray, J., Slash, J., “Preparing
Indiana’s Children for College, Work and Life—Indiana
Urban League Affiliates,” 2014, pp. 148–151.
Atlanta, “Economic Empowerment Tour,” 2011,
pp. 118–120.
NATIONAL URBAN LEAGUE
Appendix 2 + 173
Braswell, Allie L., and James T. McLawhorn, Jr., “A Call
to Advocate for America’s Military Veterans,” 2012,
pp. 94–99.
Harris, Andrea, “The Subprime Wipeout: Unsustainable
Loans Erase Gains Made by African-American
Women,” 2008, pp. 125–133.
Buffalo, McDuffie, Brenda, “The Strategic Alliances for
Addressing the Skills Gap: The Buffalo Urban League
Green Jobs Construction Training Program,” 2013,
pp. 158–161.
James, Angela, “Black Homeownership: Housing and
Black Americans Under 35,” 2001, pp. 115–129.
Dallas, “Urban Youth Empowerment Program,” 2011,
pp. 84–86.
Greater Stark County, Watts, Vincent and White, Edith,
“Project Advocate: A Roadmap to Civic Engagement,”
2013 pp. 140–143.
Hampton Roads, White, Edith and Watts, Vincent,
“Project Advocate: A Roadmap to Civic Engagement,”
2013 pp. 140–143.
Lorain County, “Save Our Sons,” 2011, pp. 176–178.
McConduit-Diggs, Erika, “Winning TrifE3cta for
Community Empowerment: Education, Employment,
Entrepreneurship,” 2014, pp. 164–167.
Middle Tennessee, Stokes, Patricia and Bush, Esther,
“The Equity and Excellence Project: Community-Driven
Education Reform,” 2013, pp. 70–74.
Obama, Michelle, “Let’s Move Initiative on Healthier
Schools,” 2011, pp. 138–140.
Pittsburgh, Bush, Esther and Stokes, Patricia, “The
Equity and Excellence Project: Community-Driven
Education Reform,” 2013, pp. 70–74.
Rollins, Nolan V., “The Economic Winds of Change:
New Markets for an Old Problem,” 2012, pp. 90–93.
Runner, Shari, “Inspiring Innovation: The Chicago
Urban League Youth Investor/Entrepreneurs Project
(YIEP),” 2012, pp. 110–113.
Watson, Elnora, “Urban League of Hudson County
(ULOHC) Health Care Initiatives in a ‘Sankofa’
Moment,” 2014, pp. 134–137.
HOUSING
Calmore, John O., “To Make Wrong Right: The
Necessary and Proper Aspirations of Fair Housing,”
1989, pp. 77–109.
Clay, Phillip, “Housing Opportunity: A Dream
Deferred,” 1990, pp. 73–84.
Cooper, Maudine R., “The Invisibility Blues’ of Black
Women in America,” 2008, pp. 83–87.
Corbett, Keith, “Economic Innovation: Finance and
Lending Initiatives Point Paths to Prosperity for
Underserved Communities,” 2011, pp. 122–129.
Freeman, Lance, “Black Homeownership: A Dream No
Longer Deferred?,” 2006, pp. 63–75.
Jones, Stephanie J., “The Subprime Meltdown:
Disarming the ‘Weapons of Mass Deception,’” 2009,
pp. 157–164.
Leigh, Wilhelmina A., “U.S. Housing Policy in 1996: The
Outlook for Black Americans,” 1996, pp. 188–218.
Morris, Eboni and Lisa Bland Malone, “Healthy
Housing,” 2009, pp. 87–98.
Richardson, Cy, “What Must Be Done: The Case
for More Homeownership and Financial Education
Counseling,” 2009, pp. 145–155.
——— and Garrick Davis, “Rescue: The Case for
Keeping Families in Their Homes by Confronting the
Foreclosure Crisis,” 2011, pp. 110–117.
Shapiro, Dr. Thomas, “Policies of Exclusion Perpetuate
the Racial Wealth Gap” 2014, pp. 106–107.
Spriggs, William, “Nothing Trickled Down: Why
Reaganomics Failed America,” 2009, pp. 123–133.
Wilson, Valerie Rawlston, “Introduction to the 2011
Equality Index,” 2011, pp. 14–22.
IN MEMORIAM
National Urban League, “William A. Bootle, Ray
Charles, Margo T. Clarke, Ossie Davis, Herman C.
Ewing, James Forman, Joanne Grant, Ann Kheel,
Memphis Norman, Max Schmeling,” 2005, pp. 139–152.
———, “Renaldo Benson, Shirley Chisholm, Johnnie
Cochran, Jr., Shirley Horn, John H. Johnson, Vivian
Malone Jones, Brock Peters, Richard Pryor, Bobby
Short, C. Delores Tucker, August Wilson, Luther
Vandross, and NUL members Clarence Lyle Barney, Jr.,
Manuel Augustus Romero;” 2006, pp. 279–287.
———, “Ossie Davis: Still Caught in the Dream,” 2005,
pp. 137–138.
———, “Ed Bradley, James Brown, Bebe Moore
Campbell, Katherine Dunham, Mike Evans, Coretta
Scott King, Gerald Levert, Gordon Parks, June Pointer,
Lou Rawls, and Helen E. Harden,” 2007, pp. 249–257.
———, “Effi Barry, Jane Bolin, Daniel A. Collins (NUL
Member), Oliver Hill, Yolanda King, Calvin Lockhart,
Mahlon Puryear (NUL Member), Max Roach, Eddie
Robinson, William Simms (NUL Member), Darryl
Stingley, and Ike Turner,” 2008, pp. 205–217.
———, In Memoriam, 2009, pp. 225–241.
Jones, Stephanie J., “Rosa Parks: An Ordinary Woman,
An Extraordinary Life,” 2006, pp. 245–246.
———, “Housing in the Post-Bubble Economy,” 2010,
pp. 74–83.
2015 STATE OF BLACK AMERICA¨
SAVE OUR CITIES
NATIONAL URBAN LEAGUE
Appendix 2 + 174
MILITARY AFFAIRS
Braswell, Allie L., and James T. McLawhorn, Jr., “A Call
to Advocate for America’s Military Veterans,” 2012,
pp. 94–99.
Jones, Nathaniel R., “Did I Ever? Yes I Did,” 2009,
pp. 213–219.
Journal of Blacks in Higher Education (reprint),
“The ‘Acting White’ Myth,” 2005, pp. 115–117.
Butler, John Sibley, “African Americans and the
American Military,” 2002, pp. 93–107.
Kirk, Ron, “Education: The Critical Link between Trade
and Jobs,” 2013, pp. 76–80.
MUSIC
Lanier, James R., “The Empowerment Movement and
the Black Male,” 2004, pp. 143–148.
Boles, Mark A., “Breaking the ‘Hip Hop’ Hold: Looking
Beyond the Media Hype,” 2007, pp. 239–241.
Brown, David W., “Their Characteristic Music: Thoughts
on Rap Music and Hip-Hop Culture,” 2001, pp. 189–201.
Bynoe, Yvonne, “The Roots of Rap Music and Hip-Hop
Culture: One Perspective,” 2001, pp. 175–187.
Marsalis, Wynton, “Making the Grade: Put the Arts
Back in Education,” 2014, pp. 158–163.
OP-ED/COMMENTARY
Archer, Dennis W., “Security Must Never Trump
Liberty,” 2004, pp. 139–142.
Bailey, Moya, “Going in Circles: The Struggle to
Diversify Popular Images of Black Women,” 2008,
pp. 193–196.
Lee, Barbara, “President Obama and the CBC:
Speaking with One Voice,” 2009, pp. 193–197.
Lewis, John, “New Tactics, Same Old Taint,” 2013,
pp. 62–63.
Lindsay, Tiffany, “Weaving the Fabric: the Political
Activism of Young African-American Women,” 2008,
pp. 187–192.
Malveaux, Julianne, “Black Women’s Hands Can Rock
the World: Global Involvement and Understanding,”
2008, pp. 197–202.
Rivlin, Alice M., “Pay Now or Pay Later: Jobs, Fiscal
Responsibility and the Future of Black America,” 2011,
pp. 202–206.
Bernard, Michelle, “An Ode to Black America,” 2009,
pp. 203–207.
Ross, Ronald O., “Gaps, Traps and Lies: AfricanAmerican Students and Test Scores,” 2004,
pp. 157–161.
Boles, Mark A., “Breaking the ‘Hip Hop’ Hold: Looking
Beyond the Media Hype,” 2007, pp. 239–241.
Sharpton, Al, “Though We Have Achieved Much,
the Battle Continues,” 2013, pp. 63–64.
Burnham, David, “The Fog of War,” 2005, pp. 123–127.
Taylor, Susan L., “Black Love Under Siege,” 2008
pp. 179–186.
Capehart, Jonathan, “Race Still Does Matter—A Lot,”
2013, pp. 150–153.
Chappell, Kevin, “ ‘Realities’ of Black America,” 2011,
pp. 192–195.
Cooke, Cassye, “The Game Changer: Are We Beyond
What is Next to What is Now?,” 2009, pp. 209–212.
Covington, Kenya L., “The Transformation of the
Welfare Caseload,” 2004, pp. 149–152.
Dyson, Eric Michael, “Sexual Fault Lines: Robbing the
Love Between Us,” 2007, pp. 229–237.
Edelman, Marian Wright, “Losing Our Children in
America’s Cradle to Prison Pipeline,” 2007, pp.
219–227.
Emerson, Melinda F., “Five Things You Must Have to
Run a Successful Business,” 2004, pp. 153–156.
Fauntroy, Michael K., “The New Arithmetic of Black
Political Power,” 2013, pp. 154–157.
Hardy, Chanelle P., “Introduction to Lift Ev’ry Voice:
A Special Collection of Articles and Op-Eds.,” 2013,
pp. 60–61.
Holder, Jr., Eric H., “Civil Rights Enforcement in the
21st Century,” 2013, pp. 144–148.
Ivory, Steven, “Universal Fatherhood: Black Men
Sharing the Load,” 2007, pp. 243–247.
2015 STATE OF BLACK AMERICA¨
SAVE OUR CITIES
Taylor, Robert D., “Wealth Creation: The Next
Leadership Challenge,” 2005, pp. 119–122.
West, Cornel, “Democracy Matters,” 2005, pp. 129–132.
Wijewardena, Madura and Kirk Clay, “Government with
the Consent of All: Redistricting Strategies for Civil
Rights Organizations,” 2011, pp. 196–201.
Wilkins, Ray, “Jobs, the Internet, and Our Exciting
Future,” 2011, pp. 94–99.
OVERVIEW
Morial, Marc H., “Black America’s Family Matters,”
2003, pp. 9–12.
Price, Hugh B., “Still Worth Fighting For: America
After 9/11,” 2002, pp. 9–11.
POLITICS
Alton, Kimberley, “The State of Civil Rights 2008,”
2008, pp. 157–161.
Brazile, Donna, “Fallout from the Mid-Term Elections:
Making the Most of the Next Two Years,” 2011,
pp. 180–190.
Brown James, Stefanie, “Black Civic Engagement 2.0:
In with the Old, in with the New,” 2013, pp. 67–68.
NATIONAL URBAN LEAGUE
Appendix 2 + 175
Campbell, Melanie L., “Election Reform: Protecting
Our Vote from the Enemy Who Never Sleeps,” 2008,
pp. 149–156.
Pinderhughes, Dianne M., “Power and Progress:
African-American Politics in the New Era of Diversity,”
1992, pp. 265–280.
Capehart, Jonathan, “Race Still Does Matter—A Lot,”
2013, pp. 150–153.
———, “The Renewal of the Voting Rights Act,” 2005,
pp. 49–61.
Coleman, Henry A., “Interagency and
Intergovernmental Coordination: New Demands for
Domestic Policy Initiatives,”
———, “Civil Rights and the Future of the American
Presidency,” 1988, pp. 39–60.
1992, pp. 249–263.
Fauntroy, Michael K., “The New Arithmetic of Black
Political Power,” 2013, pp. 154–157.
Fudge, Marcia L., “Unfinished Business,” 2013, pp. 65.
Hamilton, Charles V., “On Parity and Political
Empowerment,” 1989, pp. 111–120.
———, “Promoting Priorities: African-American Political
Influence in the 1990s,” 1993, pp. 59–69.
Henderson, Lenneal J., “Budgets, Taxes, and Politics:
Options for the African-American Community,” 1991,
pp. 77–93.
Henderson, Wade, “A Watershed Year for
Bipartisanship in Criminal Justice Reform,” 2014,
pp. 110–111.
Holden, Jr., Matthew, “The Rewards of Daring and
the Ambiguity of Power: Perspectives on the Wilder
Election of 1989,” 1990, pp. 109–120.
Holder, Jr., Eric H., “Civil Rights Enforcement in the
21st Century,” 2013, pp. 144–148.
House, Tanya Clay, “The Evolving Fight to Protect the
Vote,” 2014, pp. 114–115.
Kilson, Martin L., “African Americans and American
Politics 2002: The Maturation Phase,” 2002,
pp. 147–180.
———, “Thinking About the Black Elite’s Role:
Yesterday and Today,” 2005, pp. 85–106.
Lee, Silas, “Who’s Going to Take the Weight? African
Americans and Civic Engagement in the 21st Century,”
2007, pp. 185–192.
Lewis, John, “New Tactics, Same Old Taint,” 2013,
pp. 62–63.
Lindsay, Tiffany, “Weaving the Fabric: The Political
Activism of Young African-American Women,” 2008,
pp. 187–192.
Mack, John W., “Reflections on National Urban
League’s Legacy and Service,” 2013, pp. 66.
McHenry, Donald F., “A Changing World Order:
Implications for Black America,” 1991, pp. 155–163.
Persons, Georgia A., “Blacks in State and Local
Government: Progress and Constraints,” 1987,
pp. 167–192.
Price, Hugh B., “Black America’s Challenge: The
Re-Construction of Black Civil Society,” 2001,
pp. 13–18.
Rivlin, Alice M., “Pay Now or Pay Later: Jobs, Fiscal
Responsibility and the Future of Black America,” 2011,
pp. 202–206.
Scott, Robert C. “Bobby,” “Minority Voter Participation:
Reviewing Past and Present Barriers to the Polls,” 2012,
pp. 44–47.
Tidwell, Billy J., “Serving the National Interest:
A Marshall Plan for America,” 1992, pp. 11–30.
Watts, Vincent and White, Edith, “Project Advocate:
A Roadmap to Civic Engagement,” 2013 pp. 140–143.
West, Cornel, “Democracy Matters,” 2005, pp. 129–132.
White, Edith and Watts, Vincent, “Project Advocate:
A Roadmap to Civic Engagement,” 2013 pp. 140–143.
Wijewardena, Madura and Kirk Clay, “Government with
the Consent of All: Redistricting Strategies for Civil
Rights Organizations,” 2011, pp. 196–201.
Williams, Eddie N., “The Evolution of Black Political
Power,” 2000, pp. 91–102.
Yearwood, Jr., Lennox, “The Rise and Fall and Rise
Again of Jim Crow Laws,” 2012, pp. 48–53.
POVERTY
Baker, Donna Jones, “Driving Economic SelfSufficiency to Transform the Next Generation,” 2014,
pp. 178–181.
Cooper, Maudine R., “The Invisibility Blues’ of Black
Women in America,” 2008, pp. 83–87.
Edelman, Marian Wright, “The State of Our Children,”
2006, pp. 133–141.
McConduit-Diggs, Erika, “Winning TrifE3cta for
Community Empowerment: Education, Employment,
Entrepreneurship,” 2014, pp. 164–167.
Shapiro, Dr. Thomas, “Policies of Exclusion Perpetuate
the Racial Wealth Gap” 2014, pp. 106–107.
PRESCRIPTIONS FOR CHANGE
Bell, William C., “Community Based Organizations and
Child Welfare: Building Communities of Hope,” 2013,
pp. 166–169.
Burns, Ursula, “Leaving No Brains Behind,” 2014,
pp. 152–157.
Capehart, Jonathan, “Race Still Does Matter—A Lot,”
2013, pp. 150–153.
2015 STATE OF BLACK AMERICA¨
SAVE OUR CITIES
NATIONAL URBAN LEAGUE
Appendix 2 + 176
Clyburn, Mignon, “Challenges and Opportunities for
African Americans In Communications Technology,”
2014, pp. 192–195.
Davis, Sampson; Hunt, Rameck and Jenkins, George, “I
Wanna Be Like…Education, Pacts and the Potential of
Youth,” 2015, pp. 139–142.
Fauntroy, Michael K., “The New Arithmetic of Black
Political Power,” 2013, pp. 154–157.
Foxx, Anthony, “Civil Rights…and Lefts: Building a
Transportation System for All,” 2015 pp. 108–111.
Lomax, Dr. Michael, “Getting Kids To and Through
College: Our Kids, Our Jobs,” 2014, pp. 142–147.
Lombard, Tanya, “Transforming Futures for a Daring
Tech Tomorrow—African-American Entrepreneurs,
Broadband and the Coming Community Benefits,”
2014, pp. 188–191.
Marshall, Cynthia, “Digitizing the Dream: The Role of
Technology in Empowering Communities,” 2013,
pp. 130–133.
McGhee, David, “Mentoring Matters: Why Young
Professionals and Others Must Mentor,” 2013,
pp. 162–165.
Hanson, Renee, Mark McArdle, and Valerie Rawlston
Wilson, “Invisible Men: The Urgent Problems of
Low-Income African-American Males,” 2007,
pp. 209–216.
Hardy, Chanelle P., Dr. Valerie Rawlston Wilson, Madura
Wijewardena, and Garrick T. Davis, “At Risk: The State
of the Black Middle Class,” 2012, pp. 74–83.
Jones, Stephanie J., “Sunday Morning Apartheid: A
Diversity Study of the Sunday Morning Talk Shows”
2006, pp. 189–228.
Lanier, James, “The National Urban League’s
Commission on the Black Male: Renewal, Revival and
Resurrection Feasibility and Strategic Planning Study,”
2005, pp. 107–109.
LaVeist, Thomas A., Richard, Patrick and Gaskins,
Darrell J., “The State of Urban Health: Eliminating
Health Disparities to Save Lives and Cut Costs,” 2013,
pp. 108–128.
National Urban League, “12 Point Urban Jobs Plan,”
2011, pp. 46–52.
National Urban League, “Prescriptions for Change,”
2005, pp. 133–135.
National Urban League Council of Economic Advisors,
Bernard E. Anderson, William M. Rodgers III, Lucy
J. Reuben, and Valerie Rawlston Wilson, “The New
Normal? Opportunities for Prosperity in a ‘Jobless
Recovery,’” 2011, pp. 54–63.
Pinkett, Dr. Randal, Robinson, Dr. Jeffrey,
“Entrepreneurship and Economic Development,” 2014,
pp. 174–177.
National Urban League Policy Institute, The
Opportunity Compact: A Blueprint for Economic
Equality, 2008, pp. 43–74.
Shepherd, Dr. J. Marshall, “21st Century Jobs and
Climate Change: A Curse and Blessing for African
Americans,” 2014, pp. 168–173.
———, “Putting Americans Back to Work: The
National Urban League’s Plan for Creating Jobs” 2010,
pp. 40–44.
Shumate, Jabar, “The Affordable Care Act and How
It Can Fuel Entrepreneurism in Urban Communities,”
2014, pp. 130–133.
———, “African Americans and the Green Revolution”
2010, pp. 46–59.
RELATIONSHIPS
Taylor, Susan L., “Black Love Under Siege,” 2008,
pp. 179–186.
RELIGION
Lincoln, C. Eric, “Knowing the Black Church: What It Is
and Why,” 1989, pp. 137–149.
Richardson, W. Franklyn, “Mission to Mandate:
Self-Development through the Black Church,” 1994,
pp. 113–126.
Smith, Dr. Drew, “The Evolving Political Priorities of
African-American Churches: An Empirical View,” 2000,
pp. 171–197.
Taylor, Mark V.C., “Young Adults and Religion,” 2001,
pp. 161–174.
REPORTS FROM THE NATIONAL URBAN LEAGUE
———, “Where Do We Go From Here? Projected
Employment Growth Industries and Occupations,”
2011, pp. 64–75.
———, “The 2012 National Urban League 8-Point
Education and Employment Plan: Employment and
Education Empower the Nation” 2012, pp. 54–59.
———, “The National Urban League Introduces
New Reports on the State of Urban Business” 2012,
pp. 64–69.
National Urban League Policy Institute, LaVeist,
Thomas A., Richard, Patrick and Gaskins, Darrell
J., “The State of Urban Health: Eliminating Health
Disparities to Save Lives and Cut Costs,” 2013,
pp. 108–128.
Richard, Patrick, Gaskins, Darrell J. and LaVeist,
Thomas A., “The State of Urban Health: Eliminating
Health Disparities to Save Lives and Cut Costs,” 2013,
pp. 108–128.
Gaskins, Darrell J., LaVeist, Thomas A. and Richard,
Patrick, “The State of Urban Health: Eliminating
Health Disparities to Save Lives and Cut Costs,” 2013,
pp. 108–128.
2015 STATE OF BLACK AMERICA¨
SAVE OUR CITIES
NATIONAL URBAN LEAGUE
Appendix 2 + 177
REPORTS
SPECIAL SECTION: KATRINA AND BEYOND
Joint Center for Political and Economic Studies, A Way
Out: Creating Partners for Our Nation’s Prosperity by
Expanding Life Paths for Young Men of Color—Final
Report of the Dellums Commission, 2007, pp. 193–207.
Brazile, Donna L., “New Orleans: Next Steps on the
Road to Recovery,” 2006, pp. 233–237.
Reed, James and Aaron Thomas, The National Urban
League: Empowering Black Males to Meet Their Full
Potential, 2007, pp. 217–218.
Wilson, Valerie Rawlston,“Introduction to the 2011
Equality Index,” 2011, pp. 14–22.
SEXUAL IDENTITY
Bailey, Moya, “Going in Circles: The Struggle to
Diversify Popular Images of Black Women,” 2008,
pp. 193–196.
Battle, Juan, Cathy J. Cohen, Angelique Harris, and
Beth E. Richie, “We Are Family: Embracing Our
Lesbian, Gay, Bisexual, and Transgender (LGBT) Family
Members,” 2003, pp. 93–106.
Taylor, Susan L., “Black Love Under Siege,” 2008,
pp. 179–186.
Morial, Marc H., “New Orleans Revisited,” 2006,
pp. 229–232.
National Urban League, “The National Urban League
Katrina Bill of Rights,” 2006, pp. 239–243.
SPECIAL SECTION: LIFT EV’RY VOICE
Brown James, Stefanie, “Black Civic Engagement 2.0:
In with the Old, in with the New,” 2013, pp. 67–68.
Edelman, Marian Wright, “Time to Wake Up and Act:
The State of Black America,” 2013, pp. 68–69.
Fudge, Marcia L., “Unfinished Business,” 2013, pp. 65.
Hardy, Chanelle P., “Introduction to Lift Ev’ry Voice:
A Special Collection of Articles and Op-Eds.,” 2013,
pp. 60–61.
Jones-DeWeever, Avis A., “The Enduring Icon:
Dr. Dorothy Height,” 2013, pp. 64.
SOCIOLOGY
Lewis, John, “New Tactics, Same Old Taint,” 2013,
pp. 62–63.
Cooper, Maudine R., “The Invisibility Blues’ of Black
Women in America,” 2008, pp. 83–87.
Mack, John W., “Reflections on National Urban
League’s Legacy and Service,” 2013, pp. 66.
Taylor, Susan L., “Black Love Under Siege,” 2008,
pp. 179–186.
Sharpton, Al, “Though We Have Achieved Much,
the Battle Continues,” 2013, pp. 63–64.
Teele, James E., “E. Franklin Frazier: The Man and His
Intellectual Legacy,” 2003, pp. 29–40.
SURVEYS
SPECIAL SECTION: 21ST AGENDA FOR
JOBS AND FREEDOM
Christensen, Donna, “A Healthier Nation,” 2014,
pp. 115–117.
Hardy, Chanelle P., “Introduction to the Special
Section,” 2014, pp. 102–103.
Harper, Hill, “America Incarcerated: Who Pays and
Who Profits,” 2014, pp. 112–113.
Henderson, Wade, “A Watershed Year for
Bipartisanship in Criminal Justice Reform,” 2014,
pp. 110–111.
Hinojosa, Ruben, “Financial Literacy: Investing to
Empower,” 2014, pp. 108–109.
Honda, Mike, “Equity and Excellence Lead to
Opportunity,” 2014, pp. 104–105.
The National Urban League Survey, 2004, pp. 35–51.
Stafford, Walter S., “The National Urban League
Survey: Black America’s Under-35 Generation,” 2001,
pp. 19–63.
———, “The New York Urban League Survey: Black New
York—On Edge, But Optimistic,” 2001, pp. 203–219.
TECHNOLOGY
Clyburn, Mignon, “Challenges and Opportunities for
African Americans In Communications Technology,”
2014, pp. 192–195.
Dreyfuss, Joel, “Black Americans and the Internet:
The Technological Imperative,” 2001, pp. 131–141.
Liggins III, Alfred C., “Successful Black Entrepreneurs
Should Not Be an Anomaly,” 2015, pp. 143–146.
House, Tanya Clay, “The Evolving Fight to Protect the
Vote,” 2014, pp. 114–115.
Lombard, Tanya, “Transforming Futures for a Daring
Tech Tomorrow—African-American Entrepreneurs,
Broadband and the Coming Community Benefits,”
2014, pp. 188–191.
Shapiro, Dr. Thomas, “Policies of Exclusion Perpetuate
the Racial Wealth Gap” 2014, pp. 106–107.
Patrick, Deval L., “Growing an Innovative Economy in
Massachusetts,” 2011, pp. 154–158.
SPECIAL SECTION: BLACK WOMEN’S HEALTH
Browne, Doris, “The Impact of Health Disparities in
African-American Women,” 2008, pp. 163–171.
Pinkett, Dr. Randal, Robinson, Dr. Jeffrey,
“Entrepreneurship and Economic Development,” 2014,
pp. 174–177.
Morris, Eboni D., “By the Numbers: Uninsured AfricanAmerican Women,” 2008, pp. 173–177.
Ramsey, Rey, “Broadband Matters to All of Us,” 2010,
pp. 112–116.
2015 STATE OF BLACK AMERICA¨
SAVE OUR CITIES
NATIONAL URBAN LEAGUE
Appendix 2 + 178
Ribeau, Sidney, “A Competitive Foundation for the
Future,” 2011, pp. 8–9.
Harris, Dot, “Diversity in STEM: An Economic
Imperative,” 2013, pp. 92–95.
Wilkins, Ray, “Jobs, the Internet, and Our Exciting
Future,” 2011, pp. 94–99.
Henderson, Lenneal J., “African Americans in the
Urban Milieu: Conditions, Trends, and Development
Needs,” 1994, pp. 11–29.
Wilson III, Ernest J., “Technological Convergence,
Media Ownership and Content Diversity,” 2000,
pp. 147–170.
TRANSPORTATION
Foxx, Anthony, “Civil Rights…and Lefts: Building a
Transportation System for All,” 2015 pp. 108–111.
URBAN AFFAIRS
Allen, Antoine, and Leland Ware, “The Geography
of Discrimination: Hypersegregation, Isolation
and Fragmentation Within the African-American
Community,” 2002, pp. 69–92.
Bates, Timothy, “The Paradox of Urban Poverty,” 1996,
pp. 144–163.
Bell, Carl C., with Esther J. Jenkins, “Preventing Black
Homicide,” 1990, pp. 143–155.
Bell, William C., “Community Based Organizations and
Child Welfare: Building Communities of Hope,” 2013,
pp. 166–169.
Hill, Robert B., “Urban Redevelopment: Developing
Effective Targeting Strategies,” 1992, pp. 197–211.
Johnston, Haile, and Tatiana Garcia-Granados,
“Common Market: The New Black Farmer,” 2012,
pp. 100–105.
Jones, Dionne J., with Greg Harrison of the National
Urban League Research Department, “Fast Facts:
Comparative Views of African-American Status and
Progress,” 1994, pp. 213–236.
Jones, Shirley J., “Silent Suffering: The Plight of Rural
Black America,” 1994, pp. 171–188.
LaVeist, Thomas A., Richard, Patrick and Gaskins,
Darrell J., “The State of Urban Health: Eliminating
Health Disparities to Save Lives and Cut Costs,” 2013,
pp. 108–128.
Mack, John W., “Reflections on National Urban
League’s Legacy and Service,” 2013, pp. 66.
Bryant Solomon, Barbara, “Social Welfare Reform,”
1987, pp. 113–127.
Massey, Walter E. “Science, Technology, and Human
Resources: Preparing for the 21st Century,” 1992,
pp. 157–169.
Brown, Lee P., “Crime in the Black Community,” 1988,
pp. 95–113.
Mendez, Jr., Garry A., “Crime Is Not a Part of Our Black
Heritage: A Theoretical Essay,” 1988, pp. 211–216.
Bryant, John Hope, “Financial Dignity in an Economic
Age,” 2013, pp. 134–138.
Miller, Jr., Warren F., “Developing Untapped Talent:
A National Call for African-American Technologists,”
1991, pp. 111–127.
Bullard, Robert D. “Urban Infrastructure: Social,
Environmental, and Health Risks to African
Americans,” 1992, pp. 183–196.
Chambers, Julius L., “The Law and Black Americans:
Retreat from Civil Rights,” 1987, pp. 15–30.
———, “Black Americans and the Courts: Has the Clock
Been Turned Back Permanently?” 1990, pp. 9–24.
Edelin, Ramona H., “Toward an African-American
Agenda: An Inward Look,” 1990, pp. 173–183.
Fair, T. Willard, “Coordinated Community
Empowerment: Experiences of the Urban League of
Greater Miami,” 1993, pp. 217–233.
Gaskins, Darrell J., LaVeist, Thomas A. and Richard,
Patrick, “The State of Urban Health: Eliminating Health
Disparities to Save Lives and Cut Costs,” 2013,
pp. 108–128.
Gray, Sandra T., “Public-Private Partnerships:
Prospects for America…Promise for African
Americans,” 1992, pp. 231–247.
Harris, David, “‘Driving While Black’ and Other AfricanAmerican Crimes: The Continuing Relevance of Race to
American Criminal Justice,” 2000, pp. 259–285.
2015 STATE OF BLACK AMERICA¨
SAVE OUR CITIES
Murray, Sylvester, “Clear and Present Danger: The
Decay of America’s Physical Infrastructure,” 1992,
pp. 171–182.
Pemberton, Gayle, “It’s the Thing That Counts, Or
Reflections on the Legacy of W.E.B. Du Bois,” 1991,
pp. 129–143.
Pinderhughes, Dianne M., “The Case of AfricanAmericans in the Persian Gulf: The Intersection of
American Foreign and Military Policy with Domestic
Employment Policy in the United States,” 1991, pp.
165–186.
Richard, Patrick, Gaskins, Darrell J. and LaVeist,
Thomas A., “The State of Urban Health: Eliminating
Health Disparities to Save Lives and Cut Costs,” 2013,
pp. 108–128.
Robinson, Gene S. “Television Advertising and Its
Impact on Black America,” 1990, pp. 157–171.
Sawyers, Dr. Andrew and Dr. Lenneal Henderson,
“Race, Space and Justice: Cities and Growth in the
21st Century,” 2000, pp. 243–258.
Schneider, Alvin J., “Blacks in the Military: The Victory
and the Challenge,” 1988, pp. 115–128.
NATIONAL URBAN LEAGUE
Appendix 2 + 179
Shepherd, Dr. J. Marshall, “21st Century Jobs and
Climate Change: A Curse and Blessing for African
Americans,” 2014, pp. 168–173.
Smedley, Brian, “Race, Poverty, and Healthcare
Disparities,” 2006, pp. 155–164.
Stafford, Walter, Angela Dews, Melissa Mendez, and
Diana Salas, “Race, Gender and Welfare Reform:
The Need for Targeted Support,” 2003, pp. 41–92.
Stewart, James B., “Developing Black and Latino
Survival Strategies: The Future of Urban Areas,” 1996,
pp. 164–187.
Stone, Christopher E., “Crime and Justice in Black
America,” 1996, pp. 78–94.
Tidwell, Billy J., with Monica B. Kuumba, Dionne J.
Jones, and Betty C. Watson, “Fast Facts: African
Americans in the 1990s,” 1993, pp. 243–265.
Wallace-Benjamin, Joan, “Organizing AfricanAmerican Self-Development: The Role of
Community-Based Organizations,” 1994, pp. 189–205.
Walters, Ronald, “Serving the People: AfricanAmerican Leadership and the Challenge of
Empowerment,” 1994, pp. 153–170.
Allen, Antoine, and Leland Ware, “The Geography
of Discrimination: Hypersegregation, Isolation
and Fragmentation within the African-American
Community,” 2002, pp. 69–92.
Wiley, Maya, “Hurricane Katrina Exposed the Face of
Poverty,” 2006, pp. 143–153.
WELFARE
Bell, William C., “Community Based Organizations and
Child Welfare: Building Communities of Hope,” 2013,
pp. 166–169.
Bergeron, Suzanne, and William E. Spriggs, “Welfare
Reform and Black America,” 2002, pp. 29–50.
Cooper, Maudine R., “The Invisibility Blues’ of Black
Women in America,” 2008, pp. 83–87.
Harris, Andrea, “The Subprime Wipeout: Unsustainable
Loans Erase Gains Made by African-American
Women,” 2008, pp. 125–133.
Herman, Alexis, “African-American Women and Work:
Still a Tale of Two Cities,” 2008, pp. 109–113.
Lindsay, Tiffany, “Weaving the Fabric: The Political
Activism of Young African-American Women,” 2008,
pp. 187–192.
Malveaux, Julianne, “Black Women’s Hands Can Rock
the World: Global Involvement and Understanding,”
2008, pp. 197–202.
———, “Shouldering the Third Burden: The Status of
African-American Women,” 2008, pp. 75–81.
Mensah, Lisa, “Putting Homeownership Back Within
Our Reach,” 2008, pp. 135–142.
Morris, Eboni D., “By the Numbers: Uninsured AfricanAmerican Women,” 2008, pp. 173–177.
Reuben, Lucy J., “Make Room for the New ‘She’EOs:
An Analysis of Businesses Owned by Black Females,”
2008, pp. 115–124.
Stafford, Walter, Angela Dews, Melissa Mendez, and
Diana Salas, “Race, Gender and Welfare Reform: The
Need for Targeted Support,” 2003, pp. 41–92.
Taylor, Susan L., “Black Love Under Siege,” 2008,
pp. 179–186.
West, Carolyn M., “Feminism is a Black Thing?”:
Feminist Contribution to Black Family Life, 2003,
pp. 13–27.
WORLD AFFAIRS
Malveaux, Julianne, “Black Women’s Hands Can Rock
the World: Global Involvement and Understanding,”
2008, pp. 197–202.
Cooper, Maudine R., “The Invisibility Blues’ of Black
Women in America,” 2008, pp. 83–87.
Covington, Kenya L., “The Transformation of the
Welfare Caseload,” 2004, pp. 149–152.
Spriggs, William E., and Suzanne Bergeron, “Welfare
Reform and Black America,” 2002, pp. 29–50.
Stafford, Walter, Angela Dews, Melissa Mendez, and
Diana Salas, “Race, Gender and Welfare Reform:
The Need for Targeted Support,” 2003, pp. 41–92.
WOMEN’S ISSUES
Bailey, Moya, “Going in Circles: The Struggle to
Diversify Popular Images of Black Women,” 2008,
pp. 193–196.
Browne, Doris, “The Impact of Health Disparities in
African-American Women,” 2008, pp. 163–171.
Chase, Debra Martin, “Creating the Change the World
Needs to See,” 2015, pp. 134–138.
2015 STATE OF BLACK AMERICA¨
SAVE OUR CITIES
NATIONAL URBAN LEAGUE
Appendix 3 + 180
NATIONAL URBAN LEAGUE
Board of Trustees
OFFICERS
TRUSTEES
CHAIR
Lanesha Anderson
Michael F. Neidorff
Kendrick F. Ashton, Jr.
SENIOR VICE CHAIR
Khary P. Barnes
The Honorable Alexis M. Herman
Robert J. Brown
James H. Buford
TREASURER/VICE CHAIR
Kenneth D. Bynum
Jon R. Campbell
David L. Cohen
VICE CHAIR
Victor L. Crawford
Gale V. King
David C. Darnell
VICE CHAIR
Jeff Davis
John W. Mack
Donna Epps
SECRETARY
Tracy Faulkner
Charlene Lake
Myron Gray
PRESIDENT & CHIEF EXECUTIVE OFFICER
John D. Hofmeister
Marc H. Morial
Samuel H. Howard
Carol Jackson
Will James
HONORARY TRUSTEES
Harry E. Johnson, Sr.
Reginald K. Brack, Jr.
Julia Johnson
M. Anthony Burns
Lawrence S. Jones
Michael J. Critelli
J. Brandon Neal
Kenneth D. Lewis
Nicholas Perkins
Jonathan S. Linen
William F. Pickard, Ph.D.
Brandi Richard
Rynthia Rost
The Honorable Jabar Shumate
The Honorable Rodney E. Slater
Cynthia M. Stokes-Murray
Valerie Thompson, Ph.D.
Dennis E. Welch
2015 STATE OF BLACK AMERICA¨
SAVE OUR CITIES
NATIONAL URBAN LEAGUE
Appendix 3 + 181
NATIONAL URBAN LEAGUE
Executive Staff
PRESIDENT & CHIEF EXECUTIVE OFFICER
Marc H. Morial
SENIOR VICE PRESIDENT
Marketing & Communications
Rhonda Spears Bell
SENIOR VICE PRESIDENT & EXECUTIVE DIRECTOR
Washington Bureau
Chanelle P. Hardy, Esq.
SENIOR VICE PRESIDENT & CHIEF TALENT OFFICER
Wanda H. Jackson
GENERAL COUNSEL
Nicolaine M. Lazarre
SENIOR VICE PRESIDENT
Affiliate Services
Herman L. Lessard
SENIOR VICE PRESIDENT
& CHIEF TECHNOLOGY OFFICER
Strategy & Innovation
Michael E. Miller
SENIOR VICE PRESIDENT
Economics & Housing
Cy Richardson
SENIOR VICE PRESIDENT
Development
Dennis Serrette
SENIOR VICE PRESIDENT
Education, Youth Development & Health
Hal Smith
SENIOR ADVISOR TO THE PRESIDENT & CEO
Latraviette D. Smith-Wilson
SENIOR VICE PRESIDENT & CFO
Finance & Operations
Paul Wycisk
PRESIDENT & CEO
Urban Empowerment Fund,
a subsidiary of the National Urban League
Donald E. Bowen
2015 STATE OF BLACK AMERICA¨
SAVE OUR CITIES
NATIONAL URBAN LEAGUE
Appendix 3 + 182
NATIONAL URBAN LEAGUE
Affiliates
AKRON, OH
CHARLOTTE, NC
FARRELL, PA
Akron Urban League
Urban League of Central
Carolinas, Inc.
Urban League of Shenango Valley
Northern Virginia Urban League
CHATTANOOGA, TN
Urban League of Flint
ALTON, IL
Urban League Greater
Chattanooga, Inc.
FORT LAUDERDALE, FL
ALEXANDRIA, VA
Madison County Urban League
CHICAGO, IL
ANDERSON, IN
Chicago Urban League
Urban League of Madison
County, Inc.
CINCINNATI, OH
ATLANTA, GA
Urban League of Greater
Southwestern Ohio
Urban League of Greater Atlanta
CLEVELAND, OH
FLINT, MI
Urban League of Broward County
FORT WAYNE, IN
Fort Wayne Urban League
GARY, IN
Urban League of Northwest
Indiana, Inc.
Urban League of Greater
Cleveland
GRAND RAPIDS, MI
Quad County Urban League
AUSTIN, TX
COLUMBIA, SC
GREENVILLE, SC
Austin Area Urban League
Columbia Urban League
Urban League of the Upstate, Inc.
BALTIMORE, MD
COLUMBUS, GA
HARTFORD, CT
Greater Baltimore Urban League
Urban League of Greater
Columbus, Inc.
Urban League of Greater Hartford
Southwestern Michigan
Urban League
COLUMBUS, OH
Urban League of Long Island
BINGHAMTON, NY
DALLAS, TX
Broome County Urban League
Urban League of Greater Dallas
& North Central Texas
AURORA, IL
BATTLE CREEK, MI
Columbus Urban League
BIRMINGHAM, AL
DENVER, CO
Birmingham Urban League
Grand Rapids Urban League
HEMPSTEAD, NY (LONG ISLAND)
HOUSTON, TX
Houston Area Urban League
INDIANAPOLIS, IN
Indianapolis Urban League
Urban League of Metropolitan
Denver
JACKSON, MS
BOSTON, MA
Urban League of Eastern
Massachusetts
DETROIT, MI
JACKSONVILLE, FL
Urban League of Detroit &
Southeastern Michigan
Jacksonville Urban League
BUFFALO, NY
Buffalo Urban League
ELIZABETH, NJ
CANTON, OH
Urban League of Union County
Greater Stark County Urban
League, Inc.
ELYRIA, OH
Lorain County Urban League
CHARLESTON, SC
Charleston Trident Urban League
2015 STATE OF BLACK AMERICA¨
ENGLEWOOD, NJ
Urban League for Bergen County
SAVE OUR CITIES
Urban League of Greater Jackson
JERSEY CITY, NJ
Urban League of Hudson County
KANSAS CITY, MO
Urban League of Kansas City
KNOXVILLE, TN
Knoxville Area Urban League
NATIONAL URBAN LEAGUE
Appendix 3 + 183
LANCASTER, PA
PEORIA, IL
TACOMA, WA
Urban League of Lancaster County
Tri-County Urban League
Tacoma Urban League
LAS VEGAS, NV
PHILADELPHIA, PA
TALLAHASSEE, FL
Las Vegas–Clark County
Urban League
Urban League of Philadelphia
Tallahassee Urban League
PHOENIX, AZ
TOLEDO, OH
LEXINGTON, KY
Greater Phoenix Urban League
Greater Toledo Urban League
Urban League of
Lexington–Fayette County
PITTSBURGH, PA
TUCSON, AZ
LOS ANGELES, CA
Urban League of
Greater Pittsburgh
Tucson Urban League
PORTLAND, OR
Metropolitan Tulsa Urban League
Los Angeles Urban League
LOUISVILLE, KY
Urban League of Portland
Louisville Urban League
PROVIDENCE, RI
MADISON, WI
Urban League of Rhode Island
Urban League of Greater Madison
MEMPHIS, TN
RACINE, WI
TULSA, OK
VIRGINIA BEACH, VA (NORFOLK)
Urban League of Hampton Roads
WARREN, OH
Greater Warren-Youngstown
Urban League
Memphis Urban League
Urban League of Racine
& Kenosha, Inc.
MIAMI, FL
RICHMOND, VA
Greater Washington Urban League
Urban League of Greater Miami
Urban League of Greater
Richmond, Inc.
WEST PALM BEACH, FL
ROCHESTER, NY
Urban League of Palm Beach
County, Inc.
MILWAUKEE, WI
Milwaukee Urban League
Urban League of Rochester
MINNEAPOLIS, MN
SACRAMENTO, CA
WASHINGTON, DC
WHITE PLAINS, NY
Greater Sacramento Urban League
Urban League of Westchester
County
Morris County Urban League
SAINT LOUIS, MO
WICHITA, KS
NASHVILLE, TN
Urban League of Metropolitan
St. Louis
Urban League of Kansas, Inc.
SAINT PETERSBURG, FL
Minneapolis Urban League
MORRISTOWN, NJ
Urban League of Middle Tennessee
WILMINGTON, DE
NEW ORLEANS, LA
Pinellas County Urban League
Metropolitan Wilmington
Urban League
Urban League of Greater
New Orleans
SAN DIEGO, CA
WINSTON-SALEM, NC
NEW YORK, NY
Urban League of
San Diego County
Winston-Salem Urban League
New York Urban League
SEATTLE, WA
NEWARK, NJ
Urban League of Essex County
Urban League of
Metropolitan Seattle
OKLAHOMA CITY, OK
SPRINGFIELD, IL
Urban League of Greater
Oklahoma City
Springfield Urban League, Inc.
OMAHA, NE
Urban League of Springfield
SPRINGFIELD, MA
Urban League of Nebraska, Inc.
ORLANDO, FL
Central Florida Urban League
2015 STATE OF BLACK AMERICA¨
STAMFORD, CT
Urban League of Southern
Connecticut
SAVE OUR CITIES
NATIONAL URBAN LEAGUE
THE 2015 STATE OF
BLACK AMERICA¨
REPORT WAS BROUGHT
TO LIFE WITH LIVE
AND DIGITAL EVENTS.
2015 STATE OF BLACK AMERICA
WEB SERIES DIGITAL EVENT TEAM
Rhonda Spears Bell
Zuhirah Khaldun-Diarra
Kristian Buchanan
Simone Jordan
Beatriz Mota
Candece Monteil
Genet Lakew
Dionte Noble
Lisa Taliano
WWW.STATEOFBLACKAMERICA.ORG
#SAVEOURCITIES
The State of Black America¨, the National Urban League’s
seminal annual publication, has become one of the most
highly-anticipated benchmarks and sources for thought
leadership around racial equality in America across
economics (including employment, income and housing),
education, health, social justice and civic engagement.
Now in its 39th edition, the 2015 State of
book features the second edition of the Metro
Black America “Save Our Cities: Education,
Equality Index, ranking approximately 70 metro
Jobs + Justice” conveys the urgency of
areas based on unemployment and income
focus around each of these areas and their
equality for Blacks and Hispanics.
interconnectedness in our ongoing quest for full
equality in America. With an intense focus on
solutions, this year’s report continues with the
inclusion of insightful commentary and analysis
from leading figures and thought leaders in
politics, the corporate arena, NGOs, academia
This year, new to the Equality Index is a
special feature on state-level racial and ethnic
disparities in K–12 education that documents
the extent of Black–White and Hispanic–White
achievement gaps in all 50 states across the
and popular culture.
country and the District of Columbia. The
The State of Black America also includes the
supporting data on some of the factors that
Equality Index™, a quantitative tool for tracking
contribute to narrowing or widening these
racial equality in America, now in its 11th
gaps, including teacher quality, pre-school
State Education Equality Index also includes
edition of the Black–White Index and its sixth
and course enrollment, and student status
edition of the Hispanic–White Index. The 2015
and risk factors, including poverty.
Access the all-new, full 2015 State of Black America digital
experience, including a seven-part video Web Series
and enhanced website, at www.stateofblackamerica.org.
120 WALL STREET | NEW YORK, NY 10005 | WWW.NUL.ORG


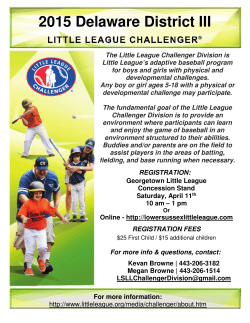

© Copyright 2026