
First Quarter 2015 Animal Health Industry | Sector
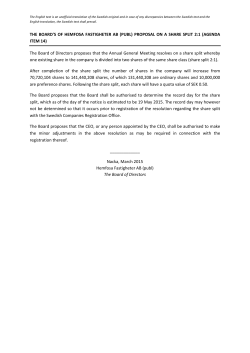
VALUE FOCUS
Animal Health Industry
SEGMENT FOCUS
Veterinary Services
2015
Veterinary Services
Q1: Veterinary Services
Q2: Retail & Pet Services
Q3: Veterinary Services
Q4: Pharmaceutical
& Biotechnology
General Overview Equity Market Overview
M&A Activity Trigger Events and
Goodwill Impairment
Sector Outlook
Animal Health Industry
1
1
3
4
4
LTM Stock Prices
by Industry Segment 5
Publicly Traded Animal
Health Companies 5
About Mercer Capital 6
Special Supplement
Fairness Opinions: Evaluating a Buyer’s Shares from the Seller’s Perspective
www.mercercapital.com
BUSINESS VALUATION &
FINANCIAL ADVISORY SERVICES
SEGMENT FOCUS
Veterinary
Services
2015 First Quarter
General Overview
Equity Market Overview
As of December 2013, an estimated 64,000 veterinarians were involved in private practice in the United States. Demand for veterinary services has been spurred by growing numbers of households
with companion animals, aging pets, and the growing trend of “pet
parenthood.” Advances in animal healthcare have allowed specialty
practices to expand over the last several decades.
VCA Antech, Inc (“WOOF”) is a major provider of veterinary services and operates 622 animal hospitals in the United States which
provide general medical services, surgical services, and specialty
services. VCA also has 59 veterinary laboratories, which provide
testing and consulting for veterinarians regarding chemistry, pathology, endocrinology, and other diseases. They operate the largest
network of freestanding animal hospitals and veterinary labs in the
US. VCA’s share price, which ended the fourth quarter at $48.77,
posted total gains of 24.0% and 55.5% over the quarter and year,
respectively. VCA’s price gains were driven by ongoing acquisitions
and continuing revenue growth, which increased 5% in the yearto-date period relative to the same period inthe prior year. Animal
hospital same store revenue increased 2.3% in the YTD September
2014 period.
© 2015 Mercer Capital
1
www.mercercapital.com
Mercer Capital’s Value Focus: Animal Health Industry
First Quarter 2015
Equity Market Overview (cont.)
Although it does not provide veterinary services, MWI Veterinary
Supply (“MWIV”) provides products to animal hospitals ranging
from dental x-ray equipment to vaccinations and animal food. Demand of MWI’s products depends strongly on the strength of the veterinary services market. MWI also experienced strong share price
growth during the last quarter of 2014. MWI’s share price fell steeply
in April 2014 due to lower earnings outlooks. The share price struggled to recover and ultimately ended 2014 just about where it began.
Overall, MWI’s share price increased 14.5% over the fourth quarter.
Subsequent to the end of the quarter, MWI was purchased by a drug
wholesaler. We discuss this transaction in the M&A Activity section
of this newsletter.
VCA has experienced a trend of increasing EBITDA multiple during
the last four quarters. VCA’s improved profitability contributed to its
multiple expansion. MWI’s expanded EBITDA multiple is largely a
factor of its share price (and thus its market capitalization) recovering
to its original levels following the April price drop.
Change from Beginning of Period
Veterinary LTM Stock Performance
70.0%
60.0%
50.0%
40.0%
30.0%
20.0%
10.0%
0.0%
-10.0%
-20.0%
-30.0%
Source: Bloomberg
WOOF
MWIV
Trends in EBITDA Pricing Multiples
Q1 2014
Q2 2014
Q3 2014
Q4 2014
VCA, Inc. (WOOF)
10.24
10.67
11.36
13.42
MWI Vet Supply (MWIV)
10.67
11.36
13.42
17.03
Pet Smart (PETM)
7.42
6.55
7.53
8.63
PetMed Express (PETS)
7.70
8.19
7.82
8.39
nm
40.12
14.17
17.37
Zoetis, Inc. (ZTS)
13.90
14.97
16.55
18.15
IDEXX Laboratories (IDXX)
19.92
21.31
18.34
21.82
nm
nm
13.08
15.47
Heska, Inc. (HSKA)
Phibro Animal Health (PAHC)
Abaxis, Inc. (ABAX)
24.36
31.60
33.08
33.77
Aratana Therapeutics (PETX)
nm
nm
nm
nm
Parnell Pharmaceuticals (PARN)
nm
nm
nm
nm
Source: Capital IQ
Presented pricing multiples represent enterprise value relative to EBITDA from the prior twelve months
EBITDA: Earnings before interest, taxes, depreciation, and amortization
© 2015 Mercer Capital
2
www.mercercapital.com
Mercer Capital’s Value Focus: Animal Health Industry
First Quarter 2015
M&A Activity
Recently the veterinary services sector has seen a trend toward
consolidation. As technology improves, the appeal of state-ofthe-art facilities is attracting veterinarians to multi-doctor practices
which can afford the new technology.
125 Camp Bow Wow locations in 37 states and Canada. D.O.G.
generated revenue of $6.8 million in 2013. Total consideration paid
for D.O.G. totaled $18.8 million, implying a revenue multiple of 2.8x
revenue. The acquisition of D.O.G. by an operator of animal hospitals
reflects the overall trend of diversification of services offered by
veterinary practices and illustrates the growing importance of
specialty pet services in the animal health industry.
The majority of M&A activity in the veterinary services industry
revolves around the consolidation of smaller veterinary practices.
Information concerning pricing and multiples for these transactions
are not often available. The recovering economy and changing
technology will contribute to continued M&A activity in the veterinary
services sector of the animal health industry. The most attractive
targets offer consistent work hours and an increased client base.
No-lo practices (vet practices with no or low profitability) can enable
buyers to expand practice size despite the low margins of the
acquired office. Many buyers become the main practitioner of the
consolidated practice.
Consolidation has occurred not only within in the industry, but also
through business combinations with companies in adjacent industries.
On January 12, 2015, AmeriSouceBergan Corp. (ABC) agreed to
purchase MWI. ABC offered $190 per share (a 7% premium to the
previous day’s closing price), resulting in a total purchase price of
$2.5 billion. This purchase price implies a revenue multiple of 0.8x
revenue and an EBITDA multiple of 18.5x EBITDA. ABC cited the
growing animal health market as a key influence in its decision to
purchase MWI. ABC will also likely experience revenue- and costsaving-synergies generated by streamlined distribution models and
improved purchasing power with suppliers. The deal closed February
23, 2015, earlier than the March close expected by analysts.
On August 1, 2014, VCA entered an agreement to acquire D.O.G.
Development, LLC, an operator and franchiser of dog boarding
and daycare services. As of September 30, 2014, D.O.G. operated
© 2015 Mercer Capital
3
www.mercercapital.com
Mercer Capital’s Value Focus: Animal Health Industry
First Quarter 2015
Trigger Events and Goodwill Impairment
In its September 2014 10-Q, VCA recorded a $130 million impairment charge related to its Vetstreet marketing and communications
reporting unit. VCA usually tests for goodwill impairment on October
31 of each year, however, VCA felt that the conditions of the Vetstreet unit triggered an interim goodwill impairment test.
ply changes, poor financial performance, or continuous but small
decreases in stock price. The loss of a key member of management, unexpected and significant litigations, and changing regulations can also trigger impairment tests. A trigger event does not
imply goodwill impairment – it merely acknowledges the possibility
of impairment having occurred.
Typically, goodwill impairment testing is an annual process. Companies can opt for either the standard Step 1 or the more qualitative Step 0 processes, both of which require more in-depth testing
if impairment is suspected. However, in addition to the annual tests
required by accounting standards, companies may also need to preform interim goodwill tests as a result of certain “trigger” events.
Although a significant decline in stock price is the most common
triggering event, other triggers include changes in the macroeconomic environment, changes in the overall industry, significant sup-
VCA noted that Vetstreet was in the process of an operational overhaul designed to make the reporting unit more competitive. Several of the changes to the reporting unit were not deployed on the
schedule initially planned. Due to the changes in the overhaul and
increased competition, Vetstreet was unable to meet several of its
performance targets and had difficulty bringing new products to clients. Accordingly, VCA felt that this particular set of conditions comprised a triggering event.
Sector Outlook
The veterinary industry faces competition from retail stores such
as Pet Smart, which are increasingly offering full-service veterinary
hospitals in existing storefronts. Additionally, some pet stores are
offering in-store vaccinations. As traditional vets expand their practices to compete with in-store clinics, emergency and specialty vets
will face increased competition. However, the improving economy
© 2015 Mercer Capital
will increase households’ demand for services. In December 2014,
the unemployment rate dropped to pre-recession levels. Although
income growth remains weak, improved economic conditions may
spur increased spending on pet products and services. The Wall
Street Journal estimates that veterinary spending on pets has grown
at a 6% annual rate during the past seven years.
4
www.mercercapital.com
Mercer Capital’s Value Focus: Animal Health Industry
First Quarter 2015
Publicly Traded Animal Health Companies
Company Name
Ticker
31-Dec
Price
($)
52 Wk
Perform
(%)
Sales ($)
Enterprise
Value ($M)
Debt/
Equity
EBITDA
Margin
EV/
EBITDA
(x)
EV / Next
Yr EBITDA
(x)
P/E
(x)
Veterinary Services
VCA Inc.
WOOF
48.77
55.5%
85.29
8,602.51
13.7%
17.1%
15.07
12.62
32.95
MWI Veterinary Supply, inc.
MWIV
169.91
0.0%
12.91
4,820.10
3.4%
4.3%
17.53
16.02
30.07
109.34
27.7%
49.10
6,711.31
8.6%
10.7%
16.30
14.32
31.51
Median-Veterinary Services
Pet Retail
PetSmart Inc
PETM
81.30
13.0%
7,003.05
8,602.51
6.1%
13.39%
9.18
8.94
19.26
PetMed Express Inc
PETS
14.37
-9.1%
228.84
291.26
0.0%
11.81%
10.78
10.34
16.91
47.83
2.0%
3,615.94
4,446.89
3.0%
12.6%
9.98
9.64
18.09
Median-Pet Retail
Animal Pharmaceuticals and Biotech
Heska Corp
HSKA
18.13
107.9%
89.02
108.23
2.1%
8.19%
14.85
11.27
37.77
Zoetis Inc
ZTS
43.03
nm
4,719.00
25,218.45
14.5%
23.99%
22.28
17.27
38.42
IDEXX Laboratories Inc
IDXX
148.27
39.4%
1,487.92
7,881.70
9.2%
23.11%
22.92
19.68
38.61
Abaxis Inc
ABAX
56.83
42.9%
184.27
1,280.51
0.0%
19.18%
36.23
31.21
74.78
Aratana Therapeutics Inc
PARN
4.15
nm
6.90
30.16
92.5%
nm
nm
nm
nm
PetMed Express Inc
PETS
14.37
-9.1%
228.84
291.26
0.0%
11.81%
10.78
10.34
16.91
Parnell Pharmaceuticals
Holdings Ltd
PARN
$4.15
nm
6.90
30.16
92.5%
nm
nm
nm
nm
18.13
41.2%
184.27
291.26
9.2%
19.2%
22.28
17.27
38.42
Median- Animal Pharm & Biotech
Source: Bloomberg
Note: Aratana’s and Parnell’s recent IPOs have resulted in nonmeaningful multiples and ratios in the short term.
Median Percent Change in LTM Stock Prices by Industry Segment
50.0%
Change from Beginning of Period
40.0%
30.0%
20.0%
10.0%
0.0%
-10.0%
-20.0%
-30.0%
1/2/14
Source: Bloomberg
© 2015 Mercer Capital
2/2/14
3/2/14
4/2/14
5/2/14
6/2/14
7/2/14
Veterinary
Pharma
5
8/2/14
9/2/14
10/2/14
11/2/14
12/2/14
Retail
www.mercercapital.com
BUSINESS VALUATION &
FINANCIAL ADVISORY SERVICES
Mercer
Capital
Animal Health Industry
Services
Mercer Capital has expertise providing business
valuation and financial advisory services to companies
in the animal health industry.
Industry Segments
Mercer Capital serves the following industry segments:
•
•
•
General, Specialty, and Emergency Care
Pharmaceutical & Biotechnology
Retail and Pet Services
Services Provided
•
•
•
•
•
Valuation of animal health companies and veterinary practices
Transaction advisory for mergers and acquisitions
Valuations for purchase accounting and impairment testing
Fairness and solvency opinions
Litigation support for economic damages and valuation and shareholder disputes
Contact a Mercer Capital professional to discuss your needs in confidence.
Contact Us
Nicholas J. Heinz, ASA
901.322.9788
[email protected]
Samantha L. Albert
901.322.9702
[email protected]
Mercer Capital
5100 Poplar Avenue, Suite 2600
Memphis, Tennessee 38137
901.685.2120 (P)
www.mercercapital.com
Copyright © 2015 Mercer Capital Management, Inc. All rights reserved. It is illegal under Federal law to reproduce this publication or any portion of its contents without the publisher’s permission. Media
quotations with source attribution are encouraged. Reporters requesting additional information or editorial comment should contact Barbara Walters Price at 901.685.2120. Mercer Capital’s Industry
Focus is published quarterly and does not constitute legal or financial consulting advice. It is offered as an information service to our clients and friends. Those interested in specific guidance for legal or
accounting matters should seek competent professional advice. Inquiries to discuss specific valuation matters are welcomed. To add your name to our mailing list to receive this complimentary publication,
visit our web site at www.mercercapital.com.
Mercer Capital’s Value Focus: Animal Health Industry
First Quarter 2015
Fairness Opinions
Evaluating a Buyer’s Shares from the
Seller’s Perspective
M&A activity in the U.S. (and globally) has accelerated in 2014 after
years of gradual improvement following the financial crisis. According to Dealogic, M&A volume where the target was a U.S. company
totaled $1.4 trillion YTD through November 10, the highest YTD volume on record and up 43% from the same period last year. Excluding cross-border acquisitions, domestic-only M&A was $1.1 trillion,
which represented the second highest YTD volume since 1999 and
up 27% from last year. Healthcare and telecommunications were the
first and second most targeted sectors.
to achieve a targeted dollar value. As such, it is no surprise that the
extended rally in equities has supported deal activity this year. However, high multiple stocks may represent an under-appreciated risk
to sellers who receive the shares as consideration. Accepting the
buyer’s stock raises a number of questions, most which fall into the
genre of: what are the investment merits of the buyer’s shares? The
answer may not be as obvious as it seems, even when the buyer’s
shares are actively traded.
Our experience is that some, if not most, members of a board weighing an acquisition proposal do not have the background to thoroughly evaluate the buyer’s shares. Even when financial advisors
are involved there still may not be a thorough vetting of the buyer’s
shares because there is too much focus on “price” instead of, or in
addition to, “value.”
The improvement has taken a long time even though corporate cash
is high, financing costs are very low and organic revenue growth
in most industries has been sluggish. Aside from improving confidence, another key foundation for increased M&A activity fell into
place in 2013 when equity markets staged a strong rally as the S&P
500 rose 30% (32% with dividends) and the Russell 2000 increased
37% (39%). The absence of a meaningful pullback in 2014 and a
12% advance in the S&P 500 and 2% in the Russell 2000 have further supported activity.
A fairness opinion is more than a three or four page letter that opines
as to the fairness from a financial point of a contemplated transaction; it should be backed by a robust analysis of all of the relevant
factors considered in rendering the opinion, including an evaluation
of the shares to be issued to the selling company’s shareholders.
The intent is not to express an opinion about where the shares may
trade in the future, but rather to evaluate the investment merits of the
shares before and after a transaction is consummated.
The rally in equities, like low borrowing rates, has reduced the cost
to finance acquisitions because the majority of stocks experienced
multiple expansion rather than material growth in EPS. It is easier for
a buyer to issue shares to finance an acquisition if the shares trade
at rich valuation than issuing “cheap” shares. As of November 24,
the S&P 500’s P/E based upon trailing earnings (as reported) was
20.0x compared to 18.2x at year-end 2013, 17.0x at year-end 2012
and 14.9x at year-end 2011. The long-term average P/E since 1871
is 15.5x (Source: http://www.multpl.com).
Key questions to ask about the buyer’s shares include the following:
• Liquidity of the Shares. What is the capacity to sell the
shares issued in the merger? SEC registration and even NASDAQ and NYSE listings do not guarantee that large blocks can
be liquidated efficiently. Generally, the higher the institutional
ownership, the better the liquidity. Also, liquidity may improve
High multiple stocks can be viewed as strong acquisition currencies
for acquisitive companies because fewer shares have to be issued
© 2015 Mercer Capital
7
www.mercercapital.com
Mercer Capital’s Value Focus: Animal Health Industry
First Quarter 2015
• Consensus Analyst Estimates. If the buyer is publicly
traded and has analyst coverage, consideration should be
given to Street expectations vs. what the diligence process
determines. If Street expectations are too high, then the
shares may be vulnerable once investors reassess their
earnings and growth expectations.
with an acquisition if the number of shares outstanding and
shareholders increase sufficiently.
• Profitability and Revenue Trends. The analysis should consider the buyer’s historical growth and projected growth in revenues, and operating earnings, (usually EBITDA or EBITDA
less capital expenditures) in addition to EPS. Issues to be
vetted include customer concentrations, the source of growth,
the source of any margin pressure and the like. The quality of
earnings and a comparison of core vs. reported earnings over
a multi-year period should be evaluated.
• Valuation. Like profitability, valuation of the buyer’s shares
should be judged relative to its history and a peer group presently as well as relative to a peer group through time to examine how investors’ views of the shares may have evolved
through market and profit cycles.
• Pro Forma Impact. The analysis should consider the impact
of a proposed transaction on revenues, EBITDA, margins, EPS
and capital structure. The per share accretion and dilution
analysis of such metrics as earnings, EBITDA and dividends
should consider both the buyer’s and seller’s perspectives.
• Share Performance. Sellers should understand the source of
the buyer’s shares performance over several multi-year holding periods. For example, if the shares have significantly outperformed an index over a given holding period, is it because
earnings growth accelerated? Or, is it because the shares were
depressed at the beginning of the measurement period? Likewise, underperformance may signal disappointing earnings, or
it may reflect a starting point valuation that was unusually high.
• Dividends. In a yield starved world, dividend paying stocks
have greater attraction than in past years. Sellers should not
be overly swayed by the pick-up in dividends from swapping
into the buyer’s shares; however, multiple studies have demonstrated that a sizable portion of an investor’s return comes from
dividends over long periods of time. If the dividend yield is notably above the peer average, the seller should ask why? Is it
payout related, or are the shares depressed? Worse would be
if the market expected a dividend cut. These same questions
should also be asked in the context of the prospects for further
increases.
• Strategic Position. Assuming an acquisition is material for
the buyer, directors of the selling board should consider the
strategic position of the buyer, asking such questions about
the attractiveness of the pro forma company to other acquirers.
• Contingent Liabilities. Contingent liabilities are a standard
item on the due diligence punch list for a buyer. Sellers should
evaluate contingent liabilities too.
• Capital Structure. Does the acquirer operate with an appropriate capital structure given industry norms, cyclicality of the
business and investment needs to sustain operations? Will
the proposed acquisition result in an over-leveraged company,
which in turn may lead to pressure on the buyer’s shares and/
or a rating downgrade if the buyer has rated debt?
The list does not encompass every question that should be asked as
part of the fairness analysis, but it does illustrate that a liquid market
for a buyer’s shares does not necessarily answer questions about
value, growth potential and risk profile.
We at Mercer Capital have extensive experience in valuing and evaluating the shares (and debt) of financial and non-financial service
companies garnered from over three decades of business. Feel free
to contact us to discuss your situation in confidence.
• Balance Sheet Flexibility. Related to the capital structure
should be a detailed review of the buyer’s balance sheet that
examines such areas as liquidity, access to bank credit, and
the carrying value of assets such as deferred tax assets.
• Ability to Raise Cash to Close. What is the source of funds
for the buyer to fund the cash portion of consideration? If the
buyer has to go to market to issue equity and/or debt, what is
the contingency plan if unfavorable market conditions preclude
floating an issue?
© 2015 Mercer Capital
Jeff K. Davis, CFA
[email protected]
8
www.mercercapital.com


© Copyright 2026