
INDIA COUNTRY REPORT 2005
INDIA COUNTRY REPORT 2005 MILLENNIUM DEVELOPMENT GOALS INDIA COUNTRY REPORT 2005 Government of India Ministry of Statistics and Programme Implementation Central Statistical Organisation Sardar Patel Bhavan, Sansad Marg New Delhi - 110 001 http://www.mospi.nic.in December 2005 MILLENNIUM DEVELOPMENT GOALS Contents Subject Page Foreword i Preface iii Introduction 15 Goal 1 Eradicate Extreme Poverty and Hunger 21 Goal 2 Achieve Universal Primary Education 31 Goal 3 Promote Gender Equality and Empower Women 39 Goal 4 Reduce Child Mortality 46 Goal 5 Improve Maternal Health 55 Goal 6 Combat HIV / AIDS, Malaria and TB 65 Goal 7 Ensure Environmental Sustainability 75 Goal 8 Develop a Global Partnership for Development 93 Annex I: List of Goals, Targets and Indicators 107 Annex II: Concepts, Definitions and Methodologies 113 References 121 INDIA COUNTRY REPORT 2005 List of Tables Number 1: Page Progress towards achieving MDGs in India 20 1.1: Indicators relating to Poverty and Hunger 23 2.1: Indicators relating to enrolment and literacy 33 3.1: Indicators relating to primary, secondary and higher education and women empowerment 41 4.1: Infant mortality rate by sex 50 4.2: Infant mortality rate by rural-urban 51 5.1: Causes of maternal mortality 57 5.2: Proportion of antenatal care and safe deliveries 58 5.3: Medical termination of pregnancy performed 59 5.4: Institutional deliveries and births attended by skilled health personnel 64 6.1: Indicators relating to HIV/ AIDS 68 6.2: Annual parasite incidence and death rate 69 6.3: Malaria epidemiological situation 70 6.4: DDCs/ FTBs established/ functioning - 1997-2003 71 6.5: Percentage of population in high risk areas covered by indoor residual spray 71 6.6: Percentage of TB patients treated 73 7.1: Commercial energy use in kg. oil equivalent 80 7.2: Proportion of population with access to an improved water source and sanitation 80 8.1: PC population and in use per 100 population 100 8.2: Status of Internet subscribers 100 MILLENNIUM DEVELOPMENT GOALS List of Graphs Number 1. 2. 3. 4. 5. 6. 7. 8. 9. 10. 11. 12. 13. 14. 15. 16. 17. 18. 19. 20. 21. 22. 23. 24. Population below poverty line Poverty Gap Ratio Literacy rate (age 7 and above) Literacy ratio of women to men in India Ratio of girls to boys in primary, secondary and tertiary education Under five mortality rate by residence and sex Infant mortality rate by sex Infant mortality rate by rural-urban Proportion of 1 year old children immunized against measles Causes of maternal mortality in India Antenatal care and safe deliveries Institutions approved for MTP and termination done Proportion of births attended by skilled health personnel Annual parasite incidence rate per thousand population from 1990 to 2004 Death rate per 100, 000 population from 1990 to 2004 Malaria epidemiological situation (1990-2004) Percentage of population in high risk areas covered by indoor residual spray Proportion of population using solid fuels Proportion of population with sustainable access to water source Individual household latrines Teledensity in India Total number of phones (fixed + WLL+CMPS) PCs in use per 100 population Internet users and internet subscribers in India INDIA COUNTRY REPORT 2005 Page 24 25 34 41 42 49 50 51 52 57 58 59 64 69 70 71 72 79 81 88 98 99 100 101 List of Photos Number 1 Page ZILLA PANCHAYATH DHARWAD - Works converged under various schemes (SGRY, Jala Rakshana, Water harvesting structures) in Navalgund block, Dharwad District, Karnataka 22 2 Water harvesting structure under National Food for Work Programme in Tamil Nadu 26 3 Road constructed through SGRY 26 4 Road under Pradhan Mantri Gram Sadak Yojana 5 Mid-Day Meal Scheme 30 6 Child Health Programme 35 7 Immunization Programme 51 8 National Rural Health Mission (NRHM) 53 9 Accredited Social Health Activist (ASHA) 62 10 Semi-evergreen Forest of Western Ghats is unique forest ecosystem and biodiversity 76 11 Protected Sunderbans Biosphere Reserve, West Bengal with luxuriant mangrove forest and home to many endangered flora and fauna. 77 12 Piped water supply in rural areas 83 13 Drinking water supply in rural schools 85 14 Handpump with platform and drainage 85 15 Freedom from drudgery of fetching water brings smile 85 16 Sanitary pan being laid under Total Sanitation Campaign 89 17 Community Information Cetnre 94 18 Digital Village 96 19 ITES-BPO sector 101 20 Dak Net Concept 102 MILLENNIUM DEVELOPMENT GOALS List of Abbreviations AAY ABER AIDS AIE ANMs ARI ARTI ASHA AUWSP Antyodaya Anna Yojana Annual Blood Smear Examination Rate Acquired Immunodeficiency Syndrome Alternative and Innovative Education Auxiliary Nursing Midwives Acute Respiratory Infections Annual Risk of TB Infection Accredited Social Health Activist Accelerated Urban Water Supply Programme BPL BPO BSC BSE BSNL BSS Below Poverty Line Business Process Outsourcing Blood Smear Collected Blood Smear Examined Bharat Sanchar Nigam Limited Behavioural Sentinel Surveillance Survey CCD CDSs CFCs CHCs CIC CPIAL CPIIW CPP CSSM Communication and Capacity Development Community Development Societies Chlorofluoro Carbons Community Health Centres Community Information Centre Consumer Price Index numbers for Agricultural Labourer Consumer Price Index numbers for Industrial Workers Calling Party Pays Child Survival and Safe Motherhood DDC DDP DLHS DPAP DWCUA Drug Distribution Centre Desert Development Programme District Level Rapid Household Survey Drought Prone Areas Programme Development of Women and Children in Urban Areas DWSM District Water and Sanitation Mission EAG EGS Empowered Action Group Education Guarantee Scheme FDI FFW FIRE FRU Foreign Diect Investment Food for Work Financial Institutions Reform and Expansion First Referral Unit INDIA COUNTRY REPORT 2005 FTD Fever Treatment Depot GATS GDP GER General Agreement on trade and Services Gross Domestic Product Gross Enrolement Ratio GHGs GNI GoAP Green House Gases Gross National Income Government of Andhra Pradesh HIPC HIV Heavily Indebted Poor Countries Human Immunodeficiency Virus IAY ICDS ICT IEA IEC IFF IMNCI IMR ISM IPHS ISP IT Indira Awaas Yojana Integrated Child Development Services Information and Communication Technology International Energy Agency Information Education and Communication International Financing Facility Integrated Management of Neonatal and Childhood Illnesses Infant Mortality Rate India System of Medicine Indian Public Health Standards Internet Service Provider Information Technology ITES IUC IWDP IT enabled Services Interconnection Usage Charges Integrated Wasteland Development Programme J&K Jammu & Kashmir KGBV Kasturba Gandhi Balika Vidyalaya LPG Liquified Petroleum Gas MBBS MDG MMR MMS MNES MoU MS MTP Bachelor of Medicine and Bachelor of Surgery Millenium Development Goals Maternal Mortality Rate Mid-Day Meal Scheme Ministry of Non Conventional Energy Sources Memorandum of Understanding Mahila Samakhya Medical Termination of Pregnancy NA NACO Not Available National AIDS Control Organization MILLENNIUM DEVELOPMENT GOALS NACP NCHS NER NFHS NGO NLD NLM NNF NPEGEL NPP NRHM NSDP NSP NSSO NTADCL NTCP NTI NTP NURM NVBDCP NWDPRA National AIDS Control Programme National Centre for Health Statistics Net Enrolment Ratio National Family Health Survey Non-Governmental Organization National Long Distance National Literacy Mission National Neonatalogy Forum National Programme for Education of Girls at Elementary Level National Population Policy National Rural Health Mission National Slum Development Programme New Smear Positive National Sample Survey Organization New Tirupur Area Development Corp. Ltd National Tuberculosis Control Programme National Tuberculosis Institute National Telecom Policy National Urban Renewal Mission National Vector Borne Disease Control Programme National Wastershed Development Project in Rainfed Areas OBC ODA ODP ODS Other Backward Classes Official Development Assistance Ozone Depleting Potential Ozone Depleting Substances PC PCO PDS PESA PF PGR PHC PNDT PPP PRI Personal Computer Public Call Office Public Distribution System The Provisions of the Panchayats (Extension to the Scheduled Areas) Act Plasmodium Falciparum Poverty Gap Ratio Primary Health Centre Pre-natal Diagnostic Technique Purchasing Power Parity Panchayati Raj Institutions R&D RCH RCP RHS RNTCP RWS Research and Development Reproductive and Child Health Programme Rural Community Phones Rapid Household Survey Revised National Tuberculosis Control Programme Rural Water Supply SACS State AIDS Control Sites INDIA COUNTRY REPORT 2005 SC SFR SGRY SGSY SHG SJSRY SPR SRP SRS SSA SSI SSY ST SWAN SWSM Scheduled Caste Slide Falciparum Rate Sampoorna Grameen Rozgar Yojana Swaranjayanti Gram Swarozgar Yojana Self Help Group Swaran Jayanti Shahari Rozgar Yojana Slide Positivity Rate Sector Reform Projects Sample Registration Scheme Sarva Shiksha Abhiyan Small Scale Industries Sujalam Suphalam Yojana Scheduled Tribe State Wide Area Network State Water and Sanitation Mission TB TBA TDSAT TEA TFR TPDS TRAI TRC TSC Tuberculosis Trained Birth Attendants Telecom Dispute Settlement and Appellate Tribunal Tirupur Exporters Association Total Fertility Rate Targeted Public Distribution System Telecom Regulatory Authority of India Tuberculosis Research Centre Total Sanitation Campaign U5MR UGC UIDSSMT UIP ULB UN UNICEF USEP USOF UT UWEP Under Five Mortality Rate University Grants Commission Urban Infrastructure Development Scheme for Small and Medium Towns Universal Immunization Programme Urban Local Bodies United Nations United Nations International Childrens Fund Urban Self-Employment Programme Universal Service Obligation Fund Union Territory Urban Wage Employment Programme VAMBAY VIWSCO VPT VSAT VWSC Valmiki Ambedkar Awaas Yojana Visakhapatnam Industrial Water Supply Company Village Public Telephone Very Small Aperture Terminal Village Water and Sanitation Committee WHO World Health Organisation WTO World Trade Organisation MILLENNIUM DEVELOPMENT GOALS vkWLdj iQukZafMl OSCAR FERNANDES Foreword jkT; ea=kh (Lora=k izHkkj) ;qok dk;Z vkSj [ksy] izoklh Hkkjrh; dk;Z vkSj lkaf[;dh vkSj dk;ZØe dk;kZUo;u Hkkjr ljdkj] ubZ fnYyh MINISTER OF STATE (INDEPENDENT CHARGE) YOUTH AFFAIRS & SPORTS, OVERSEAS INDIAN AFFAIRS AND STATISTICS & PROGRAMME IMPLEMENTATION GOVERNMENT OF INDIA, NEW DELHI T I his Status Report on Millennium Development Goals for India is first of its kind and evaluates the progress so far made from the base year 1990. This report also highlights the strategies developed towards the attainment of the Goals in 2015. ndia is currently on track in respect of eradicating extreme poverty and hunger (reduction of proportion of people below poverty line) with sustainable access to safe drinking water in the country and basic sanitation in urban areas. With our current national policy interventions and initiatives in core human development areas, we are moving in the direction of achieving all the goals much earlier than 2015. Considering the vastness and complexities of our nation, present achievement is remarkable. T he reservation of one-third seats in local government institutions has resulted in over a million women participating actively at the grass root political processes. Many of the goals, targets, and indicators touch on the basic quality of human lives. We are happy that our country is marching well in that regard. This baseline report captures in good measures the real and positive changes taking place in peoples lives in India. I wish to keep on record my thanks for the able guidance of Mr. P. S. Rana, Secretary, Ministry of Statistics and Programme Implementation and an InterMinisterial Expert committee and the team responsible for the preparation of the Report, especially Dr. R. C. Panda, Additional Secretary, Mr. J. Dash, Deputy Director General and Mr. S. K. Gupta, Director, Central Statistical Organisation, for their invaluable efforts to prepare this MDG Report. I also appreciate the officers of the Planning Commission and the Ministries concerned for their valuable contributions. December 25, 2005 INDIA COUNTRY REPORT 2005 OSCAR FERNANDES i ii MILLENNIUM DEVELOPMENT GOALS ih- ,l- jk.kk lfpo P. S. RANA SECRETARY Preface Hkkjr ljdkj lkaf[;dh ,oa dk;ZØe dk;kZUo;u ea=kky; ljnkj iVsy Hkou] laln ekxZ ubZ fnYyh&110001 GOVERNMENT OF INDIA MINISTRY OF STATISTICS AND PROGRAMME IMPLEMENTATION SARDAR PATEL BHAVAN, SANSAD MARG NEW DELHI-110001 iQksu@TEL: (11) 23742150 iQSDl@FAX : (11) 23742067 T his Report on the Millennium Development Goals (MDGs) captures Indias achievements, challenges and policies with reference to the goals and targets set at the United Nations Millennium Summit held in September 2000, wherein 189 Heads of States pledged to adopt new measures in the fight against poverty, hunger, illiteracy, gender inequality, diseases and environmental degradation. M inistry of Statistics and Programme Implementation has been coordinating the MDG monitoring system. In order to achieve the task of statistical reporting on indicators for monitoring the progress of MDGs, it was essential to arrive at a consensus on the data used and accordingly a consultation process involving the line Ministries/ Departments concerned was set in motion through an Inter Ministerial Expert Committee set up in November 2004. There are many source agencies which provided statistical information and materials on various policy initiatives taken to achieve the Goals for preparing this report. These include Planning Commission, Registrar General and Census Commissioner, National Sample Survey Organisation, and Ministries of Finance, Agriculture and Cooperation, Coal, Petroleum and Natural Gas, Power, Urban Development, Urban Employment and Poverty Alleviation, Rural Development, Water Resources, Environment and Forests, Health and Family Welfare, Human Resource Development, and Communications and Information Technology. The consultation took into account the national development priorities embodied in the National Common Minimum Programme and the Tenth Plan. It also used consistent data available on various indicators. A fter considerable deliberations, it was found that some of the indicators could be better presented in a manner different from the ones specified under MDGs. In case of some of the indicators, the non-availability of sufficiently reliable data is the reason for dropping them. Those indicators are proportion of iii INDIA COUNTRY REPORT 2005 population below $1 (PPP) per day, proportion of population below minimum level of dietary energy consumption, ratio of school attendance of orphans to school attendance of non-orphans aged 10-14 years, maternal mortality ratio, proportion of population with access to secure tenure, unemployment rate of young people aged 15-24 years and proportion of population with access to affordable essential drugs on a sustainable basis. T he Millennium Development Goals are inter-linked. For example, achievement of the gender equality is dependent on the integration of gender equality targets within each of the MDGs. The MDGs recognize the centrality of gender equality in the development agenda and set measurable time-bound goals on commitments. Gender equality is at the core of achievement of MDGs - from improving health and fighting disease, to reducing poverty and mitigating hunger, to expanding education and lowering child mortality, to increasing access to safe drinking water, to ensuring environmental sustainability. T he MDGs rely heavily on the use of reliable data. The targets and indicators are all statistically measurable, using data that are comparable across countries and regions. Achievement of goals numerically, however, may mask continued inequalities. This report takes into account all these factors and limitations. The concepts, definitions and methodologies adopted in the report are given in the form of Annexure. I place on record the valuable services rendered by the team led by Dr. R.C. Panda, Additional Secretary in the Ministry of Statistics and Programme Implementation in bringing out this report. Shri Jogeswar Dash, Deputy Director General and Shri S. K. Gupta, Director in the Central Statistical Organization of this Ministry deserve my sincere appreciation for their contribution in bringing out this first report on MDGs. December 25, 2005 iv P. S. Rana INTRODUCTION INTRODUCTION INTRODUCTION 16 MILLENNIUM DEVELOPMENT GOALS The Millennium Declaration adopted by the General Assembly of the United Nations in September 2000 reaffirmed its commitment to the right to development, peace, security and gender equality, to the eradication of many dimensions of poverty and to overall sustainable development. Heads of States at the General Assembly of the United Nations pledged to adopt new measures and join efforts in the fight against poverty, illiteracy, hunger, lack of education, gender inequality, infant and maternal mortality, disease and environmental degradation. The Millennium Declaration adopted eight development goals and eighteen timebound targets. ! provide relevant and robust measures of progress towards the targets of the Millennium Development Goals, ! be clear and straightforward to interpret and provide a basis for international comparison, ! be broadly consistent with other global lists and avoid imposing an unnecessary burden on country teams, Governments and other partners, ! be based, to the greatest extent possible, on international standards, recommendations and best practices, and ! be constructed from well-established INTRODUCTION INTRODUCTION The Goals are : 1. 2. 3. 4. 5. 6. 7. Eradicate extreme poverty and hunger Achieve universal primary education Promote gender equality and empower women Reduce child mortality Improve maternal health Combat HIV/ AIDS, malaria and other diseases Ensure environmental sustainability 8. Develop a global partnership for development 2. In order to monitor the progress towards the goals and targets, the United Nations system, including the World Bank, the International Monetary Fund and other agencies came together and agreed on 48 quantitative indicators. The list of Goals, Targets and Indicators for monitoring the progress is given in Annex - I. 3. A five-fold criteria guided the selection of the indicators. These indicators should: data sources, be quantifiable and be consistent to enable measurement over time. 4. The Goals, targets and indicators are meant to stimulate swift and effective action; to achieve the development and poverty eradication aims of the Declaration; and to provide concrete measurements of the progress the countries are making towards achieving the Goals. This Report follows those guiding principles. 17 INDIA COUNTRY REPORT 2005 INTRODUCTION 18 Indias Tenth Five Year Plan Targets 5. The Tenth Plan (2002-07) has taken note of the MDGs and included a number of targets to be achieved during the Plan period. These targets generally aim higher accomplishments than those targeted in MDGs. Monitorable Targets for the Tenth Plan and beyond ! Reduction of poverty ratio by 5 percentage points by 2007 and by 15 percentage points by 2012, ! Providing gainful and high quality employment at least to addition to the labour force over the Tenth Plan period; ! All children in school by 2003; all children to complete 5 years of schooling by 2007; ! Reduction in gender gaps in literacy and wage rates by at least 50 percent by 2007; ! Reduction in the decadal rate of population growth between 2001 and 2011 to 16.2 percent; ! Increase in literacy rates to the level of 75 percent within the plan period; ! Reduction of infant mortality ratio to 45 per 1000 live births by 2007 and to 28 by 2012; ! Reduction of Maternal Mortality Ratio to 2 per 1000 live births by 2007 and 1 by 2012; ! Increase in forest and tree cover to 25 percent by 2007 and 33 percent by 2012; ! All villages to have sustained access to potable drinking water within the Plan period; ! Cleaning of all major polluted rivers by 2007 and other notified stretches by 2012. 6. The picture that emerged after the consultation reveals that there are substantial improvements in the lives of people over the years. This has been possible due to the planned implementation of programmes, despite the enormous and complex problems and diversities of our nation. The Central and State Governments have set up goals more ambitious than the MDGs. With the well thought out planning; comprehensive development strategies devised in the national policy; and matching implementation process, it is hoped that India will be able to meet the challenges and achieve all the MDG targets much earlier than the targeted dates. Taking into account the latest data availability, Indias position, in brief, with reference to the various Goals is indicated below: " To achieve MDG 1, India must reduce by 2015 the proportion of people below poverty line from nearly 37.5 percent in 1990 to about 18.75 percent. As on 19992000, the poverty headcount ratio is 26.1 percent with poverty gap ratio of 5.2 percent, share of poorest quintile in national consumption is 10.1 percent for rural sector and 7.9 percent for urban sector and prevalence of underweight children is of the order of 47 percent. " To achieve MDG 2, India must increase the primary school enrolment rate to 100 percent and wipe out the drop-outs by 2015 against 41.96 percent in 1991-92. The drop-out rate for primary education during 2002-03 is 34.89 percent. The gross enrolment ratio in primary education has tended to remain near 100 percent for boys and recorded an increase of nearly 20 percentage points in the ten years period from 1992-93 to 2002-03 for girls (93 percent). The literacy rate (7 years and above) has also increased from 52.2 MILLENNIUM DEVELOPMENT GOALS " To ensure gender parity in education levels under MDG 3, India will have to promote female participation at all levels to reach a female male proportion of equal level by 2015. The female male proportion in respect of primary education was 71:100 in 1990-91 which has increased to 78:100 in 2000-01. During the same period, the proportion has increased from 49:100 to 63:100 in case of secondary education. " MDG 4 indicates that under five mortality rate (U5MR) must be reduced from 125 deaths per thousand live births in 1988-92 to 41 in 2015. The value of U5MR has decreased during the period 1998-2002 to 98 per thousand live births. The infant mortality rate has also come down from 80 per thousand live births in 1990 to 60 per thousand in 2003 and the proportion of 1 year old children immunised against measles has increased from 42.2 percent in 1992-93 to 59.0 percent in 200203. " To achieve MDG 5, India must reduce maternal mortality (MMR) from 437 deaths per 100,000 live births in 1991 to 109 by 2015. The value of MMR for 1998 is 407. The proportion of births attended by skilled health personnel is continuously increasing (from 25.5 percent in 1992-93 to 39.8 percent in 2002-03), thereby reducing the chances of occurrence of maternal deaths. " Though India has a low prevalence of HIV among pregnant women as compared to other developing countries, yet the prevalence rate has increased from 0.74 per thousand pregnant women in 2002 to 0.86 in 2003. This increasing trend needs to be reversed to achieve MDG 6. The prevalence and death rates associated with malaria are consistently coming down. The death rate associated with TB has come down from 56 deaths per 100,000 population in 1990 to 33 per 100,000 population in 2003. The proportion of TB patients successfully treated has also risen from 81% in 1996 to 86% in 2003. " For achieving MDG 7, there is an increasing trend of total land area covered under different forests (20.64% as per 2003 assessment) due to Governments persistent efforts to preserve the natural resources. The reserved and protected forests together account for 19% of the total land area to maintain biological diversity. The energy use has declined consistently from about 36 kilogram oil equivalent in 1991-92 to about 33 kilogram oil equivalent in 2003-04 to produce GDP worth Rs. 1000. The proportion of population without sustainable access to safe drinking water and sanitation is to be halved by 2015 and India is on track to achieve this target. " With regard to MDG 8, the overall tele-density has increased from 0.67 percent in 1991 to10.87 percent in Nov. 2005. Use of Personal Computers has also increased from 5.4 million PCs in 2001 to 14.5 million in 2005 and there are 5.6 million internet subscribers as on June 2005 (2.3 internet users and 0.5 internet subscribers per 100 population). INTRODUCTION percent in 1991 to 64.84 percent in 2000-01. 19 INDIA COUNTRY REPORT 2005 INTRODUCTION 7. The Table 1 provides values of the MDG indicators for available periods. Table 1 Progress towards achieving MDGs in India Indicator Year Value Year 1 Proportion of population below poverty line (%) 1990 37.5 1999-2000 26.1 18.75 2 Undernourished people as % of total population 1990 62.2 1999-2000 53 31.1 3 Proportion of under-nourished children 1990 54.8 1998 47 27.4 4 Literacy rate of 15-24 year olds 1990 64.3 2001 73.3 100 5 6 Ratio of girls to boys in primary education Ratio of girls to boys in secondary education 1990-91 0.71 2000-01 0.78 1 1990-91 0.49 2000-01 0.63 1 7 Under five mortality rate (per 1000 live births) 98 41 8 Infant Mortality rate (per 1000 live births) 1990 80 2003 60 27 9 Maternal mortality rate (per 100,000 live births) 1991 437 1998 407 109 10 Population with sustainable access to an improved water source, rural (%) 1991 55.54 2005 90 80.5 11 Population with sustainable access to an improved water source, urban (%) 1991 81.38 2001 82.22 94 12 Population with access to sanitation urban (%) 1991 47 2001 63 72 13 Population with access to sanitation rural (%) 1991 9.48 2005 32.36 72 14 Deaths due to malaria per 100,000 1994 0.13 2004 0.09 - 15 Deaths due to TB per 100,000 1999 56 2003 33 - 16 Deaths due to HIV/ AIDS 2000 471 2004 1114 - 1988-92 125 1998- 2002 Value MDG target value 8. The concepts, definitions and methodologies adopted in this report are given in Annex II. 20 MILLENNIUM DEVELOPMENT GOALS 1 GOAL GOAL 1 Eradicate Extreme Poverty and Hunger Target 1: Halve, between 1990 and 2015, the proportion of people whose income is less than one dollar a day. INDICATOR 1: Proportion of population below $ 1 purchasing power parity (PPP) per day. Poverty Headcount Ratio (Percentage of Population below the national poverty line) INDICATOR 2: Poverty Gap Ratio. INDICATOR 3: Share of Poorest Quintile in National Consumption. Target 2: Halve, between 1990 and 2015, the proportion of people who suffer from hunger. INDICATOR 4: Prevalence of underweight children under five years of age. INDICATOR 5: Proportion of population below minimum level of dietary energy consumption. INDIA COUNTRY REPORT 2005 MILLENNIUM DEVELOPMENT GOALS ZILLA PANCHAYATH DHARWAD - Works converged under various schemes (SGRY, Jala Rakshana, Water harvesting structures) in Navalgund block, Dharwad District, Karnataka Eradicate Extreme Poverty and Hunger Target 1: Halve, between 1990 and 2015, the proportion of people whose income is less than one dollar a day. 1.2. In a period of twelve years (19882000), the percentage of population below poverty line declined by 13 points. While the decline has been sharper in the urban areas, there are some differences in the pattern of decline in the two sub-periods in the rural and urban areas. Urban areas achieved greater reduction in proportion of population living in poverty during the period 1987-88 to 1993-94 than the rural areas, while in the period 1993-94 to 19992000 the decline was sharper in the rural areas (10.2 percentage points) than the urban areas (8.8 percentage points). It is important to mention that despite a reduction in the proportion of people living in poverty by over 50 per cent between 1973-74 and 1999-2000, the absolute Table 1.1 number of p o o r Indicators relating to Poverty and Hunger continued to be in Indicator 1987-88 1993-94 1999-2000 excess of 260 million Poverty Headcount Ratio Overall 38.9 36.0 26.1 in 1999Rural 39.1 37.3 27.1 2000 in view Urban 38.2 32.4 23.6 of Indias Poverty Gap Ratio l a r g e Rural 8.5 5.3 population. Urban 8.1 5.2 This number was over Share of Poorest Quintile Overall 9.2 9.5 320 million in national consumption in 1993-94. Rural 9.6 10.1 Of the 260 Urban 8.0 7.9 million persons, 193 million Source: Planning Commission and Ministry of Health & Family Welfare 1 GOAL Goal 1 1.1. Planning in India has always assigned poverty reduction as an important goal. Consequently, a number of anti-poverty programmes have been launched from time to time to reduce the incidence of poverty in the country. As a result, the incidence of poverty declined from 55 percent in 1973-74 to 26 percent in 19992000. The reduction of proportion of people living below poverty line has been particularly sharp in the 1990s, when there has been a 10 percentage points decline between 1993-94 and 1999-2000. These trends indicate that India is on track with respect to the target of halving the proportion of people below poverty line. Some of the trends have been furnished in Table 1.1 below. INDIA COUNTRY REPORT 2005 23 GOAL 1 persons lived in the rural areas. 1.3 In a country as large and as diverse as India, the aggregates tend to obscure the fact that the proportion of those living below the poverty line is not uniform throughout the country. There are States like Bihar and Orissa in the eastern parts of the country, where the poverty ratio was estimated in 1999-2000 to be over 40 per cent, while in States like Haryana, Himachal Pradesh and Punjab, the ratio is under 10 per cent. The four States of Uttar Pradesh, Bihar, Madhya Pradesh and Orissa accounted for nearly 39 percent of the total population of the country, but over 55 percent of the people below poverty line. 24 1.4 It needs to be highlighted that India is one of the very few countries that has identified different poverty lines at the subnational level. The poverty ratios are estimated for different States of the country and have State specific poverty lines for rural and urban areas separately. Such State specific poverty lines essentially reflect the differences in the cost of living in different States of the country. The implicit all India poverty line in the urban areas is nearly 40 percent higher than that in the rural areas for the year 1999-2000. The State with the highest prices has a poverty line, which is 57 per cent higher than that for the State with lowest prices despite the basket of goods and services being the same for all states of the Union. There are variations in the poverty line among the States within the country as well as between the rural and the urban areas, mainly on account of price differentials in the rural and urban areas and across States. 1.5. The importance of these regional variations in the poverty lines cannot be over-emphasized. Applying a uniform poverty line for the country as a whole would underestimate poverty levels in the urban areas and overestimate such levels in the rural areas, and would also distort the measurement of poverty in the different States. This would not only not serve much purpose from the policy point of view, but could in fact lead to gross errors in policy intervention strategies. Applying a uniform international poverty line such as US $1 (PPP) per day to estimate the proportion of people living in poverty can distort the picture further. In fact, the US $1 per day poverty line being used for the Millennium Development Goals tends to significantly overstate poverty in the country despite the fact that it is roughly equal to the weighted average of the Indian poverty lines. 1.6. The Planning Commission in the Tenth Plan (2002-07) has targeted at reducing poverty ratio by 5 percentage MILLENNIUM DEVELOPMENT GOALS 1.8. The share of poorest quintile in National consumption (consumption that is accounted for by the poorest fifth of the population) has increased from 9.2 in 1993-94 to 9.5 in 1999-2000. The phenomenon of increasing share of the poorest quintile in the total national consumption in the decade ending 2000, as compared to 1993-94, is more prominent in rural India whereas for urban India it is almost at the same level. This increase in the consumption share of the poorest quintile also reconfirms the better economic condition of the poor. Poverty Gap Ratio (PGR) 1.7. The objective of planning is to improve the lot of the poorest of the poor, and it is more than likely that the most deprived may not rise above the poverty line within the given time frame. Nevertheless, amelioration of their lot must be a focal point of public policy. It is in this context that indicators like the Poverty Gap Ratio (PGR) become important. PGR reflects the degree to which mean consumption of poor falls short of the established poverty line, indicating the depth of poverty. The PGR for the country has decreased from 8.5 to 5.3 in rural India and from 8.1 to 5.2 in urban India during 1993-94 to 1999-2000. The decline in the PGR over the period points towards better and improved economic condition of both rural and urban poor in the country. The anti-poverty programmes have helped in reducing the 10 Ratio 1 GOAL depth and severity of poverty in the country. points by 2007 and by 15 percentage points by 2012. It aims at achieving poverty ratio of 19.3% for the country as a whole by 2007, 21.1% for the rural and 15.1% for the urban areas. In absolute terms, the number of poor is projected to decline from 260 million in 1999-2000 to 220 million in 2007, with rural poor declining to 170 million and urban poor to 50 million. Poverty Alleviation in Rural Areas 1.9. The past trends regarding the condition of the poor do not entirely reflect the efforts made in this direction. It is important to consider the measures being taken to improve the condition of the poor. Poverty alleviation is of continuing relevance to Indias development since poverty levels continue to be relatively high and there is evidence of some deprivations in few areas of the country and among certain groups. The Indian anti-poverty programmes are designed to perform two functions, viz. (a) alleviate immediate deprivation by p r o v i d i n g supplementary Poverty G ap Ratio incomes; and (b) 9.6 c r e a t e 8.1 infrastructure and 5.2 other assets, which can reduce poverty 9.1 through their growth effect. U rban 8.5 5 5.3 R ural 0 1987-88 1993-94 Year 1999-2000 R ural INDIA COUNTRY REPORT 2005 U rban 1.10. The wage employment programme not only has valuable anti-poverty content but is also a way of creating 25 GOAL 1 community infrastructures. The Government of India launched the National Food for Work Programme in order to provide additional resources, apart from the resources available under and economic assets and infrastructural development in rural areas. The SGRY is open to all rural poor who are in need of wage employment and desire to do manual and unskilled work in and around Water harvesting structure under National Food for Work Programme in Tamil Nadu Sampoorna Grameen Rozgar Yojana (SGRY) [Total Rural Employment Scheme], to 150 most backward districts of the country from November 2004 so that generation of supplementary wage employment and providing of food security through creation of need-based economic, social and community assets in these districts is further intensified. The programme is open to all rural poor who are in need of wage employment and 26 desire to do manual and unskilled work. Food grains are provided to the States free of cost. 1.11. The Sampoorna Grameen Rozgar Yojana (SGRY) was launched in September 2001 with the primary objective to provide additional wage employment in rural areas for food security and nutritional improvement. The secondary objective is the creation of durable community, social Road constructed through SGRY MILLENNIUM DEVELOPMENT GOALS 1.12. The Swaranjayanti Gram Swarozgar Yojana (SGSY) [Golden Jubilee Rural Self-employment Scheme] was launched in April 1999. The objective of the SGSY is to bring the assisted poor families above the poverty line by organizing them into Self Help Groups (SHG) through the process of social mobilization, their training and capacity building and provision of income generating assets through a mix of Bank credit and Government subsidy besides backward input and forward marketing linkages. 1.13. The Indira Awaas Yojana (IAY) [Indira Housing Scheme] is the major scheme for construction of houses to be given to the rural poor, free of cost. It has an additional component, namely, conversion of unserviceable kutcha houses to semi pucca houses. 1.14. The National Employment Guarantee Act that has been recently passed by the Parliament provides a measure of income and employment insurance for the rural poor. These measures are likely to enhance reduction in poverty and help achieving the millennium development goals. INDIA COUNTRY REPORT 2005 Poverty Alleviation in Urban Areas 1.15. Most of the anti-poverty programmes in the urban areas have focused on the slum areas in India, as it is these areas where a large portion of the urban poor are concentrated. The main aim of these programmes has been the infrastructural improvement of slums through provision of basic facilities. 1 GOAL the village/ habitat. While providing wage employment, preference is given to agricultural wage earners, non agricultural unskilled wage earners, marginal farmers, women, members of Scheduled Castes and Scheduled Tribes, parents of child labour withdrawn from hazardous occupations, and handicapped children /adults with handicapped parents. 1.16. National Slum Development Programme (NSDP) was launched to provide housing, community improvement, garbage and solid waste management as well as environmental improvement and convergence of different social sector programme like adequate and satisfactory water supply, sanitation, primary education, adult literacy and nonformal education facilities. 1.17. The Swaran Jayanti Shahari Rozgar Yojana (SJSRY) [Golden Jubilee Urban Employment Scheme], was launched to provide gainful employment to the urban poor through setting up of selfemployment ventures or provision of wage employment. The SJSRY consists of two special schemes, namely, (i) The Urban SelfEmployment Programme (USEP) and (ii) The Urban Wage Employment Programme (UWEP). The SJSRY is being implemented through community organisations like Neighbourhood Groups, and Community Development Societies (CDSs) set up in the target areas. 1.18. The Valmiki Ambedkar Awaas Yojana (VAMBAY) [Housing Scheme] was launched to ameliorate the conditions of urban slum dwellers living below poverty line in towns and cities all over the country with the objective to provide shelter or upgrade the existing shelter for people living below the poverty line in urban slums with ultimate goal of slumless cities with a healthy and enabling urban environment. A new National City Sanitation Project is an integral component of VAMBAY to provide toilet facilities for slum dwellers especially in congested metropolitan cities. 27 GOAL 1 28 Target 2: Halve, between 1990 and 2015, the proportion of people who suffer from hunger. 1.19. As a country dependent, significantly on rain-fed agriculture, India has faced periodic droughts. There have been occasions when starvation has been reported despite availability of food grains in the country. Consequently, food security has occupied a central place in Indian economic policy. The longest running and most widely spread intervention in this regard has been the public distribution system (PDS), which seeks to make a minimum quantity of food available to every household even in the remotest parts of the country at an affordable price. This, along with a well-developed calamity relief system, has ensured that draught and scarcity does not have much impact on the vulnerable population. However, the prevalence of malnutrition, particularly among the women and children is a serious reality facing the country. Even today, nearly 45 per cent of all children in the country continue to be underweight and a very high proportion of women suffer from anaemia. 1.20. Prevalence of (moderately or severely) underweight children The prescribed indicator in the MDG is the percentage of children under five years old whose weight for age is less than minus two standard deviations from the median for the international reference population aged 059 months. In Indian context data on this indicator is not available. The National Family Health Survey (NFHS) collected data on the under-weight children below three years of age in 199899. In 1992-93, children between 0-47 months were considered in the survey and as such the results of the two surveys are not comparable. Nearly 47 percent of the children under age three years were found to be severely underweight at the national level in 1998-99. The District Level Rapid Household Survey (DLHS) (2002-05) has for the first time provided district level estimates on the magnitude of hidden hunger or micronutrient deficiencies and malnutrition. Severe malnutrition has decreased significantly in India and severe nutritional deficiencies have considerably declined. 1.21. The incidence of malnourishment among women (and children) continues to be widespread, the consequence of which is the high rate of morbidity and mortality among them. According to the NFHS II, in 1998-99, more than 50 percent of the evermarried women and 75 per cent of children suffered from anaemia. In some areas, women still lack access to the daily per capita requirement of the recommended minimum nutrition. Nearly 60 per cent of the women particularly pregnant and lactating women suffer from anaemia. A programme has been implemented since 1997-98 to treat anemia and severe anemia among pregnant women, provides them with folic acid and iron tablets daily for 100 days. 1.22. In the recent years, a range of strategies has been devised to address these issues. By and large, these strategies have been based primarily on the provision of cheap, and even free, food to the poor and vulnerable classes. There are a host of such interventions, which cover a full range of life-cycle vulnerabilities affecting the poor. The Targeted Public Distribution System (TPDS) provides heavily subsidized cereals to the entire below poverty line (BPL) class; the Antyodaya Anna Yojana (AAY) targets the absolute destitute; the Integrated Child Development Scrvices (ICDS) covers young children and mothers; the Mid-day Meal Scheme (MMS) supports the school-going children; the various Food For Work (FFW) programmes provide food grains to the working poor; MILLENNIUM DEVELOPMENT GOALS 1 1.23. Integrated Child Development Services (ICDS) as a nation-wide programme continues to be the major intervention for the nutrition and overall development of children below 6 years of age and expectant and nursing mothers. National Nutrition Policy 1993 and the National Plan of Action for Nutrition 1995 have placed special emphasis interalia on improving the nutritional status of expectant and lactating mothers, adolescent girls, control of anaemia and micro-nutrient deficiencies and nutrition and health education of women. The National Nutrition Mission has been set up under the chairpersonship of the Prime Minister in 2003, with the basic objective of addressing the problem of malnutrition in a holistic manner. The National Guidelines on Infant and Young feeding were released in August 2004. Food Security for the poorest is attempted through the Targeted Public Distribution System (1997), the Antyodaya Anna Yojana (2000) and the Grain Bank Schemes. Gender and Poverty 1.24. It is often argued that on account of the lower work participation rate that goes hand in hand with the low socio-economic security, women share unequally higher burden of poverty and deprivation. Furthermore, as can be seen from the indicators related to gender under Goal 3, there are areas in education related indicators, where the females lag behind males. The Government of India is committed to gender equality. The antipoverty programmes of the country have components specifically aiming at improving the lot of women and other vulnerable sections of the society. 1.25. The success of the micro credit initiatives through self-help groups (SHGs) has encouraged the government to use this as an instrument to address the issues of poverty and unemployment. INDIA COUNTRY REPORT 2005 GOAL and the Annapurna scheme supports the aged. Women SHGs are implementing a large number of developmental initiatives viz, for providing women with access to savings and credit mechanisms and institutions through micro-credit schemes. Rashtriya Mahila Kosh [National Credit fund for Women] provides credit for livelihood and related activities to poor women. The Department of Women & Child Development implements the STEP (Support to Training and Employment Programme for Women) Programme, Swawlamban Programme, Swayamsiddha project and Swashakti project for the all round empowerment of women. Sampoorna Grameen Rozgar Yojana, Swaranjayanti Gram Swarozgar Yojana (40% of the benefits under this programme are earmarked for women), Swaranjayanti Shahari Swarozgar Yojana, Development of Women and Children in Urban Areas (DWCUA) etc have strengthened income generation capacity and economic security of women. Micro finance institutions have increased the outreach and NGOs have promoted SHGs at the village level while also linking them 29 GOAL 1 to banks. A 14-point Action Plan for strengthening credit delivery to women particularly in tiny and Small Scale Industries (SSI) sector has been formulated. Public sector banks earmark 5% of their net bank credit for lending to women. As on December 2004, the aggregate lending was 5.47 percent. 1.26. Considering the complex interrelationship between women and the economy, there is increased focus on infrastructure, capacity building in market and enterprise development skills of women, as that would benefit women both as workers and entrepreneurs. Interventions to prevent exploitation and contractualisation of labour that have been adopted like fixation of minimum contractual wages in accordance with the subsistence needs of the workers and collective organization measures like the micro-credit and micro-finance schemes and the social security measures like Unorganised Workers Social Security Scheme, the Universal Health Insurance Scheme and the National Social Assistance Programme have already lead to beneficial outcomes on income and working conditions for women and in mitigating the ill effects of poverty on women. 1.27. Effective access to land is perhaps the single most significant determinant of economic and social status in India. Womens unequal access to land rights is one of the most important reasons for the 30 poor status. Enhancing womens direct access to land in the rural economy proves critical for meeting the national goals of improving food and livelihood security, childrens welfare, agricultural productivity and womens empowerment. 1.28. There is an emphasis on the importance of enacting new legislation that gives women equal rights of ownership of houses and land. The recent amendment to the Hindu Succession Act provides that daughters would get equal rights in ancestral property. 1.29. Government policy directives on allotment of land rights in the names of husband and wife and in the names of women alone has yielded good dividend. In our federal polity, the land rights is a State subject under the Constitution, and the land transfer to women has not been uniform throughout the country. It has been recognized that allotment of government land and wasteland to womens groups and land in State farms enables women to take up agricultural and allied activities. 1.30. It is evident, from the above policies and strategies of the Government and the enactment of an Employment Guarantee Act providing measures of insurance and income security for the rural poor, that these measures will hasten the poverty reduction process and help achieving the Millennium Development Goal 1. Road under Pradhan Mantri Gram Sadak Yojana MILLENNIUM DEVELOPMENT GOALS 2 GOAL GOAL 2 Achieve Universal Primary Education Target 3: Ensure that, by 2015, children everywhere, boys and girls alike, will be able to complete a full course of primary schooling INDICATOR 6: Net enrolment ratio in primary education. INDICATOR 7: Proportion of pupils starting grade 1 who reach grade 5. INDICATOR 8: Literacy rate of 15-24 year olds. INDIA COUNTRY REPORT 2005 MILLENNIUM DEVELOPMENT GOALS Achieve Universal Primary Education Target3: Ensure that, by 2015, children everywhere, boys and girls alike, will be able to complete a full course of primary schooling 2 GOAL Goal 2 Table 2.1 below gives the status of various indicators under MDG 2 for the country from 1992-93 to 2002-03: Table 2.1 Indicator/Year 1992-93 2000-01 2002-03 Gross enrolment ratio in primary education Male Female 84.6 95.0 73.5 95.7 104.9 85.9 95.4 97.5 93.1 Proportion of children starting Grade 1 who reach Grade 5 55.0 59.3 65.1 Male Female 56.2 53.3 60.3 58.1 64.1 66.3 Adult Literacy rate (7 years and above) Female *52.2 Male 39.3 64.84 64.1 53.67 75.26 Source: Selected Educational Statistics, 2002-03, Government of India * Census of India, 1991 2.1. The gross enrolment ratio (GER) in primary education (Class I to V, age 6-11 years) for boys has tended to remain near 100%. In the case of girls, the ratio has increased by about 20 percentage points in a decade from 1992-93 to 2002-03. The limitation of this indicator is that, in some cases, the figure is more than 100% due to enrolment of children beyond the age group 6-11 years in the primary level education and, therefore, has to be used with caution. A declining GER may be interpreted as worsening educational attainment, which may not really be the case. INDIA COUNTRY REPORT 2005 2.2. The proportion of pupils starting Grade 1 who reach Grade 5, known as the survival rate to Grade 5, is the percentage of a cohort of pupils enrolled in Grade 1 of the primary level of education in a given school year who are expected to reach Grade 5. Over the period of ten years between 1990-91 and 2000-01, the allIndia dropout rate for primary schools fell by 2.93 percentage points from 41.96% in 1991-92 to 39.03% in 2001-02. However, a reduction of 4.14 percentage points in this rate has been observed in the year 2001-02 and 2002-03, during which period it declined from 39.03% to 34.89%. Thus 33 GOAL 2 there has been a significant improvement in the survival rate to Grade 5. 2.3. Literacy rate of the youth or 1524 year-old is the percentage of the population 1524 years old who can both read and write with understanding of a short simple statement on everyday life. As per the Census of India, a person aged 7 and above who can both read and write with understanding in any language is to be taken as literate. A person who can read but cannot write is not literate. Pupils who are visually impaired and can read in Braille are treated as literate. Literacy rate is basically computed on the basis of the census data of the Registrar General of India at an interval of ten years. In the years between two censuses, it is also estimated on the basis of data collected by the National Sample Survey Organization or the National Family Health Survey. 2.4. The literacy rate (age 7 and above) at all India level according to Census 1991 was 52.2%. The male literacy rate was 64.1% whereas the female literacy rate was much lower at 39.3%. The literacy rate, increased to 64.84% in 2001 from 52.2% in 1991 at the national level. For males, it has increased from 64.1% to 75.26% and for females, from 39.3% to 53.67%. 2.5. Government of India has, in accordance with its Constitutional mandate, taken several initiatives in the form of enabling policies, legislations and interventions to spread literacy, promote educational development and bridge gender disparities. An enabling policy framework has been provided in the form of the National Policy on Education, 1986, as revised in 1992, and the Programme of Action, 1992, that have given an impetus to universalising elementary education. The Government of India is committed to realising the goal of elementary education for all by 2010. Sarva Shiksha Abhiyan (SSA) [Campaign on education for all], launched in 2000, is the national umbrella programme that is spearheading the universalisation of elementary education for all children. One of the most significant developments in recent years has been the passage of the Constitution 86th Amendment Act, 2002, which makes free and compulsory education a fundamental right for all children in the age group of 6-14 years. 2.6. SSA includes several components for special groups of children. The National Programme for Education of Girls at Elementary Level is a component of SSA that provides region specific strategies to enable girls to come to school, including remedial teaching through bridge courses and residential camps. It targets the most educationally backward blocks in the country, where the female literacy rate is Literacy Rate (age 7 and above) Perc en ta ge 80 60 64.1 52.2 40 39.3 75.26 64.84 53.67 20 0 1991 2001 Year Fem ale M ale Total 34 MILLENNIUM DEVELOPMENT GOALS Cess on Taxes for funding basic education An Education Cess @ 2 per cent has been levied on all Central taxes since 2004 to finance quality basic education. Prarambhik Shiksha Kosh, a non-lapsable fund for funding SSA and the Mid-Day Meal is being established to receive the proceeds of the Education Cess. 2.7. There are several programmes of Early Childhood Care and Education which include the ICDS (Integrated Child Development Services), Crèches, Balwadis, ECE centres, Pre-Primary schools run by the State and the private sector, and many experimental and innovative projects like Child to Child programmes, Child Media Lab, Mobile Crèches and Vikas Kendras. 2.8 The National Programme of Nutritional Support to Primary Education commonly known as the MidDay Meal Scheme was started in 1995 to give a boost to universalisation of primary education by increasing enrolment, retention and attendance, and simultaneously impacting upon nutritional status of students in primary classes. The programme was expanded to cover the entire country in 1997-98, and to cover children studying in Education Guarantee Scheme (EGS) and Alternative and Innovative Education (AIE) Centres in October 2002. The Mid Day Meal Scheme has been revised with effect from September 2004, to add new components of Central assistance, including assistance for meeting cooking cost, management cost and provision of mid-day meal during summer vacations in drought affected areas, and now covers nearly 120 million children. 2 GOAL below the national average and the gender gap is above the national average. The component includes interventions for enhancing girls education like development of a Model Cluster School with facilities like teaching-learning equipment, library, sports, etc., and gender sensitisation of teachers. Mid-Day Meal Scheme ! ! ! ! ! The National Programme of Nutritional Support to Primary Education was launched on 15th August 1995, expanded in 2002. The programme was revised in 2004. It aims to increase enrolment and attendance, retention and improve the nutritional status of children in primary stage. The programme provides cooked meals to children through local implementing agencies. The Central government provides food grains (wheat and rice) free of cost at the rate of 100 grams per child per school day. In addition, Central Assistance is also being provided to meet cooking cost and transport subsidy. The Programme is also implemented in Summer Vacation in areas declared as drought affected 112 million children got the benefits during 2004-05 and now it reaches 120 million children. 25 States and all Union Territories have been fully covered. The scheme is converged with ongoing rural and urban development schemes for meeting the infrastructure requirements and with the involvement of local community, Self-Help Groups and Non-Governmental Organisations. 35 INDIA COUNTRY REPORT 2005 GOAL 2 Free and Compulsory Education of Children a Fundamental Right As a follow up to the Constitution (86th Amendment) Act, 2002, Government of India has decided to introduce suitable enabling legislation in Parliament that would give effect to the Fundamental Right to free and compulsory education. The Central Advisory Board of Education, comprising Ministers of Education of State Governments and academic and other experts, had set up a committee to suggest a draft of the legislation envisaged in the Constitution, and its report has been received by the Government. Final draft legislation has now been shared with the States, and will be introduced in Parliament at the earliest. 2.9. The enrolment drive launched during the second year of Tenth Plan to bring all children in the age group of 6-14 years into schools and other efforts taken up under SSA have resulted in a reduction in the number of out-of-school children from 42 million at the beginning of Plan period to 13 million in April 2005. The Education for All decade of the 1990s witnessed a massive countrywide exercise for achieving the commitment of universalisation of basic education. 2.10. These efforts have borne fruit, with the total literacy rate rising to 64.84 per cent in 2001. For the first time, the number of illiterates declined in absolute terms by 25 million, from 329 million in 1991 to 304 million in 2001. According to provisional estimates of the Seventh All India Education Survey, enrolment in the primary stage increased from 114 million in 200102 to 122 million in 2002-03. Dropout rate also declined significantly from 39.03% to 34.89% during this period. Due to awareness programmes, rate of improvement for women is faster. Kasturba Gandhi Balika Vidyalaya (KGBV) Scheme ! The KGBV scheme envisages setting up to 750 residential schools with boarding facilities at elementary level for girls belonging predominantly to the SC, ST, OBC and minorities in difficult areas. ! The scheme is being coordinated with existing schemes Sarva Shiksha Abhiyan (SSA), National Programme for Education of Girls at Elementary Level (NPEGEL) and Mahila Samakhya (MS). ! The scheme is applicable in those identified Educationally Backward Blocks where, as per 2001 census the rural female literacy is below the national average and gender gap in literacy is more than the national average. In these blocks, schools are set up with concentration of tribal population, with low female literacy and/ or a large number of girls out of school; Concentration of SC, OBC and minority populations, with low female literacy and/ or a large number of girls out of school; Areas with low female literacy; or Areas with a large number of small, scattered habitations that do not qualify for a school. Rs 1202 million have so far been released to the States for setting up these residential schools. 36 MILLENNIUM DEVELOPMENT GOALS GOAL 2 2.11. India is committed to universalising access to basic quality education with greater emphasis on covering all the unreached segments and social groups, including minorities. This commitment is reflected in a substantial increase in the allocation of funds for elementary education by 56 per cent from Rs 57.5 billion in 2003-04 to Rs 89.8 billion during 2004-05 which has been further stepped up by 36 per cent to Rs 122.4 billion in 2005-06. The levy of an education cess @ 2 per cent of major Central taxes with the proceeds being paid into a non-lapsable fund, the Prarambhik Shiksha Kosh, is a concrete step towards providing assured funding for primary education. The longterm goal, as spelt out in the National Policy is to raise educational expenditure to 6 per cent of Gross Domestic Product. 37 INDIA COUNTRY REPORT 2005 3 GOAL GOAL 3 Promote Gender Equality and Empower Women Target 4: Eliminate gender disparity in primary and secondary education, preferably by 2005, and in all levels of education no later than 2015 INDICATOR 9: Ratio of girls to boys in primary, secondary and tertiary education. INDICATOR 10: Ratio of literate women to men, 15-24 years old. INDICATOR 11: Share of women in wage employment in the nonagricultural Sector. INDICATOR 12: Proportion of seats held by women in national parliament. GOAL 3 40 MILLENNIUM DEVELOPMENT GOALS Promote Gender Equality and Empower Women Target 4: Eliminate gender disparity in primary and secondary education, preferably by 2005, and in all levels of education no later than 2015 3 GOAL Goal 3 Table 3.1 below gives the status of various indicators under MDG 3 for the country from 1990-91 to 2000-01. Table 3.1 Indicator/ Year 1990-91 1996-97 2000-01 0.71 0.76 0.78 Female male ratio in secondary education 0.49 0.57 0.63 Female male ratio in higher education 0.50 0.56 0.58 Ratio of literate women to men (7+) 0.61 NA 0.71 NA NA Rural 15.09 Urban 16.61 Lok Sabha (2004) 45 of 544 Rajya Sabha (2004) 28 of 250 Female male ratio in primary education Share of women in wage employment in the non-agricultural sector (1999-2000) Proportion of seats held by women in national Parliament 77 of /789 Lok Sabha (9.7%) (1999) (1991) 52 of 544 Source: Ministry of Human Resource Development and NSSO Literacy Ratio of W om en to Men in India Ra tio 3.1. In general, at the national level, less number of girls is enrolled than boys in primary, secondary and higher education. There has been improvement in the ratio of primary, secondary and higher education over the period 1990-91 to 2000-01. In primary education, it has gone 0.72 0.7 0.68 0.66 0.64 0.62 0.6 0.58 0.56 INDIA COUNTRY REPORT 2005 .71 .61 1991 2001 Year 41 1.00 0.80 Ratio GOAL 3 Ratio of girls to boys in Prim ary, S econdary and Tertiary Education 0.78 0.63 0.58 0.71 0.60 0.40 0.49 0.50 0.20 0.00 1990-91 2000-01 Year Prim ary E ducation Secondary Education up from 71% to 78%, in secondary education from 49% to 63% and in higher education from 50% to 58%. The ratio of literate women to men (in the age group 7 plus) has increased from 0.61 in 1991 to 0.71 in 2001 at the national level. 3.2. In order to achieve these levels, schooling has been made completely free for girls in most states up to the higher secondary stage for government and government aided schools. Various Centrally Sponsored Schemes strengthen school education and a large number of girls have benefited from these schemes. In the higher education sector, the University Grants Commission (UGC) has been implementing schemes for promoting womens education in Universities and Colleges like (i) scheme of grants to womens Universities for technical courses, (ii) scheme for construction of womens hostels, and (iii) setting up of Womens Study Centres in 34 Universities, etc. Participation of women students in polytechnics was one of the thrust areas under World Bank assisted Technical Education Project. The scheme of Community Polytechnic aims at bringing in communities and encouraging rural development through Science and Technology apprenticeship and through skill oriented non-formal training focused on women, minorities, Scheduled Castes (SC)/ Scheduled Tribes (ST)/ Other Backward Tertiary E ducation Classes (OBCs) and other disadvantaged sections of the society. Currently, 43% of the total beneficiaries are women. Access to higher education for girls has been expanding as also their enrolment in the various courses. Their numbers in colleges, universities, professional institutions like engineering, medicine, etc. has increased from 2.14 million in 1996-97 to 3.81 million in 2002-03. 3.3. Since 1988, the main strategy has been to spread adult literacy through the Total Literacy Campaign of the National Literacy Mission (NLM), using volunteers in time bound decentralized programmes. Post Literacy Campaigns and Continuing Education Programmes have also been part of the NLM effort to sustain adult literacy. The NLM was revamped in 1999. The goal that has been set is to attain a sustainable threshold of 75% literacy by 2007 by imparting functional literacy to nonliterates in the 15-35 age group. 3.4. The Mahila Samakhya Programme [Programme for Womens Empowerment] started in 1989, focuses on socially and economically disadvantaged and marginalized women groups. It uses education as tool for empowering women to achieve equality and emphasizes the process of learning, besides seeking to bring about a change in womens perceptions about themselves and the 42 MILLENNIUM DEVELOPMENT GOALS ! ! ! ! ! ! ! ! ! ! The gender parity at primary level is 88.1 for India (based on Selected Educational Statistics, 2002-03). Two States. i.e. Sikkim and Meghalaya, have achieved gender parity and majority of the States are close behind. Female literacy has gone up from 39.2% in 1991 to 53.67% in 2001. The growth rate in female literacy at14.39% has been higher than for males at 11.13%. Gender gap in literacy has declined from 24.85% in 1991 to 21.59% in 2001. Gross Enrolment Ratio (GER) at Primary Level is 97.53 for boys and 93.07 for girls in 2002-03. At Elementary Level, the GER for boys is 85.43 and for girls is 79.33. Girls enrolment to total enrolment has increased at the primary level from 42.6% in 1992-93 to 46.83% in 2002-03. At the middle school level, there is a significant jump in enrolment from 38.8% in 1992-93 to nearly 43.90% in 2002-03. At the primary level, the drop out rate among girls has come down from around 45.00% in 1992-93 to 34.99% in 2002-03 and the gender gap currently has been eliminated. At the elementary level, the drop out rate for girls has come down from 61.1% in 1992-93 to 52.8% in 2002-03 and the gender gap is below 1%. The dropout rate has come down by 4.1 percentage points in a single year between 2001-02 and 2002-03 from 39.0% to 34.9%. During the said period, dropout rate for girls has declined even more than for boys, the reduction being 6.2 percentage points for girls against 2.5 percentage points for boys. There are 64 female teachers per 100 male teachers at primary level and 69 female teachers per 100 male teachers at in elementary level in 2002-03. perception of society in regard to womens roles. It is now operational in over 15,000 villages of 63 Districts across 9 States. 3.5. From the available data for 19992000, it is seen that the share of women in wage employment in the nonagricultural sector is 16% at the all India level, 15% in the rural and 16.6% in the urban sector. Thus, women lag significantly behind males in terms of work participation, employment etc. However, there are some positive points. There has been marginal improvement in the annual employment growth rate of educated women. 3.6. Laws exist to secure reasonable working conditions for women workers and to prevent their exploitation. INDIA COUNTRY REPORT 2005 3 GOAL Gender Parity Indicators - Highlights Laws Protecting Women Workers These include the Factories Act, 1948, the Plantation labour Act, 1951, the Contract Labour (Regulation and Abolition) Act, 1970, the Inter-State Migrant Workers (Regulation of Employment and Conditions of Service) Act, 1979, the Maternity Benefit Act, 1961, the Equal Remuneration Act, 1976, the Minimum Wages Act, 1948, etc. which provide inter alia, creche facilities for the benefit of women workers, time off for feeding children during working hours, provision of maternity leave and separate toilets and washing facilities for female and male workers near the workplace and wages, etc. 43 GOAL 3 Commitment for Women Empowerment The Constitution of India confers equal rights and opportunities on men and women in the political, economic and social spheres. Promotion of gender equality and empowerment of women is one of the central concerns of the Tenth Plan (2002-07), which spells out three pronged strategies for empowering women: (i) Social Empowerment: Create an enabling environment through adopting various policies and programs for development of women, besides providing them easy and equal access to all the basic minimum services so as to enable them to realize their full potential (ii) Economic Empowerment: Ensure provision of training, employment and income generation activities with both forward and backward linkages with the ultimate objective of making all the women economically independent and self reliant. (iii) Gender Justice: Eliminate all forms of gender discrimination and thus enable women to enjoy not only de jure but also de facto rights and freedom on par with men in all spheres viz. political, economic, social, civil and cultural, etc. Reservation for Women 73 rd and 74 th constitutional amendments provide for 33.3 per cent reservation of seats for women in rural and urban local bodies. About one million women get elected to the panchayats,, municipalities and local bodies. 3.7. India is the first country where since independence women have the right to vote to elect representatives for the National Parliament as well as State Assemblies. The women have equal right to contest any election subject to the fulfillment of other eligibility conditions. So far 14 General Elections have been held for the Lok Sabha. The percentage of lady parliamentarians fluctuates between 8 to 12 percent in these elections. In the last general elections (2004), there were 45 women members out of 544 in Lok Sabha and there were 28 women members out of 250 in the Rajya Sabha. 3.8. Providing an enabling environment for women and men to participate equally in decision-making at all levels of government is essential ingredients of democracy. In India, 73 rd and 74 th Constitutional amendments in 1993 have brought forth the landmark provision and set a definite impact on the participation of women in the democratic institutions for developmental activities at the grassroot level. 33 ? % of elected seats is reserved for women, as also one-third of posts of chairpersons of these bodies. Onethird of the seats are further reserved for women belonging to SC and ST communities out of seats reserved for these communities. The Provisions of the Panchayats (Extension to the Scheduled Areas) Act 1996 (PESA) made this amendment applicable to Schedule V areas. In some States, the number of elected women exceeds the reserved one third. For example, in Karnataka, which was the first state to guarantee participation of women in local governance through reservation, the actual representation of women has gone up to 45%, in Kerala up to 36.4% and West Bengal up to 35.4%. In Uttar Pradesh, 54% of the ZiLa Parishad presidents are women. In Tamil Nadu, 36% of chairpersons of Gram Panchayats are women. 44 MILLENNIUM DEVELOPMENT GOALS 3.10. The reservation for women in State Assemblies and the National Parliament has been a matter of public debate for quite some time now. Although increasingly women have stood for elections and have got elected as members of State Legislative Assemblies and Parliament, the number of women Parliamentarians is not of expected level. The National Policy outlines the commitment of the government to introducing legislation for reservation for women in the State Legislatures and Lok Sabha. 3.11. Although the number of women in leadership positions at the local administration level has shown an encouraging trend, the proportion of women at senior levels of government remains low. Women representatives in the Panchayati Raj Institutions (PRI) constitute about 41% of the total representatives. 3 GOAL 3.9. Increased networking and formation of confederations of elected women representatives has helped to strengthen womens leadership. This approach has been especially successful in southern and western India. The formation of these networks has promoted solidarity among the elected women representatives, otherwise divided by caste, religion and geographical boundaries. 3.12. One of the six basic principles of governance laid down in the present governments National Policy is to empower women politically, educationally, economically and legally. Commitment for Women Empowerment (National Common Minimum Programme) ! Government will take the lead to introduce legislation for one third reservations for women in Vidhan Sabha and the Lok Sabha. ! Government will bring legislation on domestic violence and gender discrimination. ! Government will ensure at least one third of all funds flowing into panchayats will be earmarked for programmes for the development of women and children. ! Government will remove discriminatory legislation and enact new legislation that gives women, for instance, equal rights of ownership of assets like houses and lands. ! Government will bring about a major expansion in schemes for micro finance based on self-help groups, particularly in the backward and ecologically fragile areas of the country. ! Government will ensure facilities for schooling and extend special care to the girl child. 45 INDIA COUNTRY REPORT 2005 4 GOAL GOAL 4 Reduce Child Mortality Target 5: Reduce by two thirds, between 1990 and 2015, the under-five mortality rate INDICATOR 13: Under five mortality rate INDICATOR 14: Infant mortality rate INDICATOR 15: Proportion of 1 year old children immunized against measles GOAL 4 48 MILLENNIUM DEVELOPMENT GOALS Reduce Child Mortality Target 5: Reduce by two thirds, between 1990 and 2015, the underfive mortality rate 4.1. India is the largest democratic republic in the world with 2.4% of the worlds land area and supports 16% of the worlds population. It was the first country in the world to launch a Family Planning Programme in 1951. With various changes, as per needs, the programme has evolved to its present form - the Reproductive and Child Health programme, initiated on 15th October 1997. Stabilization of population, reduction of maternal and child mortality and morbidity and improvement of their nutritional status are the goals of this programme. Emergency and essential obstetric care, 24 hour delivery services at Primary Health Centres (PHCs), Safe Abortion Services, National Maternity Benefit Scheme and Vandematram Scheme are some of the maternal health interventions offered. Universal Immunization Programme, Essential Newborn Care and Integrated GOAL 4 Goal 4 Management of Neonatal and Childhood Illnesses (IMNCI), Vitamin A, iron and folic acid supplementation and promotion of breastfeeding are the major child health interventions. 4.2. There has been a paradigm shift in service delivery from the method mix target based activity approach to its current status of provision of client centered, need based, demand driven quality services. The focus is now on changing the attitude of service providers at the grass root level and strengthening the quantity and quality of reproductive health care services offered. Decentralization is the key word in this programme. Under 5 Mortality Rate (U5MR) 4.3. The Under-five mortality rate is the probability (expressed as a rate per 1000 Under five m ortality rate by Residence and Sex 1 60 1 40 1 20 1 00 80 60 40 20 0 1 45 .11 1 28 .6 4 1 36 .5 3 11 6.22 1 07 .3 8 9 9.28 7 5.53 7 6.55 5 6.03 M ale Fem ale Total M ale 6 5.6 Fem ale R ural 1988-1992 7 5.95 6 0.59 Total U rban 1998-2002 49 INDIA COUNTRY REPORT 2005 GOAL 4 live births) of a child born in a specified year dying before reaching the age of five if subject to current age specific mortality rates. Under Five Mortality Rate (U5MR) at national level has declined during the last decade. It has come down from 125.1 per thousand (1988-92) to 98.1 per thousand during the period 1998-2002. More declines are noticed for males than for females. Whereas in case of female children the U5MR has come down from 131.9 per thousand during 1988-92 to 107.1 per thousand during 1998-2002, for males it declined from 118.8 per thousand to 90.3 per thousand during the corresponding periods. Perceptible decline in the rate has taken place in rural areas as compared to urban part of the country. This implies that the governments programmes like Universal Immunisation, IMNCI are being successfully implemented in the rural areas. continuous decline in IMR. It stood at 192 during 1971, 114 in the year 1980 and 60 in 2003. The decline in IMR has been noticed both for male and female during the period. However, the rate of decline is more pronounced in the case of male as compared to female. Table 4.1 Infant Mortality Rate by Sex (Per 1000 live births) Infant Mortality Rate (IMR) Year Male Female Total 1980 113 115 114 1985 96 98 97 1990 78 81 80 1993 73 75 74 1996 71 73 72 2000 67 69 68 2003 57 64 60 4.4. The country has observed a 1 50 60 67 69 57 64 1 99 6 2 00 0 2 00 3 71 75 1 98 5 68 72 74 73 1 98 0 50 80 78 81 97 73 11 4 96 98 1 00 11 3 11 5 Pe r 10 00 li ve births Infa nt M ortality R a te by S ex 0 1 99 0 1 99 3 Year M a le F e m a le Tota l Source: Ministry of Health and Family Welfare 50 4.5. On account of child health interventions, the infant mortality rate in the country has gone down from 114 in 1980 to 60 in 2003. While looking at the IMR of the country, it is observed that there is a continuous decline both in rural as well as in urban areas although urban areas of the country are observing rapid decline in IMR as compared to rural areas attributing this change to better health care facilities easily accessible in urban areas. The table below shows the IMR according to ruralurban residence status: MILLENNIUM DEVELOPMENT GOALS Year 1980 1985 1990 1993 1996 2000 2003 Rural 124 107 86 82 77 74 66 Urban 65 59 50 45 46 43 38 ! ! Total 114 97 80 74 72 68 60 ! ! Inadequate maternal and newborn care; Malnutrition contributes to over 50% of child deaths; low birth weight (30%); and birth injury. 66 38 74 43 77 46 82 INDIA COUNTRY REPORT 2005 45 50 59 86 107 12 4 65 Pe r 10 00 l ive births 4.7. Notable among the child health interventions have been the the Universal Immunization Programme, Diarrhoeal Disease Control Programme and Acute Respiratory Infection (ARI) control programme. These were merged under the Child Survival and Infant M ortality Rate by Rural - Urban Safe Motherhood Programme in 1992. 1 50 With The paradigm 11 4 1 00 shift came the 97 68 80 72 74 60 Reproductive and 50 Child Health Programme (RCH) 0 which was launched 1 98 0 1 98 5 1 99 0 1 99 3 1 99 6 2 00 0 2 00 3 on October 15, 1997. Year The second phase of RCH has been R ura l U rb a n Tota l launched in April 2005 with more focus on Source: Ministry of Health and Family Welfare child survival and safe motherhood. 4.6. The principal causes of infant mortality in India are: 4.8. It has been realized that a faster pace ! Prematurity; of progress is needed if the goal of ! Diarrhoeal diseases; achieving an IMR of 30 per 1000 by the ! Acute respiratory infections; year 2010 as stated in the National ! Vaccine preventable; Population Policy is to be achieved. Accordingly, a new strategy has been adopted with a view to giving the child health interventions a holistic approach i.e. the Integrated Management of Neonatal and Childhood Illnesses (IMNCI). It aims to train the baseline workers in the management of measles, malaria, pneumonia, diarrhoea and malnutrition in a holistic manner with appropriate health facilities. Another unique feature of IMNCI is that the community is to be involved in the 4 GOAL Table 4.2 Infant Mortality Rate by Rural-Urban (Per 1000 live births) 51 GOAL 4 recognition of the sick child so that there is no delay in seeking treatment. This initiative is being implemented in at least 125 districts throughout the country in a phased manner. 4.9. In addition to the above, the Government is implementing prophylactic programmes for the prevention and treatment of two micronutrient deficiencies relating to Vitamin A and Iron. 4.10. Given the high prevalence rates of malnutrition among children emphasis is also being accorded to promotion of (i) exclusive breastfeeding up to the age of six months and (ii) breast feeding along with appropriate practices related to the introduction of complementary feeding after the age of 6 months up to the age of 2 years or more (weaning). iron folic tablets containing 20 mg of elemental iron and 0.1 mg of folic acid are provided at the sub-centre level. Current programme guidelines instruct health workers to provide 100 tablets to children clinically found to be anaemic. 4.14. Border District Cluster Strategy aims at providing focused interventions for reducing the infant mortality and maternal mortality rates by at least 50% over the next two to three years in 49 districts in 16 States of the country. Under this project, districts are supported for: ! ! ! ! 4.11. Under the New Born Care scheme, 80 districts in phase I and 60 districts in phase II of the Empowered Action Group States were provided newborn care equipment to upgrade neonatal care facilities. In the selected districts, the National Neonatalogy Forum (NNF) has imparted training to 2544 Medical Officers, Pediatricians and Obstetricians, and generated new trainers for the programme. ! ! ! ! Development and training of Health and Nutrition Teams, Physical up-gradation of sub-centres and primary health centres Additional supply of equipment and drugs Organization of outreach sessions Support for mobility of staff Development of local IEC for social mobilization Training of medical officers Upgradation of First Referral Units and filling of vacant posts through contractual appointments. 4.15. Immunization of children of 12 months of age as per NFHS (1998-99) against measles was 50.7% as compared to 42.2% during NFHS (1992-93). In the year 2003, immunisation level has further increased to 59.0% (RHS-II). P ercent 4.12. Iron Deficiency anemia is widely prevalent among young children. As per the results of the National Family Health Survey-II (1998-99) 74.3% of children P roportion of 1 year old children im m unised under the age of 3 years were anemic. against m easles There is a marginal 70 difference in the 50.7 60 59.0 prevalence in the rural 42.2 50 40 (75.3%) and urban 30 (70.8%) areas. The 20 prevalence ranges from 10 43% in Kerala to 85.7% 0 in Arunachal Pradesh. 1992-93 1998-99 2002-03 52 4.13. Under the National Programme, N FH S R HS MILLENNIUM DEVELOPMENT GOALS ! ! ! Introduction of Auto-Disable syringes for all immunization activities replacing the existing glass syringe and needles for improving injection safety and easy handling by the auxiliary nursing midwives (ANMs). Mobility support to State and District Immunization officers for better monitoring and supportive supervision. Mobilizing children to the immunization sites by Accredited Social Health Activist (ASHA), Anganwadi worker, Women Self-help ! ! ! Group volunteers, etc. Vaccine delivery to the immunization site from primary health center (PHC) to village so as to save the time of ANM and enable her to concentrate on immunization at site. Annual average expenditure of last 5 years on immunization is Rs. 127 crores. It is now stepped up to Rs. 524 crores average for next 5 years, an increase of around 400%. Outreach sessions are now being organized in close co-ordination with Anganwadi workers and Panchayati Raj Institutions. 4 GOAL 4.16. To address the issue of high infant and child mortality, Ministry of Health & Family Welfare, Government of India is implementing various programmes including Immunization Programme as it is one of the key interventions for protecting children from life threatening conditions. The following new initiatives have been taken under the immunization programme: 4.17. The Integrated Management of Neonatal and Childhood Illness (IMNCI) is the Indian adaptation of Integrated Management of Childhood Illnesses, which was developed by WHO and UNICEF. 4.18. The sex ratio in the age group 0-6 years is 927 females for 1000 males with a similar pattern at the State level, which is lower than the overall sex ratio. However, there are certain States/ Districts with an alarmingly low sex ratio. This indicates to some extent son preference, widespread prevalence of pre-natal sex determination and selection practices and existence of socio-cultural practices like dowry and unequal status accorded to women in decision-making. The PNDT Act mandates the maintenance of records relating to the use of ultrasound machines and other equipments for sex determination and the bodies registered for the same. Kishori Shakti Yojana for adolescent girls (11-18 years) was launched in 2000-01 as part of the ICDS. Immunization of the girl child is given special attention under the RCH programme. 53 INDIA COUNTRY REPORT 2005 5 GOAL GOAL 5 Improve Maternal Health Target 6: Reduce by three quarters, between 1990 and 2015, the maternal mortality ratio INDICATOR 16: Maternal mortality ratio (MMR) INDICATOR 17: Proportion of births attended by skilled health personnel. GOAL 5 56 MILLENNIUM DEVELOPMENT GOALS Improve Maternal Health Target 6: Reduce by three quarters, between 1990 and 2015, the maternal mortality ratio Maternal Mortality Rate GOAL 5 Goal 5 5.2. As per the results of National Family Health Survey (NFHS) conducted for the period 1992-93 and 1998-99 and District Level Household Survey (DLHS), in 2003, the country showed considerable improvement in the above indicators. Over a period of ten years institutional deliveries have increased by 14 percent points whereas safe deliveries have risen by 20 percent points in the same period. P e rcen t 5.1. As per the data available for the country, it is estimated that there were 407 maternal deaths per 1, 00,000 live births at national level during 1998 as against 437 in 1991. The estimates of maternal mortality at State/ UT level not being very robust, MMR can only be used as a rough indicator of the maternal health situation in the country. Hence, it is desirable for a country like India that other indicators duly reflecting maternal C auses of m aternal m ortality in India. health status like antenatal check 35 30 up, institutional delivery and 25 delivery by trained personnel, etc. 20 15 are also compiled for monitoring. 10 5 Even these indicators correctly 0 reflect the status of the ongoing s ia ur es . .. ns .. er programme interventions. Some bo li c ti o g. ag em th a r p e h a r o O L Pr or An o m te d of the major causes of Maternal Ab m of lC c e a a i H tr u Mortality Rate (MMR) in India er m bs rp xe e O o ascertained during the survey with T Pu their respective share are as below: 1997 1998 Table 5.1 Causes of Maternal Mortality 1. 2. 3. 4. 5. 6. 7. Hemorrhages Puerperal Complications Obstructed Labour Abortions Toxemia of Pregnancy Anaemia Others Source: Ministry of Health and Family Welfare INDIA COUNTRY REPORT 2005 1997 27.6% 13.0% 10.7% 7.3% 6.6% 17.3% 17.5% 1998 29.6% 16.1% 9.5% 8.9% 8.3% 19.0% 8.4% 57 GOAL 5 Table 5.2 Proportion of Antenatal Care and Safe Deliveries Indicator 1. 2. 3. NFHS-I 1992-93 Antenatal Care i) Any Visit ii) Three visits Deliveries i) Institutional ii) Safe Deliveries TT (Pregnant Women) NFHS-II 1998-99 DLHS 2002-03 62.3 44.0 65.4 43.8 74.0 44.5 25.5 34.2 53.8 33.6 42.3 66.8 39.8 54.0 71.3 Source: Ministry of Health and Family Welfare A nten atal C are and S afe D eliveries 74 71 .3 Th ree V isits N FH S-I 199 2-93 5.4. Essential Obstetric Care: Maternal complications are largely not predictable. 66.8 53 .8 S afe D elive ries N FH S-II 1 998 -9 9 5.3. Prophylaxis and treatment of nutritional Anaemia: As per results of NFHS-II (1998-99) about 51.8% women were anaemic .The problem is rather severe during pregnancy. A programme for prophylaxis and treatment of anaemia among pregnant women has been under implementation throughout the country since 1977-78. Under this programme, all pregnant women are provided with one tablet (containing 100 mg of elemental iron and 5 mg of folic acid) daily for 100 days. Those who have severe anaemia are provided with double the dose of these tablets. 42. 3 25 .5 Institutiona l D elive ries Interventions for reducing Maternal Mortality and Morbidity 58 34 .2 39 .8 4 3.8 44 A ny V isits 54 44 .5 33 .6 65. 4 62. 3 80 70 60 50 40 30 20 10 0 TT (P regn ant W om en D LH S 20 02-03 The programme, therefore, emphasizes on early registration of pregnant women and provision of at least three antenatal checkups aimed at early recognition of these complications, referral and treatment of those suffering from complications. 5.5. Emergency Obstetric Care: Complication associated with pregnancy and childbirth is not always predictable. Therefore, emergency obstetric care is an important intervention to prevent maternal morbidity and mortality. Under, the Child Survival and Safe Motherhood (CSSM) Programme (1992-93 to 1997-98), 1724 first referral units were identified by the States and provided with Kits. However, they did not become fully operational due to lack of skilled manpower particularly anesthetists and gynecologists, adequate infrastructure, emergency drugs and lack of facilities for blood transfusion. Under the Reproductive MILLENNIUM DEVELOPMENT GOALS 5.6. Promotion of safe deliveries at home and training of Midwives: A large number of deliveries particularly in rural and remote areas are conducted at homes mostly by untrained Dais and even by relatives. As per DLHS (1998-99) 142 districts in the country have been identified where the safe delivery rate (institutional deliveries and deliveries conducted by trained attendants) is less than 30%. A scheme for training of Dais was initially started in these 142 districts in 18 States during 2001-02. The scheme has since been extended to all the districts of the 8 Empowered Action Group (EAG) States (Bihar, Orissa, Uttar Pradesh, Madhya Pradesh, Rajasthan, Uttaranchal, Chhattisgarh and Jharkhand). These States are demographically weaker and contribute to more than half of the population of the country. Till now, 1,21,017 Trained Birth Attendants (TBA) have been trained under the programme. The scheme of Dais Training through NonGovernmental Organizations (NGOs) is also being implemented in the backward pockets of those districts that are not covered under the training through the State/ UT Governments. 5.7. Safe Abortion Services/ Medical Termination of Pregnancy (MTP): Medical Termination of Pregnancy is an important component of the ongoing RCH Programme and it is one of the means of reducing maternal mortality. A proportion of maternal deaths are due to unsafe abortion. For expanding and strengthening safe abortion services under RCH Programme, the MTP Act and rules have been amended for delegation of powers to recognize MTP centres to the districts: 5 GOAL and Child Health (RCH) Programme, First Referral Units (FRU) are being strengthened through supply of drugs in the form of emergency obstetric drug kits and hiring of skilled manpower. The sub-district hospitals, Community Health Centres (CHCs) and FRUs are entitled to hire services of private Anesthetists for conducting emergency operations. Table 5.3 Medical Termination of Pregnancy performed Year 1980-81 1991-92 1994-95 1997-98 1999-00 2000-01 2001-02 2002-03 2003-04 Number of Number institutions of approved medical for MTP termination 3294 7121 8511 9119 9645 9806 9223 10633 11032 3,88,405 6,36,456 6,27,748 5,12,823 7,39,975 7,25,149 7,70,114 7,44,680 7,63,126 Institutions approved for MTP and terminations done N u m b e r o f In st itu tio n s N u m b e r o f te rm in a tio n s 12 000 10 000 0 0 10 000 80 000 0 80 00 60 000 0 60 00 40 000 0 40 00 20 000 0 20 00 0 0 19 80-81 19 91-92 19 94-95 19 97-98 19 99-00 20 00-01 20 01-02 20 02-03 20 03-04 Year N um be r o f Institu tio n s a ppro ve d for M T P N um be r o f M e d ic al Term ina tio ns Source: Ministry of Health and Family Welfare INDIA COUNTRY REPORT 2005 59 GOAL 5 5.8. In order to increase availability and accessibility to abortion services, MTP equipments are procured centrally and provided to District Hospitals, CHCs and PHCs wherever required. Services of Safe Motherhood Consultants are now available for improving MTP services at PHCs wherever required. MTP equipments as well as free training in MTP technique will be provided to recognize MTP centres in the Non-Government sector. 5.9. Schemes for Improving Obstetric Care Services: Schemes for provision of additional ANMs, Public Health/ Staff Nurses, Laboratory Technicians, Private Anaesthetists, Safe Motherhood Consultants, 24 Hours Delivery Services at PHCs/ CHCs, Referral Transport, RCH Camps and Supply of Drugs of ISM Systems are being implemented. Better socio-economic and educational status of women reduces MMR Maternal Mortality is influenced by a whole range of socio-economic determinants. The status of women with low level of education, cultural misconceptions, economic dependency and lack of access to services influences the maternal mortality and morbidity. Hospital based data reveals that States like Kerala, Karnataka, Tamil Nadu, Maharashtra, Andhra Pradesh, Punjab and Haryana which have relatively better socioeconomic and educational status have lower MMR than the other states. Thus, besides improving the maternal health care services, Government is committed to improve the social status of women, including the education standard, to reduce the current level of MMR. New Initiatives: Obstetric Management and Emergency Skills Government of India is also considering introducing training of MBBS doctors in Obstetric Management Skills and Anaesthetic Skills in Emergency Obstetric Care at FRUs. Federation of Obstetric and Gynecological Society of India has prepared the training module for 16 weeks in all obstetric management skills including Caesarean Section operation and is at present under consideration. Setting up of Blood Storage Centers at FRU Timely treatment for complications associated with pregnancy is sometimes hampered due to non-availability of Blood Transfusion services at FRU. To facilitate establishment of Blood Storage Centers at FRU, the Drugs and Cosmetics Act has been amended.Guidelines for funding and procurement of equipment will be provided by Government of India under RCH-II. 60 5.10. National Population Policy (NPP) brought out in February 2000, inter-alia, represents the commitment towards (a) voluntary and informed choice and consent of citizens while availing of reproductive health care services and (b) continuation of the target free approach in administering family planning services. The NPP 2000 provides a policy framework for advancing goals and prioritizing strategies MILLENNIUM DEVELOPMENT GOALS 5.11. The immediate objective is to address the unmet needs of contraception, health care infrastructure and health personnel and to provide integrated service delivery for basic reproductive and child health care. The long term objective is to achieve a stable population by 2045 at a level consistent with the requirements of sustainable economic growth, social development and environmental protection. 5 GOAL during the current decade to meet Reproductive and Child Health (RCH) needs of the people to bring the Total Fertility Rate (TFR) to 2.1 by 2010 to achieve the replacement level. It is based upon the need to simultaneously address issues of child survival, maternal health, and contraception while increasing outreach and coverage of a comprehensive package of reproductive and child health services by the government, industry and the voluntary and non-government sector. Demographic Goals in NPP 2000 a) b) c) d) e) f) g) h) Address the unmet needs for basic reproductive and child health services, supplies and infrastructure; Reduce IMR to below 30 per 1000 live births; Reduce MMR to below 100 per 100,000 live births; Achieve universal immunisation of children against all vaccine preventable diseases; Achieve 80 per cent institutional deliveries and 100 per cent deliveries by trained persons; Achieve counseling and services for fertility regulation and contraception with a wide basket of choices. Integrate Indian System of Medicine (ISM) in the provision of RCH services and in reaching out to households; and Promote vigorously the small family norm to achieve replacement level of TFR. 5.12. Reproductive and Child Health Programme (RCH-II) is a comprehensive sector wide flagship programme subsumed under National Rural Health Mission (NRHM) to deliver the 10th plan targets for reduction of maternal mortality, infant mortality and TFR launched in April 2005 in partnership with the State governments. RCH-II is a centrally sponsored scheme being implemented across the country in all the 35 States and UTs in accordance with National Population Policy 2000, National Health Policy 2001 and Millennium Development Goals (MDG). RCH-II aims to expand the use of essential reproductive and child health services of adequate quality with reduction in geographical disparities. 5.13. National Rural Health Mission INDIA COUNTRY REPORT 2005 (2005-2012) The Mission adopts a synergistic approach by relating health to determinants of good health viz. segments of nutrition, sanitation, hygiene and safe drinking water. The Government is to raise public spending on health from 0.9% of GDP to 2-3% of GDP. It also aims at reducing regional imbalances in health infrastructure, pooling resources, integration of organizational structures, optimization of health manpower, decentralization and district management of health programmes, community participation and ownership of assets, induction of management and financial personnel into district health system, and operationalizing community health centers into functional hospitals meeting Indian Public Health Standards (IPHS) in each block of the Country. 61 NRHM RURAL HEALTH HEALTH CARE AT DOORSTEP AT MILLENNIUM DEVELOPMENT GOALS GOAL 5 Rural health awareness campaign by ASHA Accredited Social Health Activist (ASHA) ASHA: One of the key components of National Rural Health Mission is to provide every village in the country with a trained female community health activist (ASHA). ASHA will be trained to work as an interface between the community and the public health system. ASHA is expected to be a fountainhead of community participation in public health programmes in her village. ASHA will mobilize the community and facilitate them in accessing health and health related services available at the Anganwadi/ PHC such as immunization, ante natal checkup, post natal check-up, supplementary nutrition, sanitation and other services being provided by the government. 5.14. The National Rural Health Mission (2005-12) seeks to provide effective healthcare to rural population throughout the country with special focus on 18 states, which have weak public health indicators and/ or weak infrastructure. It has as its key components provision of a female health activist in each village; a village health plan prepared through a local team headed by the Health and Sanitation Committee of the Panchayati Raj INDIA COUNTRY REPORT 2005 Institutions (PRI); strengthening of the rural hospital for effective curative care and made measurable and accountable to the community through Indian Public Health Standards (IPHS). Primary Health Centres will be strengthened for quality preventive, promotive, curative and supervisory and outreach services. 3,222 existing Community Health Centres (30-50 beds) will be operationalized as 24 Hour First Referral Units, including posting of anesthetists. District Health Plans would be formulated which would be an amalgamation of field responses through Village Health Plans, State and National priorities for Health, Water Supply, Sanitation and Nutrition. Public private partnership for achieving public health goals, including regulation of private sector would be formulated. Panchayats and NGOs would play an active role. 5.15. While recording details of every live birth during continuous enumeration, the enumerators and supervisors are required to enquire about the type of medical attention provided to the mother at the time of delivery of the new born. Deliveries attended by skilled health personnel include institutional deliveries, deliveries attended by doctor, nurse and mid-wife. Janani Suraksha Yojana [Women Insurance Scheme] has also been introduced as a mission to motivate institutional delivery. 63 GOAL 5 Table 5.4 Institutional deliveries attended by Skilled Health Personnel (Figures in %) Birth attended A. B. i) ii) iii) Institutional Delivery Safe Delivery By Doctor By ANM/Nurse/Mid-wife By other Health Professional NFHS-I (1992-93) NFHS-II (1998-99) DLHS (2002-03) 25.5 34.2 21.6 12.6 - 33.6 42.3 30.3 11.4 0.6 39.8 54.0 - Source: Ministry of Health and Family Welfare 5.16. Developing a cadre of Community Level Skilled Birth Attendant: The major causes of maternal deaths are haemorrhage (ante-partum and postpartum), anaemia, infection, unsafe abortion, obstructed labour and hypertensive disorders of pregnancy. A large number of these causes are preventable through improved maternal care and ensuring appropriate treatment of complications. Ideally all deliveries should be conducted by trained health functionaries. However, the present health care system is not in a position to provide all pregnant women services of a trained health functionary at the time of delivery. Therefore, need for developing a cadre of Community level skilled birth attendant who will attend to the pregnant women in the community. A Community Level Skilled Birth Attendant will be trained in midwifery to provide maternal care at the community level. She selected from the community to set up her practice after training. She has no financial / administrative obligation to the health system and will serve in the same community for a minimum period of three years. She receives stipend for the training. 64 MILLENNIUM DEVELOPMENT GOALS Combat HIV/AIDS, Malaria and TB Target 7: Have halted by 2015 and begun to reverse the spread of HIV/AIDS INDICATOR 18: INDICATOR 19: INDICATOR 19: INDICATOR 19: INDICATOR 19: INDICATOR 20: HIV prevalence among pregnant women aged 1524 years. Condom use rate of the contraceptive prevalence rate. Condom use at last high-risk sex. Percentage of population aged 15-24 years with comprehensive correct knowledge of HIV/AIDS. Contraceptive Prevalence Rate. Ratio of School Attendance of Orphans to School Attendance of non-orphans aged 10-14 years. Target 8: Have halted by 2015 and begun to reverse the incidence of malaria and other major diseases INDICATOR 21: INDICATOR 22: INDICATOR 23: INDICATOR 24: Prevalence and Death Rates Associated with Malaria. Proportion of Population in Malaria-risk Areas using Effective Malaria Prevention and Treatment Measures. Prevalence and Death Rates Associated with Tuberculosis. Proportion of Tuberculosis Cases Detected and Cured under directly observed treatment short course (DOTS). INDIA COUNTRY REPORT 2005 6 GOAL GOAL 6 GOAL 6 66 MILLENNIUM DEVELOPMENT GOALS Combat HIV / AIDS, Malaria and TB Target 7: Have halted by 2015 and begun to reverse the spread of HIV/ AIDS 6.1. Under the National AIDS Control Programme, National AIDS Control Organization (NACO) conducts annual round of HIV sentinel surveillance in identified sentinel sites all over the country. This round is conducted for 12 weeks from 1st August to 31 st October every year. Sample size of 400 is collected on consecutive basis with unlinked anonymous basis methodology in 12 weeks time. The clinics identified as sentinel sites report data to the State AIDS Control Sites (SACS), which further compiles and sends it to NACO after necessary consolidation. 6.2. As a marker of spread of HIV, percentage of non regular sex partners and the condom use among non regular sex partners has been identified as crucial information. NACO conducts Behavioural Sentinel Surveillance Survey (BSS) to monitor trends in risk behaviours among general population and among high risk groups. This data is captured from the survey among general population whereby individual respondents are asked to respond to specific questions related to these indicators. The respondents are asked whether they had sexual intercourse with any non regular sex partners in the last 12 months before the survey. The respondents, who reported having sex with any non-regular sex partner in the last 12 months before the survey, were asked whether they used condom during the last sexual intercourse with any non-regular sex partner. The behavioural sentinel surveillance survey is conducted once in INDIA COUNTRY REPORT 2005 6 GOAL Goal 6 three years. During National AIDS Control Programme (NACP) II, the baseline (BSS) survey was conducted in 2001 while the end line survey will be conducted during 2005-06. The survey was conducted by an independent organization identified by NACO. The independent organisation collects data from the field level which are compiled and documented in the form of BSS Report. 6.3. As per the data available, the HIV prevalence has increased from 0.74 per hundred pregnant women aged 15-24 years in 2002 to 0.86 in 2003. The corresponding figures for age group 2549 are 0.80 and 0.88 per hundred pregnant women. As per the Baseline BSS report 2001, only 6.6% of the population who have sex with non-regular partners used condom and 49.3% people between ages 15-49 years have comprehensive correct knowledge about HIV/AIDS. 6.4. The first AIDS case in India was detected in 1986. Realizing the gravity of epidemiological situation of HIV infection prevailing in the country, the Government of India launched a National AIDS Control Programme in 1987. A comprehensive fiveyear project was launched in 1992. Learning with the experience of Phase-1, there was a paradigm shift in present Phase-II of the project addressing AIDS in the country. The second Phase of the National AIDS Control Programme (NACOII) was formulated by Government of India with the two key objectives: (I) to reduce the spread of HIV infection in India; and 67 GOAL 6 Table 6.1 Status of various indicators under MDG 6 Indicator/ Year 2001 2002 2003 HIV prevalence among pregnant women aged 15-24 years (%) NA 0.74 0.86 HIV prevalence among pregnant women aged 25-49 years (%) NA 0.80 0.88 Condom use rate among non-regular sex partner (%) 6.6 - - Percentage of population aged 15-49 with comprehensive correct knowledge about HIV/AIDS 49.3 - - Source: Ministry of Health and Family Welfare (II) strengthen Indias capacity to respond to HIV/AIDS on a long term basis. The total outlay for Second Phase of the National AIDS Control Programme (NACP-II) is Rs. 2064.65 crore. i. The NACP-II project components as given below: - iv. v. has 5 ii. iii. Priority targeted intervention for populations at high risk Preventive interventions for the general population Low Cost care for people living with HIV/AIDS Institutional strengthening Inter-sectoral collaboration. Target 8: Have halted by 2015 and begun to reverse the incidence of malaria and other major diseases 6.5. Malaria is a public health problem in several parts of the country. About 95% population in the country resides in malaria endemic areas and 80% of malaria reported in the country is confined to areas consisting 20% of population residing in tribal, hilly, difficult and inaccessible areas. Directorate of National Vector Borne Disease Control Programme (NVBDCP) has framed technical guidelines/ policies and provides most of the resources for the programme. For the monitoring of the programme, indicators have been developed at national level and there is uniformity in collection, compilation and onward submissions of data. Passive surveillance of malaria is carried out by PHCs, Malaria Clinics, CHCs and other secondary and tertiary level health institutions, which patients visit for treatment. At present, there are 22,975 PHCs, 2,935 CHCs and 13,758 Malaria Clinics. The Table below gives information on Annual Parasite Incidence (annual number of malaria positive cases per thousand population) and death rate (actual number of confirmed deaths due to malaria per 100,000 population) from 1990 up to 2004. 68 MILLENNIUM DEVELOPMENT GOALS Annual Parasite Incidence and Death Rate Year Annual Parasite Incidence (per 1000) Deaths Death per 100,000 population 1990 2.57 353 0.05 1991 2.62 421 0.05 1992 2.58 422 0.05 1993 2.65 354 0.04 1994 2.91 1122 0.13 1995 3.29 1151 0.13 1996 3.48 1010 0.12 1997 3.01 879 0.10 1998 2.44 664 0.07 1999 2.41 1048 0.11 2000 2.07 932 0.09 2001 2.12 1005 0.10 2002 1.80 973 0.09 2003 1.82 1006 0.10 2004 * 1.75 943 0.09 * Provisional 6 GOAL Table 6.2 Source: Ministry of Health and Family Welfare * 04 20 02 20 00 20 98 19 96 19 94 19 19 19 92 4 3 2 1 0 90 A n nu al P ara site In cide nc e Annual P arasite Incidence Rate per thousand population from 1990 to 2004 Year 69 INDIA COUNTRY REPORT 2005 6 * 04 20 02 20 00 20 98 19 96 19 94 19 19 19 92 0.1 4 0.1 2 0.1 0.0 8 0.0 6 0.0 4 0.0 2 0 90 De ath rate GOAL Death Rate per 100,000 population from 1990 to 2004 Year 6.6. From the data, it is clear that annual parasite incidence rate has consistently come down from 2.57 per thousand in 1990 to 1.75 per thousand in 2004 but confirmed death rates due to malaria have been fluctuating in this period between 0.04 - 0.13 deaths per 100,000 population. The Table below shows the information on indicators by which malaria prevention/ control activity in India are monitored and evaluated. Slide Positivity Rate (SPR) and Slide Falciparum Rate (SFR) have reduced over the years 1990 to 2004. It may be seen that ABER lies within 8.80% to 10.49% during the period 1990-2004. Table 6.3 Malaria Epidemiological Situation (1990-2004) ;ear Population BSC (in 000s) BSE Positive cases PF cases ABER SPR SFR 1990 1991 1992 1993 1994 1995 1996 1997 1998 1999 2000 2001 2002 2003 2004 * 784418 808102 824137 833885 861730 888143 872906 884719 910884 948656 982413 984579 1025563 1027157 1050546 74422242 75158681 79011151 77941025 82179407 83521300 91536450 89445561 89380937 88333965 86459292 90389019 91617725 99136143 95964416 2018783 2117460 2125826 2207431 2511453 2926197 3035588 2660057 2222748 2284713 2031790 2085484 1842019 1869403 1843466 752118 918488 876246 852763 990508 1136423 1179561 1007366 1030159 1141359 1037173 1005236 897454 857124 881985 9.49 9.30 9.59 9.35 9.54 9.40 10.49 10.11 9.81 9.31 8.80 9.18 8.93 9.65 9.13 1.01 1.22 1.11 1.09 1.21 1.36 1.29 1.13 1.15 1.29 1.20 1.11 0.98 0.86 0.92 74533845 75265438 79108006 77990335 82179407 83617845 91877489 89449658 89484918 88502976 86662001 90622304 91887795 99486857 96586389 2.71 2.81 2.69 2.83 3.06 3.50 3.30 2.97 2.48 2.58 2.34 2.30 2.00 1.88 1.91 * BSC: BSE: PF: ABER: 70 Provisional Blood Smear Collected Blood Smear Examined Plasmodium Falciparum Annual Blood Smear Examination Rate (percentage of blood smears examined in a year of total population) Source: Ministry of Health and Family Welfare MILLENNIUM DEVELOPMENT GOALS 15 10 5 * 04 20 20 19 20 02 00 98 96 19 94 19 92 19 90 0 GOAL 6 M a la ria Ep idem io lo gical S itu atio n (1990-2004 ) 19 6.7. The Table below shows the position regarding Drug Distribution Centres (DDCs) and Fever Treatment Depots (FTD) established during 1997 to 2003. There are approximately 6.25 lakh villages, the number of Drug Distribution Centres functioning is 3,12,274 and Fever Treatment Depots functioning is 1,16,871 in the country. Year ABER SPR SFR Table 6.4 DDCs/ FTDs Established/ Functioning 1997-2003 Year 1997 1998 1999 2000 2001 2002 2003 DDCs Established Functioning 198554 201612 247997 264824 278910 336918 363506 FTDs Established Functioning 170488 181437 209849 252932 278910 263561 312274 73796 72892 83209 88609 99724 120060 133429 54389 51411 73015 88609 99265 98990 116871 Source: Ministry of Health and Family Welfare 6.8. The Table below shows position regarding the percentage of population in high risk areas covered by Indoor Residual Spray during 1997and 2004. Table 6.5 Percentage of population in high risk areas covered by Indoor Residual Spray Years 1997 1998 1999 2000 2001 2002 2003 2004 * Target Population in high risk areas Covered by Indoor -Residual Spray % age 129483148 104827478 84593820 99999950 92550262 75864024 60425231 73962661 99875347 80085578 73050748 81691911 77640746 63575991 50754459 60064338 77.08 76.40 86.35 81.69 83.49 83.80 84.00 81.21 * Provisional INDIA COUNTRY REPORT 2005 Source: Ministry of Health and Family Welfare 71 90 Pe rc en ta ge GOAL 6 P ercentage of population in high risk areas covered by Indoor R esidual spray 85 80 75 86.35 81.69 83.49 83.8 84 81.21 77.08 76.4 70 1997 1998 1999 2000 2001 2002 2003 2004 * Year Tuberculosis 72 6.9. Prior to 2000 for estimating TB incidence, there was no large scale nation wide survey conducted in the country. Estimates were based on small regional surveys undertaken. Currently, incidence of TB in the country is based on nation wide Annual Risk of TB Infection (ARTI) survey conducted by National Tuberculosis Institute and Tuberculosis Research Centre between 2001-03. The methodology and validity of the estimates have been universally accepted. It is envisaged to undertake the ARTI surveys every 3 or 5 years gap to measure the progress towards achieving the MDG goals and impact of Directly Observed Treatment Short course (DOTS) in the country. ARTI represents the proportion of population that gets newly infected (or reinfected) with tubercle bacilli over the course of one year. Based on Styblos calculations, it has been estimated that for every one percent annual risk of tuberculosis infection, there are about 50 new pulmonary sputum smear positive cases per 100,000 population per year. Currently the average ARTI in the country as a whole is estimated to be 1.5% i.e. there will be 75 New Smear Positive (NSP) cases per 100,000 population per year. Prior to 2000, based on the small regional/local ARTI surveys, the ARTI was estimated to be 1.7% in the country i.e. 85 NSP cases per 100,000 population per year. 6.10. There have been no representative data available on death rates due to TB in the country. The notification rates are a gross under estimation of the death rate due to TB in the country. Under Revised National Tuberculosis Control Program (RNTCP), less than 5% of registered cases die during treatment, thus there has been a seven-fold reduction of death rates compared to the earlier National Tuberculosis Control Programme (NTCP) where the death rate of 29% was reported. Based on the available data, it is estimated that deaths due to TB has decreased from 500,000 (56 per 100,000 population per year in 1990) to 400,000 per year currently. WHO has estimated the death rates in the country 37 per 100,000 in 2002 and for the year 2003 as 33 per 100,000 (Annual Global TB Report 2005). There is a survey underway to estimate the death rate due to TB in the States of Andhra Pradesh and Orissa and reliable state level estimates would be available by early 2006. These estimates would be used to explore the possibility of deriving a reliable national estimate on death rates in consultation with experts. 6.11. Based on the modeling exercise by NTI/ TRC to estimate the likely trends in the prevalence of smear positive pulmonary TB in DOTS areas, the RNTCP is likely to meet the MDG target of halving the prevalence of TB by 2015 if the global targets for cure MILLENNIUM DEVELOPMENT GOALS 6.12. The baseline estimates presented in the ensuing paras are the best possible estimates from available information. Estimates of incidence and death rates are based on a consultative and analytical process; they reflect the new information gathered through surveillance and from special studies/ surveys (such as ARTI, prevalence surveys.). DOTS implementation started as a pilot in 1993 and adopted in 1997. Prior to 1993 reliable information on case detection rates and treatment success rates were not available. Hence, information on case detection rates and success rates are available from 1996-97 onwards. These reports are compiled from the standardized RNTCP quarterly reports, summarized annually. 6.13. As per the ARTI survey, incidence of TB is estimated number of new smear positive (NSP) TB cases per 100,000 population, per year which is: 85 NSP TB cases per 100,000 population per year (prior to 2000). 75 NSP TB cases per 100,000 population per year (2000-2003). 75 NSP TB cases per 100,000 population per year (2000-2005). TB Programme Review 1992, death rate associated with TB is estimated as 57 deaths (all forms of TB) per 100,000 population per year (1990). Thereafter, the estimates published in the WHO report on Global TB Control (since 1996) have been stated as 37 (2002) and 33 (2003) per 100,000 population. 6.15. Proportion of registered NSP TB patients successfully treated under DOTS in a given year is mentioned below: Numerator = No. of NSP TB patients cases treated successfully under DOTS in an annual cohort of cases. Denominator = No. of NSP TB patients registered for treatment in the corresponding year (annual cohort). The proportion of TB patients successfully treated has risen from 81% in 1996 to 86% in 2003 as can be seen in Table 6.6 below. 6 GOAL and case detection are achieved and maintained throughout the programme. Table 6.6 Percentage of TB patients treated Year % treated 1996 1997 1998 1999 2000 2001 2002 2003 81% 81% 84% 82% 84% 85% 87% 86% 6.14. As per the estimates done in India 73 INDIA COUNTRY REPORT 2005 Ensure Environmental Sustainability Target 9: Integrate the principles of sustainable development into country policies and programmes and reverse the loss of environmental resources INDICATOR 25: INDICATOR 26: INDICATOR 27: INDICATOR 28: INDICATOR 29: Proportion of Land Area covered by Forest. Ratio of Area Protected to Maintain Biological Diversity to Surface Area. Energy use (Kg Oil equivalent) per $1 GDP (PPP). Carbon Dioxide emissions per capita and Consumption of Ozone-depleting Chlorofluoro Carbons (CFCs) (ODP Tons) Proportion of Population Using Solid Fuels Target 10: Halve, by 2015, the proportion of people without sustainable access to safe drinking water and basic sanitation INDICATOR 30: INDICATOR 31: Proportion of population with sustainable access to an improved water source, urban and rural Proportion of population with access to improved sanitation, urban and rural. Target 11: By 2020, to have achieved a significant improvement in the lives of at least 100 million slum dwellers INDICATOR 32: Proportion of households with access to secure tenure 7 GOAL GOAL 7 MILLENNIUM DEVELOPMENT GOALS Semi-evergreen Forest of Western Ghats is unique forest ecosystem and biodiversity. Ensure Environmental Sustainability Target 9: Integrate the principles of sustainable development into country policies and programmes and reverse the loss of environmental resources Forest Cover 7.1. As per 2003 assessment, the total land area covered under different forests in the country was 6,78,333 sq. km., (20.64% of the total land area). The forest cover includes 4461 sq. km. of mangroves, which is 0.14% of countrys geographic area. Out of the total forest cover, 51,285 sq. km. is very dense forest (1.56%), 339, 279 sq. km. is moderately dense forest (10.32%) while 287,769 sq. km. (8.76%) is open forest cover. The reserved and protected forests together account for 638,353 sq. km., (19% of the total land area). The Tenth Five Year Plan, while emphasizing the need for balanced and sustainable economic development along with sustainability of the environment for healthy living, has also set the target for increasing forest and tree cover to 25% by 2007 and 33% by 2012. 7.2. Under the Goal 7, we have to analyse, how environment, livelihood stability, land use and cropping could affect food access and nutrition security and how these in turn have impacted on the condition of children and women. Programmes and policies that recognize the link between womens well being and environmental health, cut across various sectors and include initiatives in forestry, water supply, rainwater harvesting, sanitation, natural resource management, etc. The nodal agency for environment related activities is the Ministry of Environment and Forests. Gender sensitive resource management is Protected Sunderbans Biosphere Reserve, West Bengal with luxuriant mangrove forest and home to many endangered flora and fauna. INDIA COUNTRY REPORT 2005 7 GOAL Goal 7 77 GOAL 7 encouraged in schemes such as the Joint Forest Management Schemes, in which 50 percent of the members are generally women. Womens participation is encouraged in community resource management and watershed programmes. Rural women living below the poverty line are provided with financial assistance to raise nurseries in forestlands. The Ministry of Non Conventional Energy Sources implements several programmes to reduce drudgery and provides systems for cooking and lighting. Environmental education programmes supported by the Department of Education play an important role in creating awareness and seeking location specific solutions to the environmental problems. Customary practices followed by the forest dwellers supplement Government efforts to maintain and preserve forests. Land Management 78 7.3. Land is a critical national resource. Its efficient management is vital for economic growth and development of rural areas. Concerted efforts are being made through Area Development Programmes to regenerate and rejuvenate wasteland and degraded land. The Draught Prone Areas Programme (DPAP) and the Desert Development Programme (DDP) adopted the watershed approach in 1987. The Integrated Wasteland Development Programme (IWDP) taken up by the National Wasteland Development Board in 1989 also aimed at developing wasteland on a watershed basis. These programmes have now been brought under the administrative jurisdiction of Department of Land Resources in the Ministry of Rural Development. Watershed Development Projects under these three programmes have been taken up for holistic development of areas with community participation. The fourth major programme based on the watershed concept is the National Watershed Development Project in Rainfed Areas (NWDPRA) under the Ministry of Agriculture. 7.4. So far, these programmes had their own separate norms, funding patterns and technical components based on their respective coverage and specific aims. While the Desert Development Programme focused on reforestation to arrest the growth of hot and cold deserts, the Draught Prone Areas Programme concentrated on non-arable lands and drainage lines for in-situ soil and moisture conservation, agro-forestry, pasture development, horticulture and alternate land uses. The Integrated Wasteland Development Programme, on the other hand, made silvipasture, soil and moisture conservation on wastelands under Government or community or private control as their predominant activity. These three programmes are now different components of one common programme called Hariyali which is being implemented through Panchayati Raj Institutions. The NWDPRA combines the features of all these three programmes with the additional dimension of improving arable lands through better crop management technologies. While the focus of these programmes may have differed, the common theme amongst these programmes has been there basic objective of land and water resource management for sustainable production. Total area taken up for treatment under these programmes is approximately 8.7 million hectares at a total cost of Rs. 52.17 billions. Ozone Depleting Substances 7.5. Indias per capita consumption of Ozone Depleting Substances (ODS) is at present less than 3g and was within 20g between 1995-97 as against per capita consumption of 300g permitted under the Montreal Protocol on Substances that deplete the ozone layer. India has also taken effective action for phasing out various Ozone Depleting Substances both in the production and consumption sectors in accordance with the provisions of the Montreal Protocol. MILLENNIUM DEVELOPMENT GOALS 7.6. According to Indias Initial National Communication to the Jun- D ec 2002 United Nations F r a m e w o r k Convention on Climate 1999-2000 Change, in 1994, 1,228,540Gg of CO 2 0 equivalent to anthropogenic Green House Gases (GHGs) were emitted from India resulting in a per capita emission of about 1.3 tonnes, which is about 1/4th of the global average. Even CH4 3 1% 7 Proportion of population using solid fuels N 2O 4% Distribution of GHG emissions from India 1994, Gas by Gas emission distribution according to the World Energy Statistics Report released by the International Energy Agency (IEA), the per capita CO2 emission from India is 0.97 tonnes as against the world average of 3.89 tonnes in the year 2004. 7.7. In India, quite a substantial number of households use coke, coal, firewood, cow-dung cake and charcoal as primary source of energy for cooking 87.6% in rural and 28.6% in urban as revealed through the survey on consumption expenditure conducted in 1999-2000. In a subsequent survey carried out in 2002, the proportion has slightly reduced to 85% in rural and 26.3% in urban areas. 26.3 85 Urban Rural 28.6 87.6 20 40 60 80 GOAL Energy Used 100 7.8. To bring about revolutionary changes in the rural economy, it is imperative that all the lighting needs of the rural India are met through affordable electricity supply and all the cooking needs are met through LPG gas CO connections. It is being 6 5% targeted to complete the rural electrification work by 2010. The Rajiv Gandhi Grameen Vidyutikaran Yojana has been launched in April 2005 for achieving the objective of providing access to electricity to all rural households in 5 years. Under the scheme, the Central in Government is providing 90% capital grant for extending the grid to electrifying all villages and habitations where it is feasible and cost effective to do so, with the States accepting the commitment to provide electricity with revenue sustainability. In remote villages where grid connectivity is neither feasible nor cost effective, Ministry of Non Conventional Energy Sources (MNES) has been identified as the designated agency for covering them under remote villages electrification programme. 2 7.9. From the available data on commercial energy use in kg oil equivalent per capita, a clear positive trend has been observed over last one decade or so (from 288 kg oil equivalent in 1990-91 to 435 kg oil equivalent in 2003-04). The energy use 79 INDIA COUNTRY REPORT 2005 GOAL 7 per 1000 Rs. GDP (at 1993-94 prices) has been declining constantly from 36.255 kg oil equivalent in 1991-92 to 32.648 kg oil equivalent in 2003-04. Table 7.1 Commercial Energy Use in kg oil equivalent Energy Use (kg oil equivalent) per capita per unit of GDP (1993-94 prices) Year 1990-91 1991-92 1992-93 1993-94 1994-95 1995-96 1996-97 1997-98 1998-99 1999-00 2000-01 2001-02 2002-03 2003-04(P) 288.44 297.26 304.66 308.41 320.58 338.66 350.05 360.99 361.22 389.65 410.93 412.04 420.31 435.27 0.035 0.036 0.036 0.035 0.035 0.035 0.034 0.034 0.033 0.034 0.035 0.034 0.034 0.033 per unit of GDP (current prices) 0.047 0.043 0.039 0.035 0.032 0.029 0.027 0.025 0.022 0.022 0.022 0.020 0.020 0.018 Source: Ministry of Power Target 10: Halve, by 2015, the proportion of people without sustainable access to safe drinking water and basic sanitation 7.10. As per Census data, 62% of the total households in the country could use safe drinking water in 1991. By 2001, this proportion has increased to 85%. There has been substantial increase in the rural India, the percentage having increased from 55.5% in 1991 to 86.8% in 2001 and to 90% in 2005. Table 7.2 Proportion of population with access to an improved water source and sanitation Indicator/ Year 1991 Proportion of the Rural population with access to an improved water source 55.54 Urban Total Rural Urban Total 81.38 62.30 86.77 82.22 85.22 Proportion of the population 1991 with access to sanitation Rural Urban 9.48 47.00 Source: 80 2001 2001 Rural Urban 21.92 63.00 2005 Rural Urban 32.36 N.A. Ministry of Rural Development, Ministry of Urban Development, Registrar General of India MILLENNIUM DEVELOPMENT GOALS 9 0 .0 0 P ercentage 8 0 .0 0 7 0 .0 0 6 0 .0 0 5 0 .0 0 4 0 .0 0 3 0 .0 0 7 GOAL water source, the r e m a i n i n g households have 8 6 .7 7 8 1 .3 8 8 5 .2 2 8 2 .2 2 water supply from 6 2 .3 0 other sources such as 5 5 .5 4 hand pumps, tube wells, etc. Out of 36.86 million households, 26.67 million urban households are having tap water R ura l U rb a n To ta l R ura l U rb a n To ta l source within the 1991 2001 premises, 8.08 million near the Urban Water Supply and premises and 2.09 million away from the Sanitation premises (i.e., the source is located at a distance of more than 100 metres from the premises). 7.11. As per the provisional data of 2001 census, out of the total 1.02 billion 7.13. About 89% of the urban population population in the country, the urban has been provided with water supply and population is 285 million, living in 5161 63% with sewerage and sanitation towns, which is 27.8% of the total facilities, as on 31.3.2000. However, these population. Of the 5161 urban coverage figures indicate only the agglomerations, 35 metropolitan cities accessibility. Adequacy and equitable contained about 37% of the total urban distribution and per capita provision of population. The remaining urban these basic services are not as per the population was distributed in 365 large prescribed norms in some cases. For towns with population ranging from instance, the poor, particularly those living 100,000 to one million and the 4761 towns in slums and squatter settlements, are having population less than 100,000. The generally deprived of these basic facilities. proportion of population in metropolitan Though about 89% of the population in cities, which was 19% in 1951, increased the urban centers is estimated to have to 37% in 2001. The rate of urban access to some form of piped water supply, population growth in the country is still the level of service is very poor. Water is very high as compared to developed available for only 2 to 6 hours a day and countries, and the large cities in the the quality and quantity may not be as per country are becoming larger due to influx the standard norms in some cases. of population to these cities. The high rate of continuing migration from rural to 7.14. In order to provide water supply and urban areas has been putting enormous sanitation facilities in all the urban towns pressure on the urban infrastructure, and cities, the Ministry of Urban causing serious problems of urban Development is contemplating to planning, management and governance. introduce Urban Infrastructure The pressure is more in respect to provision Development Scheme for Small and of basic amenities such as safe drinking Medium Towns (UIDSSMT) having water supply, hygienic sanitation and population up to one million as per 2001 drainage facilities. Census, which will subsume the existing Centrally Sponsored Accelerated Urban 7.12. The 2001 Census indicates that out Water Supply Programme (AUWSP). of total 53.69 million urban households, Besides, the Ministry has launched National 36.86 million households are having tap Proportion of population w ith sustain able access to water source 2 0 .0 0 1 0 .0 0 0 .0 0 INDIA COUNTRY REPORT 2005 81 GOAL 7 Urban Renewal Mission (NURM) to provide infrastructure facilities including water supply, drainage and solid waste management in select cities including Metro cities and State capitals not covered under UIDSSMT. 7.15. Government of India is implementing a scheme VAMBAY for improving the conditions of slum dwellers by providing them shelter and healthy and enabling urban environment through community sanitation. Under VAMBAY, the construction of more than 100,000 cost effective dwelling units annually, including sanitation facilities, for the slum dwellers in the country is being undertaken. During the first 3 years of the scheme, Rs. 7.1625 billion of central subsidies were released for 3,26,517 dwelling units and 59,654 toilets. 7.16. National Slum Development Programme (NSDP), with an objective to upgrade the urban slums by providing physical amenities like water supply, storm water drains, community bath, widening and paving of existing lanes, sewers, community latrines, street lights, etc. is being implemented in the country since 1996-97. Funds under NSDP are also being utilized for provision of community and social amenities like pre-school education, non-formal education, adult education, maternity child health and primary health care including immunization. The programme also has a component of shelter up-gradation or construction of new houses. Since the inception of NSDP, 41.3 million slum dwellers have been benefited from this programme. National Urban Renewal Mission ! ! ! ! ! ! ! ! ! The Mission covers Water Supply, Sewerage and Sanitation, Solid Waste Management, Road Network, Urban Transport. The Mission addresses the problem facing the urban water supply sector both inadequate resources, and better management of the assets created and efficient utilization of the water available in the systems. The reform strategy is a paradigm shift to use resources in a focused manner to incentives, leverage and support the reform efforts at the State and ULB level. The thrust is to accelerate the development process of infrastructure services in 60 select cities. In order to access funds, the States/ ULBs are required to undertake the stipulated mandatory and optional reforms. Rs. 28.00 billion have been allocated in the current financial year for the SubMission on Urban Infrastructure and Governance. Operational efficiency of water utilities is sought to be achieved through some specific mandatory reforms to be undertaken by States/ ULBs, which include levy of reasonable and adequate user charges within a time frame of five years. Mechanisms to strengthen consumer voice through reforms which mandate Public Disclosure Law, Community Participation Law and association of ULBs in city planning function. Setting up of regulatory mechanisms as envisaged in the reforms should also help in more efficient delivery of services in the sector. Adoption of modern accrual based double entry system of accounting to improve fiscal discipline and creditworthiness of the ULBs enabling them to access capital market. Structural and administrative reforms provided in the basket of optional reforms are expected to result in the professional management of water utilities, their capacity building and autonomy in their functioning. 82 MILLENNIUM DEVELOPMENT GOALS ! ! ! For the remaining about 5000 urban areas, an omnibus scheme known as the Urban Infrastructure Development Scheme for Small and Medium Towns has been introduced with an annual outlay of Rs. 7.00billion in 2005-06 budget. The cities and towns proposing to access funds for urban infrastructure improvements will have to undertake mandatory as well as optional reforms. The States are to prioritise cities and projects to be provided with assistance. Public Private Partnership 7.17. An outlay of Rs. 6 billion has been made in 2005-06 for Viability Gap Funding to support Public Private Partnership projects in the urban infrastructure sector. Water supply and sanitation projects with Private Sector Participation can access funds under this scheme. Rural Water Sanitation Supply and 7.18. As a result of the Rajiv Gandhi National Drinking Water Missions effort, the rural water supply coverage has increased steadily in recent years. In 2001, about 86.77% of the rural population (642 million of the total 740 million) had access to a safe source of drinking water, much higher than the 55.54% (357 million of 642 million) in 1991. At present (1.4.2005), 7 GOAL Urban Infrastructure Development Scheme for Small and Medium Towns (UIDSSMT) 90% of the habitations have been covered, about 3.5 percent are partially covered, less than 0.5 percent habitations are yet to be covered and 6% habitations with problems of water quality have to be tackled. 7.19. Coverage of habitations is a dynamic concept. Many habitations that have been fully covered earlier slip back to not covered or partially covered status due to a number of factors like (i) Sources going dry; (ii) Systems working below rated capacity due to poor operation and maintenance; (iii) Sources becoming quality affected; (iv) Increase in population resulting into lower per capita availability; and (v) Emergence of new habitations. The Tenth Plan Working Group has estimated the number of slipped back habitations as 0.28 million habitations. This along with Survey findings of 2003 is being validated by Indian Institute of Public Administration. 7.20. A clearly defined strategy has been set in motion in the context of Millennium Development Goals. The State Governments and Mission have sufficient technical and financial capacity to carry forward the programme. The following strategies are in operation: Coverage of all residual habitations to ensure sustained supply of safe drinking water by 2009, ! Piped water supply in rural areas INDIA COUNTRY REPORT 2005 83 GOAL 7 SUCCESS STORIES Vizag Industrial Water Supply Project ! ! ! ! Vizag Industrial Water Supply Project was implemented through a SPV and Visakhapatnam Industrial Water Supply Company (VIWSCO) had the partners like Rashtriya Ispat Nigam Limited, Visakhapatnam Municipal Corporation, National Thermal Power Corporation, Andhra Pradesh Industrial Infrastructure Corporation and Larsen & Toubro Limited. Total Project Cost was Rs. 4. 47 billion with Rs. 4.00 billion (89.5%) of debt and Rs. 0. 47 billion (10.5%) of equity. The Scope of Work included 432 MLD Capacity River Intake Pump house 7850 kW V.T pumps installed, 2600 mm dia 56 Kms of MS Water Transmission Main, 10MVA transformer yard & 6.6KV Switch gear, and a SCADA system. Tariff Mechanism of water price @ Rs. 7/- per 1000 ltrs from buyers, and the balance was through subsidy from Government of Andhra Pradesh (GoAP). Take & Pay agreement with the main buyers was firmed up right at the initial Project stage. The water charges would be reviewed annually by review committee consisting independent auditor appointed by Government of Andhra Pradesh. VIWSCO will administer the water charges collection with GoAP support. Esrow account is also provided for revenue and debt servicing. Tirupur Water Supply Project ! ! ! ! New Tirupur Area Development Corp. Ltd (NTADCL) is a Special Project Vehicle with the partners namely Tirupur Municipality, Tirupur Exporters Association , Tamil Nadu Corporation for Industrial Infrastructure Development, Indo-US Financial Institutions Reform and Expansion , and Infrastructure Leasing & Financing Srvices. The total Project Cost is Rs. 12.00 billion with debt of Rs 10.50 billion (87.5%)from World Bank, Financial Institutions and Banks and Equity of Rs1.50 billion (12.5%). This project has unique Tariff Mechanism. This adopted cross subsidization between Industrial Water pricing and Municipal Water pricing. House holds are charged at Rs. 5/- per 1000 ltrs and Industries at Rs. 45/- per 1000 ltrs. Yearly price escalation index 6.5% Sri Sathya Sai Water Supply Project ! ! Sri Sathya Sai Water Supply Project (1995-97) was fully funded by Sri Sathya Sai Central Trust, Puttaparthi. The Panchyat Raj Department of Government of Andhra Pradesh was entrusted to plan and design the water supply scheme. Project management and Construction of this massive project was entrusted to Larsen and Toubro, the leader in the field of Construction. The comprehensive Protected Water Supply Schemes provides potable drinking water for 1.5 million people spread in 730 Villages in drought prone Ananthapur District of Andhra Pradesh. The Project involve infiltration and collection wells and associated pumping (Direct pumping from Balancing Reservoirs and treatment through rapid and slow sand filters).Seven Summer Storage Tanks ranging up to 100 acres tap water from the Tungabhadra High Level Canal. 84 MILLENNIUM DEVELOPMENT GOALS Coverage of habitations that had been earlier covered but s slipped back to not covered or partially covered status, ! Launching of community based Water Quality Monitoring and Surveillance Programme in association with Ministry of Health, ! Providing all rural schools and Anganwadis with safe drinking water in the shortest possible time, 7 GOAL ! Freedom from drudgery of fetching water brings smile rejuvenating/ supplementing schemes that are now outlived or are functioning below their rated capacity, ! Drinking water supply in rural schools ! For sustainability of sources, there is convergence of programmes for water conservation with community Since women are the major stake-holders in the domestic drinking water use and sanitation, Swajaldhara provides that Village Level Water and Sanitation Committee should have at least one third women members, drawn from economically and socially deprived sections. The selection of technology should be gender friendly in terms of their choice, convenience and should be so adopted that a group of two or three women can collectively handle its operation and maintenance, Reforms in Rural Water Supply ! Handpump with platform and drainage participation, revival of traditional water sources and provision of rain water harvesting structures, ! Source strengthening measures are to be an integral part of all rural drinking water schemes, along with INDIA COUNTRY REPORT 2005 Moving forward on the countrywide reforms and decentralization programme, the Government of India, through the Mission, is seeking to redefine its relationship with the States in the sector, through the use of Memorandums of Understanding (MoU), 85 GOAL 7 ! ! Community users to be involved in decision-making. The experience gained from the reforms initiated in 67 districts in 1999 under Sector Reform Projects (SRP) has transformed the approach in water supply programmes, which are now scaled up as Swajaldhara and implemented throughout the country with demand driven and community participation approach. State Water and Sanitation Missions (SWSM) have been established at the State level, to provide guidance and periodically review the implementation of Swajaldhara programme. The District Panchayat /District Water and Sanitation Mission (DWSM) review the implementation progress of Swajaldhara in the district. The District Water and Sanitation Committee, a committee of the District Panchayat / DWSM scrutinizes and approves schemes submitted by the Block Panchayat and Gram Panchayat and manages and monitors Swajaldhara Projects, As per the mandate of 73 rd Constitutional Amendment, it is envisaged to decentralize planning, implementation and management of rural water supply schemes to Panchayats and User Groups in a phased manner for all single village schemes. In multi-village/ regional schemes, this level of devolution would be decided by the respective State Governments, depending upon the capacity of the appropriate level of panchayat and the technical requirement of the scheme, ! Introduce differential tariff structure to ensure 50% to 100% cost recovery of the Operation and Maintenance cost of the RWS systems within the village/ Gram Panchayat from the users, ! Communication and Capacity Development (CCD) Units are being set up in all States who in turn will take up capacity development activities through a network of key resource centres identified at the state and regional level, ! Effective monitoring system has been introduced. Action has been initiated for concurrent evaluation / social audit of Bharat Nirman Drinking Water Schemes by leading NGOs / academic and research institutions, reputed social workers, professional experts, retired personnel. On line monthly monitoring on the implementation of the schemes is being introduced. District Vigilance and Monitoring Committees which include elected representatives, take regular feedback on the implementation of drinking water schemes. Bharat Nirman Recently Bharat Nirman has been launched to be implemented in four years, (200506 to 2008-09), for building rural infrastructure. Rural drinking water supply is one of the six components of Bharat Nirman. The coverage in respect of rural drinking water supply under Bharat Nirman includes (1) coverage of all rural schools in coordination with the Ministry of Human Resource Development; (2) coverage of 55,067 remaining uncovered habitations of the Comprehensive Action Plan 1999; (3) coverage of 2,16,968 water quality affected habitations and (4) coverage of slipped back habitations. 86 MILLENNIUM DEVELOPMENT GOALS Sundargarh: Tribals Participate in Sector Reform Project ! ! ! ! Sundargarh district pilot project in Orissa was one of the 67 pilot sector reform projects sanctioned by Government of India during 1999-2000. The focus of the reform project has been to ensure participation of all sections of the community. 71% of the rural population in the Sundargarh district are Scheduled Tribes. In spite of their poor economic condition, people in the district have come forward to take up the responsibility of planning, implementation, and maintenance of their own water supply schemes. At the village level, the Village Water and Sanitation Committee (VWSC) had been constituted in all the 1700 villages. VWSC meetings in Sundargarh District had high attendance of the villagers, with the participation of women more than 60% in some cases. It was encouraging to note that in many cases other village developmental issues were also discussed in the VWSCs organized meeting and the decision taken in these meeting were accepted as a Gram Sabha Meeting by the Gram Panchayat. 7 GOAL SUCCESS STORIES Swajal Project: Promoting community participation in rural drinking water supply ! ! ! ! ! ! The Swajal project in Uttar Pradesh was the first project of its kind in India in field application of the concept of community participation in rural drinking water supply, covering a population of 1.2 million in 1200 villages at a total cost of US $ 63 million. In a major shift from centralized fiscal management in the implementation of water supply schemes, beneficiary committees in Uttar Pradesh have been given control over investment decisions for water supply and sanitation infrastructure. Funds are transferred to user communities at the village level, enabling them to procure materials and services and contract works by them. Through the social mobilization and capacity-building exercises under the project, the village water and sanitation committee, a community level organization, is empowered to manage all project construction funds, procure goods, works and services, contract all construction activities, and operate and maintain constructed systems. Contracting for services, such as technicians to build gravity systems, fitters, plumbers and masons, is mainly done at the local level through the village water and sanitation committee, with the assistance of the support organization. For more skilled services, such as constructing overhead tanks and drilling deepbore tube wells, technicians are usually not available locally and works have to be contracted out. Perhaps the biggest single quality assurance check in the community contracting system is the transparency of the entire operation. When the detailed project report is being drafted, community members decide the brand of all non-local material (mainly pipes, cement and steel) to be purchased and nominate two representatives to the purchase committee. The purchase committee conducts a market survey of manufactures stocking ISI stamped material and collects invoices from them. The community approves the cost of local materials, labor and cartage. 87 INDIA COUNTRY REPORT 2005 GOAL 7 Sujalam Suphalam Yojana (SSY) in Gujarat ! In 2004 the Government of Gujarat launched Sujalam Suphalam Yojana for adequate water availability in 10 worst drought affected districts of the state. (Ahmedabad, Patan, Banaskantha, Gandhinagar, Mehsana, Sabarkantha, Dahod, Panchmahals, Surendranagar and Kutch). ! It aims at finding solution to water problem, doubling the farmers income and improving the rural economy of the state. The project costs about Rs.6.237 billion. ! Capacity building, peoples participation, public private partnership and cost recovery by Pani Samitis/Local Bodies has been built-in in the project. ! In all, 32 drinking water supply schemes covering 4,904 villages at a cost of about Rs.1,946 crore have been taken up under the Sujalam Suphalam Yojana. Further, by implementation of these drinking water supply schemes, safe water would be available to 2,408 quality affected villages. ! The implementation of the project started in the year 2004. It is envisaged to be completed by December 2005. The Narmada, water resources, water supply and Kalpasar Department is responsible for the implementation of the project. ! To overcome the problem of recurring drought, the state has adopted a multipronged strategy i.e. both macro and micro management of water. On the one hand, water is being made available through Sardar Sarovar dam and other reservoirs, and on the other, every drop is water is being collected, stored and recharged to take the maximum benefit. The community driven rainwater harvesting in the form of check dam construction in the state has yielded high dividend. Rural Sanitation 88 percent of population have latrines within/ attached to their houses. Out of this, only 7.1 percent households have latrines with water closets. Total Sanitation Campaign (TSC) is the main programme for promoting rural sanitation in the country. 7.21. The practice of open defecation is borne out of a combination of factors, the most prominent of them being (a) the behaviour pattern and (b) lack of awareness of the people about the associated Individual House hold Latrines health hazards. 19.23% of 32.36% total population in the 35.00% country had access to 30.00% 21.92% sewerage and toilet 25.00% 20.00% facilities in 1991. As per 15.00% 9.48% the latest Census (2001) 10.00% data, only 36.4 percent of 5.00% total population have 0.00% latrines within/attached to 1 their houses. However in 1991 2001 2005 rural areas, only 21.9 MILLENNIUM DEVELOPMENT GOALS 7.22. Goals promotion: (i) (ii) in Rural Sanitation Full household coverage by 2010: Efforts are being made to achieve the Millennium Development Goal of reducing by half the number of people without access to sanitation by the end of the Tenth Plan (200607); and, to complete implementation of TSC projects in the entire rural areas of the country by 2010. For this purpose, the TSC is being scaled up to all the remaining districts by 2006-2007. Full coverage of all Schools by 2006-07: As part of the TSC (iii) 7 GOAL implementation, greater thrust has been given to ensure 100 percent coverage of rural schools with toilet facilities by the end of 2006-07. All government schools in the rural areas with the TSC funds and all the private schools by their own resources will be covered. Special provisions are being made for girl students in all the schools. In all the co educational schools, separate toilet blocks for girls are being provided. Under TSC, 5,05,000 toilet blocks have already been sanctioned. TSC and Sarva Shiksha Abhiyan are properly integrated. With the intervention of TSC, the coverage is now (2005) estimated to be about 32.36%. Full coverage of Anganwadis: One other important activity is to ensure 100 percent coverage of Anganwadis with baby-friendly toilets by the end of 2006-07. Total Sanitation Campaign (TSC) ! ! ! ! ! Each TSC project is to be implemented over a period of 3 to 4 years. TSC is at present sanctioned in 520 districts in the country. 46 more districts have been provided start up grant for baseline survey and TSC project report preparation. 14.2 million rural households have been provided with toilet facilities Nirmal Gram Puraskar has been launched which is applicable to the Panchayats, individuals and also organizations working for sanitation promotion and defecation free rural environment. Sanitary pan being laid under Total Sanitation Campaign INDIA COUNTRY REPORT 2005 89 GOAL 7 SUCCESS STORIES Nandigram shows the way for defecation free block Ram Krishna Mission Lok Siksha Parishad, facilitated by UNICEF, has shown the way how close co ordination can be achieved amongst different stakeholders for achieving total rural sanitation coverage. With the help of youth clubs and motivators, the concept of hygiene and sanitation was successfully promoted in Nandigram II Block of East Medinipur District in West Bengal. As a result, the rate of adoption and use of home toilets substantially increased and the entire Nandigram II Block has attained defecation free status and full rural household coverage. Needless to say, with such pioneering effort in sanitation, Nandigram II Block has encouraged others to follow the path towards improved sanitation. Alwar Schools Commit for Total Sanitation Partnership found new dimension when in March 2000, the School Health and Sanitation Programme was launched under the District Primary Education Programme with support from UNICEF and Rajasthan Council of Primary Education Started initially in 5 blocks, it was later extended to all 14 blocks by 2003, covering over 1600 primary and upper primary schools in Alwar. From 1998-99 to 2003-04, the enrolment of boys and girls both has increased impressively. Recently analyzed data suggest a steep increase in girls enrolment by 78 per cent while that of boys by 38 per cent (overall 53.31 per cent). Performance data from project schools has shown tremendous improvement vis à vis non project schools. The average percentage of marks obtained by boys and girls under project schools (taken up in Phase I in 2000) were 81 and 80.5 per cent respectively compared to the 53.7 and 51.7 per cent obtained by boys and girls of non project schools. Tamil Nadu creates niche in school Sanitation Tamil Nadu has shown significant progress in sanitation, not only in implementing the programme successfully but also making value additions in the sanitation programme. This is reflected in the involvement of Self Help Groups (SHGs) in awareness generation and production of sanitary materials. The State has also taken steps to prioritize the School and Anganwadi sanitation programme with proper school based monitoring system. In schools and community sanitary complexes, incinerators have been set up for proper disposal of sanitary napkins and other wastes. Kitchen garden and biogas plant are also promoted in the sanitation programme. In addition, focus has also been on proper disposal of solid waste in the villages managed by SHGs, which has on one hand made the villages clean and on the other hand provided employment. No doubt, the case of Tamil Nadu presents a good model for promoting school sanitation and hygiene education. 90 MILLENNIUM DEVELOPMENT GOALS Borban is a small community of about 185 families in Sangamner Taluka of Ahmednagar district in Maharashtra. Today the villagers have an air of achievement and confidence about them as all households have constructed individual household toilets. This transformation started with the village actively taking part in the Sant Gadge Baba sanitation campaign and ranked second at the district level competition. The villagers decided to adopt the challenge of ending open defecation in their village. Each household decided to construct a household toilet. Since it was the lean period, the people had no financial resources available to buy even the material required for a low cost toilet. The Sarpanch of the village immediately agreed to stand guarantee for supply of construction material thus making it possible for the people to purchase on credit from the local market. The district administration exposed them to cost effective toilets so that everyone can afford to have toilets according to their paying capacity. 7.23. The following Strategies were adopted for meeting the MDG Goals : (i) (ii) Scaling up of TSC: TSC is at present sanctioned in 520 districts in the country. It is aimed to sanction TSC in all the remaining rural districts by the end of 2005-06. Each TSC project is implemented over a period of 3-4 years. Therefore, all these projects will be completed by 2010. There will be few slow moving districts, which may take more time. We aim to complete all projects by 2012. Since launch of TSC, 14.2 million rural households have got toilet facilities. The sanitation coverage has increased from 22% to 33%. There are approximately 90 million more households yet to have sanitation facilities. With mission mode approach under TSC it is expected to accelerate the set goals. School Sanitation and Hygiene Education: School sanitation has been introduced in TSC with three major objectives. (a) There is requirement of toilet facilities in schools especially for girls. In the absence of such facility higher drop out rate among children, especially girls, is noticed. (b) Children can INDIA COUNTRY REPORT 2005 7 GOAL Borban A model of community pride and solidarity adopt hygiene behaviour fast and will lead to change in hygiene behaviour in their generation. (c) Children are good change agents, and can influence the family and community for adopting sanitation and hygiene behaviour. For school sanitation, intersectoral coordination among the Departments such as Education, Health, Women and Child, Tribal Welfare, Social Justice and Empowerment has been initiated. This has resulted in quality improvement in the domestic and community sanitation, besides improved hygiene education. (iii) Creating an enabling environment: The State Governments are providing policy and financial support as part of the enabling environment for sanitation coverage. 91 GOAL 7 (iv) (v) TSC Guidelines being improved: Based on the Mid term evaluation of TSC, it is proposed to bring about required policy changes which includes revision in the unit cost of household toilets, inclusion of superstructure as unit cost, provision of solid waste management in TSC and a corpus fund to be utilized by Self Help Groups, Dairy Cooperative Societies etc for lending on zero interest to their members for toilet construction. These changes will help in accelerating sanitation coverage. Budgetary support for rural sanitation stepped up: Considering the importance of rural sanitation promotion, the allocation has been increased more than four fold in last two years. (vi) Emphasis on IEC: TSC implementation requires intensive Information Education and Communication (IEC) for demand generation for sanitation facilities. A national IEC strategy has been developed. The communication strategy focuses on mass media campaign on sanitation and hygiene issues at the national, and district level and interpersonal communication at the grassroots level. policies and strategy for TSC implementation, different stakeholders like Panchayats, NGOs, School Teachers, Anganwadi workers, Masons, Health workers, Engineers, District & Block level Programme Managers will be trained and oriented towards different aspects of sanitation promotion. The Communication and Capacity Development Units (CCDUs) at the State level have been financially supported (Rs 220million). (viii) Network of Training Institutions: A number of training institutions is being networked at the national and State level to take up the task of capacity development of stake holders. (ix) National Awards Nirmal Gram Puraskar: TSC implementation requires social mobilization of all stakeholders.. In order to seek the greater participation of Panchayats in the sanitation promotion, an incentive scheme Nirmal Gram Puraskar has been launched which is applicable to the panchayats, individuals and also organizations working for sanitation promotion. Those Panchayats, which completely eliminate the practice of open defecation, provide water supply and toilet facility to Schools and Anganwadis and maintain general cleanliness, are eligible for the award. (vii) Emphasis on Capacity Building: Since there is a major shift in the Nirmal Gram Puraskar ! Nirmal Gram Puraskar (Award for Clean Villages) are awarded to Village, Block and District Panchayats. ! 38 Village Panchayats and 2 Block Panchayats (Nandigram in West Bengal and Melpuram in Tamil Nadu) received National Clean Village awards. ! Rs. 1.30 million were given as award funds. 92 MILLENNIUM DEVELOPMENT GOALS Develop a Global Partnership for Development Target 12: Develop further an open, rule based, predictable, nondiscriminatory trading and financial system Target 13: Address the special needs of the least developed countries Target 14: Address the special needs of landlocked developing countries and small island developing States Target 15: Deal comprehensively with the debt problems of developing countries through national and international measures in order to make debt sustainable in the long term Target 16: In cooperation with developing countries, develop and implement strategies for decent and productive work for youth Target 17: In cooperation with pharmaceutical companies, provide access to affordable essential drugs in developing countries Target 18: In cooperation with the private sector, make available the benefits of new technologies, especially information and communications INDIA COUNTRY REPORT 2005 8 GOAL GOAL 8 MILLENNIUM DEVELOPMENT GOALS Develop a Global Partnership for Development Target 12: Develop further an open, rule based, predictable, nondiscriminatory trading and financial system 8 GOAL Goal 8 Target 13: Address the special needs of the least developed countries Target 14: Address the special needs of landlocked developing countries and small island developing States Target 15: Deal comprehensively with the debt problems of developing countries through national and international measures in order to make debt sustainable in the long term Target 16: In cooperation with developing countries, develop and implement strategies for decent and productive work for youth Target 17: In cooperation with pharmaceutical companies, provide access to affordable essential drugs in developing countries Target 18: In cooperation with the private sector, make available the benefits of new technologies, especially information and communications. 8.1 Goal 8 addresses macro-economic policy, including trade, debt, official development aid, financing for development, good governance, a global partnership for development, as well as such concerns as youth employment, small island states and land-locked countries, access to affordable essential drugs and access to information and communications technology. Trade has to be addressed from a gender perspective too as trade rules encroach on other areas such as services, agriculture, intellectual property rights and investment. This includes mobilization and advocacy to impact WTO negotiations and regional trade deals. Gender analysis of trade explores the roles women and men play in the economy as producers, traders and consumers, and INDIA COUNTRY REPORT 2005 how trade accords affect them in those roles. For example, dumping of cheap food imports, which devastates local markets mainly affects women, who are primary food growers. The migration of males from rural areas to the cities in search of work, sometimes within a country, sometimes across borders increased risk of trafficking and diseases. Women, too, are migrating in increasing numbers to provide income for themselves and families at home, as jobs and livelihoods disappear at home. Remittances become a major source of development financing, but at a major cost for women migrants. Gender bias in access to credit and export facilitation may hurt women entrepreneurs who seek to export, as does lack of access to longdistance transport. GATS also will have a huge 95 MILLENNIUM DEVELOPMENT GOALS 8.2. Indias economy has undergone a substantial transformation since the countrys independence in 1947. Agriculture now accounts for only one-fifth of the gross domestic product (GDP), and a wide range of modern industries and support services now exist. Starting in 1991, India began to implement trade liberalization measures which has improved market access and consequently increased labour participation in a number of export-led sectors and industries where women are predominantly employed. At the same time, automation and technological advancements have exposed unskilled workers and especially women. The adjustment costs of trade liberalization vary from sector to sector and industry to industry. Where industries are competing to match production cost and delivery price of their competitors, female workforce often becomes the immediate target. In the above backdrop, a gender-analytical approach has identified the key mechanisms and pathways by which, globalisation, WTO and related agreements impact on women in terms of social adjustment, employment, wage levels, poverty reduction, empowerment and overall economic and social well-being. 8.3. Especially in the post-globalisation and the post-WTO context, women in India today are related to the global economy to a very some extent as producers, INDIA COUNTRY REPORT 2005 entrepreneurs, service providers, consumers and citizens. Most women in the informal economy have no direct access to markets but either work as casual workers for wages or as piece rate workers for trades and services. In view of the pace at which technology and markets advance today, it becomes important that women are given the opportunity to undergo capacity development and skill upgradation in the new and emerging areas. Gender impact assessments are being carried out so as to formulate minimal policy positions on sectors like agriculture and food processing, textiles and clothing, handicrafts and handlooms, fisheries and marine products, etc, where womens share in employment is between 55 to 65 per cent. Adequate safety nets are being provided to the most disadvantaged, especially women. Further efforts are on for improving infrastructure and enterprise and market development skills of women workers and entrepreneurs. Capacity building and training of the women in industry - the entrepreneurs, the workers, and service providers is now prioritised to help women face the challenges of globalisation. 8 GOAL impact on all the MDG that imply delivery of key services, as well as regulations such as environmental protections or labour and gender equality requirements. Goal 8 frames the trade debate solely in terms of market access for goods from developing countries to developed countries. This raises the larger question about the need for fair trade; for open, democratic and transparent trade negotiations; for more equal terms of trade; and for rules that do not over-ride local and national economic policy making and democratic decisionmaking (in terms of labour law, environmental law, human rights law and affirmative action, among others). Information and Communication Technology 8.4. Twenty years ago, India faced tremendous challenges when it set on its ICT journey. The PC revolution was yet to encompass the country, the telecom infrastructure was low and there was virtually no indigenous software or hardware development to talk about. The ICT industry, at a very nascent stage, appeared far behind its Western counterpart. Today, in 2005, the scenario has undergone an amazing transformation. The Indian ICT industry, in particular the IT software and services and ITES sectors, have not only managed to catch up with their more technology savvy global leaders, but they are also being actively sought by companies worldwide for their onsite, offshore expertise and wealth of manpower resources. Indian ICT 97 1999), the progress has been much faster. The total number of telephones (Basic + Mobile) increased from 22.8 million in 1999 to as high as 120.67 million in November 2005. The number of cellular phones increased from only 1.2 million lines in 1999 to about 55 million lines in November 2005. Consequently, the overall teledensity, which was only 0.67% in 1991, increased to 2.33% in 1999 and now stands at 10.87% in Novermber 2005. Telecom Sector Development 8.5. Telecommunication sector in India has witnessed a dramatic transformation on almost all the fronts and has received national recognition as the key driver for development and growth. With monopoly giving place to competitive regime, tariffs have declined drastically. The share of private sector has increased tremendously and mobile telephony is becoming predominant in the sector. Consequently, the structure of telecom services which till recently was considered as an elitist luxury has undergone a complete change and has now become a necessary good of mass consumption. The importance of telecom sector can be gauged from the immense contribution it is making to other sectors of the economy particularly the Information Technology industry. The change is clearly visible in the areas of ebusiness, e-banking, e-education, e-health, etc. Several studies have shown a strong correlation between the growth of telecom sector and Gross Domestic Product. Status of rural telecom services (30th November 2005) Rural teledensity of 1.78 as compared to the urban teledensity of 33.28 and an overall teledensity of 10.87. There are 28971 BSNL exchanges in the rural areas having optical fibre connectivity. So far 537,913 villages in the country have been connected using a Village Public Telephone (VPT) of the BSNL and private operators. Out of the remaining 66,822 villages to be provided with VPT facility, 10,435 VPTs have been provided till July 2005. The remaining villages are likely to be provided with this facility by November 2007 in phased manner. There are 14.06 million connections in rural areas owned and operated by BSNL. l l l l l Urban 2005 10.87 1.78 8.95 26.88 2004 1.73 20.74 1.57 2.86 8.36 0.68 98 Total 33.28 Rural Teledensity 8.6. The total number of telephones, which was only 80,000 in 1948, gradually increased to 4.589 million in 1990. The first National 35 Telecom Policy (NTP) was announced in 1994 with the 30 primary objective of 25 telecommunication for all and within the reach of all. 20 By 1999, the number of 15 telephones increased to 22.8 10 million lines. This was a quantum jump in relation to 5 the past performance. 0 However, with the 2000 announcement of New Telecom Policy 1999 (NTP 7.02 GOAL 8 organizations are now counted among the well known and reputed ICT solutions and services providers across the world and scores of global ICT leaders have invested in India, making the country their hub for software development, offshore outsourcing and R&D. Nov'05 Year MILLENNIUM DEVELOPMENT GOALS such, of the 110.37 million total phones, private sector has contributed about 56.47 million phones as on 31st August 2005. Thus, in the liberalized policy regime, the private sector has been encouraged to provide the required telecom services, which in turn has contributed to healthy competition in the sector. ( I n L a kh ) 8.9. The exponential growth in the telecom sector has been mainly due to the positive and proactive policies consistently pursued by the Government. The series of policy measures include introduction of cost effective technology neutral telecom services, introduction of New Telecom Policy 1999, setting up of an independent regulator i.e. Telecom Regulatory Authority of India (TRAI) to decide/recommend tariffs 8.8. Private Sector Participation: Prior to and other policy measures along with 1999, there were very few private setting up of Telecom Dispute Settlement operators in the field. With the and Appellate Tribunal (TDSAT) to announcement of NTP 1999, large number adjudicate on the telecom disputes. The of private operators has been given major services freed for competition are licences. Out of 54 cellular mobile licences, basic and mobile telephony, NLD and ILD 31 licences have been issued to private services, Internet, provision of sector. Similarly, 83 Unified Access Service infrastructure etc. Some of the policy Licences including migrated basic, initiatives taken after 2000 include (1) migrated cellular and new have been issued Bharat Sanchar Nigam Ltd. (BSNL) was as on 30th June 2005. Further, for other formed in October 2000 i.e. service services such as NLD, ILD, Internet, VSAT, providing functions were taken out of Infrastructure Provider Services, private government. (2) National Long Distance sector has taken substantial share of the (NLD) service was opened. (3) Calling Party licenses granted. The share of private Pays (CPP) regime introduced. (4) Unified telecom operators in the total phones Access licence regime introduced. (5) provided in the country has increased to Interconnection Usage Charges (IUC) about 51% as on 31st August 2005. As implemented. (6) Extensive growth of wireless. (7) Outdoor/Indoor usage of low power systems To ta l N u m be rs of P h on es (Fixe d +W L L+ C M P s ) (in Lak h) delicenced. (8) FDI limit increased 983.73 to 74%. (9) Custom Duty removed 1000.00 on all ITA-1 items. (10) Indigenous 900.00 manufacturing by global player 800.00 being encouraged. (11) USO Fund 700.00 600.00 established. (12) Intra-circle M&A 500.00 guidelines announced. (13) ISPs 400.00 allowed for laying of copper 228.13 300.00 cable. (14) Broadband Policy 200.00 80.2 6 45.8 9 announced. (15) Performance 100.00 Bank Guarantee reduced for ILD 0.00 1990 1994 1999 2005 and IP-II. 8 GOAL 8.7. Community Access: In addition to normal phones, community access has been provided through Public Call Offices (PCOs), Village Public Telephones (VPTs) and Rural Community Phones (RCPs). The number of PCOs has increased from 1.62 lakh in 1993 to 5.20 lakh in 1999 and now stand at about 22.00 lakh in August 2005. Out of 607,491 villages, VPTs have been provided in 533,899 villages by August 2005. Barring villages with less than 100 population, all the villages are likely to be covered by VPTs by 2007 through Universal Service Obligation Fund (USOF). RCPs are to be provided in 46,253 villages where population is more than 2000 and there is no public telephone facility (PCO) other than a VPT. Ye ar en din g 3 1st M arc h INDIA COUNTRY REPORT 2005 99 GOAL 8 Information Development Technology 8.10. Use of Personal Computers has tremendously increased from 5.4 million PCs in 2001 to 14.5 million in 2005. As on today, only every hundredth person has a personal computer, which is much less compared with any developed country. 8.11. Internet Users per 100 populations: Though we have a rapid positive trend for this indicator, compared to the developed countries, we are at the infant stage. Even the 200 th person is not an internet subscriber in India. However, every 35th person is using internet in India. Table 8.1 PC population and in use per 100 population Year (March Ending) 2001 2002 2003 2004 2005 PC population (in million) 5.40 6.00 8.00 11.00 14.5 PCs in use per 100 Population 0.53 0.58 0.77 1.04 1.34 Source: Ministry of Communications and Information Technology P C s in use per 100 pop ulation PCs in use per 100 Pop ulation 1.4 1.2 1 0.8 0.6 0.4 0.2 0 2001 2002 2003 2004 2005 Year (M arch En ding ) Table 8.2 Status of Internet Subscribers As on 13-3-1999 31-3-2000 31-03-2001 31-03-2002 31.03.2003 31.03.2004 31.03.2005 30.06.2005 100 Internet Subscribers (million) 0.23 0.943 2.909 3.239 3.500 4.050 5.300 5.556 Source: Ministry of Communications and Information Technology MILLENNIUM DEVELOPMENT GOALS Internet Users and Internet Subscribers in India 2 8 GOAL per 1 00 p op ulatio n 2 .5 1 .5 1 0 .5 0 2 001 2 002 2 003 2 004 2 005 Yea r (M arch E nding ) 8.12. Indian ITES-BPO sector industry continues to grow from strength to strength, witnessing high levels of activity both onshore as well as offshore. The export revenues from ITES-BPO grew from US $ 2.5 billion in year 2002-03 to US $5.1 billion in the year 2004-05. The ITES-BPO sector has become the biggest employment generator amongst young college graduates with the number of jobs almost doubling each year. The number of professionals employed in India by IT and ITES sectors has grown from 284,000 in 1999-2000 to 1.05 million in 2004-05, growing by over 200,000 in the last year alone. The pace of recruitment picked up for IT services; while ITES-BPO companies were recruiting in large numbers through the year. It is estimated that the ITES-BPO sector hired 400 personnel every working day of the year. 8.13. The Government vision is to use Information Technology as a tool for raising the living standards of the common man and enriching their lives. Towards this end an INDIA COUNTRY REPORT 2005 ambitious programme of PC and Internet penetration to the rural and under served urban areas has been taken up. The Department of Information Technology has initiated a programme to establish State Wide Area Network (SWAN) upto the block level with a minimum Bandwidth of 2 MBPS to provide reliable backbone connectivity for E-Governance. Further, in order to bring about a substantially increased proliferation of .IN Internet domain name, a new .IN policy framework and implementation plan has been formulated and announced in October 2004. It aims to put in place a more liberal, efficient and market friendly domain name registration system. It aims to ensure that 101 MILLENNIUM DEVELOPMENT GOALS 8.14. The National Policy of the Government recognizes the potential of EGovernance not only to improve governance but also to facilitate peoples access to government services. We are working on a National E-Governance action plan that seeks to lay the foundation and provide impetus for a far more pervasive spread of E-Governance to reach the Common man particularly in far-flung areas. Seeking to do so we are putting together various elements that are needed for leveraging the enormous power of ICT for the economic development of our country and enable the common man to access Government services in an efficient, convenient and cost effective manner. 8.15. To bridge the imbalance between urban and non-urban areas, provide connectivity at grass-root level, and to facilitate the spread of benefits of applications including e-education, ehealth, tele marketing, e-governance, entertainment, etc. However, the current level of Internet and broadband access in India is abysmally low. In the Broadband Policy announced in October, 2004, the broadband connectivity has been defined as an always on data connection that is able to support interactive services including Internet access with a minimum download speed of 256 kbps to an individual subscriber. The policy visualizes creation of infrastructure through various access technologies for providing broadband services. It is expected that the number of broadband subscribers would be 3 million by 2005, 9 million by 2007 and 20 million by 2010. 8 GOAL the Internet traffic, which originates within India and also has destination in India, remains within the country, resulting in improved traffic, reduced cost and better security. 8.17. Other initiatives taken by the Government in the IT Sector include announcement of the Information Technology Act 2000 for copyright protection, the Internet Service Providers (ISPs) Policy permission to private ISPs to set up international gateways and internet access through cable TV infrastructure among others. Goals for Broadband l l l Nine million broadband subscribers by 2007 20 million broadband and 40 million Internet subscribers by 2010, which translates into penetration levels of 1.70 per cent and 3.40 per cent respectively. Make appropriate and locally relevant e-education, e-Governance, entertainment and e-commerce services and employment opportunities available through broadband connectivity to all cities, towns and villages in India. Information and Communication Technology to all and to accelerate the socio-economic development of these areas, the Department has set up Community Information Centres (CICs) in hilly, far-flung areas of North-East and J&K. It is also proposed to set up CICs in other hilly, far-flung areas of the country. 8.16. Broadband services greatly contribute in the growth of GDP through INDIA COUNTRY REPORT 2005 Special needs of the least developed countries 8.18. The financial support needed to achieve the targets under this Goal had been estimated by a high-level panel on Financing for Development headed by former Mexican President Ernesto Zedillo, at an additional amount of US $ 50 billion which would be required for this purpose 103 GOAL 8 every year till 2015. The World Bank estimates also peg the requirement at around US $ 40-60 billion annually. Recognizing the difficulties that the developing countries would be facing in generating such resources for development, the UN Millennium Summit endorsed an International Conference of Financing for Development. The Conference, held in Monterrey, Mexico, in March 2002 - popularly known as the Monterrey Consensus, called for allocation of increased Official Development Assistance (ODA) for the developing countries. 8.19. However, a huge gap still exists between the development assistance required to meet the MDGs and what has been pledged by the developed countries so far. Official development assistance has remained more or less static in the first four years of the millennium although there is now a welcome upward trend. This is despite a clear recognition by almost all panels that the very minimum US $ 50 billion would be required to achieve even a fraction of the MDGs. Donor aid trends to be fragmented, and also have numerous conditionalities which make it difficult for recipient countries to properly utilize the aid for purposes of development. Though a consensus has been reached for the need to harmonize external aid, individual countries still indicate a preference to bilaterally negotiate aid requirements rather than channelise aid through multilateral agencies. Aid Effectiveness and Financing 8.20. Recent months have seen new commitments toward reaching the internationally accepted 0.7 percent of Gross National Income (GNI) target. These have the potential for improving aid over the low levels of 2000. Multilateral agencies have demonstrated the capacity for effective utilization of aid resources and our efforts should be to maximize flows through these channels. However, we have reminded that these potential increases still leave Development Assistance Committee donor countries as a group well short of 0.7 percent. Also, much of the recent increase in bilateral ODA has been in the form of special purpose grants such as debt relief, emergency relief and technical cooperation. It is a matter of concern that cash finance for projects and programs is unlikely to have registered any significant increase. We are supportive of the efforts for various innovative sources of financing such as the International Financing Facility (IFF) and levy on Airline tickets and note the launch of the International Financing Facility for Immunization. However, it will be important to ensure that these new measures bring about a sustained and genuine additionality of development resources. 8.21. It is also a matter of satisfaction that actual disbursements of ODA, in recent years, have shown a welcome reversal of the declining trend that lasted for almost a decade since the early 1990s. The issues of aid effectiveness and aid financing have more recently been reviewed in the context of the Millennium Development Goals. There have been certain issues raised regarding the centrality of country based approaches and the push for progress on specific MDGs. We do not feel that there is any divergence in this regard. However, the realization of the MDGs has to be a shared resolve and commitment of all nations. While the primary responsibility will be of the countries concerned themselves, in the case of many poor countries, this will require active support of the donor nations. In this regard, it is important to realize that unless aid commitments translate into actual delivery, securing MDGs will remain elusive goals. We do hope that all the developed countries would scale up the ODA to realize the goals reaffirmed at the Monterrey Consensus. 104 MILLENNIUM DEVELOPMENT GOALS Addressing the Problems of Debt 8.23. Unsustainable debts have increasingly been recognized as a constraint on the ability of poor countries to pursue sustainable development and reduce poverty. Among the responsibilities of the world community is the opening of markets for developing countries exports, increasing aid flows, and helping to reduce the burden of international debt on heavily indebted low-income countries so that they can utilize their resources for poverty reduction. To deal with the problems of debt, the Heavily Indebted Poor Countries (HIPC) Initiative was launched by the World Bank and IMF and endorsed by some 180 governments. It has been working as a sound and effective instrument to provide the poor countries a way out of the debt trap. In regard to the HIPC Initiative, India is of the view that the Initiative should be met by additional funding from the developed countries and the flow of concessional assistance to other countries should not be reduced. India also opposes the concept of equitable burden sharing since some of the non-Paris Club creditor countries are themselves poor countries. 8.24. We have supported the G8 initiative on irrevocable debt cancellation for the HIPC countries which has now been adopted by IMF and the World Bank as the Multilateral Debt Relief Initiative (MDRI). We have always been supportive of all efforts being extended to the low-income countries (LICs), including those in Africa, where debt burdens are serious threats to attainment of the MDGs. However, the vast ambit of the MDRI proposal draws attention to some implementation issues and we have held the view that it is essential to ensure that no IDA recipient country is worse off post-debt cancellation. Moreover, debt stock cancellations should be complemented by sharp increase in ODA in keeping with the Monterrey Consensus. This will ensure that the financial integrity of the International Financial Institutions is preserved in the larger interest of the global development community. It is essential to ensure that the financial integrity of IDA, which is a premier multilateral development agency, is not in any way impaired. For this, concrete steps in terms of binding commitments beyond the IDA-14 period; agreement among the donors on sustainable burden sharing arrangements; design of a transparent and consultative implementation framework; and a participatory process to develop mechanisms to monitor and prevent recurring cycles of indebtedness would be critical. In the event of the proposal not receiving full financing to the extent of debt cancelled, the reduced reflows will deplete the envelope size of future IDA replenishments. This may also reduce fresh allocation to other IDA recipient countries, thereby adversely affecting their poverty reduction and MDG oriented efforts. 8 GOAL 8.22. It has also been our consistent position that additional resources for implementing the development agenda should be channelized through the existing multilateral agencies. Moreover, allocations must be based on pre-defined and transparent criteria. Our own development experience clearly indicates that, ultimately, it is the availability of untied additional resources for use in accordance with national development strategies, which is most beneficial for recipient countries. 105 INDIA COUNTRY REPORT 2005 List of Goals, Targets and Indicators ANNEX-I ANNEX-I ANNEX-I 108 MILLENNIUM DEVELOPMENT GOALS Millennium Development Goals (MDGs) ANNEX-I ANNEX-I List of Goals, Targets and Indicators Goals and Targets Indicators Goal 1: Eradicate extreme poverty and hunger TARGET 1: Halve, between 1990 and 2015, the proportion of people whose income is less than one dollar a day 1. 2. 3. TARGET 2: Halve, between 1990 and 2015, the proportion of people who suffer from hunger 4. 5. Proportion of population below $1 (PPP) per day a Poverty gap ratio [incidence x depth of poverty] Share of poorest quintile in national consumption Prevalence of underweight children under- five years of age Proportion of population below minimum level of dietary energy consumption Goal 2: Achieve universal primary education TARGET 3: Ensure that, by 2015, children everywhere, boys and girls alike, will be able to complete a full course of primary schooling 6. 7. 8. Net enrolment ratio in primary education Proportion of pupils starting grade 1 who reach grade b Literacy rate of 15-24 year-olds Goal 3: Promote gender equality and empower women TARGET 4: Eliminate gender disparity in primary and secondary education, preferably by 2005, and in all levels of education no later than 2015 9. Ratios of girls to boys in primary, secondary and tertiary education 10. Ratio of literate women to men, 15-24 years old 11. Share of women in wage employment in the non-agricultural sector 12. Proportion of seats held by women in national parliament Goal 4: Reduce child morality TARGET 5: Reduce by two-thirds, between 1990 and 2015, the under-five mortality rate 13. Under-five mortality rate 14. Infant morality rate 15. Proportion of 1 year-old children immunized against measles 109 INDIA COUNTRY REPORT 2005 ANNEX-I Goal 5: Improve maternal health TARGET 6: Reduce by three-quarters, between 1990 and 2015, the maternal mortality ratio 16. Maternal mortality ratio 17. Proportion of births attended by skilled health personnel Goal 6: Combat HIV/AIDS, malaria and other diseases TARGET 7: Have halted by 2015 and begun to reverse the spread of HIV/AIDS TARGET 8: Have halted by 2015 and begun to reverse the incidence of malaria and other major diseases 18. HIV prevalence among pregnant women aged 15-24 years 19. Condom use rate of the contraceptive prevalence rate c 19 (a) Condom use at last high-risk sex 19 (b) Percentage of population aged 1524 years with comprehensive correct knowledge of HIV/AIDS d 19 (c) Contraceptive prevalence rate 20. Ratio of school attendance of orphans to school attendance of non-orphans aged 10-14 years 21. Prevalence and death rates associated with malaria 22. Proportion of population in malaria-risk areas using effective malaria prevention and treatment measures e 23. Prevalence and death rates associated with tuberculosis 24. Proportion of tuberculosis cases detected and cured under directly observed treatment short course DOTS (Internationally recommended TB control strategy) Goal 7: Ensure environmental sustainability 25. Proportion of land area covered by forest 26. Ratio of area protected to maintain biological diversity to surface area 27. Energy use (kg oil equivalent) per $1 GDP (PPP) 28. Carbon dioxide emissions per capita and consumption of ozone-depleting CFCs (ODP tons) 29. Proportion of population using solid fuels 30. Proportion of population with sustainable TARGET 10: Halve, by 2015, the access to an improved water source, urban proportion of people without and rural sustainable access to safe drinking water 31. Proportion of population with access to and basic sanitation improved sanitation, urban and rural TARGET 11: By 2020, to have achieved a 32. Proportion of households with access to secure tenure significant improvement in the lives of at least 100 million slum dwellers TARGET 9: Integrate the principles of sustainable development into country policies and programmes and reverse the loss of environmental resources 110 MILLENNIUM DEVELOPMENT GOALS TARGET 12: Develop further an open, rule- Some of the indicators listed below are monitored separately for the least developed based, predictable, non-discriminatory countries (LDCs), Africa, landlocked developing trading and financial system countries and small island developing States. Includes a commitment to good governance, development and poverty reduction-both nationally and Official development assistance (ODA) internationally TARGET 13: Address the special needs of the least developed countries ANNEX-I Goal 8: Develop a global partnership for development 33. Net ODA, total and to the least developed countries, as percentage of OECD/DAC donors gross national income Includes: tariff and quota free access for 34. Proportion of total bilateral, sectorallocable ODA of OECD/DAC donors to the least developed countries exports; basic social services (basic education, enhanced programme of debt relief for primary health care, nutrition, safe water heavily indebted poor countries (HIPC) and and sanitation). cancellation of official bilateral debt; and 35. Proportion of bilateral official more generous ODA for countries development assistance of OECD/DAC committed to poverty reduction donors that is untied 36. ODA received in landlocked developing countries as a proportion of their gross national incomes TARGET 14: Address the special needs of 37. ODA received in small island developing States as a proportion of their gross landlocked developing countries and small national income island developing States (through the programme of Action for the Sustainable Development of Small Island Developing States and the outcome of the Twentysecond special session of the General Assembly) TARGET 15: Deal comprehensively with the debt problems of developing countries through national and international measures in order to make debt sustainable in the long term Market access 38. Proportion of total developed country imports (by value and excluding arms) from developing countries and least developed countries, admitted free of duty 39. Average tariffs imposed by developed countries on agricultural products and textiles and clothing from developing countries 40. Agricultural support estimate for OECD countries as a percentage of their gross domestic product 41. Proportion of ODA provided to help build trade capacity 111 INDIA COUNTRY REPORT 2005 ANNEX-I 42. 43. 44. Debt sustainability Total number of countries that have reached their HIPC decision points and number that have reached their HIPC completion points (cumulative) Debt relief committed under HIPC Initiative Debt service as a percentage of exports of goods and services Unemployment rate of young people aged 15-24 years, each sex and total f TARGET 16: In cooperation with developing countries, develop and implement strategies for decent and productive work for youth 45. TARGET 17: In cooperation with pharmaceutical companies, provide access to affordable essential drugs in developing countries 46. Proportion of population with access to affordable essential drugs on a sustainable basis TARGET 18: In cooperation with the private sector, make available the benefits of new technologies, especially information and communications 47. Telephone lines and cellular subscribers per 100 population 48. Personal computers in use per 100 population/ Internet Users per 100 population The Millennium Development Goals and targets come from the Millennium Declaration, signed by 189 countries, including 147 heads of State and Government in September 2000 (http:/ / w w w. u n . o r g / m i l l e n n i u m / d e c l a r a t i o n / ares552e.htm). The goals and targets are interrelated and should be seen as a whole. They represent a partnership between the developed countries and the developing countries to create an environment at the national and global levels alike which is conducive to development and the elimination of poverty. d. Note: Goals, targets and indicators effective 8 September 2003 a. b. c. For monitoring country poverty trends, indicators based on national poverty lines should be used, where available. An alternative indicator under development is primary completion rate. Amongst contraceptive methods, only condoms are effective in preventing-HIV transmission. Since the condom use rate is only measured among women in union, it is supplemented by an indicator on condom use in high-risk situations (indicator 19a) and HIV/AIDS knowledge (indicator 19b) an indicator on HIV/AIDS knowledge (indicator 19b). Indicator 19c (contraceptive prevalence rate) is also useful in tracking progress in e. f. other health, gender and poverty goals. This indicator is defined as the percentage of population aged 15-24 who correctly identify the two major ways of preventing the sexual transmission of HIV (using condoms and limiting sex to one faithful, uninfected partner), who reject the two most common local misconceptions about HIV transmission, and who know that a healthylooking person can transmit HIV. However, since there are currently not a sufficient number of surveys to be able to calculate the indicator as defined above, UNICEF, in collaboration with UNAIDS and WHO, produced two proxy indicators that represent two components of the actual indicator. They are the following: a) percentage of women and men 15-24 who know that a person can protect herself/ himself from HIV infection by consistent use of condom; b) percentage of women and men 15-24 who know a healthy looking person can trnsmit HIV. Prevention to be measured by the percentage of children under 5 sleeping under insecticide-treated bednets; treatment to be measured by percentage of children under 5 who are appropriately treated. An improved measure of the target for future years is under development by International Labour Organisation. 112 MILLENNIUM DEVELOPMENT GOALS Concepts, Definitions and Methodologies INDIA COUNTRY REPORT 2005 ANNEX-II ANNEX-II ANNEX-II 114 MILLENNIUM DEVELOPMENT GOALS Concepts, Definitions and Methodologies In this report generally the UN concepts definitions and methodologies have been adopted. Nowever, there are a few exception in which these are used as prevalent in the Indian context. 1.1 The poverty headcount ratio is the proportion of population whose per capita income/ consumption expenditure is below an official threshold(s) set by the National Government. The Planning Commission in the Government of India estimates poverty at national and state levels using the poverty lines as defined and applying it to the distribution of persons by household per capita monthly consumption expenditure. The national poverty line at 1999-2000 prices derived by aggregating the number of persons below the poverty line in different States and Union Territories and interpolating the per capita monthly consumption expenditure in the national distribution is Rs. 327. 56, per capita per month in rural areas and Rs. 454.11, per capita per month in urban areas. It corresponds to the consumption basket associated with the given calorie norm (2400 kcal in rural areas and 2100 kcal in urban areas) and meets a minimum of non-food requirements such as clothing, shelter, transport, etc. The relative price differentials prevailing in different States get reflected in the poverty lines for different States. These poverty lines are updated using the State-wise Consumer Price Index numbers for Agricultural Labourer (CPIAL) for estimating and updating the rural poverty line and Consumer Price Index of Industrial Workers (CPIIW) for estimating and updating the urban poverty line. The class-wise distribution of household consumption expenditure is obtained from the large sample surveys of household consumer INDIA COUNTRY REPORT 2005 ANNEX-II ANNEX-II expenditure conducted by the National Sample Survey Organisation in the Ministry of Statistics and Programme Implementation, generally once in every five years. The poverty line and poverty ratio are not estimated for a number of smaller states and UTs as the sample size in these States is small, and variations in the consumption expenditure on account of small sample make inter-temporal comparisons difficult. Moreover, priceindices data are also not available for smaller states separately. 1.2 Poverty gap ratio is computed by the Planning Commission by following almost the same methodology as followed in calculating head count ratio. It measures the degree to which mean consumption of poor falls short of the established poverty line and indicates the depth of poverty. 1.3 Share of the poorest quintile in national consumption is the consumption that is accounted for by the poorest fifth of the population. This indicator provides information about the distribution of consumption of the population according to income pattern. 1.4. Prevalence of (moderately or severely) underweight children is the percentage of children under five years old whose weight for age is less than minus two standard deviations from the median for the international reference population aged 059 months. The international reference population was formulated by the National Centre for Health Statistics (NCHS) as a reference for the United States and later adopted by the World Health Organization (WHO) for international use (often referred to as the NCHS/ WHO 115 ANNEX-II reference population). 2.1. Net primary enrolment ratio (NER) is the ratio of the number of children of official school age (as defined by the national education system) who are enrolled in primary school to the total population of children of official school age. Primary education provides children with basic reading, writing, and mathematics skills along with an elementary understanding of subjects as history, geography, natural science, social science, art and music. On the other hand Gross Enrolment Ratio (GER) is the number of pupils enrolled in a given level of education, regardless of age, expressed as a percentage of the population in the normative age group for the same level of education. The Ministry of Human Resource Development (Department of Secondary and Higher Education) collects the data on number of children/ pupils in various levels of education through an annual return from the schools and educational institutions. The annual age specific population for the pupils at different levels of education is estimated on the basis of the Census conducted by the Registrar General of India. 2.2. The proportion of pupils starting grade 1 who reach grade 5, known as the survival rate to grade 5, is the percentage of a cohort of pupils enrolled in grade 1 of the primary level of education in a given school year who are expected to reach grade 5. 2.3. Literacy rate of 1524 year-olds, or the youth literacy rate, is the percentage of the population 1524 years old who can both read and write with understanding a short simple statement on everyday life. 3.1. Ratio of girls to boys in primary, secondary and tertiary education is the ratio of the number of female students enrolled at primary, secondary and tertiary levels in public and private schools to the number of male students. The Ministry of Human Resource Development compiles the ratio of girls to boys in primary, secondary and tertiary education annually for each state and also at national level. The data presented in this report relates to the years 1990-91, 1996-97 and 20002001. 3.2. The ratio of literate women to men, 1524 years old (literacy gender parity index) is the ratio of the female literacy rate to the male literacy rate for the age group 1524. The ratio of literate women to men is available for population in the age group 7 plus instead of 15-24 as suggested by the UN. Data collected in 1991 and 2001 Population Censuses are used for calculating this ratio in respect of the states and at the national level. 3.3. The share of women in wage employment in the non-agricultural sector is the share of female workers in the non-agricultural sector expressed as a percentage of total employment in the sector. It is obtained from the quiniquennial NSS Surveys data on employment and unemployment. The last quiniquennial survey of employment and unemployment relates to the 61st round (2004-05) for which the data is being collected in the field. Prior to that, six such quiniquennial surveys have been conducted during NSS 27th (1972-73), 32nd (1977-78), 38th (1983), 43rd (1987-88), 50th (1993-94) and 55th (1999-2000) rounds. 4.1. The under-five mortality rate is the probability (expressed as a rate per 1,000 live births) of a child born in a specified year dying before reaching the age of five if subject to current age specific mortality rates. Office of the Registrar General of India compiles this ratio based on data collected through Sample Registration system. A resident part time enumerator collects the information on births and deaths continuously and prepares a monthly report. An official from organization (Supervisor) conducts an independent retrospective field survey 116 MILLENNIUM DEVELOPMENT GOALS 4.2. The infant mortality rate (IMR) is defined as the number of infants dying before reaching the age of one year per 1,000 live births in a given year. In India, data from two different sources are available for this indicator. The Census of India held once in 10 years provides a set of data for the years 1991 and 2001. The Registrar General of India also estimates annually the infant mortality rate through a sample registration scheme (SRS). The estimate of this indicator through SRS is considered reliable at the national level and also in case of bigger states. For the smaller states and Union Territories, the indicator is examined by applying the principle of moving averages for 3 years. 4.3. The proportion of 1-year-old children immunized against measles is the percentage of children under one year of age who have received at least one dose of measles vaccine. The data for this indicator are available for the age group 12-23 months in the administrative reports of Ministry of Health and Family Welfare on an annual basis. they have received a short training course, are not to be included. The data for this indicator are available at National as well as Sub National level and are reported by the Ministry of Health and Family Welfare. 6.1. HIV prevalence among 1524 yearold pregnant women is the percentage of pregnant women of ages 1524 whose blood samples test positive for HIV. It is taken to be HIV prevalence among pregnant women attending antenatal clinics in identified hospitals selected as sentinel sites. The samples are captured in the age group of 15-49, which are again segregated into two age groups of 15-24 and 25-49. Under the National AIDS Control Programme, National AIDS Control Organisation (NACO) conducts annual round of HIV sentinel surveillance in identified sentinel sites all over the country. Sample size of 400 is collected on consecutive basis with unlinked anonymous basis methodology in 12 weeks time. The sentinel sites report to the State AIDS control Sites (SACS), which further send it to NACO after necessary consolidation. 6.2. Condom use percentage at the high-risk age is the percentage of young people of ages 1524 reporting the use of a condom during sexual intercourse with a non regular sexual partner in the last 12 months. 5.1. The proportion of births attended by skilled health personnel is the percentage of deliveries attended to by personnel trained to give the necessary supervision, care and advice to women during pregnancy, labour and the postpartum period; to conduct deliveries on their own; and to care for newborns. 6.3. Percentage of population aged 15 24 years with comprehensive correct knowledge of HIV/AIDS is the share of women and men aged 1524 years who correctly identify the two major ways of preventing the sexual transmission of HIV (using condoms and limiting sex to one faithful, uninfected partner), who reject the two most common local misconceptions about HIV transmission and who know that a healthy-looking person can transmit HIV. 5.2. Skilled health personnel include only those who are properly trained and who have appropriate equipment and drugs. Traditional birth attendants, even if 6.4. Prevalence of malaria is the number of cases of malaria per 100,000 people. Death rates associated with malaria refer to the number of deaths INDIA COUNTRY REPORT 2005 ANNEX-II once in every six months. These records are matched in the office and field verification is done for unmatched records so as to arrive at an unduplicated count. An overlapping reference period of one year at the time of the half yearly survey has been adopted to net the events that might have been missed in the previous Half Yearly Survey by the part time enumerator and the Supervisor. 117 ANNEX-II caused by malaria per 100,000 people. 6.5. Tuberculosis prevalence is the number of cases of tuberculosis per 100,000 people. Death rates associated with tuberculosis refer to the number of deaths caused by tuberculosis per 100,000 people. A tuberculosis case is defined as a patient in whom tuberculosis has been bacteriologically confirmed or diagnosed by a clinician. 7.1. The Proportion of land area covered by forest is the forest areas as a share of total land area, where land area is the total surface area of the country less the area covered by inland waters, such as major rivers and lakes. As defined by the Food and Agriculture Organization of the United Nations in Global Forest Resources Assessment, 2000, forest includes both natural forests and forest plantations. It refers to land with an existing or expected tree canopy of more than 10 per cent and an area of more than 0.5 hectare where the trees should be able to reach a minimum height of five metres. Forests are identified by both the presence of trees and the absence of other land uses. Land from which forest has been cleared but that will be reforested in the foreseeable future is included. Excluded are stands of trees established primarily for agricultural production, such as fruit tree plantations. 7.2. The ratio of area protected to maintain biological diversity to surface area is defined as nationally protected area as a percentage of total surface area of a country. The generally accepted IUCN World Conservation Union definition of a protected area is an area of land or sea dedicated to the protection and maintenance of biological diversity and of natural and associated cultural resources and managed through legal or other effective means. 118 7.3. Energy use (kilogram oil equivalent) per $1 gross domestic product (PPP) is commercial energy use measured in units of oil equivalent per $1 of gross domestic product converted from national currencies using purchasing power parity conversion factors. In the Indian context, commercial energy use in kg oil equivalent per unit of GDP has been reported which includes consumption figures for coal and lignite, crude petroleum, natural gas (including feed stock) and electricity (hydro and nuclear) [primary energy only]. As consumption data of coal and lignite are not collected and compiled by any single agency, off take of indigenous Coal & Lignite and net import are taken as consumption with the assumption that stock changes both at producers and consumers and remain same. Again grade wise distribution or dispatches data is available and not that of the off-take. Therefore, average GCV in kilocal per kg for dispatch is taken as the average GCV of colliery consumption. Till now GCV concept has not been adopted for Indian coal and lignite like other coal producing countries of the world. 7.4. Carbon dioxide emissions per capita is the total amount of carbon dioxide emitted by a country as a consequence of human (production and consumption) activities, divided by the population of the country. In the global carbon dioxide emission estimates of the Carbon Dioxide Information Analysis Center of Oak Ridge National Laboratory in the United States, the calculated country emissions of carbon dioxide include emissions from consumption of solid, liquid and gas fuels; cement production; and gas flaring. National reporting to the United Nations Framework Convention on Climate Change, which follows the Intergovernmental Panel on Climate Change guidelines, is based on national emission inventories and covers all sources of anthropogenic carbon dioxide emissions as well as carbon sinks (such as forests). Consumption of ozone-depleting chloro-luorocarbons (CFCs) in ODP (ozone-depleting potential) tons is the sum of the consumption of the weighted tons of the individual substances in the MILLENNIUM DEVELOPMENT GOALS 7.5. Proportion of population using solid fuels is the proportion of the population that relies on biomass (wood, charcoal, crop residues and dung) and coal as the primary source of domestic energy for cooking and heating. In the Indian context, per thousand distributions of households reporting use of solid fuels for cooking has been reported and used. In household consumer expenditure surveys of NSSO, information in respect of primary source for cooking during the last 30 days is collected at the household level. The energy source used by the household is recorded as one of the following: Coke, coal chips Firewood and LPG Gobar gas Dung cake charcoal kerosene electricity others In case more than one type of energy is used, the type most commonly used by the household is considered. Among the energy types, coke, coal, firewood and chips, dung cake and charcoal has been considered as solid fuels for MDG reporting. 7.6. The proportion of the population with sustainable access to an improved water source, urban and rural, is the percentage of the population who use any of the following types of water supply for drinking: piped water, public tap, borehole or pump, protected well, protected spring or rainwater. Improved water sources do not include vendor provided water, packaged water, tanker trucks or unprotected wells and springs. ANNEX-II group-metric tons of the individual substance (defined in the Montreal Protocol on Substances that Deplete the Ozone Layer) multiplied by its ozonedepleting potential. An ozone-depleting substance is any substance containing chlorine or bromine that destroys the stratospheric ozone layer. The stratospheric ozone layer absorbs most of the biologically damaging ultraviolet radiation. 7.7. Proportion of the urban and rural population with access to improved sanitation refers to the percentage of the population with access to facilities that hygienically separate human excreta from human, animal and insect contact. Facilities such as sewers or septic tanks, poor-flush latrines and simple pit or ventilated improved pit latrines are assumed to be adequate, provided that they are not public, according to the World Health Organization and United Nations Childrens Funds Global Water Supply and Sanitation Assessment 2000 Report. 8.1. Telephone lines refer to the number of telephone lines connecting subscribers terminal equipment to the public switched network and that have a dedicated port in the telephone exchange equipment. Cellular subscribers refer to users of cellular telephones who subscribe to an automatic public mobile telephone service that provides access to the public switched telephone network using cellular technology. 8.2. Personal computers are computers designed to be operated by a single user at a time. 119 INDIA COUNTRY REPORT 2005 REFERENCES REFERENCES REFERENCES 122 MILLENNIUM DEVELOPMENT GOALS 1. Tenth Five Year Plan (2002-2007), Government of India, Planning Commission 2. Mid-Term Appraisal of 10th Five Year Plan (2002-2007), Government of India, Planning Commission (June 2005) 3. Platform for Action 10 years after India Country Report, Department of Women and Child Development, Ministry of Human Resource Development, Government of India 4. Annual Report 2004-05 of Ministry of Health and Family Welfare, Government of India 5. Annual Report 2004-05 of Ministry of Environment and Forests, Government of India 6. Annual Report 2004-05 of Ministry of Rural Development, Government of India 7. Annual Report 2004-05 of Department of Elementary Education and Literacy, Department of Secondary and Higher Education, Ministry of Human Resource Development, Government of India 8. Annual Report 2004-05 of Department of Information Technology, Ministry of Communications and Information Technology, Government of India 9. Annual Report 2004-05 of Ministry of Power, Government of India 10. Websites of the Central Ministries of Government of India REFERENCES References http://planningcommission.nic.in, http://powermin.nic.in, http://wcd.nic.in, http://www.dot.gov.in, http://envfor.nic.in, http://meaindia.nic.in, http://finmin.nic.in, http://mohfw.nic.in, http://muepa.nic.in, http://www.mit.govt.in, http://education.nic.in, http://rural.nic.in 123 INDIA COUNTRY REPORT 2005

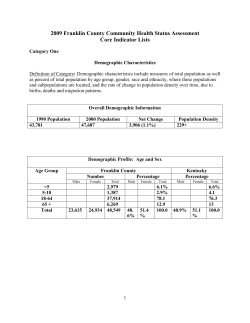


![This article was downloaded by: [BIBSAM] On: 24 May 2011](http://cdn1.abcdocz.com/store/data/000032198_2-615671ffd0fb69b51602bf18cb34d223-250x500.png)


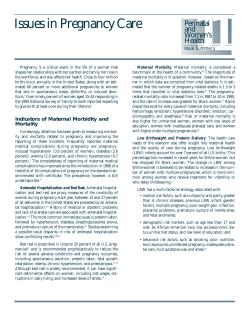
© Copyright 2026