
INDIA
INDIA
Policy Decision Analysis Brief
Food and Agriculture Policy Decision Analysis (FAPDA)
Draft for comments
May 2011
[email protected]
[email protected]
Table of contents
I. Introduction ................................................................................................................................................. 3
II. Objectives and approach of agriculture and FSN policies in India ............................................................. 5
III. Key policy decisions in agriculture and FSN .............................................................................................. 6
1. Policies that contribute to food availability .......................................................................................... 6
2. Polices that contribute towards improving food access and stability .................................................... 8
3. Policies that contribute to food utilisation...........................................................................................11
3.1.
General interventions ................................................................................................................. 12
3.2.
Specific interventions on micronutrients ...................................................................................... 12
3.3.
Specific interventions on pregnant women and lactating mothers .................................................13
3.4.
Specific interventions on drinking water and rural sanitation .........................................................13
IV Current and emerging policy issues.......................................................................................................... 14
V Institutional set up ..................................................................................................................................... 16
1. Ministries involved ............................................................................................................................. 16
2. Activeness of civil society .................................................................................................................. 16
3. Independent policy monitoring ........................................................................................................... 17
References..................................................................................................................................................... 18
Interviews ...................................................................................................................................................... 21
Annex 1: Policy implementation table ......................................................................................................... 22
Annex 2: Other programmes/schemes that contribute for food availability ............................................... 23
Annex 3: List of programmes/schemes that contribute for food access and stabilisation .......................... 24
Annex 3: Figures ............................................................................................................................................ 25
Figure 1. Real GDP growth ....................................................................................................................... 25
Figure 2: Per capita income growth ......................................................................................................... 25
Figure 3: Agriculture sector growth: value added as percentage of the GDP.......................................... 26
Figure 4: Population growth .................................................................................................................... 26
Figure 5: Food grain availability ............................................................................................................... 27
Figure 6: Food supply ............................................................................................................................... 27
Figure 7: Protein and fat supply ............................................................................................................... 28
Figure 8: Food consumption among rural households ............................................................................ 28
Figure 9: Insert table of agri wage/per day vs price/1 kg (wheat/rice) ......................................................... 29
Figure 10: Malnutrition in adults by gender ............................................................................................. 29
Figure 11: Malnutrition in children (0-5) ................................................................................................... 29
Notes ..............................................................................................................................................................31
Disclaimer
This working document is does not reflect the views of the Food and Agriculture Organization of the United
Nations (FAO) or of its collaborating organizations. The designations employed and the presentation of
material in this report do not imply the expression of any opinion whatsoever on the part of the Food and
Agriculture Organization of the United Nations concerning the legal status of any country, territory, city or
area or of its authorities, or concerning the delimitation of its frontiers or boundaries.
2
I. Introduction
Economic growth in the Indian economy after independence in 1947 passed through three phases. From 1948
to 1950, the focus of economic policy was on recovering from the dislocations caused by independence from
Britain and the partition of India into two states. The first Five Year Plan for economic development was
launched in 1951 and the first phase of Indian economic growth started in that year: from 1951 to 1981, real
GDP grew at an average rate of 3.5 percent p.a., the “Hindu rate of growth” as Prof Raj Krishna memorably
characterised it. From 1981 to 2003, the growth rate of real GDP increased to 5.5 percent following the
introduction of economic reforms in the 1980s, followed by another wave of reforms in 1991-92. The third
phase of Indian economic growth began in 2004, since when the growth rate of real GDP has averaged 8.3
percent p.a. (See Figure 1).
From 1951 to the present, real GDP has increased about fifteen-fold, with most of the increase occurring in the
last 30 years, while the population has grown 3.4 times, implying that real GDP per-capita has risen more than
four-fold, which is not a particularly large increase in 60 years (See Figure 2 and 4). This has been accompanied
by a fall in food insecurity and poverty and a rise in life expectancy. As would be expected, this decrease was
fairly small in the period from 1951-1981 when growth in per-capita GDP was slow. However, the period since
1990 in particular, represents something of a paradox. Despite the relatively stronger growth in real per-capita
1
GDP, average calorie consumption has fluctuated around 2300 kcal / person / day since 1990-92 (See Figure
2). The prevalence of underweight in children under 3 years of age has declined from 52 percent in 1992-93 to
46 percent in 2005-06. About one-third of women continue to be underweight and more than half are
anaemic. Infant mortality has, however, declined, but not as sharply as in other countries.
For its level of real per-capita income, India’s levels of per capita calorie intake, child underweight prevalence,
adult body mass, and other indicators are somewhat disappointing. Other countries at similar levels of percapita income have better indicators, implying that India could have done better.
It can be argued that, to some extent, these outcomes necessarily followed from the development strategy
adopted by the Indian government, which tended to a) discriminate against agriculture, and b) to the extent
that resources did flow into agriculture they flowed into the relatively well endowed areas. As regards the first
point, from the 2nd Five Year Plan (1956-1960), India's development strategy was based on the MahalanobisFeldman-Domar model of economic growth which called for priority to be given to investment in capital
goods, which would be used in turn to make machinery ("machines to make machines") and would ultimately
make consumer goods.
This implied that the terms of trade would move against agriculture because the industrial sector was
protected, while agricultural exports were banned. The extraordinarily high levels of protection in India
(comparable to the Soviet bloc) meant that the Indian rupee became seriously overvalued, thus hurting the
agricultural sector, in which India had comparative advantage.
Neglect for agriculture was built into this strategy (See Figure 3). The result was that there was essentially no
yield growth in Indian agriculture from 1950 to about 1965. Whatever agricultural growth occurred did so as a
result of area expansion. As a result, India's food needs from 1956 to 1966 were met through food aid from the
United States under PL 480, which had the advantage of being repayable in rupees. During these years, food
aid from the United States was rarely under 4 million tonnes of wheat per year. Almost 75 percent of the
foodgrains supplied to the fair price shops came from PL 480 imports.
This phase ended in a succession of bad harvests in the mid-sixties, and a war with Pakistan. Food prices began
to rise sharply and near famine conditions prevailed in Bihar and Eastern Uttar Pradesh. From 1966 onward,
the U.S. government changed its policy on food aid. It began to insist on payment in dollars for food
shipments to India. Much more importantly, it tried to restrict food shipments in order to compel India to
negotiate with Pakistan.
1
Food Balance Sheets. Food and Agriculture Organization. See Figures 6 and 7 for food supply, protein and fat supply.
3
With the drying up of food aid under PL480, the Indian government was forced, out of desperation, to try to
increase food and agricultural production with the aim of achieving self-sufficiency. There were two key
aspects of its strategy, however, that had important implications for inequality and poverty.
⋅
First, in increasing agricultural production it focused on areas which were already well endowed with
irrigation, transport and storage infrastructure.
⋅
Secondly, because these areas were relatively well endowed, there was no need to develop
infrastructure and so the focus was on price policy, i.e. subsidies, and support prices as the means to
stimulate agricultural growth. Agricultural growth was confined to the North-Western region from
the mid-sixties to the mid-seventies, spread to the Central and parts of the Southern region in the
decade from the mid-seventies to the mid-eighties and to the Eastern region in the decade from the
mid-eighties to the mid-nineties. Those parts of the country where rain-fed agriculture was important
were basically neglected. It was helped, of course, by the development of the new varieties of wheat
and rice from CIMMYT and IRRI, which were adapted to Indian conditions by the Indian agricultural
research system.
It should be clear that rising inequality was built into the economic development strategy. First of all, it
discriminated against the agriculture sector which contained the largest numbers of poor and hungry people in
India. Secondly, within agriculture it discriminated against rain-fed areas which is where the really poor were
located. Thirdly, promoting agricultural growth through price policy as opposed to infrastructure development
tended to favour larger farmers who had a surplus to sell. Smallholders, by contrast, would have benefited
more from infrastructure development as it tends to reduce costs of production and benefits everyone
because of its nature as a public good. This point leads to another: the neglect of basic public goods, such as
universal primary education particularly for girls, provision of basic health services, provision of safe drinking
water etc. was an important cause of the failure of nutritional outcomes to improve in the 1990s: food
utilization was poor in the absence of these complementary public inputs. Indeed it can be argued that GDP
growth in India since the early 1990s in particular, is largely about increasing private consumption, coupled
with a neglect of public goods. This had profound implications for the way malnutrition developed.
There is now increasing recognition of the fact that continuing with the existing strategy will not deliver the
hoped for reductions in malnutrition. Protection to industry did decline significantly following the reforms of
1991 and it is also a fact that the Indian Rupee is no longer overvalued. It follows that there must have been an
indirect reduction in the taxation of the agricultural sector in India in the 90s. However, this is not enough:
three key developments need to take place. First of all, the growth strategy needs to be reoriented towards
investment in infrastructure and needs to be focused on rain-fed areas in order to increase the incomes of the
poor. Secondly, there needs to be an increased focus on public goods provision, particularly of basic
education, safe water and food and basic health services. Thirdly, there needs to be an overarching
government body to coordinate government policy related to food security and nutrition, partly because of
the new legislation on the Right to Food which will require coordinated government response.
The rationale behind the preparation of this “policy decision analysis brief” is to acknowledge the status of
policymaking on the areas where Government of India (GOI) is taking decisions regarding agriculture, and
food security and nutrition policies. A key aim is to better understand the background and process of
implementation of food and agriculture development policies, particularly; those contributing to improve food
2
availability, food access & stabilisation, and food utilisation are revised . This document is organized in 5
sections. Second section gives a background of the objectives and approach of agriculture and FSN policies.
Third Section reviews key policy decisions for food and agriculture policies. Fourth section presents the
emerging policy issues. An institutional set up is reviewed in the fifth section to provide quick background of
the actors involved (government, civil society, international partners) in the formulation, implementation and
monitoring of agriculture and FSN policies.
2
An initial collection of data was made in order to understand policies’ setup. During October 2010, fourteen interviews
were conducted with various stakeholders (Government Authorities, International Partners, NGO's, Academia and Public
Research Centres) to complete information and introduce diverse perspectives. Other policy decisions that are not directly
related to food and agriculture are included, provided that they have a significant affectation on targeted population.
4
II. Objectives and approach of agriculture and FSN policies in India
Since 1947, after India’s territory was divided in two (Pakistan), India’s main concern has been to ensure food
production and consumption for its population. At that time, agriculture policy focused on domestic food
supply. As yet, mayor policy changes within the sector are delineated by liberalisation of food grain markets.
Therefore, current agriculture and food policies have been formulated under two pillars: (a) Improve access to
food to the most vulnerable population at affordable prices, and (b) Increase availability of rice and wheat, in
terms of guaranteeing fair prices to farmers. Indirectly, there are different programmes and specific
government interventions that aim to improve utilisation of food nutrients.
Agriculture has not been in the centre of development strategies. Since mid-1960s, main approach has been
characterised by a strong government intervention in food grain markets. After a period of rapid
i
industrialization supported by protectionist measures (before the Green Revolution era/ early 1960s), the
government started to pay more attention to land productivity. Successful measures strengthened
agricultural research, and pricing policy ensured remunerative prices to farmers without harming consumers.
However during the decade of 1980, changes in the macroeconomic environment (oil shocks, exchange rate
ii
and inflation ) pushed toward a more liberal and open economy regime. Unfortunately, agriculture sector
iii
suffered from market distortions produced by economic reforms implemented for in non-agriculture sectors
(industrial mainly). It was until late 1990 when agricultural-sector reforms took place.
In recent years, livestock, poultry, fisheries and horticulture are surging ahead in production growth and will
have greater demand in the future (Planning Commission: 2002). Agriculture growth, including crop and
animal husbandry, fisheries, forestry and agro processing reached 17 percent in 2009 (WDI:2009). Despite the
fact that the share of this sector in the GDP has been declining over the years, its role remains critical. It
provides employment to 52 percent of the population.
As regards nutrition, the only National Nutrition Policy in India was formulated in 1993 with a multisectoral
perspective. Main areas for government intervention are identified as: (a) Direct- short term interventions:
focusing on vulnerable groups (safety net recipients, pregnant and lactating mothers, and adolescent girls)
and fortification of essential food products and (b) Indirect – long term interventions: dietary patterns, income
and education. Lack of enforcement at implementation level persists even though in 1995 the Plan of Action
delineated the rules for key departments centrally. During the 10th Five Year Plan an initial road map for
nutrition was traced with a more comprehensive focus. On the side of food supply, a nutrition orientation was
given to food production policies with emphasis on increase in the production of pulses, vegetable and fruit.
On the demand side, an emphasis was made to maintain affordable prices for the population. From then on,
agriculture and nutrition priorities started to merge slowly towards a more sustainable improvement in
nutrition and health status of the population. (Ramachandran, Nutrition Foundation of India).
The share of Central Government expenditure on social services including rural development has increased
from 10.46 per cent in 2003-04 to 19.46 percent in 2009-10. Even though future FSN public interventions will
be emphasized under social services; the Government needs to look into further convergence of schemes to
reduce overlaps at the implementation level (administratively and financially wise).
Indian agriculture has been undergoing an extended phase of transition, due both to the aggregate macro
policy changes, as well as the limits of the green revolution having reached faster (Jharwal: 2008a).
5
III. Key policy decisions in agriculture and FSN
1.
Policies that contribute to food availability
Agriculture and trade are the main areas where FSN policies are being formulated and implemented. Self
sufficiency remains in the centre of government policies at domestic and macroeconomic level (See Figure 5).
Traditionally this objective has been achieved through price policies, leaving rural infrastructure (irrigation,
iv
agriculture marketing and storage) policies almost unattended . Agriculture research and development has
been affected even though policy pronouncements accord high priority to this investment, it has not been
v
reflected in financial allocations (Jha, D. and S. Kumar: 2006).
There are two implicit objectives on foodgrain policy: stabilize supplies and prices both over time and across
regions (Jha et al: 2010; Basu, K.: 2010). Although it is widely agreed that price policy plays a central role in the
process of liberalization of agricultural sector (Jharwal: 2008a), public sector market interventions regarding
procurement and stock decisions have a key role on the efficiency and sustainability of the entire system
(Basu, K: 2010).
In order to ensure remunerative returns to farmers without harming consumers, a 3-institution mechanism
was designed:
vi
⋅
Commission for Agricultural Costs and Prices (CACP) is in charge of determining MSP prices and
making recommendation to GOI, who fixes prices annually (price stabilisation). Through this
institution, GOI creates the appropriate incentives for farmers to adopt new technologies.
vii
⋅
Food Corporation of India (FCI) functions as a parastatal body that formulates and implements
viii
government’s food policy throughout public procurement . It enjoys significant autonomy in several
functions relating to storage, movement, mode of transport, field operations pertaining to
procurement, estimation of its credit requirements and negotiations with the Reserve Bank of India
(Jha et al: 2010).
⋅
Public Distribution Scheme (PDS) ensuring availability of foodgrains (wheat, rice, sugar and
kerosene) to the public at affordable prices through a network of Fair Price Shops (FPS). FCI is
responsible for storing, transporting and distributing the grains to the PDS (Specific details of how
the PDS operates can be found under “Policies that contribute for food access and stabilisation)
Table 1: Public procurement: rice and wheat
2010/2011
Rice
Wheat
Production
(millions of tons)
89.19
87.7
Public procurement
(millions of tons)
30
22.53
ix
MSP
Rs. 10,000/ US$222 per ton
Rs. 11,000/ US$ 245 per MT
USDA Foreign Agriculture Service. Grain update 2010.
For foodgrain availability per person, per day, see Figure 5.
Wheat and rice production following the Green Revolution were the cornerstone of India’s food security. This
heavy focus on foodgrains and milk neglected other products (such as vegetables and pulses) and subsectors
(horticulture and fisheries). Stagnation in production in recent years is a matter of serious concern to the
x
government . Presently, the Planning Commission recognises that the private sector investment has been
xi
relatively subdued in some States. Agriculture sector wise, oversees that the areas where the private sector
will have more space to perform in agriculture sub-sector areas (such as horticulture, commercial crops,
commercial dairy units and fisheries) and consequently increase the positive impact of Public-PrivatePartnerships’ (PPP) economic performance through major investments.
Currently, overall emphasis of agriculture policy continues on production support through input subsidies
3
(seeds, fertilisers, and irrigation) and MSP operations, however two interesting mechanisms are :
3
For other programmes/schemes, please see Annex 2.
6
(i)
A centrally sponsored scheme - the National Food Security Mission (NFSM) - was launched in 20072008 resulting from a National Development Council Initiative that aims to increase the production of
rice, wheat and pulses by 2011-2012. Presently is being implemented in 312 identified districts of 17
States of the country (Ministry of Finance: 2010). The approach of NFSM is to bridge the yield gap
through dissemination of improved technologies and farm management practices (USDA: 2009).
So far, implementation of NFSM has been a key to increase productivity in a programmatic way.
(ii)
Other initiatives that aim to boost production are the Rashtriya Krishi Vikas Yojana (RKVY) ,
especially recognised for its flexibility in giving States the power to choose interventions and set
targets (Planning Commission: 2010); and Integrated Scheme of oilseeds, Pulses, Oil Palm and Maize
(ISOPOM); while others focus on preventing/responding to natural disasters, such as the National
Rain-fed Area Authority (NRAA) and the Calamity Relief Fund (CRF) and the National Calamity
Contingency Fund (NCCF).
xii
NFSM and RKVY had proved to be effective schemes that permit the Ministry of Agriculture to converge on
interventions and engage competences to involve from the central level position with a more diversified
implementation approach.
Box1: Trade oriented policies
Trade oriented policies can be easily understood in two levels: (i) international, where restriction for exports and imports of
food products have been common policy instruments; and (ii) domestic where complex systems operate with restrictions in
storage, transport, marketing and zoning. Main regulations for domestic trade are contemplated in the Essential Commodities
ECA) that was promulgated in19551.
Act (
During economic reforms’ period, agriculture trade had a residual position, consequently in the post- liberalisation period a
reform on agriculture trade sector was required. So until 1990, international trade in grains was a state monopoly. In 1994/95,
the government authorized some private exporting of rice and wheat, which later on leaded to a rise in domestic prices. Policy
reaction since then has been a series of “flip-flop” in the imposition and relaxation of export controls. Throughout late 1990s
and early 2000s GOI took steps towards deregulation of both domestic and international trade in agricultural commodities.
Three main actions:
(a)
In 2002 issued the “Removal of Licensing Requirements, Stock Limits and Movement Restriction on Specified Food
Stuffs Order” which
allowed the private sector to freely trade (buy, stock, sell, transport, distribute and dispose) any
quantity of food grains.
(b)
In 2003 launched
future trading for grain commodities, wheat and rice which was banned in 2007/08. However, other
commodities such as bullion, crude oil, energy and metal products remain in the futures market.
(c)
Adoption of the Model
APMC (Agricultural
Produce Marketing Committee) where the government facilitated direct
contracts with buyers and farmers, known as
contract farming.
Liberalisation of the international trade in foodgrain markets has primary taken the form of removal of export controls on grains
and other agricultural products, and the replacement of quantitative restrictions on imports with tariffs (Jha et al: 2010). During
food crisis 2007/2008 GOI
stabilised domestic rice prices by using export bans and imported wheat through a public sector
agency, the State Trading Corporation (STC) which functioned as the operating body in trade issues for the government.
However the private sector raised the price for wheat above MSP to farmers which affected negatively to government stocks.
Therefore the government announced a bonus over MSP. Latter modifications allowed the government to influence the openmarket food prices. Wheat and rice imports by the government and private trade currently (2010) attract zero import duty.
However, it is felt that past trade policies and government intervention
discouraged the private sector to involve into further
value chain developments in the long term (technology); promotion of competiveness to improve resource allocation for
farmers and better prices for consumers; among others.
7
From an agriculture extension and research perspective; on one hand, NFSM has played a key role in the
achievement of the production target of paddy (10 million tons), wheat (8 million tons) and pulses (2 million
tons) where key cultivation areas are identified at district level and sponsored at central level accordingly. On
the other hand, RKVY incentives states to increase public investment in Agriculture and allied sectors
through “conditional central government funds”; where the release of funds is against the elaboration of a
Comprehensive Agriculture Plan (CAP) that integrates production efforts at different administrative levels and
“cross-sector”.
GOI has also identified the need to strengthen smallholder farmers in order to increase their bargaining power
with the private sector. Therefore, current the strategy focus on encouragement to organize in groups
(Unions) so they are can achieve better deals with the private sector. This adds up to the support GOI is
providing through federal schemes and technology investment.
Policy challenges remain at more efficient resource mobilization and better accountability.
2.
Polices that contribute towards improving food access and stability
xiii
Food expenditure as a proportion of total expenditure (Engel ratio) continued to decline since the decade of
1990s. The National Sample Survey (NSS) also points out that this trend is observed for both rural and urban
populations (See figure 8).
Policies that contribute towards the improvement of the purchasing power of the most vulnerable population
4
are described in Annex 3. Only the most relevant are described in this section. Yet, more social protection
measures with great significance to income insurance include (i) the Unorganized Workers’ Social Security
Act (2008, effective since May 2009) and the (ii) Bilateral security agreements with Belgium, France,
Germany, Switzerland, Luxemburg and Netherlands.
Public Distribution System (PDS) stocks are purchased by the state from the FCI to allocate food (wheat,
xiv
rice, sugar and kerosene) in private retail outlets , at subsidised prices for consumers. PDS covers all the
safety nets and its distribution criteria operate through an entitlement scheme. Key policy decisions comprise
a shift towards more targeted interventions; increase the supply of wheat and rice; and starting up the process
of approval of the National Food Security Bill (NFSB).
Firstly, in 1997, food distribution policy shifted for more targeted public interventions TPDS (Targeted Public
xv
Distribution System) targeted families are entitled to a “ration card”. Selection criteria took into account
below poverty line households (BPL) eligible for more benefits (10kg. of rice, wheat of a combination of both
preferential prices in a monthly basis) than above poverty line households (APL). In 2000, food grain rations
xvi
doubled for BLT, and benefits for APL were eliminated . In 2000, the National Sample Surveys (NSS)
identified that 5 percent of the population sleeps without two square meals a day. Therefore, a more focused
targeting was needed. Antyodaya Anna Yojana (AAY) was launched in 2000 to respond to this need. It
identifies the poorest of the poor families from amongst the number of BPL families covered under TPDS and
xvii
provides more food grains at a higher subsidized rate (of Rs.2- per kg. for wheat and Rs. 3 per kg for rice) .
The scale of the subsidy was initially 25 kg per family/household per month and since 2002 has been increased
to 35 kg per family/household per month with effect from 1st April, 2002. The most recent modification under
the NFSB (2011) is still under approval. This draft proposal considers a new criterion for food distribution (see
details in paragraph below) as follows:
4
The criteria to select which policies are relevant consider mainly the population that has been benefited by improving
their physical or economic access to food in more less a sustainable way.
8
Table 2: New criterion for food distribution (to be approved under NFSB)
Targeted rural population
Quantity (monthly)
PRIORITY GROUP
7kg per person
GENERAL GROUP
4kg per person
Staple food and Price
Rs. 3/2/1 per kg for
rice/wheat/millets respectively
No more than half
of the MSP.
Source: National Advisory Council.
It also includes general guidelines for urban populations, apply to priority and general households in urban
areas together covering at least 50% of the urban population, of which at least 28% shall be in the priority
groups (NAC: 2011a)
xviii
currently 24.3 million
Knowing that this programme has expanded its coverage three times already,
xix
families have been covered under the AAY- . PDS has been recently “revamped” and improvement efforts
are focusing on the TPDS through coordinated efforts among different government organs (Planning
Commission, National Advisory Council (NAC), Ministry of Rural Development and Ministry of Consumer
Affairs, Food Distribution) both at central and state level.
Secondly, concerned about food inflation, the government recently decided to supply additional quantities
of wheat and rice to PDS clientele at the government support price, which are still higher than the current
sales price under various PDS programs (USDA: 2010a).
Table 3: Food allocation by programme, commodity, amount, price and number of beneficiaries (2009-10)
Food allocation by
programme 2009/10
AAA
BPL
APL
Aggregated quantity
Rice/ Wheat
(thousands of tons)
6,700 / 3,500
11,400 / 6,000
6,700 / 13,300
Price
Rice/ Wheat
(Rs. per kilo)
300/ 200
830/ 610
565/ 415
Number of
beneficiaries
(10 million household)
2.43
1.06*
3.38*
Source: Department of Food and Public Distribution, Saxena (2009)
xx
*Latest information registered from The Times of India .
Finally, the process of approval of the NFSB has entailed an active debate at different government levels. One
of the most relevant topics is the Universalization of the PDS. National Advisory Council started
deliberations with the premise that India should progressively move towards ensuring universal entitlements
to the essentials of life such as food, basic education and health care. Most salient features include (NAC:
2011b):
⋅
Switch from household-based to individual-based food entitlements in order to improve
consumption standards.
⋅
A compensation mechanism to protect “most deprived populations” by (i) distinguishing two
categories: priority and general, where a different criteria applies for both for food amount and
prices); and in particular situations, (ii) guaranteeing a minimum entitlement for “single-memberhouseholds”
However, other discussions where improvements are needed and how to address them follow: (i)
diversification of commodities available in the PDS; (ii) decentralization of procurement and storage; (iii) deprivatization of PDS outlets; (iv) doorstep delivery to outlets; (v) revision of PDS commissions; (vi) ICT end-toxxi
end computerization of the PDS ; (vii) full transparency records; and (viii) generalise use of Smart cards and
biometrics (NAC: 2010, NAC:2011c).
Recent policy decisions made towards employment and income generation encompass the National Rural
Employment Guarantee Scheme Act (NREGA) and Swaranjayanti Gram Swarozgar Yojana (SGSY). NREGA
alone has improved income security of 43.4 million households and SGSY has reached 3.7 million Self Help
9
Groups (SHGs) in order to improve skill development and employability of BLP population, especially the
young people (See table 4).
Table 4: Programme by allocation and beneficiaries (2009-10)
Policy instrument
Budget allocated
2009-10
(in Rs crore)
Number of
beneficiaries 200910
NFBS
Cash transfer
NA
4.23 lakh
IGNOAPS
Cash transfer
3874.92
15’930,329
Dhanlakshmi
Conditional cash
transfer
5.95
NREGA
Employment
generation
39,100
SGSY
Income generating
activities
30,896.08
Programme/ Scheme
National Family Benefit
Scheme
Indira Gandhi National
Old Age Pension
Scheme
National Rural
Employment Guarantee
Scheme Act
Swaranjayanti Gram
Swarozgar Yojana
Swarna Jayanti Shahari
Rozgar Yojana
Aam Admi Bima Yojana
Rashtriya Swasthya
Bima Yojana
AABY
Income generating
activities
Insurance
RSBY
Insurance
SJSRY
5
79,555 girls
4.34 crore
(employment
provided to
household)
36.78 lakh self help
groups and 132.81
lakh individuals
515
154,714 individuals
NA
81.99 lakh lives
97.91 lakh cards
issued
NA
Budget for Rural Development Ministry 2009-2010 http://rural.nic.in/budget/Budgetframe.htm
Economic Survey 2009-10 http://indiabudget.nic.in/es2009-10/chapt2010/chapter11.pdf
Crore= 10 million, lakh = 100 thousand
xxii
National Rural Employment Guarantee Scheme Act (NREGA) is one of the major employment generation
programmes in rural areas, which helps households that are BPL to get some minimum employment by
providing at least 100 days of guaranteed wage employment in every financial year to every household whose
adult members volunteer to do unskilled manual work. They are paid in a weekly basis with statutory
minimum wage. If work is not provided within 15 days, applicants are entitled to an unemployment allowance:
one third of the wage rate for the first thirty days, and one half thereafter. Implementation of NREGA is done
by the States in accordance with the State Employment Guarantee Schemes formulated by various States as
per the provisions of the Act.
Although NREGA’s has been innovative in the introduction of social accounting processes by outsourcing
evaluation to third sector actors; the introduction of direct payments to recipients has reduced the space for
corruption; creation of equal opportunities from a gender perspective, special arrangements for mothers
(childcare) are in place so they can work and benefit from the scheme; and finally the incorporation of “selfemployment” recipients into the scheme, those who work on their own land and whose farming conditions
are marginal.
The current NREGA structure entails a Rs. 100 wage per day (during 100 days) that has set a minimum wage
across the country. Implications in the dynamics of labour market are: (i) a slow change towards in the
economic attraction centres; (ii) private sector has been forced to increase salaries above market price in order
to attract labour force. Nevertheless, in the long run, certain considerations need to be made as (i)
improvement for income safety of (targeted) rural population is likely to produce an increase in market prices;
5
Amount released during 2008-09 (Ministry of Finance: 2010, page 288).
10
and (ii) mechanization will tend to substitute human capital. In the medium run, there is the need to introduce
these possible scenarios and plan ahead where to re-locate potentially affected labour force in the market.
3.
Policies that contribute to food utilisation
According to FAO food security statistics, 237.7 million of people are undernourished (below the minimum
level of dietary energy consumption). More than 54 percent of all deaths before age five years in India are
related to malnutrition (NFHS-3). An estimated 43.5 percent and 47.9 percent of children under-five years of
age are underweight and stunted respectively. Moreover, 46 percent of children under-five years in rural areas
are underweight against 33 percent in urban areas; infant mortality rate is 50 percent higher in rural areas
(Gulati, A. et al.:2011). (See figures 10 and 11).
While economic growth during the 1990s and 2000s contributed to poverty reduction, India still needs to
hasten its battle against poverty and malnutrition (Gulati et al.:2011). Poverty reduction before reforms was
associated with sharp reduction in under nourishment and malnourishment and despite faster growth, until
2007, employment generation had been modest and the pace of decline of population below the poverty line
(BPL) fairly small.
Nutritional outcomes depend on public inputs (provision of sanitation, sewage, child vaccination, etc.) and
6
private income (household income) because they affect the food absorption . Income growth was not well
distributed and investment in public inputs didn’t take place as expected: clean drinking water and sanitation
facilities, education, health and nutrition services didn’t reach the entire population. As a result economic
growth has been substantially improved and sustained while –paradoxically- under-nutrition decline rate has
7
been slow (ironically over-nutrition is emerging as a public health problem ). Adults in India suffer from a dual
burden of malnutrition (abnormal thinness and overweight or obesity). Almost 50 percent of women and 43
percent of men have one of these two nutritional problems (NHFS-3).
Meenakshi et al (2003) observe an apparent divergence between income and calorie poverty where calorie
deprivation has increased in rural India. It seems like at all levels of income, the share of the budget devoted to
food has declined and Indians consume fewer calories. More than three quarters of the population live in
households whose per capita calorie consumption is less than 2,100 calories in urban areas and 2,400 in rural
xxiii
areas . Ramachandran (2007) points out finding large disparities between intakes of urban and rural
populations, different states and different socio-economic groups. Inter-state differences in nutrient intakes
persist. The trends above suggest a shift for policy more comprehensive focus on nutrition security and food
security.
Overall, malnutrition programmes remain fragmented among diverse government institutions where only
general and specific type of interventions can be distinguished. At implementation level, some progress has
been done to reduce the gap. Key policy decisions took place particularly in linking supplementation feeding
and health care practices in the Integrated Child Development Services (ICDS); and -despite of its
controversial nature-, opening debating spaces for food fortification issues, under the assumption that
micronutrient fortification cost effectiveness is higher than any other intervention (Interview with A. Kolhi,
Word Bank). A third achievement is the automatic adjustment of the public expenditure in nutritious food
distribution schemes, such as ICDS and Mid Day Meal (MDM) to maintain both the nutrition standards and
xxiv
coverage in children within a high volatility food price environment .
Current direction on nutrition policy attempts to modify consumption patterns at an early stage (infant and
children) in the long run. There is a common understanding that a multidisciplinary/multisectoral approach
(that looks at the education, nutrition, health and food aspects comprehensively) is the way to go forward.
For this reason, in August 2010, the Ministry of Women and Child Development together with the Ministry of
6
From 1990-92 to 2005-07, almost all countries in Asia and Pacific region improved their calorie intake per person, per day.
For instance, Chinese population increased their daily energy supply per capita from 2500 to 3000 kal per day. Thailand
also moved forward from 2250 to 2500. However India remains the same. See Figure 12.
7
According to the India Nutrition Profile (INP), almost a third of the total adult population in the 18 states has a chronic
energy deficiency. At the other extreme, obesity affects 4–5% of the total adult population (Kumar: 1998).
11
Health and Family Welfare produced a note on “India’s Nutrition Challenges” where key issues are being raised
to push for a more comprehensive nutritional policy agenda.
The following part lists the main policy interventions in health and nutrition in India by general and specific
(micronutrients, pregnant women and lactating mothers and on drinking water and rural sanitation).
Table 4: Programme by area of intervention, budget and beneficiaries (2009-10)
Area of intervention
Programme/ Scheme
General
General
Micronutrient
Micronutrient
Micronutrient
Maternity
Maternity
Maternity
Drinking water and
sanitation
Drinking water and
sanitation
ICDS
MDM
Anaemia
Vitamin A
NIDDCP
NBMS
RCHP
RGNC
NRDW
Drinking water and
sanitation
NGP
Budget allocated 200910
(in Rs crore)
5,299.53
6940
Included in other prog.
Included in other prog.
Included in other prog.
NA
NA
8
3360.84
TSC
41,829
Number of beneficiaries
2009-10
8.3 crore children
11.04 crore children
Included in other prog.
Included in other prog.
Included in other prog.
NA
NA
792,950 crèche centres
69 million households,
25769 sanitary
complexes, 133,114
9
aganwadis
Sources: Planning Commission and Ministry of Finance.
Note: Crore= 10 million, lakh = 100 thousand
3.1. General interventions
xxv
(a) Integrated Child Development Services Scheme (ICDS) it’s a centrally sponsored scheme that addresses
a range of children’s needs in one umbrella. Health care, nutrition and pre-school education. It started in
1975 targets children up to the age of six as well as nutrition of adolescent girls and pregnant and nursing
women are part of this programme. It encompasses 6 main areas: (i) supplementary nutrition, (ii)
immunization, (iii) health check-ups, (iv) health and nutrition education, (v) referral services and (vi) nonformal pre-school education.
(b) National Plan Action for Children encompasses strategies under (i) promotion of optimal infant and child
nutrition (ii) addressing anaemia deficiencies (iii) malnutrition and (iv) micronutrient.
xxvi
(c) Mid day meals (MDM) provided to every public school in every part of the country must provide a
nutritious, clean hot cooked meal to all primary school children. Meals are cooked with a minimum
content of 450 calories and 12 grams of protein and are provided on each working day of the school. The
Mid-day Meal Scheme has recently been expanded to cover children in upper primary schools too.
3.2. Specific interventions on micronutrients
According to UNICEF, Vitamin A supplementation the coverage rate for children (6 to 59 months) is 53
xxvii
percent. Only 52 percent of children are consuming iodized salt .
8
9
This amount was calculated by Rs. 42,384 per crèche for 792,950 crèche.
Physical target set on the Eleventh FYP 2007-2012. http://ddws.nic.in/popups/xiplan_bharat%20nirman.pdf
12
xxviii
(d) National Anaemia Control Programme
Started in 1961 as a part of National Iodine Deficiency
Disorders (IDD) control Programme. It distributes 100gr. tablets of iron and folic acid to pregnant and
lactating women and children.
xxix
(e) Vitamin A Active since 1970, it administrates semi-annually massive doses of Vitamin A to children
between 1 and 5 years old at national level. Implementation is coordinated with state governments.
(f) National Iodine Deficiency Disorders Control Programme (NIDDCP) originally it started in 1962 as the
National Goitre Control Programme (NGCP). In 1983 NIDDCP started in phased manner until 1992 when
formally adopted the approach of enhancing production, demand and supply of iodated salt. As
production has been liberalised, NIDDCP tasks are focused on coordination, technical guidance, training
and monitoring procurement and distribution.
3.3. Specific interventions on pregnant women and lactating mothers
Motherhood programmes are supported by a National Population Policy (NNP) from a socio-demographic
perspective. Therefore, empowering women for improved health and nutrition policy measures vary on standalone programmes or as inter-sectoral programmes (DLHS-3). Following interventions are only for maternity
care:
(g) National Maternity Benefit Scheme (NMBS) was introduced in 2001 to provide nutrition support to
pregnant women. Under this scheme BPL pregnant women are given a one time payment of Rs. 500/- 8–
12 weeks prior to delivery. In the year 2005, the Government of India launched the Janani Suraksha Yojana
(JSY) under the National Rural Health Mission to provide cash incentives for women to have an
institutional delivery. The NMBS was then merged into the JSY.
(h) Reproductive and Child Health Project (RCHP)
a. Antenatal Care (ANC) refers to pregnancy related health care provided by a doctor or any health
professional to women during their pregnancy.
b. Institutional Deliveries, in proper hygienic conditions under the supervision of trained health
personnel.
(i) Rajiv Ghandi National Crèche Scheme (RGNC) for children of working mothers provides for
supplementary nutrition, emergency medicines and contingencies to children in the age group 0-6 years.
Currently the National Rural Health Mission (NRHM) aims to provide an overarching umbrella to the existing
programmes including RCHP with integrated disease surveillance (such as malaria, blindness, iodine
deficiency, filarial, kala azar, TB and leprosy) in order to improve delivery systems at all levels (Ministry of
Finance: 2010).
3.4. Specific interventions on drinking water and rural sanitation
Drinking water was out of the influence of the government until 1972-73 when the GOI launch of Accelerated
Rural Water Supply Programme (ARWSP) which aimed to ensure provision of adequate drinking water supply
to the rural community through the Public Health Engineering System. A second generation programme
started followed with the Technology Mission in 1986-87, renamed in 1991-92 as Rajiv Gandhi National
Drinking Water Mission (NDWM), focusing more on water quality, appropriate technology intervention, and
human resource development support. The third generation programme started in 1999-2000 introducing a
participatory approach (involvement of community in planning, implementation and management of drinking
water related schemes), which later scaled up as Swajaldhara in 2002. The Rural Water Supply (RWS) sector
has now entered the fourth phase with major emphasis on ensuring sustainability of water availability while
also adopting decentralized approach involving PRIs and community organizations. Currently, the flagship
public intervention in this area is called National Rural Drinking Water Programme (NRDWP).
Ensuring sustainable drinking water in terms of quality and adequacy represents the major challenge. Another
challenge is the integration of RWS with other schemes such as ICDS, National Rural Health Mission and
NREGA.
Regarding rural sanitation, the Total Sanitation Campaign (TSC) was introduced in 1999 acknowledging a
demand-driven approach for individual household latrines, community sanitary complexes, and school
sanitation and hygiene education. To encourage Panchayti Raj Institutions (PRIs) to take up sanitation
promotion, there is an incentive scheme, Nirmal Gram Puraskar (NGP) that awards those PRIs that attain 100
percent open defecation-free-environment.
13
IV Current and emerging policy issues
Although agricultural development has always been uneven across the regions, during the next decade,
performance of Indian agriculture will depend largely on the contributions from the vast rain-fed areas of the
country (Jharwal: 2008a). In this line production support through input subsidies is expected to continue
indefinitely. However during the XII Five Year Plan (FYP), the policy direction will also focus on the
identification of areas, regions and crops that have a higher potential to grow (presumably oilseeds,
horticulture and floriculture). Attracting private investment in agriculture marketing (direct marketing,
10
better market infrastructure and contract farming) is a key priority to further strengthen efficiency . To
improve economic and physical access to food, government will focus interventions through welfare schemes;
and the implementation of the Food Security Act. Improving delivery services and targeting population
effectively remain as cross-cutting priorities.
The current institutional set up to implement all type of policies and especially those with dealing multisector
interventions, such as food and agriculture policies is complex. Diversity will always arise within the largest
democracy in the world with a multiparty system. During 2000 the Planning Commission reunited 30 field
experts to prepare a common vision on the future 20 years on key areas. In this document, Governance related
issues tend to follow decentralization process from the formulation of policies to the budget allocation. This
has implications in all sectors, raising challenges to coordinate cross sector policies, such as rural
development and natural resources, among different government instances regarding specific schemes,
programmes and policies.
xxx
Current policy direction emphasizes strengthening of Panchayati Raj Institutions (PRI’s) and development
and promotion of district planning. PRI’s have three levels: village, block and district. Among their tasks, it is
encompassed the development of an economic plan, implementation of schemes and tax collection. There is a
particular need to improve delivery mechanisms. Participation processes are more active and intend to
involve States from the beginning stage so policy formulation is coherent with implementation. Given the
institutional infrastructure that is in place, Central Government (GOI) faces difficulties in reaching the bottom
on their own (mechanisms in place apply for state level only), there is no legal mechanism in place to “enforce”
states to work on their plans of actions.
In regards with policies that contribute to food availability, irrigation, the role of the private sector and the
incorporation of risk management instruments that help smallholder farmers to reduce their vulnerability to
deal with uncertain events (weather, deaths, etc) still need to be pushed forward in the current agenda.
⋅
Although major changes had occurred in the implementation of irrigation schemes for both irrigated
and non irrigated areas; current efforts are not being successful enough to make water available for a
second crop; which is crucial to boost production in the agricultural sector. Formulation of rain water
conservation policies (through construction of ponds, wells and tanks and also through watershed
schemes) is essential.
⋅
From the private sector perspective, regulation of markets is still rigid as the prices are set by the
government throughout public procurement and price stabilisation policies at minimum support
prices (MSP). Main policy issue is the entrance of the major food chain suppliers to the food market in
order to increase competitiveness. Wholesalers oppose and they have the power to obstacle this
regulation. There is a policy window for the private sector in food storage and GOI can benefit from
allowing private storage facilities manage efficiently warehouses.
⋅
Incorporation of climate change (content and action wise) remains as a challenge for GOI. Although
credit and insurance schemes are moving towards a rain-fed agriculture (including flood and drought
10
Weak regulation, enforcement and infrastructure for markets, has created little space (such as the upgrade market
infrastructure and support services, modernisation of marketing operations) for another player besides the public sector.
Favourable environment should be created for bit private players to operate in food market for price stabilisation (Kaur, S.:
2010; Basu, K.: 2010).
14
scenarios), there are other areas to attend in order to reduce smallholder farmers’ vulnerability
against risks, such as crop improvement and research to develop drought –resistant, and high –
yielding varieties of seeds.
An accurate targeting of beneficiaries has become a big challenge for GOI, not only to facilitate food access
but also to ensure stability of food and agriculture systems. PDS distributes food to BPL population. The
number of households is defined as an estimation from poverty numbers in 1993-94, which rises up to 6.52
crore households. At the implementation level, States are to define the number of households in need in rural
xxxi
areas as per guidelines of Ministry of Rural Development (Interview with NK. Sinha, MCAFD).
Different methodologies do not agree on the “cut-off point” for the poverty line. Simrit Kaur points out that
solving out the poverty line issue is not enough to prevent a debate on targeting BPL households; as it is likely
to lead to both errors of inclusion (including the non-poor) and exclusion (excluding the poor). The current
discussion is under the universalization of the PDS.
Although the main challenge concentrates on producing an accurate number of beneficiaries (those
identified as “not poor” commonly are “nutritionally poor”), the ongoing approval process for the National
Food Security Bill has entered to debate the quantity of food to be given, through what type of policy
instrument and at what subsidized rate “to ensure that the fiscal system is able to withstand the expenditure”
(Basu, K: 2010). Many authors agree that public expenditure in PDS is still financially viable between 1 and 1.42
percent of the GDP (Jean Drèze and Awanish Kumar) while others try to orientate discussions towards calorie
xxxii
intakes (Ministry of Finance: 2010).
Recommendations on the National Food Security Bill agreed that legal entitlements on subsidized food grain
should be extended to 75% of the population (90 percent in rural areas and 50 percent in urban areas). Priority
households will be given monthly entitlements to subsidized prices. Rural coverage will be adjusted state-wise
given poverty estimates from PC; however minimum entitlements and coverage will remain unchanged until
the end of the XII FYP. (National Advisory Council: 2010). There are contrasting impressions to the agreements
reached. While some believe that these recommendations don’t represent anything new (distribution system
has been operating under similar orientations for long); others believe that up scaling a benefit to a right is
good enough achievement. Nevertheless improved processes to identify and estimate the poor are crucial
to correctly target the beneficiaries of safety nets.
Efforts are being made towards a revised methodology through the launch of the Unique Identification
xxxiii
Authority ; even though it is uncertain how long this process will take, it is expected to be finalised by the
end of XII FYP.
15
V Institutional set up
1.
Ministries involved
Ministry/ Policy decision
area
1.
2.
3.
4.
5.
6.
7.
8.
9.
10.
11.
12.
13.
2.
Availability
Access & Stabilisation
Utilisation
(production and trade oriented
policies)
(consumer oriented policies)
(health and nutrition assistance)
Ministry of
Agriculture
Ministry of
Commerce and
Industry
Ministry of
Consumer Affairs,
Food and
Distribution
Ministry of
Environment &
Forests
Ministry of Finance
Ministry of Health
and Family Welfare
Ministry of Industry
and Transport
Ministry of Labour
Ministry of Rural
Development
Ministry of Urban
Development
Ministry of Water
and Resources
Ministry of Women
and Child
Development
Reserve Bank of
India
Activeness of civil society
xxxiv
International organisations:
⋅
Asian Development Bank
⋅
DARE
⋅
European Commission
⋅
Global Fund
⋅
IFAD
⋅
OPEC Fund for International Development
⋅
United Nations Development Programme
⋅
United Nations Population Fund
xxxv
⋅
World Bank through:
o International Bank of Reconstruction and Development
o International Development Association
⋅
Other governments (bilateral cooperation):
16
⋅
⋅
⋅
⋅
⋅
Government of Germany
Government of Italy
Government of Japan
Government of United Kingdom
Government of United States
3. Independent policy monitoring
No. Regular monitoring is done by each ministry with their own parameters and criteria which often varies
among different organs in both frequency and quality.
17
References
⋅
ADB (2010). Key indicators for Asia and the Pacific 2010: Rise of Asia’s middle class.
⋅
Banerjee, Abhijit and Esther Duflo (2011). More than 1 billion people are hungry in the world: But what if
the experts are wrong? In Foreign Policy (May/ June).
⋅
Basu, Kaushik (2010). The economics of foodgrain management in India. Ministry of Finance and
Government of India, New Delhi.
⋅
Broca, Sumiter (2004). Comments on draft right to food. Mimeo.
⋅
Broca, Sumiter (2010). Comments on agricultural trade liberalisation and food security in India. Mimeo.
⋅
Chand, Ramesh (2006). India’s national agricultural policy: A critique. , Working Paper No. 85, Institute of
Economic Growth. New Delhi.
⋅
Chang, Ha-Joon (2009). Rethinking public policy in agriculture: Lessons from distant and recent history.
FAO, Rome.
⋅
Clareson, Mariam, E. R. Bos, T. Mawji and I. Pathmanatha (2000). Reducing child mortality in India in
the new millennium. Bulletin of the World Health Organization 78(10) 1192-1199.
⋅
Dawe, David (ed.) (2010). The rice crisis: Markets, policies and food security. FAO- Earthscan, London,
Washington DC.
⋅
FAO Food Security Statistics. http://www.fao.org/economic/ess/food-security-statistics/en/
⋅
FAO (2009)a. Agricultural reforms and trade liberalization in China and selected Asian countries: lessons
of three decades. RAP 2009/15, Bangkok.
⋅
FAO (2009)b. India. Country Brief. Technical Cooperation Department. Rome.
⋅
Gulati, Ashok; Kavery Ganguly and Ganga Shreedhar (2011): Food and nutritional security in India: A
stocking exercise. IFPRI- ICAR. New Delhi.
⋅
Institute of Manpower and Research (2010). All-India report on evaluation of NREGA: A survey of 20
districts. New Delhi. http://planningcommission.gov.in/reports/genrep/rep_NREGA_03-08-2009.pdf
⋅
Jha, Shikha; Srinivasan, P.V., and Ashok Ganesh-Kumar (2010) “Achieving food security in a costeffective way: Implications of domestic deregulation and liberalised trade in India” in Ganesh-Kumar, A.,
Devesh Roy and Ashok Gulati (2010). Liberalising food grain markets. Oxford University Press.
⋅
Jha, Dayanatha and Sant Kumar (2006). Research resource allocation in Indian Agriculture. National
Centre for Agricultural Economics and Policy Research. Policy Paper 23: New Delhi, India.
⋅
Jharwal, SM (2008)a. Glimpses of Indian agriculture. Macro and micro aspects: Volume 1, Macro aspects.
Academic Foundation. New Delhi.
⋅
Jharwal, SM (2008)b. Glimpses of Indian agriculture. Macro and micro aspects: Volume 2, Micro aspects.
Academic Foundation. New Delhi.
⋅
Kaur, Simrit (2010). Financial crisis and food security. Paper prepared for the workshop on Food and
Financial Crisis. Bangkok, Thailand.
18
⋅
Kholi, Atul (2006). Politics of Economic Growth in India, 1980-2005. Part I: The 1980s. Economic and
Political Weekly: 1251-1259.
⋅
Kholi, Atul (2006). Politics of Economic Growth in India, 1980-2005. Part II: The 1990s and Beyond.
Economic and Political Weekly: 1361-1370
⋅
Kumar, Sanjay (1998). First state by state data in India’s nutrition. The Lancet: 352(913): 751-830.
⋅
Meenakshi J.V and Brinda Vishwanathan (2003). Calorie Deprivation in Rural India 1983-1999/2000 in
Economic and Political Weekly.
⋅
Ministry of Consumer Affairs, Food and Public Distribution and GOI (2010). Annual Report 2009-2010.
Department of Food and Public Distribution. New Delhi.
⋅
Ministry of Finance (2010). Economic Survey 2009-2010.
⋅
Ministry of Finance (2011). Economic Survey 2010-2011.
⋅
Ministry of Health and Family Welfare and GOI (2006). Revised policy guidelines on national iodine
deficiency disorders control programme. Directorate General of Health Services. New Delhi.
⋅
Ministry of Health and Family Welfare and GOI (2007-2008). District level and household facility survey
(DLHS-3). International Institute for Population Sciences. Mumbai.
⋅
Ministry of Health and Family Welfare and GOI (2009). Nutrition in India: National family health survey
2005- 2006 (NFHS-3). International Institute for Population Sciences. Mumbai.
⋅
Ministry of Human Resource Development and GOI (1993). National nutrition policy. Department of
Women and Child Development. New Delhi.
⋅
Ministry
of
Rural
Development
(2009).
http://nsap.nic.in/nsap/NSAP-%20About%20us.pdf
⋅
Ministry of Rural Development and GOI (2010)a. Outcome Budget of Department of Rural Development
2009-2010. http://rural.nic.in/budget/Budgetframe.htm
⋅
Ministry of Rural Development and GOI (2010)b. National Rural Drinking Water Programme. Rajiv
Gandhi National Drinking Water Mission, New Delhi.
http://ddws.gov.in/popups/RuralDrinkingWater_2ndApril.pdf
⋅
Ministry of Statistics and Programme Implementation and GOI (2005-2006)a. Highlights: Employment
and unemployment situation in India. Report 522.
⋅
Ministry of Statistics and Programme Implementation and GOI (2005-2006)b. Highlights: Household
consumer expenditure in India. Report 523.
⋅
Ministry of Statistics and Programme Implementation and GOI (2009-2010). Annual report. New Delhi.
http://mospi.nic.in/Mospi_New/site/inner.aspx?status=2&menu_id=21
⋅
Ministry of Women and Child Development and GOI (2009). Integrated child development services
scheme (ICDS): Working paper for preparation of State Annual Programme Implementation Plans. New
Delhi.
⋅
National Advisory Council (2010). NAC recommendations finalized in its meeting held on 23 October
th
2010. Prime Minister’s Office, New Delhi. Source revised on December 16 , 2010.
http://nac.nic.in/images/recommendations_oct.pdf
19
National
Social
Assistance
Programme.
⋅
National Advisory Council (2011)a. Note on the draft national food security bill, January 2011.New Delhi.
th
Retrieved on May 13 , 2011. http://nac.nic.in/foodsecurity/nfsb.pdf
⋅
National Advisory Council (2011)b. Draft national food security bill: Explanatory note, February 2011.
th
New Delhi. Retrieved on May 13 , 2011. http://nac.nic.in/foodsecurity/explanatory_note.pdf
⋅
National Advisory Council (2011)c. Feedback received until March 7 on national food security bill and
the explanatory note. March 2011. New Delhi. Retrieved on May 13th, 2011.
http://nac.nic.in/foodsecurity/feedback_nfsb.pdf
⋅
Planning Commission (2002). India Vision 2020. Report of the committee. New Delhi.
⋅
Planning Commission (2007). Eleventh five year plan: Rural drinking water and sanitation in the 11 FYP
period, excerpts. New Delhi.
⋅
Planning Commission (2010). Mid term appraisal of the eleventh five year plan.
⋅
Planning Commission (2011). Issues for approach to the 12 Five Year Plan. Full Planning Commission
st
meeting, April 21 , 2011.
⋅
Ramachandran, Preema (2007). Nutrition transition in India 1947- 2007. Nutrition Foundation of India.
New Delhi.
⋅
Ramachandran, Preema (2008). The double burden of malnutrition in India. Nutrition Foundation of
India and FAO.
⋅
Rodrik, Dani and Arvind Subramanian (2003). The primacy of institutions (and what this does and does
not mean). Finance&Development 40(2): 31–34.
⋅
Saxena, NC (2009). Modernisation of Public Distribution System in India through Computerization.
Supreme Court Commissioners.
⋅
Supreme Court Commissioner’s cpw 196/2001. The right to life is the right to food.
http://www.sccommissioners.org Revised on 14-09-2010.
⋅
Timmer, Peter (2010)a. Reflections on food crises past. Food Policy 35: 1-11.
⋅
Timmer, Peter (2010)b. Behavioural dimensions of food security. Mimeo.
⋅
The Hindu. Food Security Act: humungous but welcome challenge. Source revised on December 16 ,
2010. http://www.thehindubusinessline.com/2010/11/01/stories/2010110150261700.htm
th
th
th
th
⋅
⋅
The Times of India. PDS cleansing process: More than 50,000 fake ration cards cancelled in 2009-10. New
th
Delhi. Source revised on September 29 , 2010. http://timesofindia.indiatimes.com/city/lucknow/PDScleaning-process-More-than-50000-fake-ration-cards-cancelled-in-2009-10/articleshow/6549821.cms
⋅
Umali-Deininger, Dina L. and Klaus W. Deininger (2001). Towards greater food security for India’s poor:
Balancing government intervention and private competition. Agricultural Economics 25: 321-335.
⋅
UNICEF. Statistics by country. http://www.unicef.org/infobycountry/india_statistics.html#64
⋅
USDA Foreign Agriculture Service (2009). Grain and feed annual 2009. Global Agricultural Information
Network: IN9025.
20
⋅
USDA Foreign Agriculture Service (2010)a. Grain and feed annual 2010. Global Agricultural Information
Network: INI011.
⋅
USDA Foreign Agriculture Service (2010)b. Grain update 2010. Global Agricultural Information Network:
INI068.
⋅
Vats, Vaibhav (2010). Food Security: Interview with Jean Dreze. Tehelka Magazzine. Vol (7):44, New
Delhi. http://www.tehelka.com/story_main47.asp?filename=Ne061110The_middle_class.asp
⋅
Vijayaraghavan, K. (2002). Control of micronutrient deficiencies in India: Obstacles and strategies.
Nutrition Reviews 60(5): S73-S76.
http://onlinelibrary.wiley.com/doi/10.1301/00296640260130786/abstract
⋅
World Development Indicators Online http://ddp-ext.worldbank.org. Revised on 31-08-2010.
Interviews
FAO
⋅
Gavin Wall, Country Representative, FAO India
⋅
Gopi Ghosh, Programme Assistant- FAO India
International Partners
⋅
Vincent Darlog, Director IFAD-WFP India
⋅
Kanjali Paintal, Nutrition Specialist, UNICEF
⋅
Dr. Ashi Kohli Kathuria Senior Nutrition Specialist - World Bank India
Government Authorities
⋅
Dr. VV Sadamate Agriculture, Adviser- Planning Commission
⋅
Nitish K Sinha, Director (IC) - Ministry of Consumer Affairs, Food and Distribution
⋅
Dr. BS Bhandari, Directorate of Economics and Statistics/ Department of Agriculture and CooperationMOA
⋅
Dr. PC Bodh, Directorate of Economics and Statistics/ Department of Agriculture and Cooperation- MOA
⋅
Dr. Gangaiah, Directorate of Economics and Statistics/ Department of Agriculture and Cooperation- MOA
⋅
Prof. Ramesh Chand, Director -National Centre for Agricultural Economics and Policy Research
⋅
Mukesh Khullar, Joint Secretary - Ministry of Agriculture
⋅
Dr. Shreeranjan Joint Secretary- Ministry of Women and Child Development
Public Research Institute
⋅
Dr. KR Koundal, Research Director - Indian Agricultural Research Institute
NGOs
⋅
Dr. Prema Ramachandran, Director- Nutrition Foundation of India
⋅
Dr. Sunman Sashay, Director- Gene Campaign
Academia
⋅
Prof. Amite Kudu , Centre for the Study of Regional Development- Jawaharlal Nehru University
21
Annex 1: Policy implementation table
FSN
Scheme/ programme
Sponsored
Implementation
Financing
(centralised or decentralised)
Access and
Stabilisation
Access and
Stabilisation
Access and
Stabilisation
Access and
Stabilisation
Access and
Stabilisation
Access and
Stabilisation
Access and
Stabilisation
Access and
Stabilisation
Access and
Stabilisation
Availability
Utilisation
Utilisation
Annapurna
Ministry of Rural Development
Public- central gov.
Ministry of Human Resource
Development
01/04/2000
28/04/2011
01/01/1995
Indefined
MDM*
National Family Benefit Scheme
NFBS*
Centralised
Ministry of Rural Development
Public- central gov.
15/08/1995
28/04/2011
National Old Age Pension Scheme
NOAPS*
Central & State Government
Ministry of Rural Development
Public- 50/50 centre/states
19/11/2007
27/04/2011
National Rural Employment
Guarantee Act
NREGA*
Central & State Government
Ministry of Rural Development
Public- 90/10 centre/states
02/02/2006
27/04/2011
IAY
Centralised
Ministry of Rural Development
Public- 75/25 centre/states
Swaranjayanti Gram Swarozgar
Yojana
SGSY
Central & State Government
Ministry of Rural Development
Public- 75/25 centre/states
01/04/1999
28/04/2011
Targeted Public Distribution System
TPDS*
Central & State Government
Ministry of Consumer Affairs, Food
and Public Distribution
Public
01/01/1971
Indefined
Swarna Jayanti Shahari Rozgar Yojana
SJSRY
Centralised
Ministry of Urban Development
Public- 75/25 centre/states
01/09/2006
31/01/2012
DPS
Centralised
Ministry of Consumer Affairs, Food
and Public Distribution
Public- 50/50 centre/states
NRDWP
Central & State Government
Ministry of Rural Development
Public- 75/25 centre/statesa/
ICDS*
Centralised
Ministry of Health and Family Welfare Public- central gov.
15/12/2008
01/01/2012
NPCB
Centralised
Ministry of Health and Family Welfare Public- central gov.
01/04/1976
28/04/2011
RCHP
Centralised
Ministry of Health and Family Welfare International: WB, EU
01/10/1997
28/04/2011
Rural Housing
Decentralized Procurement Scheme
National Rural Drinking Water
Programme
Integrated Child Development
Services Scheme
National Maternity Benefit Scheme
Utilisation
National Plan Action for Children
Utilisation
Centralised
Final Date
Mid day meals
Utilisation
Utilisation
AS
Initial Date
(public/private/international)
National Programme for Control of
Blindness/ Vitamin A
Reproductive and Child Health
Programme
b/
a/
24/12/2015
01/01/1972 Indefined
NMBS*
NPAC
Source: Ministry of Consumer Affairs, Food and Public Distribution, Ministry of Health and Family Development, Ministry of Human Resource Development, Ministry or Rural Development.
*Encompassed and enforced by the Right to Food, Ministry of Rural Development
a/ Except in the case of North Eastern states here it is 90/10 basis.
b/ Centrally Sponsored ongoing programme being implemented throughout the country except Delhi and Chandigarh under which financial assistance is provided to shelterless rural BPL households for
construction of their dwelling units. The funds are shared by the Centre and the States in the ratio of 75:25. However, in the case of Union Territories, 100% assistance is provided by the Centre.
22
Annex 2: Other programmes/schemes that contribute for food availability
Credit and Insurance
Although different interventions have taken place to promote credit and support smallholder farmers; such as the revival of
short term Rural cooperative Credit – Rs. 13,596 crore- and the rehabilitation package for 31 suicide-prone districts (Ministry
of Finance: 2010); it is felt that the government has not provided enough diversified and sophisticated credit instruments
for the agriculture sector that can support farmers to reducing risk and vulnerability. The financial crisis adversely impacted
the growth rate of the economy which simultaneously leaded to a credit crunch, and most of the government’s measures
were designed to revive the stock market and investor confidence, left aside the farmers and agriculture (Kaur, S.:2010).
Increasing frequency and severity of droughts, floods, cyclones and erratic climatic changes accentuate uncertainty and risk
in agricultural production and livestock breeding. Amid the most relevant public interventions concentrate in the
continuation of the National Agricultural Insurance Scheme (NAI), the Coconut Palm Insurance Scheme (CPIS); and the Pilot
Weather Based Crop Insurance Scheme (WBCIS) which has been lowering some administrative costs. All of them combine
public-private funds and implementation (Planning Commission: 2010; Ministry of Finance: 2010).
Other relevant policy decisions
Rural Development Programmes operating at village level are not caste neutral, even with positive discrimination (Jharwal:
xxxvi
2008b). The Forest Right Act
(2006) is a significant achievement as it covers a vulnerable population (The Scheduled
Tribes and Other Traditional Forest Dwellers) and focus on where little attention was paid in the previous years. Agriculture
represents a self subsistence mean for livelihood security, but the lack of entitlements and technical assistance prevents
them from benefiting from their community forest resource. This act provides the restitution of deprived forest rights
across India, including both individual rights to cultivated land in forestland and community rights over common
property resources.
Policy issues and future challenges
⋅ Irrigation
Although major changes had occurred in the implementation of irrigation schemes for both irrigated and non irrigated
areas; current efforts are not being successful enough to make water available for a second crop; which is crucial to boost
production in the agricultural sector. Formulation of rain water conservation policies (through construction of ponds, wells
and tanks and also through watershed schemes) is essential.
⋅ Role of the private sector
From the private sector perspective, regulation of markets is still rigid as the prices are set by the government throughout
public procurement and price stabilisation policies at minimum support prices (MSP). Main policy issue is the entrance of the
major food chain suppliers to the food market in order to increase competitiveness. Wholesalers oppose and they have the
power to obstacle this regulation. There is a policy window for the private sector in food storage and GOI can benefit from
allowing private storage facilities manage efficiently warehouses.
⋅ Risk management for smallholder farmers
xxxvii
.
Incorporation of climate change (content and action wise) remains as a challenge for GOI
xxxviii
Although credit and insurance schemes
are moving towards a rain-fed agriculture (including flood and drought
scenarios), there are other areas to attend in order to reduce smallholder farmers’ vulnerability against risks, such as crop
improvement and research to develop drought –resistant, and high –yielding varieties of seeds.
23
Annex 3: List of programmes/schemes that contribute for food access and stabilisation
(a) In 1997, food distribution policy shifted for more targeted public interventions TPDS (Targeted Public Distribution
xxxix
System) targeted families are entitled to a “ration card”. Selection criteria
took into account below poverty line
households (BPL) eligible for more benefits (10kg. of rice, wheat of a combination of both preferential prices in a
monthly basis) than above poverty line households (APL).In 2000, food grain rations doubled for BLT, and benefits
xl
for APL were eliminated . In 2000, the National Sample Surveys (NSS) identified that 5 percent of the population
sleeps without two square meals a day. Therefore, a more focused targeting was needed.
a. Antyodaya Anna Yojana (AAY) was launched in 2000 to respond to this need. It identifies the poorest of
the poor families from amongst the number of BPL families covered under TPDS and provides more food
xli
grains at a higher subsidized rate (of Rs.2/- per kg. for wheat and Rs. 3/ per kg for rice) . The scale of issue
was initially 25 kg per family/household per month and since 2002 has been increased to 35 kg per
family/household per month with effect from 1st April, 2002. This programme has expanded its coverage
xlii
three times . With these expansions, as against 25 million families (i.e. 38% of BPL) to be covered, 24.3
million families have been covered already under the AAY (MCAFPD: 2010).
(b) National Family Benefit Scheme (NFBS) provides a “lump sum” cash transfer BPL households on the death of the
primary breadwinner (member of household whose earnings contribute substantially to household income)
between the age group of 18–65 years. The Scheme provides for Rs. 10,000/- to be paid in cash to the family in case
of the breadwinner’s death. This payment is made after inquiring the surviving head of the bereaved household.
This programme is coming to an end in 2012.
xliii
(c) The National Family Benefit Scheme (NFBS)) targets all poor persons aged 65 years or older and provides a cash
transfer (Rs. 200/- per pensioner per month). Currently is known as “Indira Gandhi National Old Age Pension
xliv
Scheme (IGNOAPS)” .
(d) Dhanlakshmi conditional transfer scheme for girls that fulfil certain requirements regarding birth and registration,
immunization and enrolment and retention on schools. It was launched as a pilot project in March 2008.
(e) Rashtriya Swasthya Bima Yojana (RSBY) provides annual cashless transactions of Rs. 30,000 through a smart card
and targets BLP families (not more than 5 members) in the unorganized sector.
xlv
(f) National Rural Employment Guarantee Scheme Act (NREGA) is one of the major employment generation
programmes in rural areas, which helps households that are BPL to get some minimum employment by providing
at least 100 days of guaranteed wage employment in every financial year to every household whose adult members
volunteer to do unskilled manual work. They are paid in a weekly basis with statutory minimum wage. If work is not
provided within 15 days, applicants are entitled to an unemployment allowance: one third of the wage rate for the
first thirty days, and one half thereafter. Implementation of NREGA is done by the States in accordance with the
State Employment Guarantee Schemes formulated by various States as per the provisions of the Act.
(g) Swaranjayanti Gram Swarozgar Yojana (SGSY) provides income generating assets through a mix of bank credit
and Government subsidy to bring poor families (Swarizgarues) APL. The programme aims at establishing a large
number of micro enterprises in rural areas based on the ability of the poor and the potential of each area. The
scheme involves organization of the poor into Self Help Groups (SHGs) build their capacities through a process of
social mobilization, their training, selection of key activities, planning of activity clusters, creation of infrastructure,
provision of technology and marketing support, etc. Under the scheme focus is on the group approach. However,
individual Swarozgaris can also be assisted. During 2008-2009, diverse modifications had been formulated in order
xlvi
to expand its coverage :
(h) Swarna Jayanti Shahari Rozgar Yojana (SJSRY) provides gainful employment to the urban unemployed and
underemployed poor by encouraging the setting up of self-employment ventures by the urban poor and also by
providing wage employment and utilizing their labour for construction of socially and economically useful public
st
xlvii
assets. This scheme was revamped in April 1 , 2009 .
(i) Aam Admi Bima Yojana (AABY) provides insurance against natural and accidental death and partial/ permanent
disability to the head of the family of rural landless households. It was launched in October 2007. Up to September
30th, 2009, the scheme covered 81.99 lakh lives (Planning Commission: 2010).
(j) Rashtriya Swasthya Bima Yojana (RSBY) provides insurance to the unorganized sector. Until January 2010, 26
States/ Union Territories have initiated the process of implementing the scheme.
24
Annex 3: Figures
Figure 1. Real GDP growth
Source: Economic survey 2010- 2011 Table A3
Figure 2: Per capita income growth
Source: World Development Indicators
25
Figure 3: Agriculture sector growth: value added as percentage of the GDP
Source: World Development Indicators
Figure 4: Population growth
Source: World Development Indicators
26
Figure 5: Food grain availability
Source: Ministry of Statistics and Programme Implementation and Economic Survey 2009-2010 Table A22
Figure 6: Food supply
Source: FAO- Food Security Statistics http://www.fao.org/economic/ess/food-security-statistics/en/
27
Figure 7: Protein and fat supply
Source: FAO- Food Security Statistics http://www.fao.org/economic/ess/food-security-statistics/en/
Figure 8: Food consumption among rural households
Source: Sarvekshana 86 April-September 01, Table 10R, (NSS) Consumer Expenditure Survey (62nd and 63rd rounds
28
Figure 9: Insert table of agri wage/per day vs price/1 kg (wheat/rice)
Figure 10: Malnutrition in adults by gender
Source: WHO, Global Database on Body Mass Index. Note: Latest data available for India is from 2005-2006
Figure 11: Malnutrition in children (0-5)
Source: WHO, Global Database on Child Growth and Malnutrition.
Note: Latest data available for India is from 2005-2006
29
Figure 12: Daily energy supply and per – caput GDP
Source: Broca, Sumiter
30
Notes
Finance: 2010). According to the Planning Commission,
the growth of this high value segment (horticulture,
livestock and fisheries) has to be demand led, where the
role of the government is (i) to create an enabling
environment for private entrepreneurs to enter this agrisystem; (ii) act as a coordinating actor along diverse
value chains (Planning Comission:2010).
xi
th
In “Issues for approach for the 12 Five Year Plan”,
presentation made in the Full Planning Commission on
st
April 21 , 2011.
xii
RKVY was launched in August 2007 with the objective
to re-orient current agricultural development strategies
to meet the needs of farmers and rejuvenate the
agricultural sector as to achieve 4 percent annual
growth during the XI FYP. During 008-09 the areas in
focus were seeds, fertilisers, IPM testing laboratories,
horticulture, farm mechanization, extension, crops
marketing and cooperatives (Ministry of Finance: 2010).
xiii
Access and stability only includes measures affecting
directly FSN by income and safety nets. However, there
are certain measures which are being applied to BPL
population and affect indirectly FSN but in a significant
way, such as housing.
xiv
Namely “fair price shops” which operate under a
commission basis (Umali-Deininger, Dina L et al: 2000).
xv
Currently, the BPL quota for each state is determined
by the Planning Commission’s estimates of poverty in
the state, which is in turn calculated on the basis of the
National Sample Survey Organisation’s (NSSO)
Consumption Expenditure Surveys (CES). For more
information,
see
http://www.sccommissioners.org/schemes/tpds
xvi
Food grain ration was raised from 10 kg. to 20 kg. at
50% of the economic cost whereas APL households had
to pay full economic price. According to the WB the
latter eliminated any existent price subsidy (UmaliDeininger, Dina L et al: 2000).
xvii
The States/Union Territories (UTs) are required to
bear the distribution cost, including margin to dealers
and retailers, as well as the transportation cost. Thus the
entire food subsidy is being passed on to the consumers
under the scheme (MSPI: 2009-2010). For more
information,
go
to
http://www.sccommissioners.org/pdfs/primers/aayguid
elines.pdf
xviii
Selection criteria for additional families profile is: (i)
landless agriculture labourers, marginal farmers and
rural artisans/ craftsmen; (ii) households headed by
widows or terminally ill/disabled persons aged 60 years
or more; (iii) widows or terminally ill/disabled persons
aged 60 years or more, who doesn’t have any societal
support or assured means of subsistence; and (4) all
primitive tribal households. (MSPI: 2009-2010).
xix
Out of the 25 million families (i.e. 38% of BPL) that
need to be covered (MCAFPD: 2010).
xx
The article argues that after a “cleansing process” was
announced by GOI when officials acknowledged a
serious
flaw
in
their
targeting
system.
http://timesofindia.indiatimes.com/city/lucknow/PDScleaning-process-More-than-50000-fake-ration-cardscancelled-in-2009-10/articleshow/6549821.cms Official
information is available only on 2000. Please see:
i
According to Chang (2009), expansion of irrigation was
one of the major achievements which unfortunately,
didn’t result on a commensurate increase in production
given not enough attention was given to develop
appropriate technologies and ensure incentive prices.
ii
Regarding exchange rate, the rupee was made
convertible on current account by 1993 following a
devaluation of 50 percent against the US dollar. Inflation
was 13 percent annually (Broca: 2010).
iii
For instance the dismantlement of protective
measures, control on commodity prices remained the
same, increase on agricultural input subsidies, weak
public investment in infrastructure and little support for
smallholder farmers to face competitiveness.
iv
In most of the cases, benefiting the most those areas
where infrastructure was already in place.
v
Although investment intensity in agriculture research
and development rose from 0.2 percent of the
Agriculture GDP during the decade of 1960 to 0.5
percent to the decade of 1990, still remains below the
globally accepted. Recently investment growth has
been affected by poor public finances and even though
policy pronouncements accord high priority to this
investment, it is not reflected in financial allocations
(Jha, D. and S. Kumar: 2006).
vi
Since the decade of 1990 the government has
followed a MSP policy for 24 major crops, including
paddy and wheat. GOI announces the level of MSP
(based on the advice of the Commission on Agricultural
Costs and Prices) in a year basis (Umali-Deininger:
2001). According to Jha et al. (2010), various
noneconomic factors influence the process of setting up
the price, such as political influence of state
governments and farm lobbies. In some cases, these
prices resulted not being “minimum”, as they reached
the level of the market prices.
vii
FCI was created in 1965 has the primary responsibility
for the formulation and implementation of national
food policies. Stabilizes prices for wheat and paddy at a
pan-territorial and pan- seasonal minimum support
prices (MSP) aiming to meet: (i) public distribution
programme and (ii) [fixed] stock buffer requirements as
well as (iii) open market operations.
viii
NAFED undertakes procurement for oilseeds, pulses
and cotton. Under the PSS and when prices fall below
the MSP.
ix
th
Numbers reflect data collected until July 26 , 2010.
According to USDA (2010b), public procurement of rice
may reach an estimated 31.2 million ton-procurement
by September 2010, which would accomplish the
second largest procurement ever accounting for 35
percent of the total production. Regarding wheat,
procurement season is 2.8 million tons behind last year;
rd
however, it is still 3 highest record procurement,
accounting for 28 percent of the domestic production.
x
Livestock and fisheries sector contributed over 4.07
percent to the GDP during 2008-09 and about 26.84
percent value of the output from the total agriculture
and allied activities. Poultry continues to play an
important role in providing livelihood support and food
security, especially to the rural population (Ministry of
31
http://fcamin.nic.in/dfpd/EventDetails.asp?EventId=524
&Section=PDS&ParentID=0&Parent=1&check=0
xxi
Incorporation of smart cards that aim to link
information from allocation centre and the PDS has
been successful in the improvement of accountability
processes, reducing the probability of the agency
problem (often known as the principal agent problem )
arising.
xxii
Brought into force w.e.f. 2nd February 2006 and
came into force with effect from 1st April, 2008 (MRD:
2010).
xxiii
Banerjee, A. and E. Duflo (2011).
xxiv
MDM has experienced a long process to introduce
minimum requirements for food consumption. Only in
2006/07 a comprehensive pattern of consumption was
established for cooked meals. Institutionalization of
minimum requirements for cereals, pulses, vegetables
and iodised salt facilitated specific arrangements in food
production and preparation areas. However in 2008,
with the rise of food prices, MDM and ICDS went
through various difficulties in order to keep these
standards. Subsequently efforts brought together the
institutionalization of a policy that ensured the
automatic adjustment of the amount of budget
allocated for these schemes that permitted to maintain
both the nutrition standard and coverage in children.
Therefore, a reform on the current policy took place to
ensure that resources allocated are directly linked to the
price of food (incorporating market changes).
xxv
Meaning that the state governments contributing
towards 50% of the costs of supplementary nutrition.
For more information
http://www.sccommissioners.org/schemes/icds
xxvi
Every Government and Government-aided primary
school and all schools run by a State Government, UT
Administration, or with Government money by a Local
Body or Non-Government organisation. (Supreme Court
Commissioners: consulted on 14/09/2010 )
xxvii
th
Statistics by country. Revised on October 11 , 2010.
http://www.unicef.org/infobycountry/india_statistics.ht
ml#64
xxviii
Severe nutritional anaemia increases maternal
mortality, reduces resistance to infections and alters
mental function in children.
xxix
Vitamin A deficiency (VAD) lead to nutritional
blindness in young children increases the risk of
respiratory infections, diarrhoea and mortality.
xxx
The term ‘Panchayat Raj’ is relatively new, having
originated during the British administration. 'Raj'
literally means governance or government. Mahatma
Gandhi advocated Panchayati Raj, a decentralized form
of Government where each village is responsible for its
own affairs, as the foundation of India's political system.
His term for such a vision was "Gram Swaraj" or Village
Self-governance. It was adopted by state governments
during the 1950s and 60s as laws were passed to
establish Panchayats in various states. It also found
backing in the Indian Constitution, with the 73rd
amendment in 1992 to accommodate the idea. The
Amendment Act of 1992 contains provision for
devolution of powers and responsibilities to the
panchayats to both for preparation of plans for
economic development and social justice and for
implementation in relation to twenty nine subjects
listed in the eleventh schedule of the constitution. The
panchayats receive funds from three sources (i) local
body grants, as recommended by the Central Finance
Commission; (ii) funds for implementation of centrallysponsored schemes; and (iii) funds released by the state
governments on the recommendations of the State
Finance Commissions. This information was copied
from http://www.panchayats.in For further information,
please go to:
http://panchayat.nic.in/index.do?siteid=101&sitename=
Government%20of%20India%20%3Cbr%3E%20Ministr
y%20of%20Panchayati%20Raj
xxxi
While the central government has fixed the number
of BLP families (according to the Planning Commission’s
estimates), state governments “adjust” their own
number; the latter being often higher than the one
released by the central government. Therefore some
fiscal implications may arise depending on who finances
what amount of families (Kaur, S.: 2010)
xxxii
According to the Economic Survey 2009-10, the
estimation of BLP households in rural/urban areas
observed that the national poverty line permitted
people to consume 1,820 k calories against the desired
norm of 2,400/2,100 (rural/urban). Hence, a large
number of the rural poor got left out of the BLP status
benefits as in order to consume the desired norm of
2,400/2,100 k calories, the cut-off line for determining
BPL status should be revised. Two arising concerns are
(i) income wise, at any given point, the calorie intake of
the poorest quartile continues to be 30 or 50 percent
less than the calorie intake of the top quartile despite
needing more calories because of harder manual work;
and (ii) nutrition wise, the consumption of the bottom
of 50 percent of the population has been consistently
decreasing since 1987 (Ministry of Finance: 2010).
xxxiii
th
On January 28 , 2009, was created a Unique
identification Authority that aims to ensure
coordination
between
ministries/departments,
stakeholders and partners to bring in efficiency in the
implementation of government programmes through a
unique identification number linked to a person’s
demographic and biometric information (photographs,
finger prits and iris) which will be unique to a person. A
special focus will be developed for pro-poor
interventions, especially the NREGA, RSBY and PDS.
Timeline is expected to complete 600 million people
within four years. The first UID Numbers will be issued
by early 2011. In March, GOI approved the creation of
National Population Register (Ministry of Finance: 2010;
Planning Commission: 2010).
xxxiv
Ministry of Economic Affairs, Coordination &
Decision Support System on External Assistance India:
http://www.cdssindia.gov.in/cdss/rc?sessionid=1284972
57092115844
xxxv
For a detailed list, please take a look on:
http://www.worldbank.org.in/external/default/main?me
nuPK=295615&pagePK=141155&piPK=141124&theSiteP
K=295584
xxxvi
For more information, go to http://www.fra.org.in/
32
xxxvii
MoA has created a task force, National Mission for
Sustainable Agriculture, which is currently identifying
challenges and working on an internal circulation
document on how to orientate investment in agriculture
taking into consideration climate change.
xxxviii
In the XII Five Year Plan, an agro-meteorological
system will be introduced which will enable more the
environment for the private sector players.
xxxix
Currently, the BPL quota for each state is
determined by the Planning Commission’s estimates of
poverty in the state, which is in turn calculated on the
basis of the National Sample Survey Organisation’s
(NSSO) Consumption Expenditure Surveys (CES). For
more information, see
http://www.sccommissioners.org/schemes/tpds
xl
Food grain ration was raised from 10 kg. to 20 kg. at
50% of the economic cost whereas APL households had
to pay full economic price. According to the WB the
latter eliminated any existent price subsidy (UmaliDeininger, Dina L et al: 2000).
xli
The States/Union Territories (UTs) are required to
bear the distribution cost, including margin to dealers
and retailers, as well as the transportation cost. Thus the
entire food subsidy is being passed on to the consumers
under the scheme (MSPI: 2009-2010). For more
information, go to
http://www.sccommissioners.org/pdfs/primers/aayguid
elines.pdf
xlii
Selection criteria for additional families profile is: (i)
landless agriculture labourers, marginal farmers and
rural artisans/ craftsmen; (ii) households headed by
widows or terminally ill/disabled persons aged 60 years
or more; (iii) widows or terminally ill/disabled persons
aged 60 years or more, who doesn’t have any societal
support or assured means of subsistence; and (4) all
primitive tribal households. (MSPI: 2009-2010).
xliii
For more information, see:
http://www.sccommissioners.org/schemes/noaps
xliv
NOAPS started under the umbrella of the National
Social Assistance Programme (NSAP). Over the years, it
suffered some modifications: (a) in 2007 was named
Inidra Gandhi national old Age Pension Scheme
(IGNOAPS) on 11/19/2007 (effective date) and extended
its coverage to all BPL recipients. (b) In 2009 two other
schemes were originated, for widow pensions (IGNWPS)
and for disabled people (IGNDPS). Currently, the three
of them remain under the umbrella of NSAP.
xlv
Brought into force w.e.f. 2nd February 2006 and
came into force with effect from 1st April, 2008 (MRD:
2010).
xlvi
(1) Universalization of SHG’s to ensure that at least
one member of each rural BPL household be brought
under the SHG net over the period of seven years, from
2009 to 2016; (2) Skill development and placements in
order to increase the employability of rural BLP young
people ; and (3) Expansion of rural development and self
employment training institutes (RUDISETI).
xlvii
It has five components: (i) Urban self-employment
programme (USEP) that targets individual urban poor
for setting up of micro enterprises; (ii) Urban women
self-employed programme (UWSP) which targets urban
poor women self-help groups for setting up of group
enterprises and providing them assistance through a
revolving fund for thrift and credit activities; (iii) Skill
training for employment promotion amongst urban
poor (STEP-UP); (iv) Urban wage employment
programme (UWEP) for construction; and (v) Urban
community development network (UCDN) assists urban
poor into organizing themselves into a self-managed
community structures to participate in effective
implementation poverty alleviation programmes
(Ministry of Finance: 2010)
33
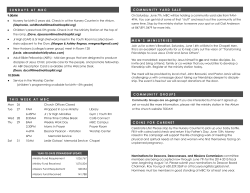
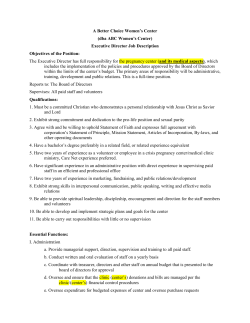


© Copyright 2026