
NGL - National Association of Publicly Traded Partnerships
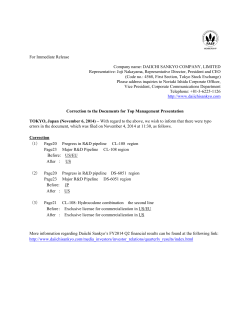
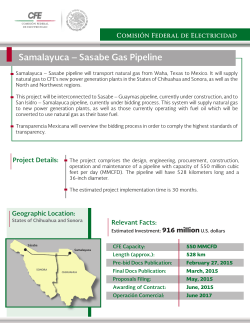
NAPTP Conference May 2015 Forward Looking Statements This presentation includes “forward looking statements” within the meaning of federal securities laws. All statements, other than statements of historical fact, included in this presentation are forward looking statements, including statements regarding the Partnership’s future results of operations or ability to generate income or cash flow, make acquisitions, or make distributions to unitholders. Words such as “anticipate,” “project,” “expect,” “plan,” “goal,” “forecast,” “intend,” “could,” “believe,” “may” and similar expressions and statements are intended to identify forward-looking statements. Although management believes that the expectations on which such forward-looking statements are based are reasonable, neither the Partnership nor its general partner can give assurances that such expectations will prove to be correct. Forward looking statements rely on assumptions concerning future events and are subject to a number of uncertainties, factors and risks, many of which are outside of management’s ability to control or predict. If one or more of these risks or uncertainties materialize, or if underlying assumptions prove incorrect, the Partnership’s actual results may vary materially from those anticipated, estimated, projected or expected. Additional information concerning these and other factors that could impact the Partnership can be found in Part I, Item 1A, “Risk Factors” of the Partnership’s Annual Report on Form 10-K for the year ended March 31, 2014 and in the other reports it files from time to time with the Securities and Exchange Commission. Readers are cautioned not to place undue reliance on any forward-looking statements contained in this presentation, which reflect management’s opinions only as of the date hereof. Except as required by law, the Partnership undertakes no obligation to revise or publicly update any forward-looking statement. 2 Section II Overview of NGL Energy Partners 3 Overview of NGL Business Description NGL Water Solutions Exposure to : Benefits from: Crude Logistics Midstream/Upstream Midstream Higher prices Higher prices Liquids Retail Propane Midstream Retail Lower prices Wholesale/Retail Lower prices Lower prices Segment Contribution Fiscal 2016 Fiscal 2015 Refined Products/ Renewables 16% Retail Propane 19% Liquids 20% Crude Logistics 15% Water Solutions 28% Refined Products/ Renewables 16% Liquids 17% Retail Propane 15% Crude Logistics 26% Water Solutions 26% 4 NGL Energy Partners 1. NGL is a diversified midstream MLP that provides multiple services to Adjusted EBITDA Growth Over Time producers and end-users $500+ Transportation, storage, blending and marketing of crude oil and natural gas $ 425+ liquids for producers Water Solutions for producers Transportation, storage, terminaling and marketing of Refined Products/ $ 271 Renewables and Retail Propane to end users $ 184 2. Vertical integration enables NGL to be the full service provider Crude oil from wellhead to refinery Produced/ Flowback water from wellhead to disposal, recycle or discharge NGL’s from fractionator/refinery/hubs to propane, butane and commercial end-users, including retail propane distribution Refined Fuels/ Renewables from refinery to pipeline and terminals to $ 24 IPO 2013 2014 FY 2015E FY 2016P (May 2011) (3/31/13) (3/31/14) (3/31/15) (3/31/16) Fiscal 2015 Projected EBITDA $425mm* or greater wholesalers / retailers Fiscal 2016 Projected EBITDA greater than $500mm * Excluding one-time acquisition costs 5 NGL Energy Partners 3. Natural Hedges between segments minimizes commodity price risk – Water disposal vs. Crude storage – Midstream/Upstream vs. Downstream/Retail 4. Approximately 45% fee based business, on target to exceed 60% fee based business by 2017 5. Successful Track Record of Growth Projects – 6. 7. >$3.5 billion in Acquisitions and organic growth projects since IPO Consistent Distribution Growth – 114% CAGR EBITDA growth from EBITDA of $24 million at IPO to $500 million or greater in Fiscal 2016 – Distribution Growth of 85% since IPO – 14 consecutive quarters of Distribution Growth Significant Insider ownership – LP Ownership >11% – GP Ownership >59% 6 NGL Has a Proven Track Record of Successful Growth Since NGL's IPO in May 2011, NGL has consumated and integrated more than 40 acquisitions Distribution growth of 6% - 8% Key Growth Metrics and Performance Market Cap ($mm) Distribution Per Unit ($) 0.59 0.45 0.46 0.48 0.49 0.51 0.53 0.61 0.62 $3,213 0.63 0.55 0.41 0.34 0.35 0.36 $1,442 0.17 MQD at IPO 2Q12 3Q12 (1) 4Q12 1Q13 2Q13 3Q13 $30.22 Share price as of 5/19/15 4Q13 1Q14 2Q14 3Q14 4Q14 1Q15 2Q15 3Q15 4Q15 3/31/2013 Current (1) 7 Financial stability while executing growth 1,600 5x 1,400 4x Thousands 1,200 1,000 3.20 2.98 800 3.18 3x 2.91 2x 600 Equity Issuances – $300 million public offering (July-13) – $135 million public offering (Sept-13) – $240 million private placement (Nov-13) – $400 million public offering (June-14) – $170 million public offering (Mar-15) 400 1x 200 - x 2011 2012 2013 Total Acquisitions & 2011 2.98 2.91 3.20 3.18 2014 2015 2011 2.91 Debt2.98 Leverage Growth Capex Debt Issuances – $250 million of secured (June-12) – $450 million of unsecured (Oct-13) – $400 million of unsecured (June-14) Distribution Increase from $1.30 to $2.50 per common unit 8 NGL Value Proposition 10.0% NGL 9.0% LQA Yield 8.0% 7.0% OKS WPT QEPM ETP GLP WPZ HEP BKEP SMLP EEP BPL 6.0% PAA PBFX MWE 5.0% GEL TCP SEP EPD 4.0% 3.0% 2.0% 4.0% 6.0% 8.0% 10.0% 12.0% 14.0% Future Distribution Growth Guidance Sources: Company filings, Wall Street Research and FactSet (market data as of 4/15/2015) 9 Section II Asset & Geographic Diversification 10 Diversified Across Multiple Businesses and Producing Basins NGL’s operations are geographically and operationally diversified Significant presence in the most economic oil and natural gas shale plays in the country Coast-to-coast terminals and Retail Propane locations Various segments create a natural hedge against commodity prices Bakken Shale Marcellus Shale Green River Basin Pinedale Anticline DJ Basin Jonah Field Niobrara Shale NGL Assets and marketing presence Refinery terminal NGL leased storage Wattenberg Field Mississippi Lime Granite Wash NGL proprietary terminal Natural gas liquids segment Permian Basin Railcar NGL terminal Common carrier pipeline Crude operational area Crude barge terminal NGL proprietary crude storage Eagle Ford NGL proprietary crude pipeline Crude Marine Water Services Retail Propane 11 RefinedII Products / Renewables - Area of Operations Section Mid Continent Terminals 12 Significant Operational Diversity Crude Logistics Description Region Cash Flow Characteristics Water Solutions NGL Liquids Retail Refined Products/ Renewables Purchase and transport crude oil from wellhead to refinery Own and operate storage, pipelines, terminals, barge, rail and truck logistics assets Treatment of oil and gas wastewater Water disposal Innovative (patented technology) Solids Processing Transport, handle, store NGLs Own assets across value chain Distribute propane / distillates to residential, industrial, and commercial customers Own assets 90% tank ownership Purchase and transport refined products from refinery to rack Own and operate pipelines and terminals Mid-continent Eagle Ford / Permian Rockies Gulf Coast Coast to Coast Canada Midwest Northeast Pacific Northwest Coast to Coast Terminals located in East and S/E region of U.S. Fee-based pipeline, storage, terminals and assets Margin-based logistics Back-to-back contracts Fee-based Take-or-pay / acreage dedication contracts Strong customer base Fee-based / Cost Plus Back-to-back contracts Margin-based Utility residential model Weather-sensitive Minimum throughput contracts Fixed margin contract business Back-to-back contracts Anticline (WY) DJ Basin (CO) Eagle Ford (TX) Permian (TX) Granite Wash (TX) Bakken (ND) Delaware (TX) Eaglebine (TX) 13 Section II Operating Segments 14 Crude Logistics Area of Operation Segment Operations Purchases and transports crude oil for resale to a pipeline injection point, storage terminal, barge loading facility, rail facility, refinery or trade hub Bakken Shale Strategically deployed railcar fleet, tows, barges and trucks provide access to multiple customers and markets, allowing NGL to bring the right crude oil to the right market DJ Basin Niobrara Shale Wattenberg Field Maximizes value of crude oil gathered through proprietary linear programming model Reduces exposure to price fluctuations by using back-to-back contractual agreements Purchase from >6,200 active lease locations representing >600 producers Current volumes of ~275,000 bbls/day Mississippi Lime Granite Wash Permian Basin Crude Oil Logistics Crude operational area Crude oil segment Crude barge terminal NGL proprietary crude storage NGL proprietary crude pipeline Crude Barges Eagle Ford NGL Crude Pipeline 15 Crude Logistics Asset Overview 7.5 MMbbls of storage in Cushing (3.4MMbbls leased) 5 Gulf Coast terminals with aggregate capacity of ~850 Mbbls Terminals Port of Catoosa, Oklahoma - storage services; truck and rail trans-loading to barges with access to Gulf Coast; 140Mbbls storage capacity 7 truck terminals and 50+ LACT units Rail Barges ~1,100 GP railcars leased or owned Railcars provide optionality to markets via company and third-party facilities Own 9 tows, 21 barges, 20-25Mbbls per barge capacity Lease additional 2 tows and 6 barges 100% interest in Grand Mesa Pipeline; ~220MMBPD capacity Pipelines 50% interest in Glass Mountain Pipeline; ~147MMBPD capacity Ship on 21 common carrier pipelines Utilize historical shipper space on 11 prorated pipelines >300 owned trucks and >300 trailers Trucks Additional ~100 trucks on committed lease Moving Company first-purchased barrels and fee-based hauling for third parties 16 NGL Cushing Storage and Connectivity The Cushing Terminal has superior connectivity to supply and sales markets Enterprise (NYMEX delivery point with access to Seaway) SemCrude (with assets to BKEP) Plains Magellan Pony Express via Deeprock/Kinder Morgan Terminal Coffeyville Cushing Terminal Glass Mountain Pipeline TransCanada Marketlink Terminal Future Grand Mesa Pipeline 14,000 bbl per hour pumping capacity 17 Grand Mesa Pipeline Project scope: – ~558 mile long pipeline capable of handling unique crude grades in batches – Construction costs fixed at $655 million over the course of the project plus $15 million for storage at Cushing – Annual EBITDA, backed by long-term contracts, is expected to be at least $150 million in year 1 – 2 collection stations in Northeast Colorado (Lucerne and Kersey) with dedicated storage – Destination is NGL’s Cushing Terminal which provides access to key Midcontinent and Texas Gulf Coast refinery markets – Completion projected to be third quarter - 2016 18 Glass Mountain Pipeline Asset scope: – The pipeline consists of two, 12” laterals and an 18” mainline totaling 211 miles – 3 main pump station sites at Arnett, Alva and Ruby – 50% interest in Glass Mountain Pipeline – ~147MMbbls/d capacity – Destination is NGL’s Cushing Terminal which provides access to key Midcontinent and Texas Gulf Coast refinery markets Cleo Springs Cleo Station” Springs “Ruby “Ruby Station” Alva Arnett Arnett Cleo Springs “Ruby Station” Cushing Arnett 19 Water Solutions Overview Area of Operation Segment Operations Provides services for the treatment, processing, and disposal of wastewater, and solids generated from oil and natural gas production Revenue streams from the disposal of wastewater, solids, water pipelines, and recovered hydrocarbons Over 1 million bpd of total capacity Significant Geographic diversification in the basins with the most attractive returns Provides high technology solution where necessary. Has highly advanced technology and commits $2.0-$3.0 million annually on R&D Bakken Shale Pinedale Anticline DJ Basin Jonah Field Niobrara Shale Wattenberg Field Granite Wash Delaware Basin Water Solutions Operational Area Permian Basin Eagle Ford Eaglebine Water Services 20 Water Treatment and Processing Operational Model Treatment and Disposal – Company-owned disposal facilities provide producers affordable well-disposal of wastewater generated from oil and natural gas production and drilling activities – Water treatment process separates solids and hydrocarbons from water prior to disposal – 24 x 7 operations, truck bay loading/unloading – Certain facilities are pipeline connected, providing stronger customer relationship with the producers – Proprietary well maintenance programs enhance injection-rates and service lives of the wells Solids Processing – Significant new revenue stream through installation of supplemental equipment at existing salt water disposal facilities – Provides producers with in-field disposal alternative for Gels, High Solids Content Water, Water and Oil based Mud, and Tank Bottoms generated from oil and natural gas production and drilling activities – Generates attractive margin per barrel for NGL while providing substantial cost savings to producers through reduced transportation and landfill disposal costs – 24 x 7 operations, truck bay unloading Discharge Water – Multi-patented 14-step water treatment process – Cleans water to a better than drinking water quality – Continued R&D investments to employ latest technologies in various basins 21 Water Solutions Facility locations Daily Disposal Capacities – Bakken 40 MBPD – DJ 140 MBPD – Granite Wash 52 MBPD – Permian 390 MBPD – Eagle Ford 330 MBPD Daily Recycle Capacities – Pinedale 60 MBPD – DJ 20 MBPD 22 Liquids Overview Area of Operation PHILADELPHIA 23 Liquids Terminals and Wholesale Supply & Marketing Segment 21 terminals serving over 400 customers – 17 terminals with rail loading capability – 13 multi-product terminals – 13 pipe-connected terminals 12 million gallons of above ground storage > 3.8 million barrels of leased underground storage Automated truck loading and unloading facilities operating 24 hours a day Over 900 wholesale customers in 47 states Approximately 85,000 Bbls/d of propane sold – ~33% of which goes through proprietary terminals – Includes 250 million of pre-sold propane gallons at a fixed price with a locked-in margin Shipper on 5 common carrier pipelines Underground storage facility in Delta, UT Capacity of up to 10 million barrels by end of 2017 Rail and truck loading and unloading Storage capacity leased to customers on multiyear basis Railcar Segment Transports and markets NGLs to and from refiners, gas processors, propane wholesalers, proprietary terminals, petrochemical plants, diluent markets and other merchant users of NGLs Service offered in each of the lower 48 states and Canada Utilizes terminal storage to take advantage of seasonal demand Purchase-and-sale transactions are entered primarily on a back-to-back basis Average volumes of ~50,000 Bbls/d from more than 100 customers Majority of liquids sold are butane and propane ~ 4,000 leased high pressure railcars; ~700 GP railcars 24 Sawtooth NGL Caverns Currently developing the largest underground liquids storage facility in the Western U.S. Sawtooth will hold more than 10mmbbls of Natural Gas Liquids in 8 caverns. Sawtooth is 100% fee-based and contracted business. Sawtooth’s expansions will be substantially contracted by the time they come online. 25 RefinedII Products - Contracted Section Mid Continent Terminals 26 Refined Products – Rack/Just-in-time Refined fuels markets and sales volume 27 Refined Products Refined Product – Rack/Just-in-time Market refined products at the rack to wholesale Refined Product - Contracted resellers and end users in the spot market Market refined products at the rack to contracted customers 188 terminals with sales in 37 states 7.35 million gallons of leased above ground storage Automated truck loading and unloading facilities Approx. 2.2 billion gallons of storage capacity operating 24 hours a day Automated truck loading and unloading facilities 48 terminals with sales in 17 states – 18 water borne terminals Approximately 500 customers Approximately 75,000 Bbls/d of distillates and Approximately 500 customers gasoline sales Approximately 120,000 Bbls/d of distillates and Rack sales through common carrier pipeline terminals Large shipper on Colonial and Plantation pipelines operating 24 hours a day gasoline sales 80% of volumes are contracted 28 Collins Complex Pipeline Connections Receipt, storage and injection to/from Colonial and Plantation Pipelines Storage Facilities 3.9 mm bbls working capacity Commodities Handled Petroleum Products Gasoline Distillates Butane Blending Collins Storage Opportunity Construct an additional 1MM barrels of light product storage Purvis Terminal Collins Terminal Collins Rail Terminal 29 Bostco Terminal Bostco is a newly constructed black oil terminal in the Houston Ship Channel with approximately 7.1 million barrels of capacity TLP owns 42.5% of Bostco and Kinder Morgan owns 55% Permitted for four deepwater ship docks, with 45 feet of draft − Each dock can handle two ships (Aframax, Panamax or ocean-going barges) Product handled − − − − Residual Fuel Oil VGO Blend Stocks Distillate 30 Brownsville Terminal Pipeline Connections Valley Pipeline, MB Pipeline, Diamondback Pipeline Marine Facilities Five Oil Docks (Port of Brownsville) Storage Facilities 2.1 mm bbls working capacity Rail Facilities 300 total spots 100 offloading spots Truck Facilities 17 Loading Racks (30 lanes) Top/Bottom loading Metered/scales Opportunity for blending products, Rail Connectivity, Deep Water dock , Room to construct unit train facility, Storage Expansion 31 Retail Propane Overview Area of Operation Segment Operations Sell propane and petroleum distillates to end-users consisting of residential, agricultural, commercial and industrial customers Geographic diversity mitigates weather risk Less volatility from warm weather as margins increase when demand falls and vice versa Liquids Logistics segment provides 75% of Retail Propane segment demand Cost plus margins allow immediate pass-through of wholesale price increases The Retail Propane business is seasonal ~70% of retail propane volume is sold during the peak heating season from October through March Retail Propane Operational Area Focus on residential customers, high tank ownership and customer retention 32 Retail Propane What Sets Us Apart Geographic Focus Customer Base Retention Leverage Acquisition Brand Names Empower Local Management Operational focus on regions with the highest number of degree days – North East, Upper Midwest and Pacific NW In warmer weather, gross margins temporarily expand to recoup a portion of revenues lost to volume declines Retain and grow customer base by pricing product competitive with other regional retailers Acquisition model assumes independent / “mom-and-pop” margins continue Retain local brand - no change to uniforms, invoices, signs or trucks Ownership change is seamless to customers while simultaneously saving on capital expenditures and expenses Decisions regarding pricing, advertising, vehicles and other expenses are made at the regional and district levels Fosters swift decision making by leadership attuned to the local or regional market Daily price changes at supply points are communicated to local management Efforts are made to retain employees of acquired businesses Employee Retention Quickly Implement Operational Improvements Aides in preservation of customer relationships, safeguarding knowledge of local market dynamics, and prevents the creation of ex-employees investing in competitive propane assets ▪ History of successful acquisitions with demonstrated track record of improving profitability through operational efficiencies, not margin enhancement Improved vehicle routing, consolidated back office functions, less expensive insurance, etc. 33 Visibility to $1 billion EBITDA and two-thirds fee based by 2018 Projected Segment Contribution EBITDA (in MM's) NGL Fiscal 2016 Guidance Current Internal Growth Projects: Grand Mesa Pipeline, Sawtooth Other Future Acq. & Internal Growth Capex: 2018 $ 500 180 70 2 billion @ 8x Total Refined Products/ Renewables 19% Liquids 13% Crude Logistics 37% Water Solutions 22% 250 $ Retail Propane 9% 1,000 Maintain a consistent cash distribution policy that complements our acquisition and organic growth opportunities ~65% fee based business Long term Contracts 34 Conclusion and Key Takeaways Compelling investment opportunity with attractive combination of yield and growth – Distribution growth guidance of 6% - 8% – 85% per unit distribution increase since IPO Five business segments provide multiple growth platforms – Brings strategic acquisitions that are accretive – Substantial highly accretive organic growth projects Diverse geographic and operational footprint reduces risk Natural Hedge between business segments reduces volatility Increasing Fee based business Disciplined credit profile and sufficient liquidity to run business and execute growth objectives Experienced, management team with substantial equity ownership 35


© Copyright 2026