
Document 15224
CHAPTER 8
MATERNAL AND CHILD HEALTH
This chapter presents findings related to maternal and child health (MCH) including antenatal and
delivery care, inrmunization coverage, and childhood illnesses and treatment (i.e., acute respiratory infection,
fever and diarrhea). This information can be used to identify groups of women and children who are "at risk"
because of nonttse of services and to develop programs to supply services to those groups. The findings
presented in this chapter are based on data obtained from women who had a live birth in the three years
preceding the survey.
8.1
Antenatal Care
Coverage and Source of Care
Table 8. l shows the percent distribution of births in the three years preceding the survey by source
of antenatal care received during pregnancy, according to background characteristics. Interviewers were
instructed to record all persons a woman had seen for care, but the statistics in Table 8. I are based on the
provider with the highest qualifications. For seven often births in Vietnam the mothers received antenatal
care from a doctor (25 percent) or trained nurse or midwife (46 percent). Mothers received care from a
traditional birth attendant (TBA) in only I percent of births. A significant finding is that mothers received
no antenatal care for 28 percent of births.
Comparison with the 1CDS-94 indicates that the utilization of antenatal services has increased during
the last three years. The percentage of women giving birth, who received antenatal services f r o m a doctor,
nurse, or midwife, has increased from 55 percent in 1990-94 to 71 percent in 1995-97. The percent receiving
no antenatal care decreased over the same period from 43 to 28 percent.
Women in the age group 20-34 are more likely to use antenatal services than older women (age 35
and above) or very yotmg women (age less than 20), This is especially true with regard to care from doctors.
Similarly, lower birth order is associated with greater use of services provided by medically trained health
workers, especially doctors. Perhaps this pattern occurs because young women tend to be more educated
than older women and are more likely to have knowledge about the benefits of antenatal care. It could also
be that young prim igravidae women are more anxious because of their lack of previous experience and are
more likely to seek care from trained professionals.
There are substantial differences in the u s e of antenatal services between urban and rural areas.
Overall, the percentage of women seeing trained medical staff is higher in urban than in rural areas (87
versus 68 perdent) and urban women are using doctors much more frequently than rural women. In contrast.
rural women are more likely to see trained nurses or midwives for antenatal care. Utilization of antenatal
services is slightly higher in the non-project provinces than in the project provinces• Regionally, utilization
is highest in the Red River Delta (87 percent of mothers having received antenatal care). The Central Coast
and Central Highlands are comparatively nnderserved (about 40 percent of women having received no
aiRenatal services).
Table 8.1 shows that as a woman's education increases, the likelihood that a woman will receive no
antenatal care decreases sharply from 7] percent among births to women with no education to 9 percent
among births to women who bave completed higher secondary school. Use of a doctor for antenatal care
increases
91
Table 8.1 Antenatal care
Percent distribution of live births in the three years preceding the survey by source of antenatal care during pregnancy.
according to background characteristics, Vietnam 1997
Antenatal care provideP
Traditional
Nurse/
birth
Number of
Background characteristic
Doctor
M i d w i f e " attendant
No one
Total
births
Mother's age at birth
< 20
20-34
35+
13.0
26.0
22.7
51.5
46.9
35.7
I. I
1.2
0.4
34.5
25.9
41.3
100.0
t 00,0
100.0
165
I A63
19 I
34.3
21.2
12.9
13.6
42.2
51.7
44.7
28.2
1.2
I.I
0.4
1.9
22.2
25.9
42.(I
56.3
100.0
100.0
I0(I.0
100.0
66 I
816
248
94
64.4
17.8
22.9
50.0
0.0
1.3
12.7
30.9
t00.0
100.0
261
1.558
Project province
No
Yes
25.6
21.9
46.9
44. |
0.9
1.6
26.6
32.5
100.0
100.0
1.283
Region
Northern Uplands
Red River Delta
North Central
Central Coast
Central Highlands
Southeast
Mekong River Delta
14.7
26.0
8.2
22.8
33. I
47.0
32.5
50.9
61.3
61.9
36.8
30. I
34.8
32.4
1.8
0.0
2. I
0.0
0.0
0.0
2.4
32.6
12.6
27.8
40.5
36.7
18.2
32.7
I00.0
100.0
100.0
100.0
100.0
100.0
100.(I
406
302
249
246
Ifill
21)5
309
Mother's education
No education
Some primary
Completed primary
Completed lower secondaB
Completed higher secondary+
7.1
16.8
24.8
23.3
46.3
21.4
32.3
51.6
55.8
44. I
07
70.8
i 00.0
0.9
50.0
lOll.t)
1.2
1.5
0.4
22.4
19.3
9.1
It)(I.0
100.0
10(I.0
125
343
60 I
51 I
239
100.0
1.818
.I
Birth order :
I
2-3
4-5
6+
Residence
Urban
Rural
[otal
24.5
46. I
I. I
28.3
Iflhe respondent mentioned more than one provider, only the must qualified provider is considered.
Includes doctor's assistant.
535
from 7 percent among births t6 uneducated women to 46 percent among births to women who have
completed higher secondary school.
Antenatal care can be more effective in avoiding adverse pregnancy outcomes when it is sought
early in the pregnancy and continues through to delivery. Obstetricians generally recommend that antenatal
visits be made on a monthly basis to the 28th week (seventh month), fortnightly to the 36th week (eighth
month), and then weekly until the 40th week (i.e.. the time o f birth). If the first antenatal visit is made at the
third month o f pregnancy, this optimum schedule translates into a total o f 12 or 13 visits during the
pregnancy.
Information about the number and timing o f antenatal visits made by pregnant women is presented
in Table 8.2. The median number o f visits among women who received antenatal care is two; 57 percent o f
women had more than one antenatal visit but only 15 percent had more than three visits. A m o n g women
who received antenatal care, the median duration o f the pregnancy at the first visit was 4 months.
92
Table 8.2 Number of antenatal care visits and stage of
pregnancy
Percent distribution of live births in the three years
preceding the survey by the number of antenatal care
(ANC) visits, and by the stage of pregnancy at the time
of the first visit. Vietnam 1997
Number of visits and
stage of pregnancy
Percent
Number of visits
None
28.3
14.8
41.6
15.2
O.!
I
2-3
4+
Don't know/missing
Total
Median
100.0
1.9
N u m b e r of months pregnant
at time of first visit
No antenatal care
< 6 months
6-7 months
8+ months
Don't know/missing
Total
28.3
58.2
10.7
2.8
0.0
100.0
Median (womenreceivingANC)
Numberof births
3.8
1.818
Tetanus Toxoid Coverage
An important component of antenatal care is ensuring that pregnant women and children are
adequately protected against tetanus. Tetanus toxoid injections are given during pregnancy for the
prevention of neonatal tetanus, an important cause of death among infants. For full protection, a pregnant
woman should receive two doses of the toxoid. However, ira wornan has been vaccinated during a previous
pregnancy, she may require only one dose during the current pregnancy.
Table 8.3 provides information on tetanus toxoid coverage during pregnancy for all births in the
three years preceding the survey. For about half of all births (55 percent), mothers received two or more
doses of tetanus toxoid during pregnancy, while 17 percent received one dose. For over one-quarter of births
(28 percent), mothers did not receive any tetanus toxoid injections.
The differentials in tetanus toxoid coverage closely resemble those observed for antenatal care.
Births to women in the age group 20-34, women with higher education, urban residence, and residence in
the Red River Delta region are all associated with higher levels of tetat~us toxoid coverage. Mothers of
children who are birth order six or more are about twice as likely to have received no tetanus toxoid
injections as mothers of children who are less than birth order six. There is little difference in coverage
•between project and non-project provinces. Unfortunately. for more than two in five births (44 percent) in
the Central Highlands, mothers received no tetanus toxoid injections.
93
Table 8.3 Tetanus toxoid vaccination
Percent distribution of live births in the three years preceding the survey by number of tetanus toxoid vaccinations received
during the pregnancy, according to background characteristics, Vietnam 1997
Two or
Don't
Number
One
more
know/
of
Background characteristic
None
dose
doses
Missing
Total
births
Mother's age at birth
< 20
42.7
13.3
44.0
0.0
100.0
165
20-34
25.3
17.1
57.2
0.4
100.0
1.463
35+
38.8
17.9
43.3
0.0
100.0
191
Birth order
1
2-3
4-5
6+
28.8
24.4
29.2
55.8
14.2
18.0
21.4
13.4
56.9
57.0
49.5
30.8
0.I
0.7
0.0
0.0
100.0
100.0
100.0
100.0
661
816
248
94
Residence
Urban
Rural
13.6
30.7
17.2
16.8
68.8
52.2
0.4
0.3
I00.0
100.0
261
1.558.
Project province
No
Yes
27.4
30.0
16.6
17.4
55.6
52.1
0.4
0.2
100.0
100.0
1.283
535
Region
Northern Uplands
Red River Delta
North Central
Central Coast
Central Highlands
Southeast
Mekong River Delta
35.7
12.8
22.8
27.6
44.0
26.4
34.7
23.7
14. I
16.7
13.0
20.2
14.8
13.8
40.6
73.1
60.5
59.3
34.8
58.1
50.3
0.0
0.0
0.0
0.0
1.0
0.7
1.3
100.0
100.0
100.0
100.0
100.0
100.0
100.0
406
302
249
246
100
205
309
Mother's education
No education
Some primary
Completed primary
Completed lower secondary
Completed higher secondary+
56.8
42.6
26.4
22.9
8.7
19.3
18.3
18.8
14.2
14.1
23. I
38.9
54. I
62.7
77. I
0.8
0.2
0.7
0.1
0.0
100.0
t00.0
100.0
t00.0
100.0
125
343
601
511
239
Total
28.3
16.8
54.6
0.4
100.0
1.818
8.2
Delivery Care
Place of Delivery
An important component o f the effort to reduce the health risks o f mothers and children is to
increase the proportion o f babies delivered under medical supervision. Proper medical attention and hygienic
conditions during delivery can reduce the risk o f complications and infections that can cause the death or
serious illness o f the mother and/or the baby.
Respondents in the VNDHS-II were asked to report the place o f delivery for all births occurring in
the three years before the survey (Table 8.4). At the national level, three out o f five births (62 percent) were
delivered in health facilities, while the remaining births were delivered at home. This represents a modest
increase from the statistic reported in the I C D S - 9 4 : 5 6 percent o f births in the 10-year period 1984 to 1994
were delivered in a health facility (GSO, 1995).
94
Table 8.4 Place of delivery
Percent distribution of live births in the three years preceding the survey by place of delivery.
according to background characteristics and number of antenatal care visits. Vietnam 1997
Number
Itealth
At
of
Background characteristic
facility
home
Total
births
Mother's age at birth
< 20
20-34
35+
49.9
63.6
56.9
50. I
36.4
43.1
100.0
100.0
100.0
165
1.463
191
Birth order
I
2-3
4-5
6+
72.9
61.0
44.0
35.9
27.1
39.0
56.0
64, I
I00.0
100.0
100.0
100.0
661
816
248
94
Residence
Urban
Rural
92.0
56.6
8.0
43.4
100.0
100.0
261
1.558
Project province
No
Yes
62.4
60.1
37.6
39.9
100.0
100.0
1.283
535
Region
Northern Uplands
Red River Delta
North Central
Central Coast
Central Highlands
Southeast
Mekong River Delta
30.2
96.1
46.4
49.5
47.8
88.8
78.0
69.8
3.9
53.6
50.5
52.2
I 1.2
22.0
100.0
100.0
100.0
100.fi
100ll
100.0
100.0
406
302
249
246
100
205
309
Mother's education
No education
Some primary
Completed primar),
Completed Iox~ersecondary
Completed higher secondary+
31.8
41.9
58.7
72.9
89.3
68.2
58.1
41.3
27.1
10.7
I(10.0
100.0
100.0
Il)(l.O
I fi0.O
125
343
60 I
51 I
239
Antenatal care visits
None
I-3 visits
4+ visits
Don't know/missing
40.7
64.3
90.8
*
59.3
35.7
9.2
*
l 0l).ll
100.0
100.0
*
515
1.025
277
I
Total
61.7
38.3
10D.0
1.818
Note: An asterisk indicates that a figure is based on 6:wer than 25 unweightcd cases and has
been suppressed.
Older women (age 20-34) and low parity women are more likely than young women (less than 20
years) and high parity women (6+) to deliver at a health facility. A child born in an urban area is nearly
twice as likely to have been delivered at a health facility than a rural child. There is little difference between
project and non-project provinces by place of delivery. Children living in the Northern Uplands are much
less likely to be delivered in a health facility tlaan children living in the Red River Delta or the Southeast
regions--30 percent compared with 96 percent and 89 percent, respectively. Use of delivery facilities rises
sharply with maternal education from 32 percent of births among women with no education to 89 percent
oJ'births among women in the highest education category.
Women who receive antenatal services are more likely to deliver in a health facility. While the
majority of births among women with no antenatal visits were delivered at home (59 percent), the majority
of births among women with one or more antenatal visits were delivered in ;. health facility. In fact, only
9 percent of women with four or more antenatal visits delivered at home.
95
Assistance
at Delivery
T h e l e v e l o f a s s i s t a n c e a w o m a n r e c e i v e s d u r i n g birth h a s i m p o r t a n t h e a l t h c o n s e q u e n c e s f o r b o t h
t h e m o t h e r a n d t h e c h i l d . B i r t h s d e l i v e r e d at h o m e are m o r e l i k e l y to be d e l i v e r e d w i t h o u t p r o f e s s i o n a l
a s s i s t a n c e , w h e r e a s b i r t h s d e l i v e r e d at a h e a l t h f a c i l i t y are m o r e l i k e l y to b e d e l i v e r e d by t r a i n e d m e d i c a l
p e r s o n n e l . T a b l e 8.5 s h o w s t h a t t h r e e out o f f o u r births ( 7 7 p e r c e n t ) w e r e d e l i v e r e d u n d e r t h e s u p e r v i s i o n
o f a d o c t o r ( 2 7 p e r c e n t ) o r trained nurse o r m i d w i f e ( 5 0 p e r c e n t ) . T h i s has c h a n g e d o n l y s l i g h t l y f r o m t h e
7 3 p e r c e n t r e p o r t e d in I C D S - 9 4 ( G S O , 1 9 9 5 ) . T r a d i t i o n a l birth a t t e n d a n t s a s s i s t e d in t h e d e l i v e r y o f 12
p e r c e n t o f b i r t h s w h i l e a n o t h e r 1 I p e r c e n t o f births w e r e a s s i s t e d by r e l a t i v e s a n d others.
Table 8.5 Assistance during delivery
Percent distribution of live births in the three years preceding the survey by type of assistance during delivery, according
baek~rnund characteristics and number of antenatal care visits. Vietnam 1997
Attendant assisting during delivery ~
Traditional
Number
Nurse/
birth
Relative/
No
of
Background characteristic
Doctor
Midwife-'
attendant
Other
one
Total
births
Mother's age at birth
< 20
16.2
59.6
I 1.1
12.6
0.5
100.0
165
20-34
28.3
49.0
I 1.8
10.8
0.2
100.0
1,463
35+
26.3
50.4
12.9
10.0
0.4
100.0
191
Birth order
I
2-3
4-5
6+
38.8
21.8
17.9
12. I
46.3
54.7
48.7
40.0
7.3
12.5
17.3
24.0
%5
I 0.8
15.3
23.9
0. I
0.2
0.7
0.0
100.0
100.0
100.0
100.0
66 I
816
248
94
Residence
Urban
Rural
74.7
19.0
23.8
54.5
0.7
13.7
0.8
12.6
0.0
0.3
100.0
100.0
261
1,558
Project province
No
Yes
28.5
23.2
49.5
51.6
I 1.6
12.5
10.3
12.4
0.2
0.3
100.0
I00.0
1.283
535
Region
Northern Uplands
Red River Delta
North Central
Central Coast
Central Highlands
Southeast
Mekong River Delta
17.9
33.7
10.8
19.0
24.0
53. I
35.3
39.9
66.0
67.9
46.4
40.5
39.9
46.4
7.3
0.0
12.3
28.2
24.5
5.0
16.5
34.8
0,4
8.6
6.4
I 1.0
1).9
1,8
0.2
0,0
0.4
" 0.0
(1.0
1.1
0.0
100.0
100.0
100.0
100.0
100.0
100.0
100.0
406
302
249
246
100
205
309
Mother's education
No education
Some primary
Completed primary
Completed lower secondary
Completed higher
14.5
12.9
24.8
28,9
55.0
21.6
48.5
52.5
58.7
42.7
24.0
18.3
13.3
8.0
08
39.4
20.0
9.0
4.4
1.5
0.5
0.2
11.4
0.0
0.0
100,0
100.0
100.0
11)0.0
100.0
125
343
61)1
51 I
Antenatal care visits
None
I-3 visits
4+ visits
Don't know/missing
14.5
25.9
54. I
*
42.8
55.6
42.7
*
21.8
9.3
2.9
*
20.4
9.0
0.2
*
0.5
0.2
0.0
*
I00.1)
100.0
100.0
*
515
t .1125
277
I
secondary+
27.0
50.1
I 1.9
10.9
0.2
100.0
Total
Note: An asterisk indicates that a figure is based on fewer than 25 unweighted cases and has been suppressed.
I If the respondent mentioned more than one provider, only the most qualified provider is considered.
2 Includes doctor's assistant,
96
239
1.818
Women less than 20 years of age are more likely to have received delivery assistance from a trained
nurse or midwife than older women, who are more likely to have been assisted by a doctor. Similarly, first
births are more frequently delivered under a doctor's supervision than higher order births.
Urban w o m e n are much more likely than rural w o m e n to receive the benefit of medical supervision
during delivery; births in urban areas are 4 times more likely to be delivered with the assistance o f a doctor
than births in rural areas. Also, as seen with place o f delivery, more educated women and w o m e n living in
the Southeast region are much more likely to have the advantage o f a medically-supervised delivery.
Supervision o f births by a doctor is positively related to the number o f antenatal care visits. Only
14 percent o f births to w o m e n who had no antenatal care visits were attended by a doctor, in contrast to 26
percent o f births to w o m e n w h o had 1-3 visits and 54 percent of births to women who had 4 or more visits•
Characteristics of D e l i v e r y
Accord n~, to nothers reports, only 3 percent o f babies born in Vietnam are delivered by caesarean
section (Table 8.6). Caesarean sections (C-sections) are less common among very young wornen, w o m e n
•
o
'Fable 8.6 Deliver',, characteristics: Caesarean section, birth ;vciaht and birth size
Among births in the three ','cars preceding the survc.v, the percentage o f deli'~eries by caesarean Scclion. and the percent dis ribution by birth
weight and by mother's estimate o f baby's size al birth, according to background characteristics. Vietnam 1997
Birth v.'cight
Size of child at birth
Delivery
I,css
2.5 kg
Don't
Stnaller
l)on'l
Number
Background
by'
than
or
knot,./
Very
than
Average
know/
of
characterfistic
C-section
2.5 kg
more
Missing
small
average
or larger
Missing
births
Mother's age at birth
<20
1.4
3.7
43.4
52.9
2.4
15.7
81.9
0.0
165
20-34
3.5
4.6
55. I
40.4
1.7
1(I.2
87.5
0.6
1.463
35+
4.9
111.3
41.0
48.6
1.9
I 1.5
86.2
0.4
191
Birth order
I
2-3
4-5
6+
5.4
2.8
1.1
1.7
7.O
3.4
5.1
6.4
62.2
53.7
32.3
27.8
30.7
42.9
62.6
65.8
2.2
1.4
2. I
2. I
14.1
8.4
10.9
9.1
83.3
90.0
g54
gg.0
(1.3
(I.3
1.6
O.g
661
816
248
94
12.2
2.0
3.9
5.3
876
467
85
48.0
1.2
1.9
6.3
1.6
92.2
86.0
03
0.5
261
1.558
3.8
2,5
5.3
4.7
53.2
51.0
41.5
444
1.5
2.5
1.5
94
86:5
87(,
,).'"~
O5
I.-8a*"
535
1.3
32
1.5
1.4
16
I 1.7
4.9
1.0
6.4
4.3
4.2
1.4
74
111.2
23.5
84 7
34 5
42.9
4_.,
~"
7S0
(>76
75.5
8.9
61.2
529
."~'~9
..
146
,_.'~'~1
0.3
:,.6
0.4
4(1
27
0.4
2.0
7.5
I 1.2
13.l
154
1.).~ "~
1(15
g9
92 i
85 3
86 5
789
813
89 I
884
(LO
00
fl 0
1.6
2.8
()1~
0 7
41)6
.~0_ ' I
249
240
1(10
2(15
.(,,"~
Mother's education
No education
:qomc primary.
Completed primary
C,amplctcd I,awer secondary
Completed higher secondary-
2.7
19
2.7
34
79
i07
3.6
44
3.8
20.0
a- I
5(I.6
62.9
8i.7
6C).~
60.3
45.8
"~
.~_7
14.6
4.6
aO
1.4
1) 7
1.4
I79
11 g
8.8
~
1-._
73
767
83.9
89.1
867
91 3
{LX
i.i
(1.7
0.1
0 0
.T-."
a4a
60i
511
23O
Total
.;.4
5 1
52.5
42.4
I 8
10.8
869
0.5
1.8114
[ Residence
Urban
Rural
Project province
No
Yes
Region
Northern Uplands
lied River Della
North Central
(entral Coast
Central 1 lighlands
Southeast
Mckong River Delta
97
with a large number of children, rural women, and those with little or no education. The Southeast region
had an exceptionally high percentage of births delivered by C-section 0 2 percent).
Respondents were also asked for the weight of their child at birth. For a significant number of
children (42 percent), mothers did not know the birth weight. However, for the children for which birth
weight was reported, the birth weight was 2.5 kilograms or more in 9 out of l0 cases. Mothers were also
asked for their own subjective assessment of whether their child was very large, larger than average, average,
smaller than average, or very small in size at birth. While information of this type is subject to considerable
error for individual births, at the population level, the proportion of births that are reported as very small or
small is strongly correlated with the prevalence of low birth weight. The VNDHS-II data indicate that about
13 percent o f births were reported as being very small or smaller than average at birth, and that such births
are associated with low educational level of the mother and residence in the Central Coastal region (Table
8.6).
8.3
Vaccination of Children
The VNDHS-II collected information on vaccination coverage for all surviving children who were
born in the three years preceding the survey. The data presented here are for children age 12-23 months, the
youngest cohort of children who have reached the age by which they should be fully vaccinated. The
Vietnamese Government is closely following the guidelines of the Expanded Program on Immunization set
by the World Health Organization. In order to be considered fully vaccinated, a child should receive the
following vaccinations: one dose of BCG. three doses each of DPT and polio, and one dose of measles
vaccine. I
Information on vaccination coverage was collected in two ways: from children's health cards seen
by the interviewer and from mothers' verbal reports, l f a mother was able to present a health card to the
interviewer, this was used as the source of inforqnation, with the interviewer recording vaccination dates
directly froln the card. In addition to collecting vaccination information from cards, there were two ways
of collecting the information from the mother herself. Even in cases when the mother had a health card, she
was asked if the child had received any vaccinations which were not recorded on the card. If the mother was
not able to provide a card for the child at all. she was asked to recall whether or not the child had received
BCG, polio and DPT (including the number of doses for each), and measles vaccinations. In the VNDHS-II.
mothers were able to provide health cards for only 13 percent of children 12-23 months of age.
Information on vaccination coverage is presented in Table 8.7, according to tile source of
information used to determine coverage, i.e., the child health card or mother's report. Thirteen percent of
children age 12-23 months had a BCG vaccination recorded on their health card. However, not all children
who are vaccinated have cards available since health cards are often retained at the health centers; an
additional 77 percent of children did not have a card but were reported by their mothers to have received the
BCG vaccine. Thus, overall, 90 percent of children age 12-23 months are reported to have been vaccinated
against tuberculosis. Vaccinations are most effective when given at the proper age; according to the health
cards, 87 percent of children received the BCG vaccine by 12 months of age.
BCG, which should be given at birth or first clinical contact, protects against tuberculosis. DPT protects against
diphtheria, pertussis, and tetanus. DPT and polio require three vaccinationsat approximately 6, l0 and 14 weeks of age.
(Since this regime is not always followed, emphasis is placed on getting all three doses by the time the child reaches
the age of 12 months.) Measles should be given at or soon after reaching nine months. It is recommended that children
receive the complete schedule of vaccinations before 12 months of age.
98
Pcrcenuqlc of children 12-23 months who have received speciftc vaccians at my time before the survey, by anuran of infonnmio~ about
vaccinadem, and the peranntaSe vaccinated by 12 moeths o f q F . V'malm 1997
NumP,:, ~,~,,;l~ of children who received: ,d[;m, i w~,
Polio
Mco-
DPT
Source of infomretion
Vaccinated at aay
time
befove the anrvey
Vacciantion card
Mother's ~port
Either source
her of
chil-
BCG
I
2
3+
0
I
2
3+
sits
AlP
None
Total
dren
12.6
76.9
89.5
13.3
78.8
92.1
12.6
74.2
86.9
10A
55.5
65.9
3.0
14.8
17.8
13.1
82.0
95.1
12.6
74.3
86.9
10.5
50.7
61.2
II.0
66.]
77.1
9.3
47.4
56.8
0.0
3.5
3.5
13.3
86.7
100.0
84
547
631
Va¢daated by
87.1
90.7
86.9
65.1
17.8
93.6
86.9
60.4
67.5
50.4
4.9
631
12 moalhs of age
Note: For children whose information was based on mothen" repom, the pmpmtion of vaccinations siren during the first year of life was ansumed
to he the same as for children with a written record of vaccination.
Children who ~ full)' vaccinated (i,e.. those who have received BCG. measles, and three doses each of DPT and polio).
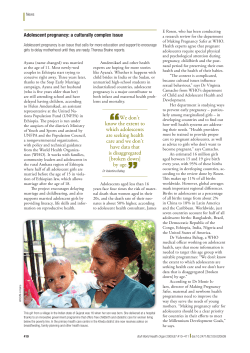
Coverage for the first doses of DPT and polio is slightly higher than for BCO---92 percent and 95
percent, respectively (Figure 8.1). Coverage declines after the first dose, and dropout rates are high. For
polio, coverage falls to 87 percent for the second dose and to 61 percent for the third dose; therefore, onethird of children who star~the po|io series do not complete it. The dropout rate is similar for the DPT series,
which is as expected since polio and DPT are commonly administered together. Seventy-seven percent of
children age 12-23 months were vaccinated against measles.
-Overall, 57 percentof children age 12-23 monthshad all the recommendedvaccinations,50 percent
before their first birthday. Less than 4 percent of children age ]2-23 months had not received any
vaccinations.
Figure 8.1
Vaccination Coverage Among Children Age 12-23 Months,
Vietnam 1997
Pewoent
100
gO
gO r ~ " "
80
70
60
5O
4O
3O
20
10
0
BCG
9S
92
87
77
i
1
2
3+
DPT
1
2
Polio
Nora: Banal ~ ~
Gmttt Inl~rtwi~-I
w l d moChe,~ m p o r l .
99
3+
Measles
All
None
Differentials in Vaccination Coverage
Table 8.8 presents vaccination coverage (according to information from health cards and mothers'
reports) among children age 12-23 months by selected background characteristics. In general, there is little
difference in full immunization coverage by sex of the child or by whether the children lived in a project or
non-project province.
T h e i-host s i g n i f i c a n t d i f f e r e n c e s in t h e p e r c e n t a g e o f c h i l d r e n f u l l y i m m u n i z e d a r e b y r e s i d e n c e .
r e g i o n , a n d m o t h e r ' s e d u c a t i o n . C h i l d r e n in u r b a n a r e a s a r e m u c h m o r e l i k e l y t o b e f u l l y i m m t m i z e d tlla n
rural children (69 versus 54 percent).
C o v e r a g e is h i g h e s t in the R e d R i v e r D e l t a ( 6 9 p e r c e n t ) a n d l o w e s t
in the N o r t h C e n t r a l r e g i o n ( 4 5 p e r c e n t ) .
M a t e r n a l e d u c a t i o n is s t r o n g l y l i n k e d to i m m u n i z a t i o n
s t a t u s : 70
p e r c e n t o f c h i l d r e n w h o s e m o t h e r s h a d c o m p l e t e d h i g h e r s e c o n d a r y s c h o o l are f u l l y v a c c i n a t e d , c o m p a r e d
with only 49 percent of children whose mothers had no education.
1-able 8.8 Vaccinations bv background characteristics
pproCe;: aa;edtli:l~led:~nt,~o; Iv2i;2h3ama(::ihnSa,~o haard~ ;e;,oirVd;dns :orc~:cCkVaCtCtindSc,byrtahceel~;stiecoI' ~;e t~nt;~e/,;9;cording to the vaccination card or the mother's
/
Percentageof childrenwho received:
13ackground
characteristic
BCG
I
DPT
2
Polio
3+
0
I
cel;:;ge bN~:';;"
2
3+
Mcasits
AlP
None
with a
card
ehildren
C h i | d ' s sex
Male
Female
Birth order
I
2-3
4-5
6+
88.0
91.4
90.6
939
85.2
888
63.4
688
17 g
178
94.1)
964
84.2
902
59.0
63.7
76.2
78.2
55.6
58.1
48
2.0
13.4
13.2
340
291
95.7
889
80.1
79.5
95.2
92.7
87.2
79.7
90.0
86.9
82.5
774
70.4
64.1
591
69.5
21) 4
177
97
23.5
96.4
96.0
940
82.3
89.5
863
86.0
774
66.2
59.2
56.3
560
81.4
779
68.1
67.2
629
537
50.9
56.3
2.1
24
6.0
14.8
17.1
12.9
4.9
I4.3
231
270
96
33
96.5
88.2
97.8
9t.0
94.6
85.4
77.5
63.7
37.4
14.0
97.4
94.7
863
87.1
68.2
59.8
85.5
75.5
69.4
54.3
1.7
3.8
25.9
10.9
10I
530
90.8
86.4
93.0
89.8
88.7
82.4
68.5
59.5
210
9.8
96.1
927
883
835
615
60.4
779
75.2
58.9
51.4
3.0
4.7
16.2
6.1
450
181
88.4
93.8
92.3
88.0
77.6
93.0
88.0
95.5
969
93.6
90.1
81).7
94.6
86.6
907
92.9
868
86.1
776
90.9
78.4
664
701
58.7
61.6
65.4
70 1
67.4
7.4
10.3
70
16.2
14.5
51.7
226
064
987
94.7
922
88.1
94.6
955
91.7
949
867
787
78 1
82. I
65.9
729
56.4
59.7
664
42 1
61.0
84.1
921
753
61.3
66.9
84.7
69.2
576
68.6
44.6
45.8
537
62.9
59.3
3.0
I3
2.5
7.0
8.8
2.0
30
5.6
156
1.4
15.6
12.1
150
244
135
07
71
99
32
76
t21
80.0
80(/
90.9
92.0
99.2
78. I
80.2
93.8
94.7
975
662
.78.6
9[.3
876
95.7
60.8
56. I
66.8
68.3
75.3
I 1.2
157
15.3
20.4
25.0
88.2
905
97.0
95.7
98.8
79.2
77.9
90.1
863
968
63.6
51.6
64.7
60 1
668
65.1
62.4
75.0
93 1
486
46.7
53.4
63.3
70.4
94
87
19
2.2
00
4.2
9.8
12.6
16.3
18 5
119
217
173
82
895
92.1
869
65.9
17.8
951
869
61.2
771
568
3.5
13.3
631
Residence
I.)rban
Rural
Project province
No
Yes
Re~ion
Northern Uplands
Red River Delta
North Central
Central Coast
Central Ilighlands
Southeast
Mekong River Delta
88.2
~,lot her's education
No education
Some primar':
Completed primar),
Completed lower secondary
Completed higher secondary+
Total
85.2
Children who arc I~dly vaccinated (i.c. those who have received BCG. measles, and three doses each of DPT and polio).
I00
40
8.4
Childhood Illness and Treatment
Acute Respiratory Infection
Pneumonia, or acute respiratory infection (ARI), is a leading cause of childhood mortality in
developing countries. Early diagnosis of ARl and treatment with antibiotics can prevent a large proportion
of deaths due to pneumonia. Accordingly, health programs in developing countries place emphasis on the
recognition of signs o f ARI so that appropriate medical help can be sought.
The symptoms of ARl for a sick child are a Cough accompanied by short rapid breathing. In the
VNDHS-II, mothers o f children under age three were asked if their child had these symptoms in the two
weeks preceding the survey and if medical treatment was sought. It should be bome in mind that morbidi~
data collected in this manner are subjective (i.e., they are based on the mother's perception of illness and not
validated by medical personnel) and that the prevalence of ARI is subject to seasonality.
Table 8.9 shows that 14 percent of children under three years of age were reported to have symptoms
compatible with ARI at some time in the two weeks preceding the survey. The prevalence of ARI is higher
among male children (17 percent) than female children (I 1 percent). The prevalence of ARI is also higher
among children in rural areas than urban areas. Children living in the Central Coast region are least likely
to show symptoms o f ARI (8 percent) in contrast to children living in the Northern Uplands and the Red
River Delta regions ( 19 and 18 percent, respectively).
Use of a health facility for treatment when a child has symptoms compatible with ARI is high in
Vietnam; more than 2 out of 3 children (69 percent) with symptoms were taken to a health facility. Male
Children are more likely to be treated at a health facility than female children. Children in urban areas and
children in the Red River Delta are most likely to be taken to a health facility for treatment. Children o f
more educated mothers are also more likely to receive treatment in a facility than children of less educated
women.
Fever
A major manifestation of acute infection in children is fever. In the VNDHS-II, mothers were asked
whether their children under age three had a fever in the two weeks preceding the survey. Table 8.9 shows
that 21 percent of children were reported to have had fever in the last two weeks. Prevalence of fever peaks
at 26 percent among children age 6-23 months. Differentials by sex, urban-rural residence, project province
status, and education are either negligible or show no clear pattern. However, there is significant variation
in the prevalence o f fever among regions. Fever is most prevalent in the Red River Delta and Northern
Uplands regions (nearly 30 percent in each) and much less prevalent in the North Central and Southeast
regions (less than 15 percent in each).
Diarrhea
Dehydration caused by severe diarrhea is a major cause of morbidity and mortality a m o n g young
children. A simple and effective response to dehydration is a prompt increase in fluid intake, that is, oral
rehydration therapy (ORT). Rehydration therapy may include the use of a solution prepared from packets
of oral rehydration salts (ORS) or recommended home fluids (RHF) such as sugar-salt-water solution.
In Vietnam, the Ministry of Health utilizes both preventive as well as curative strategies to minimize
the effect of diarrhea on child health. The Ministry emphasizes health education programs to reduce the
incidence of diarrhea among children, and promotes the use of oral rehydration therapy mostly through ORS.
101
"Fable 8.9 Prevalence and treatment of acute respiratory in~ction and prevalence of t~'ver
Percentage of children under three years who were ill with a cough accompanied by rapid breathing during the two weeks preceding the
survey, and the percentage of ill children who were taken to a health facility, and the percentage of children with fever, by background
characteristics. Viemam 1997
Among children with
ARI symptoms.
percentage taken to a
Percentage of
Percentage of children
health t~eility or
children
Nuraber
with cough accompanied
provider
with l~ver
of children
by rapid breathing (ARI)
Background characteristic
Child's age
< 6 months
6- I 1 months
12-23 months
24-35 months
8.9
11.8
17. I
14.3
*
(55.8)
74,6
67.4
14.8
26.4
25.7
16.5
240
289
63 I
609
16,9
l 1.3
71.6
64.5
22. I
20. I
913
856
I
2-3
4-5
15,9
12,5
17,1
72.9
64.6
72.3
6+
7.9
*
22.8
20.0
24.2
t 1.4
639
80 I
241
88
I 1,0
14,7
(76.3)
67.9
20.6
21.2
255
1,513
14.0
14.6
60.5
67.3
20.3
23.3
1,249
19. I
18.3
I 0.8
8.3
I 1.0
10.3
14.7
53.2
82.8
(go. l )
*
*
(66.4)
27.3
29.7
13.7
15.9
19.2
14.7
19.9
387
29g
242
243
94
203
302
60.4
71.0
76.3
(86.7)
16.4
23.2
20. I
23.3
18.5
118
335
58 I
500
235
Child's sex
Male
Female
Birth order
Residence
Urban
Rural
Project province
No
Yes
520
Region
Northern Uplands
Red River Delta
North Central
Central Coast
Central Highlands
Southeast
Mekong River Delta
Mother's education
No education
Some primao
Completed primary
Completed lower secondary
Completed higher secondary+
10.8
18.4
12.6
15.4
108
Total
14.2
6g.9
21.I
1,769
Note: Figures h~ parentheses ~.r¢based oH 25-49 unweighted cases: an asterisk i~dicates that a |~gure is based on lewer than 25
unwei~hted eases and has been suppressed.
In the V N D H S - I I , w o m e n w h o had a birth in t h e t h r e e y e a r s p r e c e d i n g t h e s u r v e y w e r e a s k e d about
t h e i r k n o w l e d g e o f O R S and t r e a t m e n t o f d i a r r h e a in g e n e r a l . F o r all c h i l d r e n tinder t h r e e y e a r s w h o
e x p e r i e n c e d a bout o f d i a r r h e a in the last two w e e k s , m o t h e r s w e r e a s k e d w h e t h e r t h e r e w a s b l o o d in the
stools, w h e t h e r fltfid intake w a s increased or d e c r e a s e d , w h e t h e r the child w a s g i v e n O R S , and w h a t e l s e w a s
g i v e n to t r e a t the c h i l d ' s d i a r r h e a . S i n c e the i n c i d e n c e o f d i a r r h e a in V i e t n a m is s e a s o n a l , c a r e s h o u l d be
t a k e n in t h e i n t e r p r e t a t i o n o f the data.
T a b l e 8 . 1 0 p r e s e n t s d a t a oll the p r e v a l e n c e o f d i a r r h e a in c h i l d r e n u n d e r t h r e e y e a r s o f a g e . T e n
p e r c e n t o f c h i l d r e n had e x p e r i e n c e d d i a r r h e a at s o m e t i m e in the t w o w e e k s p r e c e d i n g the s u r v e y ; less than
I p e r c e n t o f c h i l d r e n had e x p e r i e n c e d b l o o d y d i a r r h e a w h i c h can be an i n d i c a t i o n o f d y s e n t e r y . D i a r r h e a
p r e v a l e n c e i n c r e a s e s witll a g e to p e a k at a g e 6-11 m o n t l l s (I"7 p e r c e n t ) then f a l l s at o l d e r a g e s . A s i m i l a r
102
pattern is observed for bloody diarrhea.
Diarrhea and bloody diarrhea are more prevalent among male children and children living jn rural
areas. They are least prevalent in the Southeast region (4 percent) and more prevalent in other regions
especially in the Northern Uplands, North Central, Central Coastal, and Mekong River Delta regions (! 1 to
12 percent in each). The relationship between maternal education and diarrheal prevalence in children is
marked, especially with regard to bloody diarrhea. It ranges from nil among children o f women who have
completed higher secondary education to about 3 percent a m o n g women with little or no education.
Table 8.10 Prevalence of diarrhea
Percentage of children under three years of age with diarrhea and diarrhea with
blood during the two weeks preceding the survey, by background characteristics.
Vietnam 1997
Diarrhea in the
preceding two weeks
Diarrhea
Number of
Background characteristic
All diarrhea
with b l o o d
children 1
Child's age
< 6 months
8.1
0.7
240
6-11 months
16.8
1.9
289
12-23 months
I 1.4
1.3
63 I
24-35 months
6.2
0.I
609
Child's sex
Male
Female
11.7
8.4
1.2
0.6
913
856
Birth order
1
2-3
4-5
6+
10.1
10.3
10.9
5.8
0.5
1.3
1.2
0.0
639
g0t
241
88
Residence
Urban
Rural
5.8
10.8
0.7
1.0
255
1.513
Project province
No
Yes
10.4
9.3
1.0
0.8
1.249
520
Region
Northern Uplands
Red River Delta
North Central
Central Coast
Central Highlands
Southeast
Mekong River Delta
I 1.6
9.6
10.6
11.2
8. I
4. I
I 1.8
0.4
0.0
0.3
2.0
0.0
0.9
2.6
387
298
242
243
94
203
302
Mother's education
No education
Some primary
Completed primary
Completed lower secondary
Completed higher secondary+
13.7
13.0
8.4
10.3
7.7
2.5
2.4
0.6
0.3
0.0
I 18
335
58 I
500
235
Total
I0.1
I Includes diarrhea in the past 24 hours.
0.9
1,769
103
General knowledge of ORS is far from universal among mothers in Vietnam (Table 8.11 ). Only one
in two mothers who gave birth in the last three years knows about ORS (52 percent). Regarding specific
eating and drinking regimes for sick children, the findings are not encouraging. Nineteen percent of recent
mothers reported that a child should get less to drink. However, 61 percent correctly said that the child
should receive more to drink.
Differentials concerning mothers' knowledge of appropriate feeding patterns during a diarrhea
episode indicate that the percentage who report that a child should receive greater amounts of liquids is
smaller among younger mothers, those living in rural areas and in project provinces, and among women wit!l
less education. Additionally, the Northern Uplands stands out as an area where rather few mothers know that
children with diarrhea with should be given more liquids than usual.
Table 8.12 presents data on the types of treatment received by children with diarrhea in the two
weeks preceding the survey. The VNDHS-II indicates that one out of two children with diarrhea (50 percent)
were taken to a health facility or health provider for treatment.
Forty percent of children with diarrhea were given a solution prepared from an ORS packet, wbile
21 percent were treated with recommended home fluids (RHF). Only 54 percent of children with diarrhea
were given more to drink than before the diarrhea. Overall, 28 percent of children received neither oral
rehydration therapy (ORS or RHF) nor increased fluids. One in three children with diarrhea was given
antibiotics, and 18 percent were provided some sort of home-based traditional remedies.
Because of the relatively few cases ofdiahrrea in the two weeks preceding the survey for population
subgroups, little can be confidently stated about treatment differentials by background characteristics.
104
Table 8. I I Knowledge of diarrhea care
Pcrcenlage of','¢onlen "~',itb births in the three years preceding (be survey who knoll' about lbe use o f oral rebydratiou sails (ORS) tbr treatment of diarrhea, and the percent
distribution by opinion on appropriate fecding practices during diarrhea, according to background characteristics. Vietnam 1997
Quantities that should be ~iven during diarrhea
Liquids
Solid foods
K110'~ ~.
Don't
Don't ""
Number
about ORS
know/
know/
of
packels
Less
Same
More
Missing
Less
Same
More
Missing
women
Background eharaelerislic
Age
15-19
20-24
25-29
30-34
35+
29.7
47.2
56.8
57.9
5h I
20.4
20. I
20.2
19.0
15.9
18.9
14.6
16.5
14.8
16.4
49.5
58.8
60.8
62.1
66.2
I 1.2
6.5
2.5
4.0
1.5
65.0
51.5
59.2
56.1
.61.3
18.7
34.0
29.8
33.9
32.5
5.2
8.3
8.4
5.7
4.4
I 1.2
6.3
2.6
4.3
1.9
58
495
506
361
240
71.1
49.2
8.1
21.2
12.9
16. I
77.8
58.0
1.2
4.7
51.3
57.7
37.1
3 I.I
i0.7
6.4
0.9
4.8
245
1.416
53.2
50.4
16.3
26.4
15.3
16.4
64.9
51.4
3.5
5.8
56.6
56.9
32.0
31.8
7.4
6.2
3.9
5.0
1,165
496
40.2
69.2
612
31.5
24.9
57.3
64.9
35.0
25.8
28.9
7.4
14.9
5.0
5.2
21.8
9.0
16.8
14.1
20.5
I0.1
16.8
39.1
61.7
53.2
75,0
53.4
83.1
70.5
4. I
3.5
I.I
3.5
1.3
1.8
7.5
54.2
63.5
51.1
68.8
48.6
59.7
48.7
37.2
22.8
42.9
21.0
35. I
26.0
37.1
5.0
10.2
4.7
6.3
6.0
12.5
6.0
3.6
3.5
1.4
3.9
I 0.2
1.8
8.2
360
287
231
223
85
187
288
Mother's education
No education
Some primary
Completed primary
Completed lower secondary
Completed higher secondary+
22.8
33.3
47.1
64.8
79.5
16.9
22.0
18.3
21.2
15.0
26.4
17.4
16.8
15.1
6.5
46.5
55.9
60.1
60.4
77.7
10.2
4.7
4.9
3.3
0.8
53.0
62.0
57.3
54.5
54.5
32.3
27.4
32.8
34.2
31.3
4.4
5.2
5.3
8.3
12.5
10.3
5.4
4.6
3.0
1.7
106
313
544
471
227
Total
52.4
19.3
15.6
60.9
4.2
56.7
31.9
7.1
4.3
1.661
Residence
Urban
Rural
O
Project province
No
Yes
•
Region
Northern Uplands
Red River Delta
North Central
Central Coast
Cenlml High)ands
Southeast
Mekong River Delta
[able 8.12 frealmcnt of diarrhea
Among childlcn under three ,.ears v.ho had diarrhea in Ih¢ t;',o ;',ceks preceding the surve), the percentage taken for treatment Io a heahh facilit_vor provider, the percentage who received
oral rehx dralion therapy (ORTI. Ihc percentage ;'din did not receive ORT. and the percentage gi',ca olhcr treatments, according to backgrotmd characteristics. Vietnam 1997
Pc/centare
Background
characteristic
ChUd's age
< 6 nlOlllhs
6-11 months
12-23 months
taken
to a heahh
facility or
provider
Oral relD'dration therapy (ORI)
ORS
Either
packet
RIIF
ORS or RIIF
Increased
fhfids
Neither
ORT nor
increased
fluids
Olher trcatmenl
Antibiotics
Inieetion
llome
remedy/
Other
No
treatment
Nurnber
of
children
*
(436}
412
*
129.8"1
46.5
*
115.91
19.3
*
143.8,1
54.8
*
157.0"1
54.5
*
127.8,1
31.2
*
126.01
27.3
*
14.1,1
6.5
*
119,21
I 8. I
*
118.31
14.6
19
48
72
176. I )
(44.4)
(36.9)
(58. I)
(51.5)
( 19. I )
(53.4)
(0.0)
( [ I.I )
(9,9)
3g
Child's sex
Male
Female
54 5
443
41 4
37.1
26. I
13.6
54.6
45.3
49.2
62.0
29.0
26.2
33.8
32.7
2.6
5.4
20.2
13.6
15.3
14.9
106
72
Birth order
I
2-3
4-5
6+
62.1
41.0
(54.5)
*
43.9
32.8
152,5}
*
18.0
27.0
113.9,1
*
55.3
48.0
152.5,1
*
53.1
63.3
(37.31
*
26.4
21.8
145.11
*
39.0
27.3
139.3,1
*
4.1
0.9
112.61
*
15.1
20.1
119.21
*
12.8
13.1
122.1,1
*
64
82
26
5
510
48.9
39.2
4 I. I
24,6
I 1.6
51.5
49. I
52.9
58. I
26.2
32.3
33.4
33.2
3.2
5. I
17.6
17.5
13.2
20.3
129
,:19
24-35 lllOlllhs
Project province
No
Yes
Total
50.4
39.7
21.0
50.8
54.3
27.9
33.3
.,
3.8
17.6
15.1
Figures in plaemhcses arc based oil 25-49 un',~cighted cases: aa asterisk indicates that it ligurc is hased on fewer than 25 tin',; cighled cases and has been suppressed.
ORS = Oral rehydlatio, salts
RIIF - ReColnlllended holne I]tli(ls
178


© Copyright 2026