
Traffic Flow and Road User Impacts of the Collapse of the I
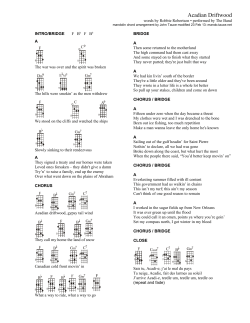
Traffic Flow and Road User Impacts of the Collapse of the I-35W Bridge over the Mississippi River Task 2: Travel Behavior Survey and GPS Data Collection Shanjiang Zhu ∗ David Levinson † Xiaozheng He Henry Liu Saif Jabari Kathleen Harder May 31, 2009 ∗ Ph.D. candidate, University of Minnesota, Department of Civil Engineering, [email protected] RP Braun-CTS Chair of Transportation Engineering; Director of Network, Economics, and Urban Systems Research Group; University of Minnesota, Department of Civil Engineering, 500 Pillsbury Drive SE, Minneapolis, MN 55455 USA, [email protected] http://nexus.umn.edu † 1 Abstract Task 2: Travel Behavior Survey and GPS Data Collection The data collection phase will contain the bulk of the project work. During this task, three types of data collection efforts will be administered: 1) Collection of GPS tracking data, report generation and associated user surveys, 2) Collection of paper and internet-based survey data gauging travel behavior in the post-bridge reconstruction phase, and 3) Collection of other aggregate data relating to freeway and arterial traffic flows, traffic control, transit ridership and business impacts. The survey instruments involved in this task must be distributed in a timely manner, so as to capture the travel choices made during the appropriate frame of reference (e.g. before vs. after bridge reconstruction). Deliverable: Short Report, describing data collection procedures and relation to overall research methodology. Presentations submitted at key points in project development to discuss the travel behavior survey and preliminary findings from the survey and GPS data collection efforts; Periodic Updates to the Administrative and Technical Liaisons, mad in order to track project status and answer any questions that arise in the course of project development. 2 Contents 1 Introduction 2 GPS-based Study 2.1 Data collection . . . . . . . . 2.2 Characteristics of participants . 2.3 GPS data processing . . . . . 2.4 Speed map . . . . . . . . . . . 4 . . . . . . . . . . . . . . . . . . . . . . . . . . . . . . . . . . . . . . . . . . . . . . . . . . . . . . . . . . . . . . . . . . . . . . . . . . . . . . . . . . . . . . . . . . . . . . . . . . . . . . . . . . . . . . . . 5 5 7 7 8 3 Paper and web-based surveys 8 4 Traffic data 10 5 Conclusions 10 References 11 List of Tables 1 Daily trips on all bridge crossing the Mississippi River . . . . . . . . . . . . . . . 12 List of Figures 1 2 3 4 5 6 Home and work locations of subjects . . . . . . . . . . . . . . . . . . Example of one commute trip . . . . . . . . . . . . . . . . . . . . . . . Number of speed observations . . . . . . . . . . . . . . . . . . . . . . Comparison of travel speed before and after the I-35W Bridge reopened Daily trips on the I-35W Mississippi River Bridge . . . . . . . . . . . . RMSE of Traffic Data . . . . . . . . . . . . . . . . . . . . . . . . . . . 3 . . . . . . . . . . . . . . . . . . . . . . . . . . . . . . . . . . . . 13 14 14 15 15 16 1 Introduction The collapse, on August 1, 2007, of the I-35W bridge over the Mississippi River in Minneapolis, abruptly interrupted the usual route of about 140,000 daily vehicle trips and substantially disturbed the traffic flow pattern on the network. It took several weeks for the network to re-equilibrate, during which period, travelers continued to learn and adjust their travel decisions. This natural experiment provides a unique opportunity to observe the response of transportation systems to major disruptions that affect their operation. Therefore, the objective of this study is to understand how travelers’ behavior and the performance of transportation networks have evolved in response to a major disruption. This includes understanding how travelers’ choices (e.g. route, mode, destination, departure time, decision to telecommute) were exercised during the bridge closure and again after the reopening, and also how flows on the transportation network evolved (or did not) toward equilibrium. In response to the initial collapse of the I-35W bridge, a small-scale survey was conducted in September and October 2007 to identify immediate changes in travel patterns by frequent users of the I-35W bridge. Mail-in survey forms, together with pre-paid envelopes, were handed to drivers and transit users near major parking garages in Downtown Minneapolis and the University of Minnesota. Traffic counts and speed information on the freeway network before and after the bridge collapse were collected by a loop-detector traffic monitoring system and documented by Minnesota Department of Transportation (MnDOT). Data collected from different resources were geo-coded, merged, and analyzed on the Twin Cities planning network provided by Metropolitan Council. It took six weeks for the traffic pattern to re-stabilize. Despite the heavy losses in life and injury, as well as the psychological shock, the collapse of I-35W bridge did not disastrously disrupt the overall traffic of Twin Cities network as initially predicted by the mass media. The total travel demand did not change significantly as a result of the bridge collapse. Increases in public transit ridership after the bridge collapse was small but detectable. Travelers exhibited great flexibility in dealing with the changed traffic pattern, although some encountered more inconvenience than others. Evidence from both traffic observations and survey results clearly indicated that changing routes and changing journey departure time are the most common responses to the bridge collapse. Findings and more detailed description of this study have been summarized in Zhu et al. (2009). Similar to many previous studies (Giuliano and Golob, 1998; Gordon et al., 1998; Hunt et al., 2002) , the lack of individual level panel data has prevented us from further advancing our understanding of how travelers react to such disruptive events, which are crucial for evaluating the impacts of future events and developing mitigating measures. Analysis of such panel data could also provide insights for a more fundamental question of how travelers make trip choices. However, obtaining such data set is very difficult because disruptive events are mostly unpredictable. 4 The opening of the new I-35W Mississippi River Bridge on September 18th 2008 caused another, but this time predicted, major disturbance to the traffic flow pattern, providing a unique opportunity to collect the needed data. A comprehensive data collection scheme was designed and implemented before the bridge reopened. Data collection efforts in this study are three-fold: 1. Global Positioning System (GPS) devices were instrumented in commuters’ vehicles to track travel time and routes. Participants in this study were also required to complete a series of surveys through the study period, providing information to supplement the GPS-based study. 2. Extending the paper-based survey which targeted the post-bridge collapse conditions, a second round of the survey was distributed following the reopening of the bridge, in order to compare travel choices in each context. 3. As a companion effort, an internet-based version of the same survey was also conducted during the same time period. 4. Aggregate data relating to freeway and arterial traffic flows were also collected to evaluate the traffic flow pattern. These data collections efforts are described in details in the following sections. 2 GPS-based Study 2.1 Data collection The objective of this GPS-based study is to capture commuters’ travel behavior through longitudinal observations of travel choices participants made during the time periods both before and after the new I-35W Bridge reopens. The target population of this study was commuters in the Twin Cities area who satisfy the following criteria: 1. are of an age between 25-65, 2. are legal driver, 3. have a full-time job and follow a ”common” work schedule 4. commute by driving alone 5. are likely to be affected by the reopening of the new I-35W Mississippi River bridge. 5 We are mostly interested in those commuters who previously used the I-35W Bridge and are likely to use it again after the new bridge reopens. Recruiting announcements were posted to different media, including Craig’s List and City Pages online, paper version of City Pages, flyers at grocery stores, flyers at city libraries, postcards handed out in downtown parking ramps, and emails to more than 7000 University of Minnesota staff (students and faculty were excluded). People interested in our study were required to complete an on-line survey form, providing background information about demographics, driving habits, job and residential locations, commute routes before and after I-35W bridge collapse, and willingness to comply with instructions in this study. More than 1000 subjects responded to our on-line survey and subjects were randomly selected among those who satisfied the criteria previously listed. The list of selected subjects was then provided to Professor Randall Guensler at the Georgia Institute of Technology and the subcontractor Vehicle Monitoring Technologies (VMTINC), who oversaw the field study. GPS devices were installed in the vehicles of subjects in this study two weeks before the new I-35W bridge reopened by a local sub-subcontractor (MachONE), which specializes in in-vehicle installation of electronic devices. The GPS device recorded the position of the instrumented vehicle at every second after the engine was ignited. The position log collected by the GPS was transmitted to the server in real time through wireless communication systems and documented at the server. The system stops working when the engine is off. The system is not intrusive and should not have influenced subjects’ driving behavior in any way aside from the trips to install and remove the device. The whole study lasted 13 weeks, during which time period subjects followed their usual commute pattern and no instruction was given, though periodic surveys were taken. A series of internet-based survey were conducted to complement the GPS tracking data. The GPS data had been processed and displayed on a survey website at the end of each day during the study period. If a subject deviated from the usual commute route, a questionnaire would be sent to the subject through email to ask for reasons for route changes. The subjects could also check the routes they had followed through the web link provided in the same email in case they had forgotten their choices. Once a week, subjects were required to fill in a travel diary prompted by on-screen maps and guidance, following in many ways the protocol and software originally developed for the Commute Atlanta study (Ogle et al., 2005). This information provided information for trip purposes, which could not be obtained directly through GPS data (though could be inferred by matching stop locations with land use maps). A one-time survey was conducted the day before the new I-35W bridge reopened, asking subjects questions about their prediction about the congestion level of the new bridge, planned route choices after it reopened, and motivations for such choices. Answers to this survey could help us understand factors travelers considered in route decisions. At the end of the study period, all subjects completed a more comprehensive survey to evaluate the driving experience on routes using 6 different bridges, provide demographic and social economic information, and also answer some hypothetical choice questions. 2.2 Characteristics of participants In total 43 subjects, 28 female and 15 male, participated in this study. Their home and work locations are displayed in Figure 1. According to the filtering survey before the study, 88.4% claimed they used the I-35W bridge as usual commute route before its collapse and 70% claimed that they planned to use the new I-35W bridge after its reopening. However, all of them should cross the Mississippi River for commuting according to their home and work locations, and thus are likely to be affected by the reopening of new I-35W bridge even if they do not plan to use it. 2.3 GPS data processing The raw data generated by GPS devices are a list of codes, each of which contains information of one point on the trajectory of vehicles. The information available includes the record ID, latitude and longitude coordinates, date and time, and the instant speed. Ideally, movement of vehicles should be accurately captured by the GPS. However, it takes the GPS devices some time to initial after the engine is on, during which time period the records are not accurate. These points should be excluded from the data set before further analysis. Also, original data include some long-distance travel (e.g. out-of-town trips during holidays) which could confound our analysis. These trips should also be excluded. Also, the GPS points must be merged with GIS map in order to construct the actual routes followed by subjects and allow more sophisticated network analysis. The TLG network, which is generated and maintained by Metropolitan Council and the Lawrence Group, is used in this study. It covers the entire 7-county Twin Cities Metropolitan Area and is most accurate GIS map to date. The original TLG network contains both two-directional and onedirectional links. In order to be consistent with geo-coding conventions of planning network, all two-directional links are converted into two links in both directions. The modified TLG network contains 290231 links, providing an accurate description of the entire Twin Cities network to the street level. A 20-meter buffer was generated for all roads, which is then used to clip the GPS records. All points that are located outside of Twin Cities area as well as off-road points are excluded. The remaining points then regrouped into trips, each of which contains all points between one engine-on and engine-off events for one specific subject. Combining information from the GPS records and the GIS map, we could identify all trips each subject has made during the study period, and the characteristics of each trip, including the starting time, the ending time, the route followed, and travel speed on each link segment along the route. Figure 2 shows one example of commute trips. 7 2.4 Speed map One research question regarding the bridge reopening is how congestion level and travel speed evolves after the new I-35W bridge reopens. The network speed information is also crucial for evaluating individual route decisions because it helps to identify potential alternative routes. Because GPS can accurately capture the travel speed, subjects in this study could serve as probing vehicles. Link travel speed was sampled on all the links subjects drove on. Speed samples were then pooled and speed maps was developed for the Twin Cities network for time periods both before and after the I-35W Bridge reopens. Figure 3 shows the number of speed observations obtained on each link. We obtained a very high sampling rate on the freeway system. More importantly, the number of observations are fairly high on many arterial roads, especially trunk highways and downtown streets. Complete speed information on arterial network, which is not available in previous studies, exhibits a major advantage of this study. Figure 4 compares the estimated speed before and after the I-35W bridge reopens. Only links with more than 5 observations during the periods both before and after the bridge reopens are included here. According to the map, speed on I-94, TH280, and non-freeway bridges crossing the Mississippi River improved after the I-35W Bridge had reopened. However, the speed on the I-35W deteriorated, showing that commuters who use the I-35W but do not cross the Mississippi River were worse off as a result of the bridge reopening. In subsequent analysis the GPS data collected as part of this study will be pulled with GPS data collected as part of parallel studies conducted at the University of Minnesota on the Value of Reliability to generate a more comprehensive system-wide speed map. 3 Paper and web-based surveys Extending the paper-based survey which targeted the post-bridge collapse conditions, a similar mail-in survey has been conducted. Questions in the survey were separated into three parts: 1. travel choices of the morning commute; 2. self-evaluation of the impacts from the bridge collapse and the bridge reopening; and 3. demographic information. In the first part, respondents need to answer questions associated with their morning commute in five different time periods. These periods are: 1. before the bridge collapse, 8 2. before the bridge reopening, 3. on the day of the bridge reopening, 4. weeks following the bridge reopening, and 5. on the day he/she filled out the survey. Travelers’ trip-making characteristics are revealed by comparing their travel behaviors before and after network topology changes. Traveler’s morning commute choices asked in this part include departure time, arrival time, travel mode, route choice, route familiarity, and motivation for changes. The survey provided five maps, with respect to five time periods, on which participants were asked to draw their morning commute routes. In the second part, participants were asked on the impact of their morning commutes by the bridge collapse and reopening, such as whether participants had to cancel trips or avoid certain destinations. Participants were also asked to provide the information sources of the bridge reopening. Finally, respondents were asked to answer questions related to their demographic backgrounds, which include gender, work schedule flexibility, residential and work locations, household size, number of children, age, and annual household income. The attached questionnaire shows details of the questions asked in the survey. In total, 840 survey forms were handed out in Downtown Minneapolis and the University of Minnesota on October 30th, 2008, six weeks after the bridge reopened. 137 respondents were received. The answers are then digitized and documented for further analysis. Questions similar to the paper-based survey were incorporated in the survey website, which is hosted on a personal computer stationed in the Minnesota Traffic Observatory at the University of Minnesota. 5,000 people are randomly selected around the seven-county Twin Cities area from a mailing-list purchased from a survey company and a cover letter, which described the purpose of the survey, the website link, and the incentives involved, was sent out to invite people to visit the website and participate in the survey. To encourage people, it was determined that the first 500 participants would receive a $5.00 coffee card from one of three coffee shops of their choosing (Starbucks, Dunn Brothers, or Caribou Coffee). Additionally, two participants of all survey takers would be selected from a drawing for either a Nintendo Wii or a $250 gift card from a store of their choosing (Best Buy, Wal-Mart, Target, etc.). The cover letters were mailed on Monday, November 24, 2008 and the survey was kept online between November 24, 2008 and January 15, 2009. Approximately 350 individuals responded to the survey. An example of the survey form is included in the appendix. 9 4 Traffic data Traffic data have also been collected to complement individual data. Traffic counts and speed estimates for each 15-minute time period are documented by MnDOT. Arterial traffic counts are provided by the City of Minneapolis. Table 1 summarizes the number of crossing river trips before and after the I-35W bridge reopens. The usage of arterial bridges reduced significantly as a result of I-35W Bridge reopening while the overall crossing river demand increased 3.1%. The change in overall crossing river demand is smaller compared to that has been observed after the bridge collapse. Figure 5 summarized the daily trips on the new I-35W Mississippi River Bridge. A one-time jump in bridge usage was observed during the first week and no oscillation has followed. The Root Mean Square Error measure developed based on daily traffic counts at 34 loop detector stations at the vicinity of the I-35W Bridge also suggested that the traffic flow stabilized one week after the bridge reopening. 5 Conclusions Three different data collections efforts have been designed and implemented before and after the reopening of the new I-35W Bridge. Both the aggregate and individual travel data were collected and documented for further analysis. GPS tracking data provided not only the detail information for all trips made by each subject, but also speed information on links they passed on. The speed map developed based such information covers both freeways and arterials with fairly high sampling rate. Speed estimates on arterials roads allow researchers to compare network performance and construct alternative routes for network analysis based on real observations instead of assignment results. Accuracy provided by approaches in this study exhibited significant advantage compared to previous studies. 10 References Giuliano, G. and Golob, J. (1998), “Impacts of the northridge earthquake on transit and highway use”, Journal of Transportation and Statistics , Vol. 1, pp. 1–20. Gordon, P., Richardson, H. and Davis, B. (1998), “Transport-related impacts of the Northridge earthquake”, Journal of Transportation and Statistics , Vol. 1, pp. 21–36. Hunt, J., Brownlee, A. and Stefan, K. (2002), “Responses to Centre Street Bridge Closure: Where the” Disappearing” Travelers Went”, Transportation Research Record: Journal of the Transportation Research Board , Vol. 1807, Trans Res Board, pp. 51–58. Ogle, J., Guensler, R. and Elango, V. (2005), “Georgia’s Commute Atlanta Value Pricing Program: Recruitment Methods and Travel Diary Response Rates”, Transportation Research Record: Journal of the Transportation Research Board , Vol. 1931, Trans Res Board, pp. 28–37. Zhu, S., Levinson, D., Liu, H. and Harder, K. (2009), The traffic and behavioral effects of the I-35W Mississippi River bridge collapse, in ‘88th Annual Meeting of Transportation Research Board, Washington D.C., 2009’. 11 12 Bridge Camdon Str Broad Str Lowry Str Plymouth Str Hennepin Ave 3rd Ave 10th Street Washington Str Franklin Ave Ford Bridge I-694 I-94 I-35E TH-55 I-35W Arterial total Freeway total Total Before 8748 20931 16296 11226 33559 31303 27356 20713 9800 18354 160426 155771 87251 28826 140000 152311 572274 724585 Bridge Collapse After Increase Percentage N/A N/A N/A 13842 2616 23.30% 45936 12377 36.90% 39423 8120 25.90% 33937 6581 24.10% 31941 11228 54.20% 13061 3261 33.30% 19426 1072 5.80% 168645 8219 5.10% 196829 41058 26.40% 88032 781 0.90% 27534 -1292 -4.50% 0 -140000 -100.00% 197566 45255 29.70% 481040 -91234 -15.90% 678606 -45979 -6.30% BeforeReopen N/A N/A N/A 13842 35799 38746 39242 31941 10413 N/A 164910 172629 96955.5 54223 0 169983 488717.5 658700.5 Bridge Reopen AfterReopen Change Percentage N/A N/A N/A 10738 -3104 -22.40% 34004 -1795 -5.00% 15067 -23679 -61.10% 9878 -29364 -74.80% 16134 -15807 -49.50% 10074 -339 -3.30% N/A N/A N/A 160177.5 -4732.5 -2.90% 153917 -18712 -10.80% 96160 -795.5 -0.80% 52523.5 -1699.5 -3.10% 120349.5 120349.5 95895 -74088 -43.60% 583127.5 94410 19.30% 679022.5 20322 3.10% Table 1: Daily trips on all bridge crossing the Mississippi River before and after the bridge collapse as well as bridge reopening Home and Work Locations of Subjects in the I-35W Bridge Study Home location Work location Highway 0 2 4 8 12 Streets 16 Kilometers Figure 1: Home and work locations of subjects participating in the I-35W Bridge study 13 Figure 2: Example of one commute trip (Sep 18 Thursday 06:30:58AM to 06:43:52AM) Number of Observations on Each Link from VMT Data No. of Observations 15 - 50 51 - 100 101 - 250 251 - 500 501 - 1000 1001 - 2500 2501 - 7088 No. of Obs <15 0 2.5 5 10 15 20 Kilometers Figure 3: Number of speed observations on each link during the study period 14 Changes in Estimated Speed after Bridge Reopened Changes in Speed (After bridge reopens Before bridge reopens) -50 - -20 -19 - -15 -14 - -10 -9 - -5 -4 - 0 1-5 6 - 10 11 - 15 16 - 20 21 - 41 0 0.5 1 2 3 <5 sample 4 Kilometers Figure 4: Comparison of travel speed before and after the I-35W Bridge reopened Daily Trip on I-35W Mississippi River Bridge 180000 160000 140000 120000 100000 2008 80000 2006 60000 40000 20000 5 /1 12 12 /8 12 /1 17 24 11 / 11 / 3 10 11 / 7 /2 0 11 / 10 3 /2 /1 10 10 29 10 /6 22 9/ 8 15 9/ 9/ 9/ 9/ 1 0 Figure 5: Daily trips on the I-35W Mississippi River Bridge 15 RMSE 0.25 July 4th State Fair Labor Day Start of School Thanksgiving 0.2 2006 0.15 2007 Bridge Reopen 0.1 0.05 Ju nW ee k2 Ju nW ee k4 Ju lW ee k2 Ju lW ee k4 Au gW ee k2 Au gW ee k4 Se pW ee k2 Se pW ee k4 O ct W ee k2 O ct W ee k4 N ov W ee k2 N ov W ee k4 0 Figure 6: RMSE of Traffic Data 16 2008 Appendix A: Filtering survey for subject recruitment Questions about your background, transportation choices and preferences Do you currently have a valid Minnesota driver's license? No Yes Are you between 25 to 65 years of age? No Yes What is your gender? Female Male How many years have you lived in the Twin Cities area? Years Are you currently employed? No Yes If you are currently employed, what is your main work location? Address City State Zip On average, how many hours per week do you work at your main job? Hours On average, how many days per week do you work at your main job? Days How often do you work at home RATHER THAN at your usual workplace? Almost everyday Several times a week Once a week Several times a month Once a month Once or twice a year Never How often do you work at home IN ADDITION TO your usual workplace? Almost everyday Several times a week Once a week Several times a month Once a month Once or twice a year Never Where do you reside? Address City State Zip How many vehicles are there in your household? 0 1 2 3 More than 3 How many licensed drivers are there in your household? 0 1 2 3 More than 3 Approximately how many miles did you put on your primary vehicle last year? Miles Which of the following technologies do you own? (Check all that apply) Desktop computer Laptop computer High speed Internet (e.g. DSL, cable modem) or Dial-up Internet Wireless Internet access Mobile phone Personal Digital Assistant (e.g. Palm, Pocket PC) GPS (Global Positioning System) In-vechicle navigation system Do you have an I-394 MnPASS transponder in your car? No Yes Which mode of transportation do you use most often to get to work? Drive alone (Automobile, Light truck, etc.) Carpool/Vanpool driver Carpool/Vanpool passenger Bus /Light Rail /Park and ride Motorcycle Bicycle Walk Other, Please specify Which mode of transportation do you use most often in SUMMER? Drive alone (Automobile, Light truck, etc.) Carpool/Vanpool driver Carpool/Vanpool passenger Bus /Light Rail /Park and ride Motorcycle Bicycle Walk Other, Please specify How often do you drive to work? Every workday Several times a week Once a week Several times a month Once a month Once or twice a year Never For your commute trip, how often do you use MnPASS (High-Occupancy/Toll) lane on I394? Every workday Several times a week Once a week Several times a month Once a month Once or twice a year Never For your commute trip, how often do you use the general purpose lane on I-394? Every workday Several times a week Once a week Several times a month Once a month Once or twice a year Never For your commute trip, how often do you use MN-55 (Olsen Memorial Hwy)? Every workday Several times a week Once a week Several times a month Once a month Once or twice a year Never For your commute trip, how often do you use Glenwood Avenue? Every workday Several times a week Once a week Several times a month Once a month Once or twice a year Never For your commute trip, how often do you use MN-7? Every workday Several times a week Once a week Several times a month Once a month Once or twice a year Never For your commute trip, how often do you use MN-3 (Excelsior Blvd)? Every workday Several times a week Once a week Several times a month Once a month Once or twice a year Never For your commute trip, how often do you use MN-5 (Minnetonka Blvd)? Every workday Several times a week Once a week Several times a month Once a month Once or twice a year Never For your commute trip, how often do you use Cedar Lake Road? Every workday Several times a week Once a week Several times a month Once a month Once or twice a year Never Did you use I-35W bridge for your commute before it collapsed? No Yes Do you plan to switch back to I-35W bridge for your commute after its reopening? No Yes From which resources did you hear about this study? On-line advertisement at Craigslist On-line advertisement at City Pages Newspaper advertisement in City Pages Flyer at downtown parking ramp Flyer at grocery store Flyer at county or city libraries From friends, co-workers, or family members Email If you drive a vehicle to work, what is the car you most frequently drive? Make Model Year Is your commute to work 15 minutes long or longer each way? No Yes Are you willing to allow a GPS device to be installed in your vehicle for the duration of the study? No Yes Submit Page 1 of 2 Contact information Thank you very much for your interest in this study. Please provide your contact information below. We will contact you if you are eligible to participate in this study. Your name and contact information will not be shared with anyone else and they will not be spammed. Your responses to the screening questions will be destroyed after the selection process. First name: Last Name: Email: Work phone number: Home phone number: Mobile phone number: Submit Page 2 of 2 Appendix B: The interim email surveys Questions regarding your travel experience TODAY Today, we noticed that you changed your route when you drove home from work today. Please tell us why you made this change in your evening commute. Was it because you: (Please choose all that apply.) Discovered there was a problem with your usual route? Had to drop someone off? Had to pick someone up? Engaged in personal activity, like shopping, eating out, or going to the gym? Had to carry out a work-related activity? Felt like going a different way this evening? Others, please specify Did you make this decision: Before you departed? After you departed? Submit Page 1 of 1 Appendix C: The concluding survey Final survey 1. How would you describe the current condition of the I-94 Mississippi River Bridge with regard to the following aspects? (If you are not sure, please choose the option "Not sure" and go directly to the next question) Congestion level: Not at all congested 1 Not sure Travel time predictability: 2 3 4 5 6 7 Extremely congested Not at all predictable 1 Not sure Ease of driving: 2 3 4 5 6 7 Very predictable Very difficult 1 2 3 4 5 6 7 Very easy Very unpleasant 1 2 3 4 5 6 7 Very pleasant Not sure Pleasantness: Not sure 2. How does the current condition of the I-94 Mississippi River Bridge differ from what it was before the reopening of the I-35W Mississippi River Bridge (two months ago) with regard to the following aspects? (1 = Much better, 4 = No change, 7 = Much worse; if you are not sure, please choose "Not sure.") Congestion level: Much better 1 2 3 4 5 6 7 Much worse Much better 1 2 3 4 5 6 7 Much worse Much better 1 2 3 4 5 6 7 Much worse Not sure Travel time predictability: Not sure Ease of driving: Not sure Pleasantness: Much better 1 2 3 4 5 6 7 Much worse Not sure 3. How would you describe the current condition of the I-694 Mississippi River Bridge with regard to the following aspects? (If you are not sure, please choose the option "Not sure" and directly go to the next question) Congestion level: Not at all congested 1 Not sure Travel time predictability: 2 3 4 5 6 7 Extremely congested Not at all predictable 1 Not sure Ease of driving: 2 3 4 5 6 7 Very predictable Very difficult 1 2 3 4 5 6 7 Very easy Very unpleasant 1 2 3 4 5 6 7 Very pleasant Not sure Pleasantness: Not sure 4. How does the current condition of the I-694 Mississippi River Bridge differ from what it was before the reopening of the I-35W Mississippi River Bridge (two months ago) with regard to the following aspects? (1 = Much better, 4 = No change, 7 = Much worse; if you are not sure, please choose "Not sure.") Congestion level: Much better 1 2 3 4 5 6 7 Much worse Much better 1 2 3 4 5 6 7 Much worse Much better 1 2 3 4 5 6 7 Much worse Much better 1 2 3 4 5 6 7 Much worse Not sure Travel time predictability: Not sure Ease of driving: Not sure Pleasantness: Not sure 5. How would you describe the current condition of the Hennepin Avenue Bridge crossing the Mississippi River with regard to the following aspects? (If you are not sure, please choose the option "Not sure" and directly go to the next question) Congestion level: Not at all congested 1 Not sure Travel time predictability: 2 3 4 5 6 7 Extremely congested Not at all predictable 1 Not sure Ease of driving: 2 3 4 5 6 7 Very predictable Very difficult 1 2 3 4 5 6 7 Very easy Very unpleasant 1 2 3 4 5 6 7 Very pleasant Not sure Pleasantness: Not sure 6. How does the current condition of the Hennepin Avenue Bridge differ from what it was before the reopening of the I-35W Mississippi River Bridge (two months ago) with regard to the following aspects? (1 = Much better, 4 = No change, 7 = Much worse; if you are not sure, please choose "Not sure.") Congestion level: Much better 1 2 3 4 5 6 7 Much worse Much better 1 2 3 4 5 6 7 Much worse Much better 1 2 3 4 5 6 7 Much worse Much better 1 2 3 4 5 6 7 Much worse Not sure Travel time predictability: Not sure Ease of driving: Not sure Pleasantness: Not sure 7. How would you describe the current condition of the 3rd Avenue Bridge crossing the Mississippi River with regard to the following aspects? (If you are not sure, please choose the option "Not sure" and directly go to the next question) Congestion level: Not at all congested 1 Not sure Travel time predictability: 2 3 4 5 6 7 Extremely congested Not at all predictable 1 Not sure Ease of driving: 2 3 4 5 6 7 Very predictable Very difficult 1 2 3 4 5 6 7 Very easy Very unpleasant 1 2 3 4 5 6 7 Very pleasant Not sure Pleasantness: Not sure 8. How does the current condition of the 3rd Avenue Bridge differ from what it was before the reopening of the I-35W Mississippi River Bridge (two months ago) with regard to the following aspects? (1 = Much better, 4 = No change, 7 = Much worse; if you are not sure, please choose "Not sure.") Congestion level: Much better 1 2 3 4 5 6 7 Much worse Much better 1 2 3 4 5 6 7 Much worse Much better 1 2 3 4 5 6 7 Much worse Much better 1 2 3 4 5 6 7 Much worse Not sure Travel time predictability: Not sure Ease of driving: Not sure Pleasantness: Not sure 9. How would you describe the current condition of the Cedar Avenue Bridge (10th Avenue) crossing the Mississippi River with regard to the following aspects? (If you are not sure, please choose the option "Not sure" and directly go to the next question) Congestion level: Not at all congested 1 Not sure Travel time predictability: 2 3 4 5 6 7 Extremely congested Not at all predictable 1 Not sure Ease of driving: 2 3 4 5 6 7 Very predictable Very difficult 1 2 3 4 5 6 7 Very easy Very unpleasant 1 2 3 4 5 6 7 Very pleasant Not sure Pleasantness: Not sure 10. How does the current condition of the Cedar Avenue Bridge (10th Avenue) differ from what it was before the reopening of the I-35W Mississippi River Bridge (two months ago) with regard to the following aspects? (1 = Much better, 4 = No change, 7 = Much worse; if you are not sure, please choose "Not sure.") Congestion level: Much better 1 2 3 4 5 6 7 Much worse Much better 1 2 3 4 5 6 7 Much worse Much better 1 2 3 4 5 6 7 Much worse Much better 1 2 3 4 5 6 7 Much worse Not sure Travel time predictability: Not sure Ease of driving: Not sure Pleasantness: Not sure 11. How would you describe the current condition of the Washington Avenue Bridge crossing the Mississippi River with regard to the following aspects? (If you are not sure, please choose the option "Not sure" and directly go to the next question) Congestion level: Not at all congested 1 Not sure Travel time predictability: 2 3 4 5 6 7 Extremely congested Not at all predictable 1 Not sure Ease of driving: 2 3 4 5 6 7 Very predictable Very difficult 1 2 3 4 5 6 7 Very easy Very unpleasant 1 2 3 4 5 6 7 Very pleasant Not sure Pleasantness: Not sure 12. How does the current condition of the Washington Avenue Bridge differ from what it was before the reopening of the I-35W Mississippi River Bridge (two months ago) with regard to the following aspects? (1 = Much better, 4 = No change, 7 = Much worse; if you are not sure, please choose "Not sure.") Congestion level: Much better 1 2 3 4 5 6 7 Much worse Much better 1 2 3 4 5 6 7 Much worse Much better 1 2 3 4 5 6 7 Much worse Much better 1 2 3 4 5 6 7 Much worse Not sure Travel time predictability: Not sure Ease of driving: Not sure Pleasantness: Not sure 13. How would you describe the current condition of Highway 280 with regard to the following aspects? (If you are not sure, please choose the option "Not sure" and directly go to the next question) Congestion level: Not at all congested 1 Not sure Travel time predictability: 2 3 4 5 6 7 Extremely congested Not at all predictable 1 Not sure Ease of driving: 2 3 4 5 6 7 Very predictable Very difficult 1 2 3 4 5 6 7 Very easy Very unpleasant 1 2 3 4 5 6 7 Very pleasant Not sure Pleasantness: Not sure 14. How does the current condition of Highway 280 differ from what it was before the reopening of the I-35W Mississippi River Bridge (two months ago) with regard to the following aspects? (1 = Much better, 4 = No change, 7 = Much worse; if you are not sure, please choose "Not sure.") Congestion level: Much better 1 2 3 4 5 6 7 Much worse Much better 1 2 3 4 5 6 7 Much worse Much better 1 2 3 4 5 6 7 Much worse Much better 1 2 3 4 5 6 7 Much worse Not sure Travel time predictability: Not sure Ease of driving: Not sure Pleasantness: Not sure 15. How would you describe the current condition of the I-35W Mississippi River Bridge with regard to the following aspects? (If you are not sure, please choose the option "Not sure" and directly go to the next question) Congestion level: Not at all congested 1 Not sure Travel time predictability: 2 3 4 5 6 7 Extremely congested Not at all predictable 1 Not sure Ease of driving: 2 3 4 5 6 7 Very predictable Very difficult 1 2 3 4 5 6 7 Very easy Very unpleasant 1 2 3 4 5 6 7 Very pleasant Not sure Pleasantness: Not sure 16. How does the current condition of the I-35W Mississippi River Bridge differ from what it was before its collapse one year ago with regard to the following aspects? (1 = Much better, 4 = No change, 7 = Much worse; if you are not sure, please choose "Not sure.") Congestion level: Much better 1 2 3 4 5 6 7 Much worse Much better 1 2 3 4 5 6 7 Much worse Much better 1 2 3 4 5 6 7 Much worse Much better 1 2 3 4 5 6 7 Much worse Not sure Travel time predictability: Not sure Ease of driving: Not sure Pleasantness: Not sure Next Final survey 1. Did you change your usual routes from home to work after the reopening of the I35W Bridge? Yes No If you responded Yes, continue to the next question. If you responded No, please skip the next question. 2. What was the most important reason you changed your route after the I-35W Bridge reopened? The route I followed before the reopening of I-35W Bridge is more congested now. The new route has a shorter travel distance. The new route has a shorter travel time. The travel time of the new route is more reliable (predictable). Others, please specify 3. Did you try alternative routes other than your usual routes after the I-35W Bridge reopened? Yes No If you responded No, continue to the next question. If you responded Yes, please skip the next question. 4. What was the most important reason for you to stick to your usual routes without trying alternatives? There is no real alternative for my route to work. I do not know if there are alternative routes and do not want to bother. The alternative routes are not likely to be better off. The time and effort of trying alternatives outweighs possible time savings. Others, please specify 5. Please rank your route preferences for driving to WORK. Most preferred 1 I-35W Mississippi Bridge I-94 Mississippi Bridge I-694 Mississippi Bridge Hennepin Avenue Bridge 3rd Avenue Bridge Cedar Avenue Bridge 2 3 Least preferred Cedar Avenue Bridge (10th Avenue) Washington Avenue Bridge Franklin Avenue Bridge Others If you chose others, please specify 6. Please rank the importance of the following factors (top three) when you choose a route to WORK. Most important 1 2 Travel time Distance Travel time predictability Cost (including tolls) Convenience for shopping Drop off spouse Drop off children Aesthetics of route Others If you chose others, please specify 3 Least important 7. Please rank your route preferences for driving HOME. Most preferred 1 2 I-35W Mississippi Bridge I-94 Mississippi Bridge I-694 Mississippi Bridge Hennepin Avenue Bridge 3rd Avenue Bridge Cedar Avnuee Bridge (10th Avenue) Washington Avenue Bridge Franklin Avenue Bridge Others If you chose others, please specify 3 Least preferred 8. Please rank the importance of the following factors (top three) when you choose a route HOME. Most important 1 2 Travel time Distance Travel time predictability Cost (including tolls) Convenience for shopping Drop off spouse Drop off children Aesthetics of route Others If you chose others, please specify 3 Least important 9. What other activities do you engage in which require you to make trips that cross the Mississippi River? (Choose all that apply.) Childcare Quick stop Shopping Visit friends/Relatives Personal business Eat meal outside of home Entertainment/Recreational/Fitness Civic/Religious Pick up/Drop off With another person at their activity Others, please specify 10. Which of those activities affects your route choice the most? Childcare Quick stop Shopping Visit friends/Relatives Personal business Eat meal outside of home Entertainment/Recreational/Fitness Civic/Religious Pick up/Drop off With another person at their activity Others, please specify 11. Please rank your route preferences for that purpose. Most preferred 1 2 I-35W Mississippi Bridge I-94 Mississippi Bridge I-694 Mississippi Bridge Hennepin Avenue Bridge 3rd Avenue Bridge Cedar Avenue Bridge (10th Ave) Washington Avenue Bridge Franklin Avenue Bridge Others If you chose others, please specify 3 Least preferred 12. Please rank the importance of the following factors (top three) when you choose a route for that purpose? Most important 1 2 Travel time Distance Travel time predictability Cost (including tolls) Convenience for shopping Drop off spouse Drop off children Aesthetics of route Others If you chose others, please specify 3 Least important The following questions are about your travel preferences after the I-35W Bridge collapse 13. Did you change your usual routes from home to work after the I-35W Bridge Collapse one year ago? Yes No If you responded Yes, continue to the next question. If you responded No, please skip the next question. 14. What was the most important reason you changed your route after the I-35W Bridge Collapse? Routes or ramp closed because of the bridge collapse. The traffic condition on the usual route before the bridge collapse was much worse. The traffic condition on new route was better than the usual route before the bridge collapse. The travel time of the new route was more reliable (predictable). Others, please specify 15. Did you try alternative routes other than your usual route after the bridge collapse? Yes No If you responded No, continue to the next question. If you responded Yes, please skip the next question. 16. What is the most important reason for you to stick to your usual route without trying alternatives after the bridge collaspe? There is no real alternative for my route to work. I do not know if there are alternative routes and do not want to bother. The alternative routes are not likely to be better off. The time and efforts for trying alternatives outweight possible time savings. Others, please specify 17. Did you make fewer crossing-river trips after the bridge collapse? Yes No If you responded Yes, continue to the next question. If you responded No, please skip the next question. 18. If yes, how many trips did you cancel or consolidate with other trips? Several trips per day Several trips a week Once a week Once a month Less than once a month 19. Did you change your departure time from home to work after the bridge collapse? Yes No If Yes, by how much? minutes earlier later 20. Could you please comment on the impacts of the I-35W Bridge collapse regarding your travel pattern? Next Page 1b of 14 Please answer the following question The following scenario pertains to your drive to WORK on a typical day. If you were to use the Toll-free lanes on I-394, your trip would take 30 minutes and be free. If you used the MnPASS lane you would pay $2.50 and your trip would take 20 minutes. Now under these conditions, which would you choose to go to work on a typical day, would you: Use the MnPASS lane, pay $2.50 and save 10 minutes Use the toll-free lanes for free Next Page 2 of 14 Please answer the following question The following scenario pertains to a trips you make to destinations other than work or home (e.g. shopping) on a typical day? If you were to use the toll-free lanes on I-394, your trip would take 30 minutes and be free. If you used the MnPASS lane you would pay $2.50 and your trip would take 20 minutes. Now under these conditions, which would you choose for a trip to destinations other than work or home (e.g. shopping) on a typical day? Would you: Use the MnPASS lane, pay $2.50 and save 10 minutes Use the toll-free lanes for free Next Page 8 of 14 Some information about travel time ---Suppose I asked you what your travel time was on your way to work and you answered it is about 26 minutes. However, you sometimes travel faster, and sometimes slower because of the different congestion level from day to day. For example, 15% of the time, your travel time is between 15 to 20 minutes. And 35% of the time, your travel time is between 20 to 25 minutes. This situation can be represented by the following graph where each bar represents the likelihood of a particular outcome. The average or expected travel time is 26 minutes. Average Travel Time: 26 minutes Next Page 10a of 14 Please choose the scenario you prefer If you were to use one of the following two routes, with a different travel time distribution, average travel time, and tolls, which one would you prefer as your commute route? Average Travel Time: 26 minutes Average Travel Time: 26 minutes Toll: $1.00 Next Page 11 of 14 Final Questions For the following questions please choose a number from 1 – 7 that represents your response. For example, an answer of 1 means that you never worry and an answer of 7 means that you always worry. 1. Do you sometimes worry about driving on bridges or overpasses? Yes No If yes, please answer the following question. If no, continue to Question 2. How often do you worry? Never 1 2 3 4 5 6 7 Always 2. Do you sometimes worry about driving under a bridge or overpass? Yes No If yes, please answer the following question. If no, continue to Question 3. How often do you worry? Never 1 2 3 4 5 6 7 Always 3. Do you sometimes worry that a bridge or overpass might collapse when you are driving on it? Yes No If yes, please answer the following question. If no, continue to Question 4. How often do you worry? Never 1 2 3 4 5 6 7 Always 4. Do you sometimes worry that a bridge or overpass might collapse when you are driving under it? Yes No If yes, please answer the following question. If no, continue to Question 5. How often do you worry? Never 1 2 3 4 5 6 7 Always 5. Before the I-35W Bridge collapsed, did you sometimes worry that a bridge or overpass might collapse while you were driving on it? Yes No If yes, please answer the following question. If no, continue to Question 6. How often do you worry? Never 1 2 3 4 5 6 7 Always 6. Before the I-35W Bridge collapsed, did you sometimes worry that a bridge or overpass might collapse while you were driving under it? Yes No If yes, please answer the following question. If no, continue to Question 7. How often do you worry? Never 1 2 3 4 5 6 7 Always 7. If you worry about driving on bridges and overpasses, or under them, does this affect how you drive or where you drive? Yes No If yes, please comment below: 8. What is the highest grade or year of school that you have completed? 11th grade or less High school graduate Associate degree Bachelors degree Masters degree Doctoral degree 9. What is your age? 18-24 25-34 35-44 45-54 55-64 65+ 10. What is the total annual income for your household, when you consider the income of all employed individuals? $30,000 or less $30,000 to $49,999 $50,000 to $74,999 $75,000 to $99,999 $100,000 to $124,999 $125,000 to $149,999 $150,000 or above 11. Which of the following categories best describes your race or ethnic background? White or Caucasian Black/African American Native American Hispanic Asian Mixed race Others 12. How long have you worked at your current work location? Years Months 13. How long have you lived in your current house/apartment? Years Months 14. Where would you like the check and gas card you will receive for participating in this study to be mailed? Payee Address City State Zip Next Page 14 of 14 Appendix D: Questionnaire of the mail-in survey UNIVERSITY OF MINNESOTA Prof. Henry Liu Dept. of Civil Engineering 122 Civil Engineering Building 500 Pillsbury Dr. S.E. Minneapolis, MN 55455 October 30, 2008 RE: Survey of Travel Behavior Impacts of I-35W Bridge Reopening Dear participants: We ask your help to participate in a survey on the travel behavior impacts of the I-35W Bridge reopening. The purpose of this survey is to advance our understanding of travel behavior. Participation in this study is voluntary. All information collected will only be used at a statistical level and for research purposes. The survey is being conducted by the Department of Civil Engineering of the University of Minnesota. Please complete the questionnaire; then draw travel routes on the maps, following the instructions provided. Please place your survey responses and the maps in the prepaid envelope and drop the envelope in the mailbox. If you have any questions, please contact the principal investigator of this project, Prof. Henry Liu, at 1-651-3144586. Thank you again for your participation. Survey of Travel Behavior Impacts of I-35W Bridge Reopening Please complete the table, indicating the choice best describing your MORNING COMMUTE trip in the following time periods, and draw your route(s) on the attached maps. Departure Time: (Typical departure time from home, to the nearest minute) Arrival Time: (Typical arrival time at work, to the nearest minute) Travel Mode: (The primary mode of travel) a) Drive alone b) Carpool driver c) Carpool passenger d) Bus/Light rail e) Bicycle f) Walk g) Other (Please specify) Route Choice: (Please draw your routes on the attached maps.) If you did not change route, please draw your route on at least one map. Route Familiarity: (How familiar are you with the routes you used) Motivation for Changes in Travel Choices: Why did you change your route(s)? Please specify. Before Bridge Collapse (e.g., in July 2007) Before Bridge Reopening (e.g., Sept 17th, 2008) After Bridge Reopening (September 18th, 2008) Following Weeks (Sept. 19th to Oct. 23th) Current Status Please mark line(s) on MAP 1 Please mark Please mark Please mark Please mark line(s) on line(s) on line(s) on line(s) on MAP 2 MAP 3 MAP 4 MAP 5 If you used more than one route at that time period, please indicate ALL of them in the same map. (Please indicate the Transit Route Number if you chose Bus/Light rail) Please circle how familiar you are with each route on a scale of 1-7, with 1 representing not at all familiar and 7 representing very familiar 1234567 1234567 1234567 1234567 1234567 Please answer the following questions. Did the bridge collapse affect your travel? Y / N If so, did you: cancel trip(s) Y/ N change departure time Y/ N change route Y/ N avoid certain destinations Y/ N change mode Y/ N work at home more frequently Y/ N Did the bridge reopening affect your travel? Y/ N If so, did you: avoid certain destinations Y/ N change departure time Y/ N change mode Y/ N change route Y/ N How much time savings would be required for you to change routes: .................. Minutes How much time savings would be required for you to change travel modes: ................. Minutes How did you find out about the I-35W Bridge reopening? ......................................................... ‐‐ OVER ‐‐ Are you: Male Female Do you have a flexible work schedule: Y/ N Do you reside at the same location as you did in July 2007? Y/ N Do you work at the same location as you did in July 2007? Y/ N Where do you reside? (Please provide nearest cross streets) ........................................................... Where do you work? (Please provide nearest cross streets) ............................................................ How many people live in your household: .............. How many children: age 0-5 ............ age 6-16 ............ What is your age group? 0 – 20 years 30 – 35 years 45 – 50 years 60+ years 20 – 25 years 35 – 40 years 50 – 55 years 25 – 30 years 40 – 45 years 55 – 60 years What is your annual household income group? $0 - $10,000 $25,000 - $40,000 $60,000 - $80,000 $100,000 - $150,000 $10,000 - $25,000 $40,000 - $60,000 $80,000 - $100,000 $150,000+ .............................................................................. Please comment about how you changed your travel behavior in response to the I-35W Bridge reopening: MAP 1: Please indicate your commute route BEFORE the I-35W Bridge COLLAPSE. THANK YOU! 252 65 10 35E 494 169 100 94 36 55 694 35W -- OVER -- 280 12 35E 61 394 36 7 35W 55 37 35E 61 52 62 62 55 77 110 5 55 5 212 55 Dept. of Civil Engineering, University of Minnesota MAP 2: Please indicate your commute route BEFORE the I-35W Bridge REOPENING. THANK YOU! 252 65 10 35E 494 169 100 94 36 55 694 35W 280 12 35E 61 394 36 7 35W 55 37 35E 61 52 62 62 55 77 110 5 55 5 212 55 Dept. of Civil Engineering, University of Minnesota MAP 3: Please indicate your commute route ON THE DAY of the I-35W Bridge REOPENING (September 18). THANK YOU! 252 65 10 35E 494 169 100 94 36 -- OVER -- 55 694 35W 280 12 35E 61 394 36 7 35W 55 37 35E 61 52 62 62 55 77 110 5 55 5 212 55 Dept. of Civil Engineering, University of Minnesota MAP 4: Please indicate your commute route in the WEEKS FOLLOWING the I-35W Bridge REOPENING. THANK YOU! 252 65 10 35E 494 169 100 94 36 55 694 35W 280 12 35E 61 394 36 7 35W 55 37 35E 61 52 62 62 55 77 110 5 55 5 212 55 Dept. of Civil Engineering, University of Minnesota MAP 5: Please indicate your CURRENT commute route. THANK YOU! 252 65 10 35E 494 169 100 94 36 -- OVER -- 55 694 35W 280 12 35E 61 394 36 7 35W 55 37 35E 61 52 62 62 55 77 110 5 55 5 212 55 Dept. of Civil Engineering, University of Minnesota You have completed the survey. Thank you very much for your participation! Please return the questionnaire in the accompanying prepaid envelope to: I-35W Travel Behavior Survey University of Minnesota, Twin Cities Department of Civil Engineering 500 Pillsbury Dr. S.E. Minneapolis, MN 55455 Appendix E: Questionnaire of the web-based survey University of Minnesota Travel Survey Questions Regarding Your Travel Experiences and Choices Surrounding the I-35W Bridge Collapse and Reopening On August 1st, 2007, the I-35W Bridge over the Mississippi River in Minneapolis, Minnesota, collapsed unexpectedly. This event resulted in the closure of a half-mile strip of I-35W near downtown Minneapolis and the University of Minnesota. The following questions pertain to choices made immediately BEFORE the collapse. Before the collapse, did you use the I-35W Bridge as part of your daily commute? Yes No Please list the roads that you used as part of your daily commute BEFORE the collapse of the I35W Bridge, from the intersection nearest your RESIDENCE to the intersection nearest your WORKPLACE or SCHOOL: Please list the roads that you used as part of your daily commute BEFORE the collapse of the I35W Bridge, from the intersection nearest your WORKPLACE or SCHOOL to the intersection nearest your RESIDENCE (if same as above, but in reverse order, write SAME): http://www.traffic.umn.edu/Page1.aspx?rec=liu_group 12/2/2008 University of Minnesota Travel Survey Questions Regarding Your Travel Experiences and Choices Surrounding the I-35W Bridge Collapse and Reopening The following questions pertain to choices made immediately AFTER the collapse. Through which sources did you learn or receive coverage of the bridge collapse? (Check all that apply): National or International Media Outlets (CNN, MSNBC, FOX News Network, etc.) Local Media Outlets (FOX 9, KARE 11, WCCO 4, etc.) News Radio or other Radio Services (e.g. MPR, NPR, etc.) Newspapers (Star Tribune, Pioneer Press, etc.) Internet Websites (cnn.com, wcco.com, startribune.com, etc.) Word of Mouth (family, friends, coworkers, neighbors, etc.) Other. Please specify: In the DAYS FOLLOWING the I-35W bridge collapse, how did the amount of media coverage you read or watched (through television, radio, newspaper, internet, or others) compare with a typical day? No Change Significant Decrease 1 2 3 4 5 6 7 Significant Increase Because of information received about the bridge collapse, regardless of source, did you believe traffic would be worse the next day on your commuting route? Yes No Because of information received about the bridge collapse, regardless of source, did you change your normal route on the day IMMEDIATELY AFTER the bridge collapse (August 2nd, 2007)? Yes No http://www.traffic.umn.edu/Page2.aspx?rec=liu_group 12/2/2008 University of Minnesota Travel Survey If you changed your normal route on the day IMMEDIATELY AFTER the bridge collapse, what motivated you to make the change? (Check all that apply): My old route used the I-35W Bridge. My route was closed for other reasons (i.e. ramp closure because of collapse). I anticipated worse traffic conditions. The media coverage led me to believe that I should change routes. I followed recommendations from family members and/or friends and/or government I decided against traveling that day (e.g. took a day off work, telecommuted, etc.). I had reasons unrelated to the bridge collapse (i.e. changed workplace, switched daycare, etc.). Other. Please specify: If you changed your normal route on the day IMMEDIATELY AFTER the bridge collapse, were you familiar with your new route? Yes No Not Applicable If you did NOT change your normal route on the day IMMEDIATELY AFTER the bridge collapse, did you experience congestion? Yes No Not Applicable If you did NOT change your normal route on the day IMMEDIATELY AFTER the bridge collapse, did you change routes after that? Yes No Not Applicable How did your commute after the bridge collapse compare to your commute before the collapse? Worse than before No change Better than before http://www.traffic.umn.edu/Page2.aspx?rec=liu_group 12/2/2008 University of Minnesota Travel Survey If your commute after the bridge collapse was WORSE than before, how did your commute worsen? (Check all that apply): My travel time increased. I had to make more stops (e.g. at intersections, traffic lights, ramp meters, etc.). There were more cars on the road. I had to use an unfamiliar route. Other. Please specify: If your commute after the bridge collapse was BETTER than before, how did your commute improve? (Check all that apply): My travel time decreased. I had to make fewer stops (e.g. at intersections, traffic lights, ramp meters, etc.). There were fewer cars on the road. Other. Please specify: Please list the roads that you used as part of your daily commute IMMEDIATELY AFTER the collapse of the I-35W Bridge, from the intersection nearest your RESIDENCE to the intersection nearest your WORKPLACE or SCHOOL (if same as before collapse, write SAME): Please list the roads that you used as part of your daily commute IMMEDIATELY AFTER the collapse of the I-35W Bridge, from the intersection nearest your WORKPLACE or SCHOOL to the intersection nearest your RESIDENCE (if same as above, but in reverse order, or same as before collapse, write SAME): http://www.traffic.umn.edu/Page2.aspx?rec=liu_group 12/2/2008 University of Minnesota Travel Survey Questions Regarding Your Travel Experiences and Choices Surrounding the I-35W Bridge Collapse and Reopening On September 18th, 2008, Mn/DOT finished a new I-35W Bridge in place of the collapsed bridge and opened it for the driving public. This bridge reconnected the two segments of I-35W that had been separated because of the collapse. The following questions pertain to choices made BEFORE the bridge reopening. Please list the roads that you used as part of your daily commute BEFORE the reopening of the I-35W Bridge, from the intersection nearest your RESIDENCE to the intersection nearest your WORKPLACE or SCHOOL (if same as after collapse, write SAME): Please list the roads that you used as part of your daily commute BEFORE the reopening of the I-35W Bridge, from the intersection nearest your WORKPLACE or SCHOOL to the intersection nearest your RESIDENCE (if same as above, but in reverse order, write SAME): http://www.traffic.umn.edu/Page3.aspx?rec=liu_group 12/2/2008 University of Minnesota Travel Survey Questions Regarding Your Travel Experiences and Choices Surrounding the I-35W Bridge Collapse and Reopening The following questions pertain to choices made AFTER the bridge reopening. Through which sources did you learn or receive coverage of the bridge reopening? (Check all that apply): National or International Media Outlets (CNN, MSNBC, FOX News Network, etc.) Local Media Outlets (FOX 9, KARE 11, WCCO 4, etc.) News Radio or other Radio Services (e.g. MPR, NPR, etc.) Newspapers (Star Tribune, Pioneer Press, etc.) Internet Websites (cnn.com, wcco.com, startribune.com, etc.) Word of Mouth (family, friends, coworkers, neighbors, etc.) Other. Please specify: In the DAYS FOLLOWING the I-35W bridge reopening, how did the amount of media coverage you read or watched (through television, radio, newspaper, internet, or others) compare with a typical day? No Change Significant Decrease 1 2 3 4 5 6 7 Significant Increase Because of information received about the bridge reopening, regardless of source, did you change your normal route in the days IMMEDIATELY AFTER the bridge reopened? Yes No If you changed your normal route in the days IMMEDIATELY AFTER the bridge reopened, what was the reason? (Check all that apply): I expected less traffic congestion on a new route. My old route was closed for other reasons (e.g. ramp closure because of construction). The media coverage led me to believe that I should change routes. I followed recommendations from friends and/or government I decided against traveling that day (e.g. took a day off work, telecommuted, etc.). I had reasons unrelated to the bridge reopening (e.g. changed workplace, switched daycare, etc.). Other. Please specify: http://www.traffic.umn.edu/Page4.aspx?rec=liu_group 12/2/2008 University of Minnesota Travel Survey If you changed your normal route in the days IMMEDIATELY AFTER the bridge reopened, were you familiar with your new route? Yes No Not Applicable If you did NOT change your normal route in the days IMMEDIATELY AFTER the bridge reopened, what was your reason? (Check all that apply): I am familiar with my route and like it regardless. I expected many people to use the new bridge, hence increasing traffic congestion on that route. I am afraid of Minnesota bridges right now and chose not to try the new bridge. I had reasons unrelated to the bridge reopening that were not present when the bridge originally collapsed (e.g. new job location, new home location, etc.). Other. Please specify: How did your commute following the reopening compare to your commute before the reopening? Worse than before No change Better than before If your commute following the reopening was WORSE than before, how did your commute worsen? (Check all that apply): My travel time increased. I had to make more stops (e.g. at intersections, traffic lights, ramp meters, etc.). There were more cars on the road. I had to use an unfamiliar route. Other. Please specify: http://www.traffic.umn.edu/Page4.aspx?rec=liu_group 12/2/2008 University of Minnesota Travel Survey If your commute following the reopening was BETTER than before, what was the reason? (Check all that apply): My travel time decreased. I had to make fewer stops (e.g. at intersections, traffic lights, ramp meters, etc.). There were fewer cars on the road. Other. Please specify: Please list the roads that you used as part of your daily commute IMMEDIATELY AFTER the reopening of the I-35W Bridge, from the intersection nearest your RESIDENCE to the intersection nearest your WORKPLACE or SCHOOL (if same as before bridge reopening, write SAME): Please list the roads that you used as part of your daily commute IMMEDIATELY AFTER the reopening of the I-35W Bridge, from the intersection nearest your WORKPLACE or SCHOOL to the intersection nearest your RESIDENCE (if same as above, but in reverse order, write SAME): Please list the roads that you CURRENTLY use as part of your daily commute, from the intersection nearest your RESIDENCE to the intersection nearest your WORKPLACE or SCHOOL (if same as after reopening, write SAME): Please list the roads that you CURRENTLY use as part of your daily commute, from the intersection nearest your WORKPLACE or SCHOOL to the intersection nearest your RESIDENCE (if same as above, but in reverse order, write SAME): http://www.traffic.umn.edu/Page4.aspx?rec=liu_group 12/2/2008 University of Minnesota Travel Survey On a scale of 1 to 7 (1 being very bad and 7 being very good), please rate how you feel about your current route. Indifferent Very Bad 1 2 3 4 http://www.traffic.umn.edu/Page4.aspx?rec=liu_group 5 6 7 Very Good 12/2/2008 University of Minnesota Travel Survey Questions Regarding Your Travel Experiences and Choices Surrounding the I-35W Bridge Collapse and Reopening The following questions pertain to your general choices. Please answer as accurately as possible. How much time did you spend watching national news (e.g. CNN, MSNBC, FOX News) YESTERDAY? Hours Minutes How much time did you spend watching local news (e.g. KARE 11, FOX 9, WCCO 4) YESTERDAY? Hours Minutes How much time did you spend watching television YESTERDAY? Hours Minutes How much time did you spend listening to radio for news reports (e.g. MPR, NPR) YESTERDAY? Hours Minutes How much time did you spend listening to broadcast radio YESTERDAY, regardless of purpose? Hours Minutes How much time did you spend using the internet for news sources (e.g. cnn.com, startribune.com, wcco.com) YESTERDAY? Hours Minutes http://www.traffic.umn.edu/Page5.aspx?rec=liu_group 12/2/2008 University of Minnesota Travel Survey How much time did you spend using the internet YESTERDAY, regardless of purpose? Hours Minutes Did you learn of newsworthy events through word of mouth YESTERDAY? Yes No When hearing of an incident, such as a bridge collapse, which of the following sources makes you perceive the incident to be MOST SERIOUS? National or International Media Outlets (e.g. CNN, MSNBC, FOX News Network, etc.) Local Media Outlets (e.g. FOX 9, KARE 11, WCCO 4, etc.) News Radio or other Radio Services (e.g. MPR, NPR, etc.) Newspapers (e.g. Star Tribune, Pioneer Press, etc.) Internet Websites (e.g. cnn.com, wcco.com, startribune.com, etc.) Word of Mouth (e.g. family, friends, coworkers, neighbors, etc.) No single source stands out above the rest As a result of the bridge collapse, do you feel uncomfortable with using bridges? Yes No IF YES: Do you choose your routes to avoid bridges if possible? Yes No What is your gender? Male Female http://www.traffic.umn.edu/Page5.aspx?rec=liu_group 12/2/2008 University of Minnesota Travel Survey What is your age group? Less than 18 Years 18 - 24 Years 25 - 34 Years 35 - 44 Years 45 - 54 Years 55 - 64 Years 65+ Years What is your annual household pre-tax income group? $30,000 or less $30,000 - $49,999 $50,000 - $74,999 $75,000 - $99,999 $100,000 - $124,999 $125,000 - $149,999 $150,000 or above Please list the trips you took YESTERDAY (e.g. to work, grocery store, pharmacy, daycare, etc.), as well as the estimated length of travel time. If roundtrip, please note this next to the description. Identifying the route used is NOT necessary. http://www.traffic.umn.edu/Page5.aspx?rec=liu_group 12/2/2008


© Copyright 2026