
consolidated annual financial report 2014
CONSOLIDATED ANNUAL FINANCIAL REPORT
2014
Njord Gas Infrastructure Group
Njord Gas Infrastructure Holding AS
Njord Gas Infrastructure Holding AS
Page
Board of Director’s report
Consolidated income statement
Consolidated statement of comprehensive income
Consolidated statement of financial position
Consolidated statement of changes in equity
Consolidated statement of cash flow
2
8
8
9
10
11
Note
Note
12
12
12
12
12
13
13
13
14
14
14
14
14
15
15
15
15
15
15
15
17
19
19
19
20
21
22
23
24
25
25
26
27
28
29
34
35
35
Note
Note
Note
Note
Note
Note
Note
Note
Note
Note
Note
Note
Note
Note
Note
Note
Note
Note
1
2
2.1
2.2
2.3
2.4
2.5
2.6
2.7
2.8
2.9
2.10
2.11
2.12
2.13
2.14
2.15
2.16
2.17
2.18
3
4
5
6
7
8
9
10
11
12
13
14
15
16
17
18
19
20
-
General information
Summary of significant accounting policies
Basis for preparation
Basis of consolidation
Investments in joint ventures
Foreign currency
Property, plant and equipment
Impairment of tangible assets
Asset retirement obligation
Financial instruments at fair value through profit or loss
Financial assets
Financial liabilities
Cash and cash equivalents
Revenue
Taxes
Segment reporting
Cost of equity transactions
Cash flow statement
Equity
New and amended standards and interpretations
Accounting estimates and judgments
Segment information
Employee benefit expense
Other operating expense
Finance income and expense
Tax
Property, plant and equipment
Asset retirement obligation and reimbursement
Other financial assets and liabilities
Trade and other receivables
Cash and cash equivalents
Share capital
Shareholder loan and bond loans
Trade and other payables
Financial instruments and risk management
Related party disclosure
Operating leases
Capital commitments
Annual financial statements, Njord Gas Infrastructure Holding AS
Responsibility statement
Auditor’s report
36-43
45
46
-1-|Page
Njord Gas Infrastructure Holding AS
Board of Director’s report 2014
We are pleased to present the 2014 annual financial report for the consolidated Njord Gas
Infrastructure Group (‘the Group’) and for Njord Gas Infrastructure Holding AS (‘the Holding
Company’).
About the Njord Gas Infrastructure Group
The Group’s main business is long-term investment in gas infrastructure serving the
Norwegian continental shelf. The Holding Company is a Norwegian private limited liability
company headquartered in Stavanger, Norway. The Group’s main activities are carried out
through the Norwegian subsidiary, Njord Gas Infrastructure AS.
The Group has an 8.036% ownership interest in Gassled, an unincorporated joint venture gas
pipeline business (the ‘Joint Venture’).
The Holding Company is owned by UBS International Infrastructure Fund Holding
Coöperatie U.A. (82%) and CDC Infrastructure SA (18%).
The Group’s and Holding Company’s reporting currency is Norwegian Kroner (NOK).
Foreign currency transactions are translated at market rates. Comparable figures from prior
year are provided in brackets.
The financial statements of the Holding Company have been prepared in compliance with the
Accounting Act and accounting principles generally accepted in Norway. The consolidated
financial statements have been prepared in accordance with International Financial Reporting
Standards (IFRS).
Business activities
Operationally, 2014 represented another excellent year for Gassled. Deliverability was 99.6%
(99.7%) and the average regularity for the transport system for 2014 ended as high as 99.9%
(99.9%). During 2014, a total of 101 billion Sm3 (102.5 billion Sm3) of gas was transported
in Gassled from the Norwegian continental shelf to the terminals in Germany, Belgium,
France and the UK.
Regulatory developments
On 27 June 2013, the Ministry of Petroleum and Energy (‘MPE’) announced changes in the
Tariff Regulation (the ‘Amendment’) which reduces the future income basis for the Group
significantly. The implications for the Group are not substantial in the short to medium term,
but will increase over time as new bookings at lower tariffs start to account for a higher
proportion of the revenue basis.
In response to the Amendment, Njord Gas Infrastructure AS filed a writ of summons to
initiate legal proceedings against the MPE on 16 January 2014. In the writ of summons, Njord
Gas Infrastructure AS argues that the MPE’s decision to reduce the Gassled tariffs does not
have sufficient legal basis and must therefore be ruled invalid and claims compensatory
damages for the loss incurred as a result of the decision. The hearing date has been scheduled
to commence in April 2015.
-2-|Page
Njord Gas Infrastructure Holding AS
Going concern
In accordance with the Norwegian Accounting Act section 3-3, the Board confirms that the
conditions for continued operations as a going concern are present for the Holding Company
and the Group and that the annual financial statements have been prepared under this
presumption.
Income statement and statement of financial position
Operating revenue for the year amounted to NOK 2,076 million (NOK 1,911 million). Net
operating income for the year amounted to NOK 1,302 million (NOK 1,117 million).
Net financial expense of NOK 92 million (income of NOK 156 million) mainly relates to cost
and fair value gains (losses) associated to the Group’s bonds and swaps. The Board is of the
opinion that mitigating the underlying economic risk relating to cash flows is of high
importance to its stakeholders and that by synchronizing its debt service with its revenue base,
the swapped position provides an effective hedge for the Company’s overall cash flow
position. However, the concept of using swaps to convert the three nominal bond series into a
synthetic NOK denominated inflation linked bond as further outlined in Note 7 of the
financial statements, creates an accounting mismatch which causes volatility in the
Company’s net financial results (ref. Note 3).
The Group’s tax expense was NOK 978 million (NOK 949 million). The effective tax rate of
81% for the year was higher than the corporate tax rate (27%) plus the petroleum tax rate
(51%) at 78% mainly due to depreciation of permanent differences. This effect is partly offset
by onshore income which does not qualify for the petroleum tax element.
Net gain for the year amounted to NOK 232 million (gain of NOK 323 million).
At 31 December 2014, total assets amounted to NOK 6,416 million (NOK 5,824 million), of
which the investment in Gassled amounted to NOK 4,635 million (NOK 4,680 million). Cash
and cash equivalents amounted to NOK 514 million (NOK 415 million).
Capital and financing
Net consolidated cash flow for the year was NOK 98 million (negative NOK 414 million).
Cash flow from operating activities amounted to NOK 847 million (NOK 481 million). Cash
flow to investing activities amounted to NOK -275 million (NOK - 250 million) and cash
flow to financing activities amounted to NOK - 474 million (NOK - 645 million). A detailed
cash flow statement is included in the financial statements.
The difference between operating results and cash flow from operating activities, mainly
relates to depreciation, tax payments and financial items. The Group's investments are
financed through its operating cash flows for 2013 and 2014.
The Group has on issue four series of bond loans which are listed on the Oslo Stock
Exchange. The bonds were issued in 2011 to part finance the Gassled acquisition and mature
in 2027. The various bond series comprise a NOK 300 million index linked tranche, a NOK
550 million nominal tranche, a GBP 165 million nominal tranche and a USD 265 million
nominal tranche. GBP 28 million of bonds are held as treasury bonds following a buy back in
2013.
-3-|Page
Njord Gas Infrastructure Holding AS
Through the Group’s investment in Gassled, it receives an inflation adjusted revenue stream
which is mainly NOK denominated. In order to synchronize its debt service to its revenue
base, the Group entered into three swap arrangements to exchange its nominal debt liabilities
into a NOK denominated inflation linked debt service. These swap arrangements match the
structure of the bonds perfectly and are expected to provide an effective hedge of the currency
and cash flow risks underlying the nominal bond series. Following the buyback of GBP 28
million in 2013, the equivalent swap position was settled for a consideration of NOK 1.5
million. The Group also paid net principal payments of NOK 114 million (NOK 73 million)
to its swap providers during the year.
The Group paid a dividend of NOK 350 million (NOK 308 million) to its shareholders during
the year. At balance sheet date, shareholder loans including accrued interest of NOK 176
million remain outstanding.
Corporate Governance
The Articles of Association stipulates that the Board shall consist of 4 to 7 Directors,
including the Chairman. It is further stipulated that all Directors, respective alternates and the
Chairman shall be elected by the shareholders meeting.
The Company’s articles of association stipulates certain rights to first refusal and tag
along/drag along rights that restricts the shareholders’ right to transfer, pledge or otherwise
encumber its shareholding in the Company.
The Group’s principles for corporate governance aim to ensure the greatest possible value
creation over time in the best interest of shareholders, lenders, employees and other
stakeholders.
Risk management and internal control
The Board of Directors shall ensure that the Company has good internal control functions and
appropriate systems for risk management tailored to its operations and in accordance with the
Company’s core values, ethical guidelines and social responsibility policy. A review of the
Company’s most important risk areas and its internal control functions is conducted by the
Board at minimum on an annual basis.
The Board has established three sub-committees to assist the Board to meet its responsibilities
in relation to specific areas:
Health, Safety & Environment Committee (‘HSEC’)
The HSEC reviews the Group’s HSE performance and the effectiveness of the health and
safety policy and environment policy in order to assist the Board to meet its oversight
responsibilities in relation to the Group’s health, safety and environment performance.
Audit & Risk Committee (‘AC’)
The AC reviews the effectiveness of the Group’s financial reporting and internal control
policies and its procedures for the identification, assessment, reporting and management of
risks in order to assist the Board to meet its oversight responsibilities in relation to the
Group’s financial reporting, internal control, risk management and legal and regulatory
compliance.
-4-|Page
Njord Gas Infrastructure Holding AS
The auditor meets with the AC without any employees of the Group being present at least
once each year.
Human Resources & Compensation Committee (‘HRC’)
The HRC reviews the Group’s remuneration policies and practices and oversees the
organizational development and practices in order to assist the Board in ensuring the
establishment of human resources and compensation policies and practices which is fair,
responsible and create value for the owners.
Risks
The Group’s activities expose it to a variety of financial risks, including market risks, credit
risks and liquidity risks. The Group’s risk management program includes focusing on the
unpredictability of financial markets and seeks to minimize potential adverse effects of such
risks on its financial performance. The Group will therefore continue to manage its currency
and cash flow exposures through derivative financial instruments for its long term exposures
in accordance with market practice and to maintain flexibility in its liquidity base by keeping
committed credit lines available.
The Group was established in 2010. The acquisition of the ownership share in Gassled was
completed in June 2011. Most of the Gassled assets are mature assets with a long operation
history and stable management by Gassco AS (‘Gassco’). However, no assurance can be
given that this trend will continue or that future results will correspond to the previous
performance of the Gassled assets. Although the Group has taken out insurances against
certain risks and losses, not all operating risks are insurable and the coverage is subject to
exclusions and limitations. The occurrence of any events that affect Gassled operations and
are not fully covered by insurance could have a significant adverse effect of the Group’s
financial condition.
The Group has no significant assets except for those relating to the ownership share in
Gassled. The operations, licenses and tariff system of Gassled are regulated by the MPE. The
tariff regulations are designed to cover actual operating costs and capital costs for the
facilities as well as a reasonable return on capital invested. As further outlined in the
‘Business activities’ section of this report, the MPE amended the Tariff Regulation in June
2013. The Amendment significantly reduced the future income basis of the Group. No
guarantee can be given that the framework and/or the tariff basis will not be subject to further
amendments in the future. A decrease in future bookings and/or further adverse changes to the
regulatory system under which Gassled operates may reduce the Group’s future cash flows
further.
While the regulatory framework seeks to preserve the income of each Gassled participant in
the event that it does not invest in additions of new gas transport assets into Gassled, there can
be no assurance that such additions will not affect the Group’s income. The Group may
require additional capital in the future due to unforeseen events, for participation in expansion
projects to the Gassled pipeline system and/or other business opportunities that may be
presented to it.
The clients of the Joint Venture are generally oil companies with a strong financial basis, but
– as with suppliers and customers in general – there is always a risk that unforeseen financial
difficulties or contractual disagreements may arise which could have adverse effects on the
financial condition of the Group.
-5-|Page
Njord Gas Infrastructure Holding AS
Health, safety and environment
At the date of this report, the Group has six employees. No serious work incidents or
accidents resulting in personal injuries or damages to materials or equipment occurred in
2014.
Sick leave was 0.9% (2.4%) during the year and the working environment is considered good.
The Board and the management continue to focus on equal positions and opportunities for
men and women among its employees and Board members. 50% (50%) of the employees are
women. At present there are no female members of the Board of Directors.
External environment
The Group seeks to reduce its environmental footprint with its legal obligations as the
minimum standard for performance. The Group’s environmental policy stipulates that all
activities shall be carried out with the aim of minimizing adverse effects on the environment
and applies to all personnel and contractors engaged in activities under the Group’s
operational control.
The Group together with its Joint Venture partners in Gassled and Gassco, the operator of
Gassled, work actively on measures that can reduce any negative impact on the environment.
Operation of Gassled is based on a principle of using the best available technology and
striving to exploit energy as efficiently as possible as well as a philosophy of zero harm to
people, the environment and material assets. This view is founded on a conviction that all
harm can be prevented by systematic and purposeful HSEQ work and maintenance of an
effective emergency preparedness at all times with a view to responding to all conceivable
hazards and accidents.
Corporate social responsibility
The Group’s policy is to recruit and manage on the basis of competence and performance
regardless of age, nationality, race, gender, religious beliefs, sexuality, physical ability or
cultural background. The Group is committed to maintaining an open working environment in
which employees and contractors are able to report instances of unethical, unlawful or
undesirable conduct without fear of intimidation or reprisal. The Group’s whistleblower
policy helps provide employees and contractors with a supportive working environment in
which they feel able to raise issues of legitimate concern to them and the Group. As part of
this policy, the Group has established a helpline which can be used for reporting unacceptable
conduct.
Corporate social responsibility is also an integrated part of Gassco’s organizational culture,
strategy, operational activities and ethical conduct towards the world at large. The ethical
guidelines of Gassco conform to the UN’s Global Compact and the OECD’s guidelines for
multinational companies.
Gassco’s tendering process clarifies whether the supplier has established its own policy and
guidelines for corporate social responsibility, and whether it has been involved in incidents
related to corruption, child labor or breaches of human rights or the rights of employees to
unionize. Information on such matters is obtained from the suppliers themselves, from
internet searches and from Achilles. Possible conditions uncovered will be significant in
qualifying the supplier for participation in the tendering process.
-6-|Page
Njord Gas Infrastructure Holding AS
Annual results and year-end appropriations
The Board proposes the following appropriation of the annual gain of NOK 232,055,822 in
the Holding Company:
Gain transferred to other equity:
Total transfer:
NOK 232,055,822
NOK 232,055,822
At balance sheet date, the Holding Company had total equity of NOK 576,342,234. Following
an assessment of the soundness of the Holding Company’s equity and liquidity in relation to
its activities and risks, the Board will propose a dividend payment of NOK 150,000,000 for
the ordinary general meeting to take place in March 2014.
Outlook
With the exception of the ongoing tariff dispute, operation of the Group’s main asset, the
investment in Gassled, is running in line with expectations. Deliverability was as high as
99.6% for the year and 2014 represented the best annual HSE results ever.
However, the Group’s long term financial profile has clearly changed as a consequence of the
Amendment. The Board of Directors expects that the ongoing legal processes will require
significant resources from the executive management and Board of Directors over the next 24 years. The Board of Directors views the Group’s legal position as solid, but recognizes that
there is always uncertainty associated with litigation processes. The final outcome of the court
case is therefore considered uncertain. The Group intends to continue to fulfil all of its
obligations as owner in Gassled.
The Board is not aware of any additional risk factors facing the Group other than those
outlined in this report.
Stavanger, 26 March 2015
The Board of Directors of Njord Gas Infrastructure Holding AS
Tore I. Sandvold
Chairman
Gautier M. J. F Chatelus
Director
Paul J. Moy
Director
Mark A. Gilligan
Director
Birte Norheim
CEO
-7-|Page
Njord Gas Infrastructure Holding AS
Consolidated income statement
NOK thousands
Transportation and processing revenue
Operating expense
Transportation and processing expense
Depreciation
Employee benefit expense
Other operating expense
Total operating expense
Note
2,075,759
1,911,213
9
5
6/19
(439,497)
(319,547)
(10,522)
(4,451)
(774,018)
(453,437)
(303,230)
(8,803)
(28,799)
(794,268)
1,301,741
1,116,944
592,215
(684,206)
(91,991)
216,929
(61,008)
155,921
1,209,750
1,272,865
(977,694)
232,056
(949,382)
323,483
7
7
7
Net income/(loss) before taxes
Income tax (expense)/credit
Net income/(loss) for the period
Year ended
31 December 2013
4
Net operating income/(loss)
Financial income and expense
Finance income
Finance expense
Net financial income/(expense)
Year ended
31 December 2014
8
Consolidated statement of comprehensive income
NOK thousands
Net income/(loss) for the period
Total comprehensive income/(loss)
Year ended
31 December 2014
232,056
232,056
Year ended
31 December 2013
323,483
323,483
-8-|Page
Njord Gas Infrastructure Holding AS
Consolidated statement of financial position
NOK thousands
Note
Assets
Non-current assets
Gas transportation and processing facilities
Buildings
Construction in progress
Other fixtures & equipment
Asset retirement reimbursement
Other financial assets
Total non-current assets
Current assets
Asset retirement reimbursement, current portion
Trade and other receivables
Cash and cash equivalents
Total current assets
Total assets
Equity and liabilities
Equity
Share capital
Other paid in capital
Retained earnings
Total equity
Liabilities
Non-current liabilities
Deferred tax liabilities
Shareholder loans
Bond loans
Asset retirement obligation
Total non-current liabilities
Current liabilities
Asset retirement obligation, current portion
Current taxes
Other financial liabilities
Bond loans
Trade and other payables
Total current liabilities
Total liabilities
Total equity and liabilities
As at
31 December 2014
As at
31 December 2013
9
9
9
9
10
11
4,485,354
113,250
36,008
776
11,302
888,117
5,534,805
4,540,421
118,406
20,764
627
75,293
310,675
5,066,187
10
12
13
67,453
299,507
513,812
880,772
6,415,577
66,466
275,633
415,314
757,413
5,823,600
14
228,631
265,655
232,056
726,342
228,631
377,588
238,067
844,287
8
15/17
15/17
10
902,157
176,260
3,663,179
12,923
4,754,518
552,876
166,188
3,444,869
77,035
4,240,968
10
8
11
15/17
16
67,453
276,677
10,226
422,033
158,328
934,717
5,689,235
6,415,577
66,466
272,030
92,090
198,742
109,019
738,346
4,979,314
5,823,600
Stavanger, 31 December 2014/26 March 2015
The Board of Directors of Njord Gas Infrastructure Holding AS
Tore I. Sandvold
Chairman
Gautier M. J. F Chatelus
Director
Paul J. Moy
Director
Mark A. Gilligan
Director
Birte Norheim
CEO
-9-|Page
Njord Gas Infrastructure Holding AS
Consolidated statement of changes in equity
NOK thousands
Total equity as at 1 January 2013
Total comprehensive income/(loss) for the year
Reduction of share capital
Dividend payment proposed in 2012, paid in 2013
Dividend, proposed and paid in 2013
Total equity as at 31 December 2013
Nominal share Other paid in
capital
capital
457,263
457,263
0
0
(228,632)
228,632
0
(88,306)
0
(220,000)
228,631
377,588
Retained
earnings
(85,416)
323,483
0
0
0
238,067
Total equity
829,110
323,483
0
(88,306)
(220,000)
844,287
NOK thousands
Total equity as at 1 January 2014
Total comprehensive income/(loss) for the year
Dividend payment proposed in 2013, paid in 2014
Dividend, proposed and paid in 2014
Total equity as at 31 December 2014
Nominal share Other paid in
capital
capital
228,631
377,588
0
0
0
(11,933)
0
(100,000)
228,631
265,655
Retained
earnings
238,067
232,056
(238,067)
0
232,056
Total equity
844,286
232,056
(250,000)
(100,000)
726,342
- 10 - | P a g e
Njord Gas Infrastructure Holding AS
Consolidated statement of cash flow
NOK thousands
Cash flows from operating activities
Net income/(loss) before taxes
Depreciation
Interest expenses and finance expenses not paid
Foreign exchange and other gains and losses
Changes in trade and other receivables
Changes in trade and other payables
Changes in other long term receivables
Tax payments
Net cash flow from/(used in) operating activities
Cash flows from investing activities
Investment in property plant and equipment
Net cash flow used in investing activities
Cash flows from financing activities
Dividend payments
Payment of principal bond loans
Repurchase of bond loans
Payments on swap contracts
Net cash flow used in financing activities
Net change in cash and cash equivalents
Cash and cash equivalents at the beginning of the period
Cash and cash equivalents at the end of the period
Interest paid
Note
Year ended
31 December 2014
Year ended
31 December 2013
1,209,750
319,547
18,181
(101,692)
(23,874)
49,213
(25)
(623,766)
847,335
1,272,865
303,230
13,952
(346,618)
(11,442)
4,182
(0)
(755,189)
480,979
9
(274,715)
(274,715)
(249,685)
(249,685)
14
15/17
15/17
11/17
(350,000)
(10,502)
0
(113,620)
(474,122)
(308,306)
(6,210)
(256,417)
(73,900)
(644,832)
98,498
415,314
513,812
(413,538)
828,853
415,314
(179,795)
(185,643)
9
12
16
8
13
- 11 - | P a g e
Njord Gas Infrastructure Holding AS
Notes to the consolidated accounts
Note 1 - General information
Njord Gas Infrastructure Holding AS (the ’Holding Company’), which is the parent company
in the Njord Gas Infrastructure Group (the ‘Group’), is a limited liability company
incorporated and domiciled in Norway, with its main office in Stavanger. The Group, through
its wholly-owned subsidiary Njord Gas Infrastructure AS, holds an 8.036% interest in
Gassled, which owns the Norwegian gas transport infrastructure.
The Group’s presentation currency is Norwegian Kroner (‘NOK’). All amounts in the
financial statements are provided in NOK thousands unless stated otherwise.
The financial statements were authorized for issue by the Board of Directors on 26 March
2015.
Note 2 - Summary of significant accounting policies
The principal accounting policies applied in the preparation of these financial statements are
set out below.
2.1 Basis for preparation
The consolidated financial statements have been prepared in accordance with International
Financial Reporting Standards (IFRS) as adopted by the European Union (EU) and in
accordance with the additional requirements following the Norwegian Accounting Act.
The consolidated financial statements have been prepared on a historical cost basis with some
exceptions, as detailed in the accounting policies set out below.
2.2 Basis of consolidation
The consolidated financial statements comprise the financial statements of Njord Gas
Infrastructure Holding AS and entities controlled by the Group (its subsidiaries). The Group
controls an entity when the Group is exposed to, or has rights to, variable returns from its
involvement with the entity and has the ability to affect those returns through its power over
the entity.
Subsidiaries are fully consolidated from the date on which control is transferred to the Group.
They are deconsolidated from the date that control ceases
The financial statements of subsidiaries are prepared for the same reporting period using
consistent accounting policies as those of the Group. All intercompany balances and
transactions have been eliminated upon consolidation.
2.3 Interests in joint arrangements
The Group applies IFRS 11 to all joint arrangements. Under IFRS 11 investments in joint
arrangements are classified as either joint operations or joint ventures depending on the
contractual rights and obligations of each investor. Gassled is not a separate legal entity.
However, the ownership of the integrated set of assets and liabilities is regulated by a
- 12 - | P a g e
Njord Gas Infrastructure Holding AS
contractual agreement giving the Group the rights to its share of the respective assets and
liabilities.
The Group accounts for its ownership in Gassled as joint operation. Interests in joint
operations are recognized by including the Group’s share of assets liabilities, income and
expense on a line-by-line basis. At balance sheet date, the interest in the Joint Venture is
included in the following lines in the statement of financial position; gas transportation and
processing facilities, buildings, construction in progress and other fixtures & equipment, in
addition to working capital assets and liabilities.
2.4 Foreign currency
The functional currency of the Holding Company and its subsidiary is NOK. Monetary assets
and liabilities denominated in other currencies are translated at exchange rates prevailing at
balance sheet date. Foreign currency revenues and expenses are translated at exchange rates
prevailing at transaction date. Realized and unrealized gains and losses resulting from foreign
exchange are recognized in the income statement as incurred.
2.5 Property, plant and equipment
Property, plant and equipment are stated at historic cost less accumulated depreciation and
any impairment loss.
Subsequent costs are included in the asset’s carrying amount or recognized as a separate asset,
as appropriate, only when it is probable that future economic benefits associated with the item
will flow to the Group and the cost of the item can be measured reliably. The carrying amount
of any replaced part is derecognized. All other repairs and maintenance are charged to the
income statement during the financial period in which they are incurred.
Property, plant and equipment are depreciated on a straight-line basis over expected useful
life. If individual parts of property, plant and equipment have different useful lives, they are
accounted for and depreciated separately.
2.6 Impairment of tangible assets
At the end of each reporting period, the Group reviews the carrying amounts of its tangible
assets to determine whether any indication of impairment exists. If any such indication exists,
the recoverable amount of the asset is estimated in order to determine the extent of the
impairment loss (if any). Where it is not possible to estimate the recoverable amount of an
individual asset, the Group estimates the recoverable amount of the cash-generating unit to
which the asset belongs.
Recoverable amount is the higher of fair value less costs to sell and value in use. In assessing
value in use, the estimated future cash flows are discounted to their present value.
If the recoverable amount of an asset (or cash-generating unit) is estimated to be less than its
carrying amount, the carrying amount of the asset (or cash-generating unit) is reduced to its
recoverable amount. An impairment loss is recognized immediately in the income statement.
Where an impairment loss subsequently reverses, the carrying amount of the asset (or cashgenerating unit) is increased to the revised estimate of its recoverable amount, but so that the
increased carrying amount does not exceed the carrying amount that would have been
determined had no impairment loss been recognized for the asset (or cash-generating unit) in
- 13 - | P a g e
Njord Gas Infrastructure Holding AS
prior years. A reversal of an impairment loss is recognized immediately in the income
statement.
2.7 Asset retirement obligation
Provisions for asset retirement obligations are recognized when the Group has an obligation
(legal or constructive) to dismantle and remove gas transportation and processing facilities.
The amount recognized is the present value of the estimated future expenditure determined in
accordance with local conditions and requirements.
In accordance with underlying agreements, the majority of the future asset retirement costs
will be reimbursed from the companies utilizing the gas transportation system for
transportation of gas (the ‘Shippers’). To the extent that an asset retirement obligation
recognized in the balance sheet may be reclaimed by the Shippers, it will therefore result in a
corresponding receivable from the Shippers. Any part of the provision for asset retirement
obligations that are to be borne by the Group is capitalized as a part of the asset cost and
depreciated over the assets expected useful life.
The liability and the corresponding receivable are accreted for the change in its present value
each reporting period. Accretion expense related to the time value of money are classified as
part of financial expense in the income statement.
The provision and the discount rate are reviewed at each reporting period.
2.8 Financial instruments at fair value through profit or loss
Derivatives
Derivative instruments are classified as financial assets or liabilities at Fair Value Through
Profit or Loss (‘FVTPL’). The carrying value of derivative instruments at FVTPL represents
the instrument’s fair market value. Any gains or losses arising on re-measurement is
recognized in the income statement as incurred.
The net gain or loss recognized in profit or loss incorporates transaction cost and interest
expense incurred on the financial liability.
2.9 Financial assets
Short term receivables are initially recognized at fair value plus any transaction costs. The
receivables are subsequently carried at amortized cost using the effective interest method (if
the amortization effect is material). The carrying amount of the asset is reduced by any
impairment losses.
2.10 Financial liabilities
Financial liabilities, other than those recognized at FVTPL, are initially recognized at fair
value less direct transaction costs. Subsequent to initial recognition, interest-bearing liabilities
are measured at amortized cost with any difference between cost and redemption being
recognized in the statement of income over the expected duration of the loan.
2.11 Cash and cash equivalents
Cash and cash equivalents include cash on hand, deposits with banks and other short-term
highly liquid investments with original maturities of three months or less.
- 14 - | P a g e
Njord Gas Infrastructure Holding AS
2.12 Revenue
Revenue is recognized to the extent that it is probable that the economic benefits will flow to
the Group and the revenue can be reliably measured. Revenue from gas transportation and gas
processing is recognized as earned in line with underlying agreements. Transportation and
processing of gas is based on nominations from the shippers on a ship-or-pay basis. The
tariffs for the transportation of gas is regulated by the MPE and are designed to cover actual
operating costs and capital costs for the facilities as well as a return on capital invested.
2.13 Taxes
Income taxes for the period comprise tax payable and changes in deferred tax. The tax rates
and tax laws used to compute tax are those that are enacted or substantively enacted, at the
reporting date in the countries where the Group operates and generates taxable income.
Tax is recognized in the income statement, except to the extent that it relates to items
recognized in other comprehensive income or directly in equity.
Deferred tax assets and liabilities are calculated on the basis of existing temporary differences
between the carrying amounts of assets and liabilities in the financial statement and their tax
bases, together with tax losses carried forward at balance sheet date. Deferred tax assets and
liabilities are calculated based on the tax rates and tax legislation that are expected to exist
when the assets are realized or the liabilities are settled.
Deferred tax assets are recognized only to the extent that it is probable that future taxable
profits will be available against which the assets can be utilized.
2.14 Segment reporting
The Group only operates within one business segment and therefore does not report segment
information.
2.15 Cost of equity transactions
Transaction costs directly linked to an equity transaction are recognized directly in equity, net
after tax.
2.16 Cash flow statement
The cash flow statement is prepared by using the indirect method.
2.17 Equity
Fund for unrealized gains
The Group recognizes its nominal bonds at fair value using the FVTPL option based on the
“accounting mismatch” criterion in IAS 39.9. The nominal bonds and the corresponding swap
contracts are considered as a group of assets or liabilities for the purpose of recognition of
unrealized gains in the fund for unrealized gains. Any applicable unrealized gains on the
bonds are therefore recognized in the fund for unrealized gains net of the unrealized losses on
the related derivatives and vice versa.
2.18 New and amended standards and interpretations
Amendments to standards effective for the accounting periods starting 1 January 2014 did not
have any material impact on the Group’s financial statement.
- 15 - | P a g e
Njord Gas Infrastructure Holding AS
IFRS and IFRIC issued but not adopted by the Group
A number of new standards and amendments to standards and interpretations are effective for
annual periods beginning after 1 January 2014, and have not been applied in preparing these
financial statements. None of these is expected to have a significant effect on the financial
statements of the Group, except the following set out below:
IFRS 9, ‘Financial instruments’, addresses the classification, measurement and recognition of
financial assets and financial liabilities. The complete version of IFRS 9 was issued in July
2014. It replaces the guidance in IAS 39 that relates to the classification and measurement of
financial instruments. IFRS 9 retains but simplifies the mixed measurement model and
establishes three primary measurement categories for financial assets: amortized cost, fair
value through OCI and fair value through P&L. The basis of classification depends on the
entity’s business model and the contractual cash flow characteristics of the financial asset.
Investments in equity instruments are required to be measured at fair value through profit or
loss with the irrevocable option at inception to present changes in fair value in OCI not
recycling. There is now a new expected credit losses model that replaces the incurred loss
impairment model used in IAS 39. For financial liabilities there were no changes to
classification and measurement except for the recognition of changes in own credit risk in
other comprehensive income, for liabilities designated at fair value through profit or loss.
IFRS 9 relaxes the requirements for hedge effectiveness by replacing the bright line hedge
effectiveness tests. It requires an economic relationship between the hedged item and hedging
instrument and for the ‘hedged ratio’ to be the same as the one management actually use for
risk management purposes. Contemporaneous documentation is still required but is different
to that currently prepared under IAS 39. The standard is effective for accounting periods
beginning on or after 1 January 2018. Early adoption is permitted. The Group is yet to assess
IFRS 9’s full impact.
IFRS 15, ‘Revenue from contracts with customers’ deals with revenue recognition and
establishes principles for reporting useful information to users of financial statements about
the nature, amount, timing and uncertainty of revenue and cash flows arising from an entity’s
contracts with customers. Revenue is recognized when a customer obtains control of a good
or service and thus has the ability to direct the use and obtain the benefits from the good or
service. The standard replaces IAS 18 ‘Revenue’ and IAS 11 ‘Construction contracts’ and
related interpretations. The standard is effective for annual periods beginning on or after 1
January 2017 and earlier application is permitted. It is not expected that IFRS 15 will have a
material impact on the Group’s financial statement.
- 16 - | P a g e
Njord Gas Infrastructure Holding AS
Note 3 – Accounting estimates and judgments
Estimates and judgments are continually evaluated and are based on historical experience and
other factors, including expectations of future events that are assumed to be reasonable under
current circumstances.
i. Critical accounting estimates and assumptions
The Group makes estimates and assumptions concerning the future. The resulting accounting
estimates will, by definition, seldom equal the actual results. The estimates and assumptions
that have significant risk of causing a material adjustment to the carrying amounts of assets
and liabilities within the next financial year are disclosed below.
Income taxes
The Group is mainly subject to income taxes under the Norwegian Petroleum Tax
jurisdiction. Judgment is required in determining the provision for income taxes. During the
ordinary course of business, transactions and calculations occur for which the ultimate tax
effect is uncertain. The Group recognizes liabilities for anticipated tax audit issues based on
estimates of whether additional taxes will be due. Where the final outcome of these matters is
different from the amounts that were initially recognized, such differences will impact the
income tax and deferred tax provisions in the period in which such determination is made.
The accounting of deferred income tax asset relies upon management’s judgment of the
Group’s ability to generate future positive taxable income in respective jurisdictions.
Removal cost
Estimating the costs of decommissioning/removal activities are challenging and relevant risks
and uncertainties including potential changes to technology and regulations need to be
considered. Most of the removal activities are expected to take place many years into the
future and removal technology and cost are constantly changing. The estimates include
assumptions of the probability that the Group will be required to remove various assets as
well as required duration and rates for rigs, marine operations and heavy lift vessels that can
vary considerably depending on the assumed removal complexity. As a result, estimating
decommissioning obligations involves significant judgment.
The Group has based its estimated cost on budgets prepared by Gassco, the independent
operator of Gassled. The discount rate is based on market quoted swap rates for each currency
group and additionally includes an estimate for inflation and risk premium. The estimates are
based on management’s best estimate. Where the final outcome of these matters is different
from the amounts that were initially recognized, such differences will impact the provisions in
the period in which such determination is made. The majority of removal obligations are
reclaimable from the Shippers (ref. Note 2.7), and any potential changes to the provisions will
therefore not materially
impact the income statement.
Fair value of bond loans and derivative financial instruments
The fair value of financial instruments that are not traded in an active market are determined
by using valuation techniques. The Group uses FVTPL to account for its nominal bond loan
series and related swap instruments. Due to the terms and structure of the derivatives and the
bond loan, the measurement of fair value is complex, and requires substantial judgment.
- 17 - | P a g e
Njord Gas Infrastructure Holding AS
The Group calculates the fair value of its FVTPL financial instruments by applying
conventional bond and swap valuation techniques based on market quoted swap rates and
management’s best estimate of market expectations for future inflation and credit spread.
Changes in the combined fair values of the bonds and swaps are mainly impacted by changes
in Norwegian interest rates, changes in expectations for future Norwegian consumer price
inflation (‘CPI’) as well as currency movements. The fair value of the nominal bond loan
series may additionally be impacted by changes to assumed credit risk. Increased credit
spread in 2013, due to lowered rating of the Company’s bonds, reduced the fair value of the
bonds and impacted the financial results by a gain of NOK 366m for 2013. Further increased
credit spread in 2014, due to an overall increase in spread on non-investment grade bonds,
impacted the financial results by a gain of NOK 311m for 2014. Accumulated gain due to
increased credit spread amounts to NOK 677m. Of the key parameters impacting the FVTPL,
the change in credit spread had the most significant impact which is attributable to changes in
regulation (2013) and significant movements in the high yield market (2014).
The estimated loss position of the swaps at inception is recognized as a financial asset which
amortize linearly until maturity date.
ii. Critical judgments in applying the Group’s policies
Assumptions applied for the purpose of estimating the fair value of the Group’s nominal bond
loan series and related swaps include expectations for future Norwegian interest rate, credit
spread and future CPI. For the swapped position of the Group, an increase in a) Norwegian
interest rates will have a favorable impact on the Group’s income statement and vice versa, b)
credit spread will have a favorable impact on the Group’s income statement and vice versa,
and c) CPI will have an adverse impact on the Group’s income statement and vice versa. For
example (all other variables kept constant):
a) If expectations for future Norwegian interest rates at 31 December 2014 had been:
• 50bps higher, then profit before tax would have been NOK 117.3 million higher
• 50bps lower, then profit before tax would have been NOK 122.7 million lower
Management’s estimate of change in credit spread since issuance as applied in relation to
these financial statements is 325bps.
b) If the change in credit spread at 31 December 2014 had been:
• 50bps higher, then profit before tax would have been NOK 95.2 million higher
• 50bps lower, then profit before tax would have been NOK 99.3 million lower
• 100bps higher, then profit before tax would have been NOK 186.7 million higher
• 100bps lower, then profit before tax would have been NOK 202.9.1 million lower
Management’s estimate of CPI as applied in relation to these financial statements is 1.75%.
c) If expectations for future CPI at 31 December 2014 had been:
• 25bps higher, then profit before tax would have been NOK 56.7 million lower
• 25bps lower, then profit before tax would have been NOK 55.6 million higher
• 50bps higher, then profit before tax would have been NOK 114.2 million lower
• 50bps lower, then profit before tax would have been NOK 110.3 million higher
- 18 - | P a g e
Njord Gas Infrastructure Holding AS
Note 4 – Segment information
The Group operates within one business segment; namely its investment in the gas
transportation infrastructure connected to the North Sea. The Group does therefore not
separate its activities into different operating or geographical segments.
Specification of major customers
Approximately 71% (68%) of the Group's revenue was from a national oil company with
investment grade credit rating. Estimated total revenue attributable to this customer during the
year was NOK 1.5 billion (NOK 1.3 billion).
Note 5 – Employee benefit expense
Specification of employee benefit expense
NOK thousands
Payroll expense
Social security tax
Pensions
Other personnel expense
Total employee benefit expense
Total number of man-years (rounded)
2014
8,780
1,273
289
179
10,522
2013
7,101
1,070
323
308
8,803
6
6
Pensions
The Group has a defined contribution pension plan for its employees, which satisfies the
statutory requirements in the Norwegian law on required occupational pension ("lov om
obligatorisk tjenestepensjon").
See information in Note 18 regarding remuneration of key management.
Note 6 – Other operating expense
Specification of other operating expense
NOK thousands
Legal fees
Other consulting fees
Lease expenses and other office costs
IT expense
Refunded VAT for prior years
Other operating expense
Total operating expense
2014
11,457
6,139
684
254
(16,323)
2,241
4,451
2013
16,270
10,536
598
286
0
1,108
28,799
2014
297
58
0
354
2013
288
122
100
510
Specification of auditor’s fees
NOK thousands
Statutory audit
Tax advisory services
Other advisory services
Total auditor's fees
- 19 - | P a g e
Njord Gas Infrastructure Holding AS
Note 7 – Finance income and expense
NOK thousands
Interest income
Net gain on derivative instruments (swaps)
Fair value gain on bond loans at FVTPL
Net currency translation effects
Total finance income
2014
9,466
580,590
0
2,159
592,215
2013
14,001
44,230
157,990
708
216,929
Interest expense
Amortization of day 1 loss
Fair value loss on bond loans at FVTPL
Net realised loss on buyback of bond loans
Other financial expenses
Total finance expense
31,267
10,433
635,174
0
7,331
684,206
28,579
25,343
0
2,819
4,267
61,008
Net financial income/(expense)
(91,991)
155,921
The majority of the Group’s revenues are NOK denominated and subject to annual inflation
adjustments. In order to synchronize its debt exposure to its cash flows from operations (ref.
Note 17), the Group has entered into three series of swap arrangements (ref. Note 11). Each
series of swaps replicate perfectly the three nominal bond series so that the Group effectively
has swapped all of its nominal bond positions into a NOK denominated inflation linked
position.
Management expects that the concept of converting the three nominal bond series into a
synthetic NOK denominated inflation linked position provides an effective hedging of the
Group’s overall cash flow position. However, the synthetic position creates an accounting
exposure/mismatch that is distinct and separate from the underlying economic exposure of the
Group and that would not arise for a conventional NOK denominated inflation linked bond
position recognized at amortized cost.
During 2013, the net adverse effect of the NOK swap rates reducing in the near term and
increasing in the long term was more than offset by the impact of the change in credit spread.
During 2014, the weakened NOK increased the fair value of the bonds, which was partly
offset by an increase in the fair value of the swaps. The adverse effect of the NOK swap rates
continuing to reduce in 2014 was more than offset by the impact of the change in credit
spread as further described in Note 3. These effect are due to the FVTPL approach applied for
the recognition of the bonds and swaps requires the Group to value the financial instruments
marked-to-market and thus recognizing the full unrealized change in fair value of the financial
instruments in the income statement immediately. In reality however, those exposures are
matched against the operating cash flows which will be recognized in the income statement as
incurred.
- 20 - | P a g e
Njord Gas Infrastructure Holding AS
Note 8 – Tax
Income taxes recognized in the income statement
NOK thousands
Tax payable
Tax payable, adjustment previous years
Change in deferred tax
Total income tax expense recognized in the income statement
Reconciliation of income tax
NOK thousands
Profit/(loss) before income tax
Expected income tax at nominal tax rate (27% / 28%)
Expected petroleum tax (51% / 50%)
Permanent differences (1)
Financial items
Onshore items
Uplift
Changed tax rates
Change in valuation allowance and changes related to prior years
Total income tax expense recognized in the income statement
2014
627,710
702
349,281
977,694
2013
603,855
(29)
345,556
949,382
2014
1,209,750
326,632
616,972
112,891
25,099
(80,943)
(22,969)
0
11
977,694
2013
1,272,865
356,402
636,432
111,471
(75,380)
(50,652)
(20,722)
(8,141)
(29)
949,382
Effective income tax rate
80.8 %
74.6 %
(1) Permanent differences mainly relate to depreciation of property, plant and equipment recognized at acquisition of
interest in Gassled (section 10 resolution).
Specification of tax effects on temporary differences, tax losses and uplift carried forward
NOK thousands
Property, plant and equipment
Loans and swap contracts
Asset retirement obligation
Tax losses carried forward
Total deferred tax liabilities/(assets)
Total deferred tax liabilities/(assets) recognized
2014
549,218
369,516
(1,264)
(15,313)
902,157
902,157
2013
426,488
142,277
(1,359)
(14,530)
552,876
552,876
Deferred tax is calculated based on tax rates applicable at balance sheet date. Ordinary income tax is 27%, to which is added
a special petroleum tax for oil and gas companies at the rate of 51%, giving a total tax rate of 78%.
Tax payable
NOK thousands
Tax payable for year 2013
Tax paid for year 2013
Tax payable, adjustment previous years not yet assessed
Total tax payable 2013
Tax payable for year 2014
Tax paid for year 2014
Tax payable, adjustment previous years not yet assessed
Total tax payable 2014
2013
603,855
(364,771)
32,945
272,030
627,710
(383,979)
32,945
276,677
- 21 - | P a g e
Njord Gas Infrastructure Holding AS
Note 9 – Property, plant and equipment
Gas transportation
and processing
facilities
NOK thousands
Buildings
Other
Construction fixtures &
in progress equipment
Total
Cost
Cost at 1 January 2013
Additions
Disposals
Cost at 31 December 2013
5,054,805
224,286
0
5,279,092
133,533
4,321
0
137,854
0
20,764
0
20,764
373
313
0
687
5,188,711
249,685
0
5,438,396
Additions
Disposals
Cost at 31 December 2014
256,447
0
5,535,538
2,835
0
140,689
15,244
0
36,008
190
0
877
274,715
0
5,713,111
Depreciation and impairment
Accumulated at 1 January 2013
Depreciation for the year
Impairment
Disposals
Accumulated at 31 December 2013
(443,226)
(295,444)
0
0
(738,671)
(11,693)
(7,754)
0
0
(19,447)
0
0
0
0
0
(28)
(32)
0
0
(59)
(454,947)
(303,230)
0
0
(758,177)
Depreciation for the year
Impairment
Disposals
Accumulated at 31 December 2014
(311,514)
0
0
(1,050,184)
(7,991)
0
0
(27,438)
0
0
0
0
(42)
0
0
(102)
(319,547)
0
0
(1,077,724)
4,540,421
4,485,354
118,406
113,250
20,764
36,008
627
776
4,680,219
4,635,387
Carrying amount at 31 December 2013
Carrying amount at 31 December 2014
Depreciation plan
Estimated useful life (years)
Linear
17.6 (1)
Linear
17.6 (1)
Linear
17.6 (1)
(1) Depreciation over 17.6 years corresponds to the period from the acquisition of the interest in Gassled to the end of the
current license period in 2028. Additions in 2014 is depreciated over 15.5 years.
Impairment test
On the basis of the new Tariff Regulation, the Group has tested its property, plant and
equipment for impairment. The calculated recoverable amount is higher than the carrying
amount and no impairment has therefore been recognized.
Planned investments
The figures in the table below are based on the Group’s share of the investments in the four
year plan of the Joint Venture. The amounts are based on estimated cost and time for nondiscretionary projects and do not necessarily represent committed liabilities.
NOK thousands
Investments
2015
139,907
2016
70,154
2017
0
2018
0
- 22 - | P a g e
Njord Gas Infrastructure Holding AS
Note 10 – Assets retirement obligation and reimbursement
Provisions have been made for estimated costs for abandonment of gas transportation assets
and processing facilities. However, in line with underlying agreements, the majority of these
expected future expenses are reimbursable by the users of the system; the Shippers. This is
reflected in the financial statements by the recognized asset retirement reimbursement that
corresponds to the recognized liabilities (to the extent applicable).
The majority of the recognized asset retirement obligations and reimbursements is expected to
incur over the next 2 years. The current license period expires in 2028. However, the outlook
for continued production of Norwegian gas far beyond 2028 is considered highly probable
and the Group therefore allocates a low probability that it will become liable for the cost of
abandonment upon depletion of Norwegian gas on the continental shelf under the existing
license.
Asset retirement reimbursement
NOK thousands
Asset retirement reimbursement, non-current portion
Asset retirement reimbursement, current portion
Total asset retirement reimbursement
2014
11,302
67,453
78,755
2013
75,293
66,466
141,759
2014
11,302
1,621
12,923
2013
75,293
1,742
77,035
Asset retirement obligation, current portion
67,453
Total provision
80,376
(1) The non-reimbursable portion of the provision is recognized as an asset cost (ref. Note 9)
66,466
143,500
Asset retirement obligation
NOK thousands
Asset retirement obligation, non-current portion
Asset retirement obligation, non-reimbursable non-current portion (1)
Total non-current asset retirement obligation
Changes in provision
NOK thousands
2014
2013
Balance at 1 January
143,500
198,411
Change in estimate of provision - reimbursable (1)
(5,319)
198
Payments - reimbursable
(57,685)
(55,012)
Change in provision - non-reimbursable
(208)
(183)
Unwinding of discount - non-reimbursable
87
87
Balance at 31 December
80,376
143,500
(1) As described above, changes in provision for reimbursable obligations are recognised as an adjustment
to the asset retirement reimbursement.
- 23 - | P a g e
Njord Gas Infrastructure Holding AS
Note 11 – Other financial assets and liabilities
As described in Note 7, the Group has entered into a series of swap arrangements that are
matched perfectly to each nominal bond tranche (timing, payment structure, maturity) so that
the Group effectively has exchanged its economic exposure to local currency denominated
nominal debt service for NOK denominated inflation linked debt service. The following tables
summarize the contracts and the carrying amounts:
Summary of contracts
Bond loan/swap
contracts
USD 265m nominal
GBP 165m nominal*
NOK 550m nominal
Group pays to
swap providers
NOK inflation linked
interest and principal
NOK inflation linked
interest and principal
NOK inflation linked
interest and principal
Group receives
from swap providers
USD nominal interest
and principal
GBP nominal interest
and principal
NOK nominal interest
and principal
Maturity
30 Sept. 2027
30 Sept. 2027
30 Sept. 2027
* GBP 28m of the total issued amount of GBP165m is held as treasury bonds following a buy back in 2013. The
equivalent swap position was settled in 2013.
Carrying amounts – Other financial assets
NOK thousands
Fair value on derivative financial instruments
Loss on derivative instruments at inception
Other financial assets
2014
755,965
132,151
888,117
2013
168,091
142,584
310,675
10,226
10,226
92,090
92,090
Carrying amounts – Other financial liabilities
NOK thousands
Current portion of financial instruments
Other fiancil liabilities
Current portion of other financial assets is a net liability of NOK 10,226 thousands.
Reconciliation of fair value measurement
NOK thousands
Opening balance fair value derivative financial instruments
Payments of principal amounts
Net receipt of interest payments
Loss on settlement
Gain/(loss) from fair value remeasurements recognised in income statement
Ending balance fair value derivative instruments
2014
76,001
113,620
(24,471)
0
580,590
745,740
2013
(27,843)
72,400
(14,287)
1,500
44,230
76,001
The purposes of the swap arrangements
1) Reduce bond currency risk
After taking into account the swaps, the Group is only exposed to debt service in NOK so that
its debt service obligations are not impacted by movements in USD and GBP versus NOK.
2) Match debt service with the NOK inflation linked cash flows of Gassled
Through the Group’s investment in Gassled, it receives an inflation adjusted revenue stream
that is mainly NOK denominated. By entering into the swap arrangements, the Group has
effectively exchanged its nominal bond debt liabilities for NOK denominated inflation linked
- 24 - | P a g e
Njord Gas Infrastructure Holding AS
debt service to match the underlying inflation linked NOK denominated cash flows from
operations.
Loss of derivative instruments at inception
The fair value of the swap contracts has been calculated by using valuation techniques that
incorporate all factors that market participants would consider in setting a price. At initial
recognition, the best estimate of a fair value gave rise to a loss at inception of NOK 186,056
thousands. Consistent with IAS 39, this loss was not recognized in the income statement at
initial recognition. The loss at inception was capitalized, and is reflected in the income
statement on a linear basis over the duration of the swaps. The portion of the loss at inception
allocated to the GBP 28 million position which was settled during the year was expensed in
2013. The remaining balance of the loss recognized at inception was NOK 142,584 thousands
(NOK 167,928 thousands) at balance sheet date.
The loss reflects credit charges from the swap counterparties and a limited market for such
transactions.
Note 12 – Trade and other receivables
Specification of trade and other receivables
NOK thousands
Accrued income
Joint Venture receivables
Prepaid expenses
VAT receivable
Other short term receivables
Trade and other receivables
2014
187,685
104,298
1,674
900
4,950
299,507
2013
171,339
62,431
38,394
0
3,470
275,633
The Group did not have any trade receivables in 2014 or 2013. No allowance for doubtful
debts has been made, and no loss has been recognized during 2014 or 2013.
Note 13 – Cash and cash equivalents
Specification of cash and cash equivalents
NOK thousands
Bank deposits - NOK
Bank deposits - USD
Bank deposits - EUR
Bank deposits - GBP
Cash and cash equivalents
2014
513,807
1
2
2
513,812
2013
415,307
1
1
6
415,314
2014
491
191,497
2013
447
196,575
Restricted cash included in the above
NOK thousands
Customary withholding tax in relation to employee benefits
Debt service requirements (12 months interest obligation)
All cash and cash equivalents are bank deposits. NOK 99 million of the bank deposits in 2013
related to a 12 month time-deposit which expired on 24 October 2014.
- 25 - | P a g e
Njord Gas Infrastructure Holding AS
Note 14 – Share capital
Movements in share capital
Opening balance 1 January 2013
Capital decrease in 2013 through reduction of nominal amount
Ending balance at 31 December 2013
Ending balance at 31 December 2014
Number of
Share capital
shares
(NOK thousands)
9,145,250
457,263
0
(228,631)
9,145,250
228,631
9,145,250
228,631
The share capital is denominated in NOK, and the nominal value per share NOK 25 (NOK
25). All issued shares are of equal rights. No potential shares, such as share options, were
issued as of 31 December 2014.
Shareholders as of 31 December 2014
UBS International Infrastructure Fund Holding Coöperatie UA
CDC Infrastructure SA
Total number of shares
Shares
7,499,105
1,646,145
9,145,250
Ownership
82.0 %
18.0 %
100.0 %
Dividends paid and proposed
Dividend of NOK 350,000,000 (NOK 308,305,767) was paid during the year. Dividend of
NOK 150,000,000 (NOK 16.40 per share) will be proposed for the ordinary general meeting
in 2015. The proposed dividend is not recognized as a liability in the financial statements as at
31 December 2014.
Fund for unrealized gains
At balance sheet date, the fund for unrealized gains amounted to NOK 124,887,747
(NOK 67,415,454)
- 26 - | P a g e
Njord Gas Infrastructure Holding AS
Note 15 – Shareholder loans and bond loans
To finance the acquisition of the interest in Gassled, the Group has entered into several loan
agreements. The bond loans were issued on 9 June 2011 and are listed on the Oslo Stock
Exchange. Interest is paid semi-annually in arrears. In August 2013, the Group bought back
GBP 28 million of the GBP nominal bond loan which are held as treasury bonds. The
following tables summarize the contracts and the carrying amounts are provided in Note 17.
Summary of contracts
Loan
NOK real bond loan (1)
NOK nominal bond loan (2)
GBP nominal bond loan (3)
USD nominal bond loan (4)
Nominal
amount
remaining
NOKm 279
NOKm 550
GBPm 137
USDm 265
Interest
rate
4.3000%
6.1525%
5.2410%
5.1000%
Maturity
30 Sept. 2027
30 Sept. 2027
30 Sept. 2027
30 Sept. 2027
Category
Amortized cost
FVTPL
FVTPL
FVTPL
NOK shareholder loans
NOKm 174
6.0000%
30 Sept. 2028
Amortized cost
(1) Series 1 - NOK Index Linked Bond Issue 2011/2027 - ISIN NO 001 060768.2
(2) Series 2 - NOK Senior Secured Bond Issue 2011/2027 - ISIN NO 001 060769.0
(3) Series 3 - GBP Senior Secured Bond Issue 2011/2027 - ISIN NO 001 061111.4 (excluding treasury bonds)
(4) Series 4 - USD Senior Secured Bond Issue 2011/2027 - ISIN NO 001 061112.2
Guarantee
Njord Gas Infrastructure Holding AS, the parent company, has provided a guarantee for all of
Njord Gas Infrastructure AS' obligations and liabilities under its loan arrangements. The
guarantee consists of a pledge in the parent company’s shares and assigned receivables in
Njord Gas Infrastructure AS.
Assets pledged as security
The Group has entered into market conventional security arrangements in relation to its
lenders and swap providers on a first priority basis over its assets; inter alia its ownership
share in Gassled and related insurances and receivables. The carrying amount of the secured
assets were NOK 6.4 billion (NOK 5.8 billion) at balance sheet date.
Undrawn credit facilities
The Group has available to it, subject to customary conditions precedent, a NOK 250 million
revolving credit facility. The facility is subject to a floating interest charge and expires on 18
December 2017. No drawdown was made under the credit facility at balance sheet date.
- 27 - | P a g e
Njord Gas Infrastructure Holding AS
Note 16 – Trade and other payables
Specification of trade and other payables
NOK thousands
Joint Venture payables
Other accruals and provisions
VAT payable
Trade payables
Salary related provisions
Total trade and other payables
2014
150,156
4,452
0
1,452
2,268
158,328
2013
96,382
292
9,146
1,677
1,523
109,019
Terms and conditions for trade and other payables
Trade payables are non-interest bearing and are normally settled on 30-day terms. All other
payables are settled as they fall due.
- 28 - | P a g e
Njord Gas Infrastructure Holding AS
Note 17 – Financial instruments and risk management
Financial instruments by category
NOK thousands
Year ended 31 December 2014
Loans and
Fair value through
Total carrying
Financial assets
receivables
profit or loss
amount
Derivative financial instruments (1)
0
888,117
888,117
Joint Venture receivables
104,298
0
104,298
Cash and cash equivalents
513,812
0
513,812
Total
618,109
888,117
1,506,226
(1) The capitalized loss at inception is included as part of the financial instrument (ref. Note 11)
Fair value through
Financial liabilities
Amortized cost
profit or loss
Trade payables (1)
1,452
0
Joint Venture payables
150,156
0
Bond loans (2)
300,686
3,784,526
Shareholder loans
176,260
0
Derivative financial instruments
0
10,226
Total
628,554
3,794,752
(1) Other payables are not included
(2) Three of the four bond loans are recognized at FVTPL (ref. Note 15)
Total carrying
amount
1,452
150,156
4,085,212
176,260
10,226
4,423,306
Year ended 31 December 2013
Loans and
Fair value through
Total carrying
Financial assets
receivables
profit or loss
amount
Derivative financial instruments (1)
0
261,746
261,746
Joint Venture receivables
62,431
0
62,431
Cash and cash equivalents
415,219
0
415,219
Total
477,650
261,746
739,396
(1) The capitalized loss at inception is included as part of the financial instrument (ref. Note 11)
Fair value through
Financial liabilities
Amortized cost
profit or loss
Trade payables (1)
1,675
0
Joint Venture payables
96,382
0
Bond loans (2)
303,078
3,340,533
Shareholder loans
166,188
0
Derivative financial instruments
0
43,161
Total
567,323
3,383,694
(1) Other payables are not included
(2) Three of the four bond loans are recognized at FVTPL (ref. Note 15)
Total carrying
amount
1,675
96,382
3,643,611
166,188
43,161
3,951,017
- 29 - | P a g e
Njord Gas Infrastructure Holding AS
Fair value of financial instruments
The fair value of financial instruments that is recognized at FVTPL in the financial statements
is provided in the table "financial instruments by category" in the previous table. The carrying
amounts of financial instruments recognized at amortized cost in the financial statements
approximate their fair values except as detailed below.
2014
2013
Carrying amount
Carrying amount
NOK thousands
at amortized cost
Fair value
at amortized cost Fair value
NOKm 300 real bond loan
300,686
289,368
303,078
294,008
Shareholder loans (1)
176,260
164,170
166,188
159,296
(1) Fair value calculations are provided under the assumption that no interest or principal will be paid untill
final maturity (ref. Note 15). However, the Group may choose to repay the loans in part or full at any time.
Fair value measurements
The following table provides an analysis of financial instruments that are measured at fair
value, grouped into Levels 1 to 3 based on the degree to which the fair value is observable:
NOK thousands
Assets
Derivative financial assets
Level 1
Level 2
Level 3
31 December 2014
0
0
888,117
Derivative financial assets
31 December 2013
0
0
261,746
Liabilities
Derivative financial liabilities
31 December 2014
Bond loans recognized at FVTPL
31 December 2014
Bond loans and shareholder loans (1) 31 December 2014
0
0
0
0
3,784,526
453,538
10,226
0
0
Derivative financial liabilities
31 December 2013
0
0
43,161
Bond loans recognized at FVTPL
31 December 2013
0
3,340,533
0
Bond loans and shareholder loans (1) 31 December 2013
0
453,304
0
(1) Fair value is calculated only for disclosure purpose, since these loans are recognised at amortized cost.
Level 1 - Fair value measurements derived from quoted prices (unadjusted) in active
markets for identical assets or liabilities.
Level 2 - Fair value measurements derived from inputs other than quoted prices included
within Level 1 that are observable for the asset or liability, either directly (i.e. as
prices) or indirectly (i.e. derived from prices).
Level 3 - Fair value measurements derived from valuation techniques that include inputs for
the asset or liability that are not based on observable market data (unobservable
inputs).
In relation to the Level 3 derivative financial asset/liability, see Note 11 for a reconciliation of
changes in fair value during the year.
In relation to the Level 2 financial liability, a loss of NOK 635,174 (a gain of NOK 157,990
thousand) was recognized during the year (ref. Note 7). With exception of the GBP 28 million
bonds bought back in 2013 and currently held as treasury bonds (ref. Note 15), the Group still
holds this liability at balance sheet date.
- 30 - | P a g e
Njord Gas Infrastructure Holding AS
Financial risk management
Overview
The Group is exposed to a variety of risks from its use of financial instruments, including
credit risk, liquidity risk, interest rate risk and currency risk. This note presents information
about the Group's exposure to each of the above mentioned risks, and the Group's objectives,
policies and processes for managing such risks. At the end of this note, information regarding
the Group's capital management is provided.
Market risk from financial instruments
Market risk is the risk that the fair value of future cash flows of a financial instrument will
fluctuate because of changes in market prices. Market prices comprise three types of risk:
market risk (e.g. interest rate risk and currency risk), commodity price risk and other price
risk. The Group's financial assets and liabilities are mainly exposed to interest rate and
currency risks.
a) Interest rate risk
Interest rate risk is the risk that the fair value or future cash flows of a financial instrument
will fluctuate because of changes in market interest rates. The Group's interest risk arises from
long-term borrowings. Borrowings issued at variable rates expose it to cash flow risk.
Borrowings issued at fixed rates expose it to fair value interest rate risk.
All of the Group's revenues are from its investment in the Joint Venture, the majority of
which are NOK denominated and subject to annual inflation adjustments. In order to
synchronize its debt service with its revenue base, the Group's policy is to maintain its
borrowing exposures in NOK denominated inflation linked instruments. Three out of four of
the Group's bond loan series are denominated in nominal NOK, GBP and USD (ref. Note 15).
In order to reduce its cash flow risk, the Group has entered into three series of swap
arrangements (ref. Note 11) that effectively swaps the nominal currency bond positions into
NOK denominated inflation linked positions. Quantitative data on the sensitivities of the
Group's net position is included in Note 3.
b) Foreign currency risk
Foreign currency risk is the risk that the fair value or future cash flows of a financial
instrument will fluctuate because of changes in foreign exchange rates. The Group is
primarily exposed to foreign exchange risk arising from various currency exposures with
respect to USD, EUR and GBP in relation to its debt obligations as well as from certain
commercial transactions. As described above, the Group has entered into swap arrangements
to hedge its currency exposures arising from its debt obligations (ref. Note 11).
For operational transactions denominated in foreign currencies, the Group's policy is to
exchange into foreign currency as required on a spot basis.
Accounting risk/mismatch
The majority of the Group’s revenues are NOK denominated and subject to annual inflation
adjustments. In order to synchronize its debt exposure to its cash flows from operations (ref.
Note 17), the Group has entered into three series of swap arrangements (ref. Note 11). Each
series of swaps replicate perfectly the three nominal bond series so that the Group effectively
has swapped all of its nominal bond positions into a NOK denominated inflation linked
position.
- 31 - | P a g e
Njord Gas Infrastructure Holding AS
It is the management’s expectation that the concept of converting the three nominal bond
series into a synthetic NOK denominated inflation linked position provides an effective
hedging of the Group’s overall cash flow position. However, the synthetic position creates an
accounting exposure/mismatch that is distinct and separate from the underlying economic
exposure of the Group and that would not arise for a conventional NOK denominated
inflation linked bond position recognized at amortized cost.
During 2013, the net adverse effect of the NOK swap rates reducing in the near term and
increasing in the long term was more than offset by the impact of the change in credit spread.
During 2014, the weakened NOK increased the fair value of the bonds, which was partly
offset by an increase in the fair value of the swaps. The adverse effect of the NOK swap rates
continuing to reduce in 2014 was more than offset by the impact of the change in credit
spread as further described in Note 3. These effect are due to the FVTPL approach applied for
the recognition of the bonds and swaps requires the Group to value the financial instruments
marked-to-market and thus recognizing the full unrealized change in fair value of the financial
instruments in the income statement immediately. In reality however, those exposures are
matched against the operating cash flows which will be recognized in the income statement as
incurred.
Credit risk
The carrying amounts of financial assets represent the Group's maximum credit exposure.
Except for derivative instruments and cash and cash equivalents, the Group is only exposed to
credit risk related to receivables owned trough the Joint Venture. Receivables owned through
the Joint Venture are receivable from large, solid oil and gas companies. The counterparty to
the cash and cash equivalents and the derivative instruments are large banks with solid credit
ratings. The Group monitors the credit ratings of its main counterparties on an ongoing basis.
Capital management
A key objective in relation to capital management is to ensure that the Group maintains a
sufficient capital structure in order to support its business development and credit rating. The
Group evaluates its capital structure in light of current and projected cash flows, potential new
business opportunities and the Group's financial commitments. In order to maintain or adjust
the capital structure, the Group may issue new shares or bonds or return capital to
shareholders.
The Group maintains and monitors its cash flow forecasting to ensure it has sufficient cash to
meet operational needs and financial obligations. Such forecasting takes into consideration the
Group's debt financing plans and compliance. The Group also has committed credit lines
available to it (ref. Note 15). The Group's debt facilities are subject to customary covenant
requirements. The Group has not been in breach of any such requirements during the year.
Liquidity risk
Liquidity risk is the risk of being unable to pay financial liabilities as they fall due. The
Group’s approach to managing liquidity risk is to ensure that it will always have sufficient
liquidity to meet its financial liabilities as they fall due, under normal as well as extraordinary
circumstances, without incurring unacceptable losses or risking damage to the Group's
reputation. Prudent liquidity risk management implies maintaining sufficient cash and the
availability of appropriate funding.
- 32 - | P a g e
Njord Gas Infrastructure Holding AS
Maturities of liabilities
The following table details the contractual maturities for the Group's financial liabilities. The
table includes amounts for both principal and interest payments. The contractual amounts
were estimated based on an assumption of no inflation beyond confirmed adjustments and
market exchange rates prevailing at balance sheet date. Estimate liabilities from derivative
financial instruments (ref. Note 7 and 11) are presented on a net basis.
Per 31 December 2014
More than
Less than
3 to 12
1 to 5
5 years
NOK thousands
3 months
months
years
Total
Trade and other payables
(1,451)
0
0
0
(1,451)
Bond loans, interest and principal
(129,582)
(305,208)
(1,997,906)
(3,696,672)
(6,129,368)
Derivative financial instruments
(43,513)
38,582
315,004
1,010,222
1,320,295
Shareholder loans (1)
0
0
0
321,675
321,675
Total liabilities
(174,546)
(266,626)
(1,682,901) (2,364,775) (4,488,849)
(1) Calculations are provided under the assumption that no interest or principal will be paid untill final maturity (ref. Note
15). However, the Group may choose to repay the loans in part or full at any time.
Per 31 December 2013
More than
Less than
3 to 12
1 to 5
5 years
NOK thousands
3 months
months
years
Total
Trade and other payables
(1,675)
0
0
0
(1,675)
Bond loans, interest and principal
(103,056)
(108,773)
(1,718,883)
(3,618,643)
(5,549,356)
Derivative financial instruments
(15,080)
(76,932)
(13,567)
655,909
550,330
Shareholder loans (1)
0
0
0
(313,265)
(313,265)
Total liabilities
(119,811)
(185,705)
(1,732,450) (3,275,999) (5,313,966)
(1) Calculations are provided under the assumption that no interest or principal will be paid untill final maturity (ref. Note
15). However, the Group may choose to repay the loans in part or full at any time.
- 33 - | P a g e
Njord Gas Infrastructure Holding AS
Note 18 – Related party disclosure
Purchases from related parties
Year ended
Year ended
31 December 2014 31 December 2013
133
383
97
194
2,656
2,094
Related party
UBS International Infrastructure Fund Holding Coöperatie UA (1)
CDC Infrastructure SA (1)
Sandvold Energy AS (100% owned by the Chairman of the Board)
Amounts above are exclusive of VAT and include refunds
(1) The purchases relate to rebilling of expenses incurred in relation to the management of Njord Gas
Infrastructure AS.
Balances with related parties
Information regarding loans from related parties is provided in Note 15 and 17. Information
regarding swap arrangements with related parties is provided in Note 11 and 17. Information
regarding other balances with related parties is provided in the following table:
NOK thousands
Related party
UBS International Infrastructure Fund Holding Coöperatie UA - trade payables
CDC Infrastructure SA
Sandvold Energy AS (100% owned by the Chairman of the Board) - trade payables
Year ended
Year ended
31 December 2014 31 December 2013
90
130
30
0
123
213
Compensation to key management
NOK thousands
Year ended 31 December 2014
Position
Birte Norheim (CEO from April 2014) (1)
Jarle Joa (Finance Director) (2)
Arnulf Østensen (Technical & HSE Director)
Dan Jarle Flølo (CEO until April 2014) (3)
Total
Salary
2,271
455
1,361
2,540
4,087
Pension
contribution
79
32
34
21
145
Other
remuneration
19
8
22
1
49
Total 2014
2,369
495
1,417
2,562
4,281
(1) Birte Norheim commenced as CEO on 11 April 2014. Prior to this Birte Norheim was the Group’s Finance
Director
(2) Jarle Joa commenced as Finance Director on 20 August 2014
(3) Dan Jarle Flølo was CEO until 11 April 2014
Year ended 31 December 2013
Position
Dan Jarle Flørlo (CEO)
Birte Norheim (Finance Director)
Arnulf Østensen (Technical & HSE Director
Total
Salary
1,978
1,682
1,328
4,988
Pension
contribution
73
74
34
181
Other
remuneration
27
28
33
87
Total 2013
2,078
1,784
1,394
5,257
Compensation to Board of Directors
NOK 100 thousands (NOK 100 thousands) was recognized as remuneration of the Chairman
for the year.
- 34 - | P a g e
Njord Gas Infrastructure Holding AS
Note 19– Operating leases
The Group’s long term office rental agreement expired in October 2013 and was renewed in
August 2014, and the Group had therefore no contractual future lease obligations as per 31
December 2013. The contract expires in August 2024, with an option to terminate in August
2019.
Operating expense related to lease agreements accounted for as operating leases
NOK thousands
Office rental
Other
Total
2014
568
46
613
2013
511
63
573
2014
560
2,240
2,613
5,413
2013
0
0
0
0
Future minimum lease payments under office lease
NOK thousands
Within 1 year
1 to 5 years
After 5 years
Total
Note 20– Capital commitments
Information regarding the Group's share of planned investment in gas transportation and
processing facilities is provided in Note 9.
- 35 - | P a g e
Njord Gas Infrastructure Holding AS
NJORD GAS INFRASTRUCTURE HOLDING AS
Page
Income statement
Statement of financial position
Statement of cash flow
Board of Director’s report
37
38
39
2
Note
Note
General information
Summary of significant accounting policies
Basis for preparation
Shares in subsidiaries
Foreign currency
Loans and receivables
Taxes
Related party disclosure
Remuneration of auditor
Income tax expense
Shares in subsidiaries
Reconciliation of equity
Share capital
Trade and other payables
Events after balance sheet date
40
40
40
40
40
40
41
41
41
42
42
43
43
44
44
Responsibility statement
Auditor’s report
45
46
Note
Note
Note
Note
Note
Note
Note
Note
1
2
2.1
2.2
2.3
2.4
2.5
3
4
5
6
7
8
9
10
-
- 36 - | P a g e
Njord Gas Infrastructure Holding AS
Income statement
NOK thousands
Note
Operating income
Year ended
31 December 2014
Year ended
31 December 2013
0
0
(29)
(255)
(283)
(29)
(268)
(296)
(283)
(296)
Financial income and expense
Finance income
Finance expense
Net financial income/(expense)
232,309
(61)
232,248
238,783
(40)
238,744
Net income/(loss) before taxes
231,964
238,447
91
232,056
84
238,532
Operating expense
Employee benefit expense
Other operating expense
Total operating expense
3
4
Operating income/(loss)
Income tax credit/(expense)
Net income/(loss) for the period
5
- 37 - | P a g e
Njord Gas Infrastructure Holding AS
Statement of financial position
NOK thousands
Note
Assets
Non-current assets
Deferred tax asset
Investments in subsidiaries
Total non-current assets
5
6
Retained earnings
Other equity
Total equity
Liabilities
Non-current liabilities
Loan from subsidiary
Total non-current liabilities
Current liabilities
Dividend payable
Trade and other payables
Total current liabilities
Total liabilities
Total equity and liabilities
As at
31 December 2013
356
577,175
577,531
265
594,872
595,137
150,000
38
150,038
727,569
250,000
96
250,096
845,232
7/8
7/8
228,631
265,655
494,286
228,631
365,655
594,286
7
82,056
576,342
0
594,286
3
1,198
1,198
916
916
150,000
29
150,029
151,227
727,569
250,000
30
250,030
250,946
845,232
Current assets
Dividend receivables
Cash and cash equivalents
Total current assets
Total assets
Equity and liabilities
Equity
Share capital
Other paid in capital
Total paid in capital
As at
31 December 2014
9
Stavanger, 26 March 2015
The Board of Directors of Njord Gas Infrastructure Holding AS
Tore I. Sandvold
Chairman
Gautier M. J. F Chatelus
Director
Paul J. Moy
Director
Mark A. Gilligan
Director
Birte Norheim
CEO
- 38 - | P a g e
Njord Gas Infrastructure Holding AS
Statement of cash flow
NOK thousands
Cash flows from operating activities
Net income/(loss) before taxes
Dividends recognised as finance income
Interest expenses and finance expenses not paid
Changes in trade and other payables
Net cash flow from/(used in) operating activities
Note
3
9
Year ended
Year ended
31 December 2014 31 December 2013
231,964
(232,303)
61
(1)
(278)
238,447
(238,783)
40
(11)
(307)
350,000
308,306
350,000
308,306
221
(350,000)
(349,779)
400
(308,306)
(307,906)
(57)
96
39
93
3
96
Cash flows from investing activities
Dividends received
Net cash flow from/(used in) investing activities
Cash flows from financing activities
Loan from subsidiary
Dividends paid
Net cash flow used in financing activities
Net change in cash and cash equivalents
Cash and cash equivalents at the beginning of the period
Cash and cash equivalents at the end of the period
- 39 - | P a g e
Njord Gas Infrastructure Holding AS
Notes to the accounts
Note 1 – General information
Njord Gas Infrastructure Holding AS’ (the ‘Holding Company’) main business is long-term
investment in gas infrastructure serving the Norwegian continental shelf. The Holding
Company is a Norwegian private limited liability company headquartered in Stavanger,
Norway. The Group’s main activities are carried out through its Norwegian subsidiary, Njord
Gas Infrastructure AS, which holds an 8.036% interest in Gassled, which owns the Norwegian
gas transport infrastructure.
The financial statements were authorized for issue by the Board of Directors on 26 March
2015.
All amounts in the financial statements are stated in Norwegian Kroner (‘NOK’) thousands
unless stated otherwise. Comparable figures from prior year are provided in brackets.
Note 2 - Summary of significant accounting principles
2.1
Basis for preparation
The financial statements for Njord Gas Infrastructure Holding AS have been prepared in
accordance with the provisions of the Norwegian Accounting Act and generally accepted
accounting practices in Norway (“N-GAAP”).
2.2
Shares in subsidiaries
Shares in subsidiaries are measured using the cost method of accounting in the parent
company accounts. Investments are valued at the acquisition cost of the shares unless
impairment losses have been made.
Shares in subsidiaries are impaired to fair value when a decrease in value is not considered to
be temporary. Impairment losses are reversed when the reason for the impairment no longer
applies.
Dividend from subsidiaries that represents distribution of retained earnings from its subsidiary
is recognized as a finance income in the income statement. Dividends that represents
distribution of capital previously paid-in by the subsidiary, is recognized as a reduction of its
cost of investments in subsidiaries.
2.3
Foreign currency
The functional currency of the Holding Company is NOK. Monetary assets and liabilities
denominated in other currencies are translated at exchange rates prevailing at balance sheet
date. Foreign currency revenues and expenses are translated at exchange rates prevailing at
transaction date. Realized and unrealized gains and losses resulting from foreign exchange are
recognized in the income statement as incurred.
2.4
Loans and receivables
Loans and receivables are non-derivative financial assets with fixed or determinable payments
that are not quoted in an active market. Loans and receivables are initially recognized at fair
value plus any transaction costs. After initial measurement, the assets are subsequently
- 40 - | P a g e
Njord Gas Infrastructure Holding AS
measured at amortized cost using the effective interest rate method (if the amortization effect
is material), less any impairment losses.
2.5
Taxes
Income taxes for the period comprise tax payable and changes in deferred tax.
Tax is recognized in the income statement, except to the extent that it relates to items
recognized in other comprehensive income or directly in equity.
Deferred tax assets and liabilities are calculated on the basis of existing temporary differences
between the carrying amounts of assets and liabilities in the financial statement and their tax
bases, together with tax losses carried forward at the balance sheet date.
Deferred tax assets are recognized only to the extent that it is probable that future taxable
profits will be available against which the assets can be utilized.
Note 3 – Related party disclosure
Compensation to the Board of Directors
NOK 25 thousands (NOK 25 thousands) was recognized as remuneration of the Chairman for
the year.
The Holding Company does not have any employees.
Loan from subsidiary
The Holding Company has a loan from its subsidiary with an outstanding balance of NOK
1,198 thousands (NOK 916 thousands) at balance sheet date. The final repayment date on the
loan is 30 September 2028.
During the year, the Holding Company was charged NOK 100 thousands (NOK 100
thousands) in relation to intercompany services from its subsidiary.
Note 4 – Remuneration of auditor
Specification of remuneration to the auditor
NOK thousands
Statutory audit
Total auditor's fees incl. VAT
2014
22
22
2013
20
20
- 41 - | P a g e
Njord Gas Infrastructure Holding AS
Note 5 – Income tax expense
Income taxes recognized in the income statement
NOK thousands
Income tax credit
Income tax credit/(expense)
Reconciliation of income tax
NOK thousands
Profit/(loss) before income taxes
Expected income tax at nominal tax rate (27 % / 28%)
Permanent differences
Change in tax rate deferred tax
Total income tax credit/(expense) recognized in the income statement
Temporary differences relate to the following items:
NOK thousands
Tax losses carried forward 27 %
Basis deferred tax asset
Deferred tax asset not recognized
Deferred tax asset recognized in balance sheet
2014
91
91
2013
84
84
2014
231,964
(62,630)
62,722
0
91
2013
238,447
(66,765)
66,859
(10)
84
2014
1,319
1,319
2013
980
980
0
356
0
265
Capitalization of deferred income tax assets is subject to strict requirements in respect of the
ability to substantiate that sufficient taxable profit will be available against which the unused
tax losses can be utilized.
Note 6 – Shares in subsidiaries
Shareholding in subsidiaries
Company
Njord Gas Infrastructure AS
Country of
incorporation
Norway
% of equity
and voting
100
Reconciliation of acquisition cost
NOK thousands
Acquisition cost
Dividend received (from paid in capital)
Net value recognized in balance sheet
2014
914,395
(337,220)
577,175
2013
914,395
(319,523)
594,872
Guarantee issued
The Holding Company has provided a guarantee for all of Njord Gas Infrastructure AS'
obligations and liabilities under its loan arrangements. The guarantee consists of a pledge in
the Holding Company’s shareholding and assigned receivables in Njord Gas Infrastructure
AS.
- 42 - | P a g e
Njord Gas Infrastructure Holding AS
Note 7 – Reconciliation of equity
NOK thousands
Total equity as at 1 January 2013
Reduction nominal value per share
Additional dividend paid during 2013
Proposed dividend
Net income for the year
Total equity as at 31 December 2013
Share capital
457,263
(228,631)
0
0
0
228,631
Other paid in
capital
368,957
228,631
(220,000)
(11,933)
0
365,655
Other equity
(464)
0
0
(238,067)
238,532
0
Total equity
825,755
0
(220,000)
(250,000)
238,532
594,286
Total equity as at 1 January 2014
Additional dividend paid during 2014
Proposed dividend
Net income for the year
Total equity as at 31 December 2014
228,631
0
0
0
228,631
365,655
(100,000)
0
0
265,655
0
0
(150,000)
232,056
82,056
594,286
(100,000)
(150,000)
232,056
576,342
Note 8 – Share capital
Movements in share capital
NOK thousands
Issued as at 1 January 2013
Reduction of nominal value per share
End balance at 31 December 2013
Number of
shares
9,145,250
0
9,145,250
Share capital
457,263
(228,631)
228,631
End balance at 31 December 2014
9,145,250
228,631
The share capital is denominated in NOK and the nominal value per share is NOK 25 (NOK
25). All issued shares are of equal rights. No potential shares, such as share options, were
issued as of 31 December 2014.
Net profit per share for the year was NOK 25.37 (profit of NOK 26.08).
Shareholders as of 31 December 2014
UBS International Infrastructure Fund Holding Coöperatie UA
CDC Infrastructure SA
TOTAL
Shares
7,499,105
1,646,145
9,145,250
Ownership
82.0 %
18.0 %
100.0 %
Dividends paid and proposed
Dividend of NOK 350,000,000 (NOK 308,305,767)) was paid during the year. Dividend of
NOK 150,000,000 will be proposed for the ordinary general meeting in 2015. The proposed
dividend is recognized as a liability in the financial statements at balance sheet date.
- 43 - | P a g e
Njord Gas Infrastructure Holding AS
Note 9 – Trade and other payables
Specification of trade and other payables
NOK thousands
Trade payables
Other accruals and provisions
Total trade and other payables
2014
0
29
29
2013
1
29
30
- 44 - | P a g e
Njord Gas Infrastructure Holding AS
Responsibility statement
We confirm, to the best of our knowledge, that the financial statements for the period 1
January to 31 December 2014 have been prepared in accordance with current applicable
accounting standards, and give a true and fair view of the assets, liabilities, financial position
and income statement of the Holding Company and the consolidated Group.
We also confirm that the Board of Directors’ Report includes a true and fair review of the
development and performance of the business and the position of the Holding Company and
the Group, together with a description of the principal risks and uncertainties facing Njord
Gas Infrastructure Holding AS and the Group.
Stavanger, 31 December 2014/26 March 2015
The Board of Directors of Njord Gas Infrastructure Holding AS
Tore I. Sandvold
Chairman
Gautier M. J. F Chatelus
Director
Paul J. Moy
Director
Mark A. Gilligan
Director
Birte Norheim
CEO
- 45 - | P a g e


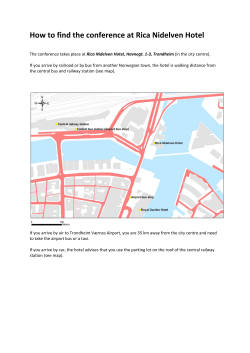


© Copyright 2026