
Penis size interacts with body shape and height Brian S. Mautz
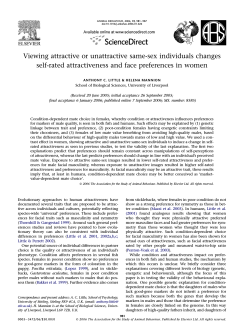
Penis size interacts with body shape and height
to influence male attractiveness
Brian S. Mautza,1,2, Bob B. M. Wongb, Richard A. Petersc, and Michael D. Jennionsa
a
Research School of Biology, Australian National University, Canberra, ACT 0200, Australia; bSchool of Biological Sciences, Monash University, Melbourne,
VIC 3800, Australia; and cDepartment of Zoology, La Trobe University, Bundoora, VIC 3086, Australia
Compelling evidence from many animal taxa indicates that male
genitalia are often under postcopulatory sexual selection for characteristics that increase a male’s relative fertilization success. There
could, however, also be direct precopulatory female mate choice
based on male genital traits. Before clothing, the nonretractable
human penis would have been conspicuous to potential mates. This
observation has generated suggestions that human penis size
partly evolved because of female choice. Here we show, based upon
female assessment of digitally projected life-size, computer-generated
images, that penis size interacts with body shape and height to
determine male sexual attractiveness. Positive linear selection was
detected for penis size, but the marginal increase in attractiveness
eventually declined with greater penis size (i.e., quadratic selection).
Penis size had a stronger effect on attractiveness in taller men than
in shorter men. There was a similar increase in the positive effect of
penis size on attractiveness with a more masculine body shape (i.e.,
greater shoulder-to-hip ratio). Surprisingly, larger penis size and
greater height had almost equivalent positive effects on male attractiveness. Our results support the hypothesis that female mate
choice could have driven the evolution of larger penises in humans.
More broadly, our results show that precopulatory sexual selection
can play a role in the evolution of genital traits.
genital evolution
| multivariate attractiveness | multiple cues
M
ale genitalia show great variation among closely related
species (1). This variation is typically attributed to copulatory
and postcopulatory sexual selection to increase male fertilization
success under sperm competition (2) or cryptic female choice (3).
There might, however, also be premating sexual selection on male
genitalia. Precopulatory processes can influence genital morphology (4, 5), but it is unknown whether these results are due to
direct female choice or sexual conflict. In species where genitalia
are externally visible, sexual selection might also act if females
prefer males with specific genital morphology. Despite this potential effect, relatively little research has tested whether primary
sexual characters influence male attractiveness (6–8).
How female choice acts on any given male trait, and hence the
strength and direction of selection, can be influenced by several,
nonmutually exclusive factors. First, females use multiple cues
during the mate choice process (9). Overall male attractiveness is
unlikely to be determined by individual traits (e.g., refs. 10 and 11),
so manipulating traits in isolation can lead to faulty conclusions
about net male attractiveness (but see also ref. 12). Second, traits
within individuals are phenotypically and genetically correlated.
These relationships can influence evolution via correlational selection (13). Third, there might be a size contrast effect such that
female assessment of attractiveness varies if the trait of interest
is viewed differently in relation to other traits, analogous to the
Ebbinghaus–Titchener effect (14). For example, the same sized
penis might be perceived differently on short and tall men. Finally,
a female’s own phenotype might influence her mate choice decisions. Humans mate assortatively based on numerous traits, including height (15), facial symmetry (16), and body shape (17, 18).
Hence, it is likely that how a female rates a male’s attractiveness
will partly depend upon her own phenotype.
www.pnas.org/cgi/doi/10.1073/pnas.1219361110
The upright body posture and protruding, nonretractable genitalia of male humans make the penis particularly conspicuous,
even when flaccid. This observation has generated suggestions by
evolutionary biologists that the comparatively large human penis
evolved under premating sexual selection (19, 20). Furthermore,
novels, magazines, and popular articles often allude to the existence of a relationship between penis size and sexual attractiveness or masculinity (21, 22). Many cultures have fashion items,
like penis sheaths and codpieces, that draw attention toward male
genitalia (20), highlighting the potential for female choice to
influence the evolution of male genitalia. There are numerous
psychological studies directly asking females for their preference
regarding male penis size. The results are mixed, with studies
finding that females prefer longer penises (23), wider penises
(24, 25), or that penis size is unimportant (26). These studies,
however, all use self-reported, direct questioning and are
therefore susceptible to biases of self-censorship and pressure to
conform to socially desirable responses to sensitive issues (e.g.,
refs. 27–29).
The only scientific studies to attempt to test experimentally
whether flaccid penis length affects male attractiveness asked
women to rate five images created by modifying a single drawing
of a male figure so that the test figures differed only in penis
length (30–32). These important studies were not designed to
quantify directly the relative effect of penis length on attractiveness
compared with other sexually selected male traits, such as height
and body shape (30–32). Therefore, it is still unknown whether
penis size affects attractiveness when there is substantive variation in other, arguably more important, body traits, or whether
interactions between these traits and penis size determine net
attractiveness. For example, does a given increase in penis length
have an equivalent effect on the attractiveness of a short and tall
man? In addition, the use of small photographs to quantify sizebased preferences might lead to different estimates than those
obtained when viewing fully life-sized male bodies.
To address these issues, we presented a sample of heterosexual
Australian women with projected life-size, computer-generated
male figures (Fig. 1). Each figure was an animated 4-s video in
which the figure rotated 30° to each side to allow participants to
more easily evaluate the figure. We tested for the effects of flaccid
penis size, body shape (shoulder-to-hip ratio), and height on male
sexual attractiveness. The latter two traits have regularly been
investigated and are known to influence male attractiveness or
reproductive success [height (15, 33–35), shape (18, 36, 37)]. Each
trait had seven possible values that were within the natural range
Author contributions: B.S.M., B.B.M.W., R.A.P., and M.D.J. designed research; B.S.M.,
B.B.M.W., R.A.P., and M.D.J. performed research; B.S.M. and M.D.J. analyzed data; and
B.S.M., B.B.M.W., R.A.P., and M.D.J. wrote the paper.
The authors declare no conflict of interest.
This article is a PNAS Direct Submission.
1
Present address: Department of Biology, University of Ottawa, Ottawa, ON, Canada
K1N 6N5.
2
To whom correspondence should be addressed. E-mail: [email protected].
This article contains supporting information online at www.pnas.org/lookup/suppl/doi:10.
1073/pnas.1219361110/-/DCSupplemental.
PNAS | April 23, 2013 | vol. 110 | no. 17 | 6925–6930
EVOLUTION
Edited by Wyatt W. Anderson, University of Georgia, Athens, GA, and approved February 28, 2013 (received for review November 6, 2012)
size (Table 1). There were diminishing returns to increased
height, penis size, and shoulder-to-hip ratio (quadratic selection:
P = 0.010, 0.006 and < 0.0001) [“B” in Table 1] and, given the
good fit of the linear and quadratic models, the optimum values
appear to lie outside the tested range (i.e., maxima are >2 SD
from the population mean for each trait) (Fig. 2). A model using
only linear and quadratic selection on the shoulder-to-hip ratio
accounted for 79.6% of variation in relative attractiveness scores
(centered to remove differences among women in their average
attractiveness scores). The explanatory power of height and penis
size when added separately to this model was almost identical.
Both traits significantly improved the fit of the model (log-likelihood
ratio tests: height: χ2 = 106.5, df = 3, P < 0.0001; penis: χ2 = 83.7,
df = 3, P < 0.0001). Each trait, respectively, explained an extra
6.1% and 5.1% of the total variation in relative attractiveness.
The effects of the three traits on relative attractiveness were not
independent because of correlational selection (all P < 0.013) [“B”
in Table 1]. Controlling for height, there was a small but significant
difference in the rate of increase in relative attractiveness with
penis size for a given shoulder-to-hip ratio (Fig. 3A). More compellingly, after controlling for shoulder-to-hip ratio, greater penis
size elevated relative attractiveness far more strongly for taller
men (Fig. 3B).
Fig. 1. Figures representing the most extreme height, shoulder-to-hip ratio,
and penis size (±2 SD) (Right and Left) in comparison with the average
(Center figure) trait values.
(±2 SD) based on survey data (36, 39). We generated figures for
all 343 (= 73) possible trait combinations by varying each trait
independently. This process eliminated any correlation between
the three traits across the set of figures. Penis width did, however,
covary positively with length in the program used to generate the
figures, so we refer to overall “penis size” (but see also Materials
and Methods). The women (n =105), who were not told which
traits varied, were then asked to sequentially view a random
subset of 53 figures, including 4 of the same control figure, and
to rate their attractiveness as sexual partners (Likert scale: 1–7).
Figure rating was conducted in the absence of an interviewer and
was completely anonymous. We then used a standard evolutionary
selection analyses to estimate multivariate linear, nonlinear, and
correlational (interactive) selection (using the attractiveness score
as a measure of “fitness”) arising from female sexual preferences
(e.g., ref. 38).
Results
Selection Analysis. There were highly significant positive linear
effects of height, penis size, and shoulder-to-hip ratio on male
attractiveness (Table 1). Linear selection was very strong on the
shoulder-to-hip ratio, with weaker selection on height and penis
Participant and Response Time Analysis. The average age of female
participants was 26.2 ± 6.8 SD y old. The participants were 71.8%
European, 20.9% Asian, and 7.3% from elsewhere with respect to
ethnic origins. Female height was positively correlated with the
linear effect that male height had on her rating of his relative
attractiveness (i.e., the linear selection gradient for height calculated separately for each female) (Pearson’s r = 0.292, P < 0.0001)
(Table 2). Females that were heavier than expected for their height
(i.e., high relative weight/body mass index) showed a stronger linear
effect of penis size on their rating of a male’s relative attractiveness
(Pearson’s r = 0.227, P < 0.021) (Table 2). Female age was not
correlated with the linear effect that any of the three male traits
had on her rating of a male’s relative attractiveness (all P > 0.164)
(Table 2). There was no effect of either the use of hormonal contraception or menstrual state on the linear effect of any of the three
male traits on how a female rated relative attractiveness (all P >
0.166) (Table S1). We note, however, that these tests have limited power to detect a cycle effect, as women were not repeatedly
surveyed during both the high and low fertility phases.
The average latency to respond and rank a figure when pooled
across all trials was 3.08 ± 0.028 s (mean ± SD) (n = 5,142).
Controlling for baseline variation in response time among women,
the response time was significantly greater for figures with a larger
penis (F1, 5034 = 15.099, P < 0.001), greater height (F1, 5034 =
23.819, P < 0.001), and a greater shoulder-to-hip ratio (F1, 5034 =
316.878, P < 0.001). Given that all three male traits were positively
Table 1. Linear selection gradients and the matrix of quadratic and correlational selection gradients based on
average rating for each of the 343 figures and means of gradients generated separately for each participant
γ
Linear (β)
Trait
Penis size
Shoulder-to-hip ratio
Height
Penis size
Shoulder-to-hip ratio
Height
A
B
A
B
A
B
A
B
0.249***
1.020***
0.269***
0.240***
1.021***
0.282***
−0.096***
0.072***
0.060***
−0.125**
0.061***
0.039*
−0.288***
0.085***
−0.284***
0.087***
−0.108***
−0.110**
Linear selection gradients (β) and the matrix (γ) of quadratic (on diagonal) and correlational (below diagonal) selection gradients (A)
based on average rating for each of the 343 figures (i.e., no control for multiple participant response; white) and (B) means of gradients
generated separately for each participant (i.e., control for participant identity; gray). P values for “A” are from the slope and SE
estimates from the multiple regression analysis; P values for “B” are from t tests for significant difference between the mean gradient
and zero. The dependent variable is the attractiveness score (see text for details). ***P < 0.001, **P < 0.01, *P < 0.02.
6926 | www.pnas.org/cgi/doi/10.1073/pnas.1219361110
Mautz et al.
patterns of actual mate choice (15, 37; but see also refs. 43 and
44). Our results corroborate previously reported quadratic relationships between male height and reproductive success (34, 45;
but see also refs. 33 and 35). Our results for shoulder-to-hip ratio
are also broadly consistent with previous attractiveness studies on
body shape (36, 46–48). Again, the correlations between response
time and height and shoulder-to-hip ratio, respectively, were both
significantly positive, indicating the females made quicker decisions
when viewing less attractive figures (40).
Our study found no significant difference in the proportion
of variance accounted for in our model by penis size and height
(6.1% vs. 5.1%), indicating that both traits had equivalent effects
on relative attractiveness. This finding is intriguing given that height
is one of the most widely investigated and well-documented traits
known to affect male reproductive success (15, 33–35, 37, 43, 44).
The finding suggests that selection on penis size is potentially as
Mautz et al.
12
10
8
Penis Size (cm)
6
1.20
1.25
1.30
1.35
1.40
1.45
Shoulder:Hip Ratio
10
EVOLUTION
12
B
8
Discussion
We found that flaccid penis size had a significant influence on male
attractiveness. Males with a larger penis were rated as being relatively more attractive. This relationship is nonlinear, however, indicating that the proportional increase in attractiveness begins to
decrease after a size of ∼7.6 cm (Fig. 2), which is an under-average
penis size based on a large-scale survey of Italian men (39). Although we detected quadratic selection on penis size, any potential
peak (i.e., the most attractive penis size) appears to fall outside the
range used in our study. A preference for a larger-than-average
penis is qualitatively consistent with some previous studies (30–32),
but our results differ in showing that the most attractive size appears
to lie more than 2 SDs from the mean (i.e., no evidence for stabilizing sexual selection, in contrast to refs. 30–32). Our results are
further supported by the analysis of response time. We found a
significantly positive, albeit small, correlation between penis size
and response time. This finding is consistent with a pattern in
adults whereby attractive stimuli are viewed for a longer periods
(40). A tendency to view attractive stimuli for longer is a generalized
phenomenon that starts in infancy (41, 42).
Height and shoulder-to-hip ratio also influenced a male’s relative
attractiveness with taller men and those with a greater shoulderto-hip ratio being rated as more attractive by women. As with
penis size, the proportional increase in attractiveness declined as
both male height and their shoulder-to-hip ratio increased. These
results are consistent with previous findings of sexual selection on
male height based on evidence from attractiveness rankings and
1.15
Penis Size (cm)
correlated with relative attractiveness, it is not surprising that, on
average, there was also a significant positive correlation between
a female’s attractiveness rating for a figure and her response time
(mean correlation: r = 0.219, t104 = 8.734, P < 0.001, n = 105
females). Controlling for differences among women in their average attractiveness scores (i.e., using relative attractiveness), we
found significant repeatability of the ratings given to the 343 figures
(n = 14–16 ratings per figure) (F342, 4799 = 6.859, P < 0.001; intraclass correlation: r = 0.281). For example, the absolute difference
in the rating score for the first and last (fourth) presentation of the
control figure to the same female was 1.21 ± 0.10 (mean ± SE)
(n = 105) on a seven-point scale. This is a high level of repeatability,
as most figures had six adjacent figures that were identical except
that they differed for one trait by 0.66 of a SD.
A
6
Fig. 2. Relationship between attractiveness and penis size controlling for
height and shoulder-to-hip ratio (95% confidence intervals) indicating
quadratic selection acting on penis size.
165
170
175
180
185
Height (cm)
Fig. 3. Contour map of the fitness surface (red: more attractive) for (A) penis
length and shoulder-to-hip ratio (height controlled) and (B) penis length and
height (shoulder-to-hip ratio controlled) (1 = mean attractiveness).
PNAS | April 23, 2013 | vol. 110 | no. 17 | 6927
Table 2. Correlations between female traits and the strength of
linear selection on male traits
Female traits
Male trait
Penis size
Shoulder-to-hip ratio
Height
Height
−0.119
−0.069
0.292***
Weight
Relative weight
0.159
−0.186
0.181
0.227*
−0.173
0.068
Age
0.074
−0.138
−0.056
Correlations (r) between female traits and the strength of linear selection
(β) on male traits. Relative weight is weight controlled for height (i.e., similar
to body mass index). The sample size is 103 as two females that were outliers
(>4 SD from mean) for “relative weight” were excluded from the dataset
(see text). Bold text indicates statistical significance. ***P = 0.003, *P = 0.021.
strong as selection on stature. The shoulder-to-hip ratio, however,
accounted for a much larger proportion of variance in attractiveness in our model (79.6%). This result might be because of our
figures extending too far into the feminine range of body shapes
(36), as those with a low shoulder-to-hip ratio were highly unattractive. However, given increasing waistlines (49), the values we
used are well within the range now seen in many Western countries.
We detected correlational selection between all three traits, so
the effects of each trait on attractiveness were not independent
of one another. The effect of penis size on attractiveness varied
with both height and body shape (Fig. 3B). After controlling for
the shoulder-to-hip ratio, larger penis size had a greater effect on
attractiveness for taller men. This result could be because perceived penis size was smaller when assessed relative to the height
of a taller man; or because of general discrimination against
short men irrespective of the value of other traits, so that even
a larger penis did little to increase their net attractiveness. A similar
relationship between penis size and shoulder-to-hip ratio was
also detected (Fig. 3A).
Attractiveness scores were not independent of the female participant’s phenotype. Most importantly, a female’s height was significantly positively correlated with the strength of her tendency to
rate taller men as being relatively more attractive. This result is
consistent with evidence that humans mate assortatively based on
height (15). There was also a weak, albeit significant (P = 0.021),
positive relationship between a female’s relative weight (comparable to body mass index) and the effect that penis size had on her
assessment of male attractiveness. This relationship was far stronger
if we included two outliers (>4 SD from mean; r = 0.333, P = 0.001,
n = 105). The relationship was also stronger if we used a more
stringent criterion to exclude four outliers (>2 SD from mean;
r = 0.296, P < 0.01, n = 101). This result is intriguing but should be
viewed with caution given that we conducted multiple tests.
In sum, we show that flaccid penis size alongside its interaction
with shoulder-to-hip ratio and height significantly influenced a
male’s relative attractiveness. Our results directly contradict
claims that penis size is unimportant to most females (22, 26, 50).
Some studies indicate that preference for a larger penis might
arise because penis size is associated with higher rates of vaginal
orgasm (23, 51). In turn, vaginal orgasms are associated with higher
levels of associated sexual satisfaction (52). The proximate basis
of the decisions leading to the reported attractiveness scores is
unknown. General preexisting aesthetic preferences, either innate
or acquired through cultural norms, might account for the observed
patterns. Another possibility is that females use previous sexual
experiences to infer a link between penis size and desirable male
properties [e.g., the likelihood of (vaginal) orgasm]. Arguing against
this theory is the lack of a correlation between a woman’s age
and the magnitude of the effect of penis size on her rating of male
attractiveness. Regardless of the exact mechanism, however, our
results show that female mate choice could have played a role
in the evolution of the relatively large human male penis. More
6928 | www.pnas.org/cgi/doi/10.1073/pnas.1219361110
broadly, our study adds to growing evidence from several species
that precopulatory sexual selection can influence the evolution of
primary sexual traits in animals (4–8).
Materials and Methods
MakeHuman (v0.9.1RC1) was used to generate anatomically correct wireframe figures. Body shape, height, and flaccid penis size were manipulated
on each frame. We aimed to generate figures that encompassed the typical
range of variation in these three traits in populations of Caucasian males. The
penis and height values used stem from a large-scale study of an Italian male
population, but these values fit within the standard range for Caucasians
(reviewed in ref. 39). These values should capture ∼95% of the variation that
females are likely to encounter, although they do not encompass the full
range of variation, and the mean values are known to vary among different
human populations. For height and penis length, seven values were evenly
spaced between ±2 SD of the population mean (range: height: 1.63–1.87 m;
flaccid penis: 5–13 cm) (39). Using this program we could not generate penises that only increased in length, so we refer to penis “size,” as there was
a slight increase in width of 1.2 cm between the shortest and longest penis,
whereas there was an 8-cm change in length. Body shapes were generated
as seven evenly spaced values along the “masculinity” function of MakeHuman.
We then summarized these figures using the shoulder-to-hip ratio in our analysis
(range: 1.13–1.45; i.e., pear to V-shaped). These values fell within the natural
range (36). Figures were imported into LightWave 3D (v9.6), colored gray,
modified to reduce pixilation, and standardized for testicle size. We then
generated videos where a forward facing figure took 4 s to rotate 30° to
each side. Rotation increased the ability of participants to gauge penis size.
Full details are available upon request.
Female participants were recruited at Monash University and the Australian National University (students, staff, and nonuniversity). The experiment was briefly described to participants as a study of male attractiveness,
but they were not told which male traits varied. Females were instructed to
stand 6.5 m directly in front of a wall where figures were projected at full (life)
size. Before data collection and after the interviewer left the room, participants filled out a questionnaire and were asked about their height, weight,
and age (SI Text). A scale and tape measure (for height) were provided in
the room. The participants were also asked whether they were using
chemical/hormonal contraception and what stage of their menstrual cycle
they were in. After the questionnaire, and before data collection began,
all participants viewed the same set of 13 videos that spanned the range in
male trait values to gain familiarity with the figures. Before testing, participants were then asked: “Please rate each figure based on how sexually
attractive they are to you” (Likert scale: 1–7). During the test, each participant
was shown a unique, randomly ordered set of 53 videos: 49 test videos and
4 control (all traits at mean) videos. After the participant entered a rating score
(by pressing a keyboard button) the next figure in the sequence appeared. The
system automatically recorded the time between the figure first appearing and
a score for it being entered. We obtained data from 105 participants who selfidentified as (i) heterosexual or (ii) exclusively attracted to men in a pretest
questionnaire (data from other participants were excluded: n = 13). Hence,
all 343 figures were each viewed by approximately 15 women (n = 5,145 ratings). Stimuli were displayed at life size using a digital projector in a private
viewing room. Data were collected using SuperLab (v4.5). Data collection was
anonymous so that no answers could be traced back to participants. Ethics
approval was granted through Monash University (MUHREC Approval CF11/
1378–2011000764).
Data Analysis. Data on attractiveness were analyzed using standard multivariate selection procedures (13, 53). Our analyses clearly showed strong
nonlinear and correlational selection, so we did not conduct canonical rotations of the data to generate eigenvectors (e.g., refs. 53–55). We conducted
two analyses. First, we used a standard analysis based on a multiple regression
of “relative attractiveness” on standardized trait values (mean = 0, SD = 1). We
centered the rating scores from each participant (i.e., the mean rating for each
participant was then zero). This process generated participant-corrected scores
to control for variation among participants in their tendency to give higher or
lower than average scores. For relative attractiveness we then calculated the
mean participant-corrected attractiveness score for each of the 343 figures
(an average of 15 participants viewed each figure). The mean score of the
343 figures is 0, so we added 1 to each figure’s score to generate the final
relative attractiveness score. This addition was done purely for presentation
reasons, as the convention in selection analyses is that the average individual
has a value of 1. Adding 1 does not change estimates of selection gradients
(i.e., regression coefficients). The relative attractiveness score is the dependent
Mautz et al.
variable that we used as a surrogate measure of “fitness.” We estimated
selection gradients (13, 54) and associated P values from standard tests for
regression coefficients (13) [see “A” in Table 1]. Because we present the
results as a selection analysis, the regression coefficient for the squared
product of individual traits are doubled (54). The selection gradients in
Table 1 can therefore be read as the increase in attractive score (on the
original 1–7 scale) with a one SD increase in the focal trait.
Second, we used the same multiple-regression approach to calculate a
unique fitness surface for relative attractiveness for each participant. We did
this to control for the fact that our first analysis did not account for participant
identity. The dependent variable was simply the centered attractiveness for
each participant. The three traits were each standardized for the set of figures
that the participants viewed. We then calculated the mean value for each
selection gradient (i.e., each mean was based on 105 independent estimates)
and used one-sample t tests to determine whether means differed from zero
(all distributions were normal, Kolomogorov–Smirnov tests, P = 0.23–0.94)
[see “B” in Table 1]. Both methods yielded very similar estimates of selection
gradients [compare “A” and “B” in Table 1]. In Figs. 2 and 3 we present data
based on the relative attractiveness of the 343 figures. We generated attractiveness contour maps (Fig. 3) with thin-plate splines in the fields package
of R (56).
To investigate the relationship between female traits and attractiveness
scores, we used Pearson’s correlations to measure the relationship between
the linear selection gradients (calculated using the second method) for each
male trait (penis size, height, and shoulder-to-hip ratio) and each of three
female traits (age, height, and weight). Weight and height are correlated
(r = 0.322, P = 0.001), so to control for height, we used the residuals from a
regression of weight on height. These parameters can be considered broadly
equivalent to a measure of body mass index. We identified two females that
showed a strong deviation from the regression line (residuals >4 SD). We
excluded these participants from all of the results presented in Table 2.
Finally, we used two-sample t-tests to compare selection gradients between
females assigned to one of two categories for contraception (using or not
using chemical/hormonal contraception) and stage in the menstrual cycle
[peak of cycle (1–7 d after the start of menstrual cycle) or not peak cycle
(8–28 d after the start of the menstrual cycle)], respectively (Table S1).
Response Time and Repeatability Analysis. We analyzed the effect of penis size
on female latency to rate a figure in two ways. First, we ran a general linear
mixed model with response time as the dependent variable and the three
standardized male traits as fixed covariates. We included female participant
identity as a random effect to control for multiple trials per female. To improve
the model fit, we log-transformed response time (analyses on untransformed
data yielded the same conclusions). We also ran the model excluding all cases
(n = 246 of 5,142) where the response time was less than 0.1 s (this was a
natural break in the data, as the log-transformed response time then showed
a very close fit to a normal distribution). Again, the model yielded the same
conclusions. Second, to determine how figure attractiveness influenced response time, we calculated the Pearson’s correlation between the 53 attractiveness scores and log response time for each female. These 105 correlations
were then compiled and a one-sample t test conducted to test whether the
mean correlation was significantly different from zero. Use of Spearman
ranked-order correlations yielded the same conclusion. Data on response
time were missing for 3 of the 5,145 trials.
To determine the repeatability of ratings of a figure’s attractiveness
across females, a repeatability analysis was performed for the 343 figures.
We used participant-corrected attractiveness scores as the dependent variable in a one-way ANOVA (with figure identity as the categorical factor)
to estimate the intraclass correlation. This correlation is measure of the
agreement among females in how they rate a figure’s attractiveness.
See Dataset S1 for the original data (n = 5,145 ratings from 105 participants), Dataset S2 for the relative attractiveness scores and trait values for
the 343 figures, and Dataset S3 for selection gradients and questionnaire
responses for the 105 participants.
1. Arnqvist G (1998) Comparative evidence for the evolution of genitalia by sexual selection.
Nature 393(6687):784–786.
2. Simmons LW (2001) Sperm Competition and Its Evolutionary Consequences in the
Insects (Princeton Univ Press, Princeton, NJ).
3. Eberhard WG (1996) Female Control: Sexual Selection by Cryptic Female Choice
(Princeton Univ Press, Princeton, NJ).
4. Bertin A, Fairbairn DJ (2005) One tool, many uses: Precopulatory sexual selection on
genital morphology in Aquarius remigis. J Evol Biol 18(4):949–961.
5. Grieshop K, Polak M (2012) The precopulatory function of male genital spines in
Drosophila ananassae[Doleschall] (Diptera: Drosophilidae) revealed by laser surgery.
Evolution 66(8):2637–2645.
6. Langerhans RB, Layman CA, DeWitt TJ (2005) Male genital size reflects a tradeoff
between attracting mates and avoiding predators in two live-bearing fish species.
Proc Natl Acad Sci USA 102(21):7618–7623.
7. Kahn AT, Mautz B, Jennions MD (2010) Females prefer to associate with males with
longer intromittent organs in mosquitofish. Biol Lett 6(1):55–58.
8. Gasparini C, Pilastro A, Evans JP (2011) Male genital morphology and its influence
on female mating preferences and paternity success in guppies. PLoS ONE 6(7):
e22329.
9. Candolin U (2003) The use of multiple cues in mate choice. Biol Rev Camb Philos Soc
78(4):575–595.
10. Donohoe ML, von Hippel W, Brooks RC (2009) Beyond waist-hip ratio: Experimental
multivariate evidence that average women’s torsos are most attractive. Behav Ecol
20(4):716–721.
11. Brooks R, Shelly JP, Fan J, Zhai L, Chau DKP (2010) Much more than a ratio: Multivariate selection on female bodies. J Evol Biol 23(10):2238–2248.
12. Saxton TK, Burriss RP, Murray AK, Rowland HM, Roberts SC (2009) Face, body and
speech cues independently predict judgments of attractiveness. J Evol Psychol (Bp)
7(1):23–35.
13. Lande R, Arnold SJ (1983) The measurement of selection on correlated characters.
Evolution 37(6):1210–1226.
14. Roberts B, Harris MG, Yates TA (2005) The roles of inducer size and distance in the
Ebbinghaus illusion (Titchener circles). Perception 34(7):847–856.
15. Silventoinen K, Kaprio J, Lahelma E, Viken RJ, Rose RJ (2003) Assortative mating by
body height and BMI: Finnish twins and their spouses. Am J Hum Biol 15(5):620–627.
16. Burriss RP, Roberts SC, Welling LLM, Puts DA, Little AC (2011) Heterosexual romantic
couples mate assortatively for facial symmetry, but not masculinity. Pers Soc Psychol
Bull 37(5):601–613.
17. Pawłowski B (2003) Variable preferences for sexual dimorphism in height as a strategy
for increasing the pool of potential partners in humans. Proc Roy Soc Lond B 270(1516):
709–712.
18. Courtiol A, Picq S, Godelle B, Raymond M, Ferdy J-B (2010) From preferred to actual
mate characteristics: The case of human body shape. PLoS ONE 5(9):e13010.
19. Diamond JM (1997) Why is Sex Fun?: The Evolution of Human Sexuality (Basic Books,
New York, NY).
20. Miller GF (2001) The Mating Mind: How Sexual Choice Shaped the Evolution of Human
Nature (Anchor Books, New York, NY).
21. Lehman P (1993) Running Scared: Masculinity and the Representation of the Male
Body (Temple Univ Press, Philadelphia, PA).
22. Lever J, Frederick DA, Peplau LA (2006) Does size matter? Men’s and women’s views
on penis size across the lifespan. Psychol Men Masc 7:129–143.
23. Brody S, Weiss P (2010) Vaginal orgasm is associated with vaginal (not clitoral) sex
education, focusing mental attention on vaginal sensations, intercourse duration,
and a preference for a longer penis. J Sex Med 7(8):2774–2781.
24. Eisenman R (2001) Penis size: Survey of female perceptions of sexual satisfaction. BMC
Womens Health 1(1):1.
25. !
Stulhofer A (2006) How (un)important is penis size for women with heterosexual
experience? Arch Sex Behav 35(1):5–6.
26. Francken AB, van de Wiel HB, van Driel MF, Weijmar Schultz WC (2002) What importance do women attribute to the size of the penis? Eur Urol 42(5):426–431.
27. Randall DM, Fernandes MF (1991) The social desirability response bias in ethics research.
J Bus Ethics 10(11):805–817.
28. Fisher RJ (1993) Social desirability bias and the validity of indirect questioning. J Consum
Res 20(2):303.
29. Tourangeau R, Yan T (2007) Sensitive questions in surveys. Psychol Bull 133(5):859–883.
30. Dixson BJ, Dixson AF, Morgan B, Anderson MJ (2007) Human physique and sexual
attractiveness: Sexual preferences of men and women in Bakossiland, Cameroon.
Arch Sex Behav 36(3):369–375.
31. Dixson BJ, Dixson AF, Li B, Anderson MJ (2007) Studies of human physique and sexual
attractiveness: Sexual preferences of men and women in China. Am J Hum Biol 19(1):
88–95.
32. Dixson BJ, Dixson AF, Bishop PJ, Parish A (2010) Human physique and sexual attractiveness in men and women: A New Zealand-U.S. comparative study. Arch Sex Behav
39(3):798–806.
33. Mueller U, Mazur A (2001) Evidence of unconstrained directional selection for male
tallness. Behav Ecol Sociobiol 50(4):302–311.
34. Nettle D (2002) Height and reproductive success in a cohort of British men. Hum Nat
13(4):473–491.
35. Pawlowski B, Dunbar RI, Lipowicz A (2000) Tall men have more reproductive success.
Nature 403(6766):156.
36. Currie TE, Little AC (2009) The relative importance of the face and body in judgments
of human physical attractiveness. Evol Hum Behav 30(6):409–416.
Mautz et al.
PNAS | April 23, 2013 | vol. 110 | no. 17 | 6929
EVOLUTION
ACKNOWLEDGMENTS. We thank J. Burchell, J. Irons, H. Kokko, E. McKone,
and R. Reynolds for technical support; P. Backwell, I. Booksmythe, R. Catullo,
and R. Lanfear for comments on previous drafts of the manuscript; and
Geoff Miller and one anonymous referee for their thoughtful and constructive comments on our manuscript. This project was funded by the Australian
Research Council; ethics approval was granted through Monash University
(MUHREC Approval CF11/1378 – 2011000764).
37. Courtiol A, Raymond M, Godelle B, Ferdy J-B (2010) Mate choice and human stature:
Homogamy as a unified framework for understanding mating preferences. Evolution
64(8):2189–2203.
38. Brooks R, et al. (2005) Experimental evidence for multivariate stabilizing sexual selection. Evolution 59(4):871–880.
39. Ponchietti R, et al. (2001) Penile length and circumference: A study on 3,300 young
Italian males. Eur Urol 39(2):183–186.
40. Imhoff R, et al. (2010) Viewing time effects revisited: Prolonged response latencies
for sexually attractive targets under restricted task conditions. Arch Sex Behav 39(6):
1275–1288.
41. Samuels CA, Ewy R (1985) Aesthetic perception of faces during infancy. Br J Dev
Psychol 3(3):221–228.
42. van Duuren M, Kendell-Scott L, Stark N (2003) Early aesthetic choices: Infant preferences for attractive premature infant faces. Int J Behav Dev 27(3):212–219.
43. Sear R, Marlowe FW (2009) How universal are human mate choices? Size does not
matter when Hadza foragers are choosing a mate. Biol Lett 5(5):606–609.
44. Sear R (2010) Height and reproductive success. Homo Novus—A Human Without
Illusions, eds Frey UJ, Störmer C, Willführ KP (Springer, Heidelberg), pp 127–143.
45. Stulp G, Pollet TV, Verhulst S, Buunk AP (2012) A curvilinear effect of height on
reproductive success in human males. Behav Ecol Sociobiol 66(3):375–384.
46. Maisey DS, Vale EL, Cornelissen PL, Tovée MJ (1999) Characteristics of male attractiveness
for women. Lancet 353(9163):1500.
6930 | www.pnas.org/cgi/doi/10.1073/pnas.1219361110
47. Hughes SM, Gallup GG (2003) Sex differences in morphological predictors of sexual
behavior. Evol Hum Behav 24(3):173–178.
48. Swami V, Tovée MJ (2005) Male physical attractiveness in Britain and Malaysia: A crosscultural study. Body Image 2(4):383–393.
49. Ford ES, Mokdad AH, Giles WH (2003) Trends in waist circumference among U.S.
adults. Obes Res 11(10):1223–1231.
50. Masters WH, Johnson VE (1966) Human Sexual Response (Little, Brown and Company,
Boston, MA).
51. Costa RM, Miller GF, Brody S (2012) Women who prefer longer penises are more likely
to have vaginal orgasms (but not clitoral orgasms): Implications for an evolutionary
theory of vaginal orgasm. J Sex Med 9(12):3079–3088.
52. Brody S, Weiss P (2011) Simultaneous penile-vaginal intercourse orgasm is associated with satisfaction (sexual, life, partnership, and mental health). J Sex Med 8(3):
734–741.
53. Blows MW, Brooks R (2003) Measuring nonlinear selection. Am Nat 162(6):815–820.
54. Stinchcombe JR, Agrawal AF, Hohenlohe PA, Arnold SJ, Blows MW (2008) Estimating
nonlinear selection gradients using quadratic regression coefficients: Double or nothing?
Evolution 62(9):2435–2440.
55. Reynolds RJ, Childers DK, Pajewski NM (2010) The distribution and hypothesis testing
of eigenvalues from the canonical analysis of the gamma matrix of quadratic and
correlational selection gradients. Evolution 64(4):1076–1085.
56. R Core Development Team (2008) R: A Language and Environment for Statistical
Computing (R Foundation for Statistical Computing, Vienna).
Mautz et al.


© Copyright 2026