
- NERC Open Research Archive
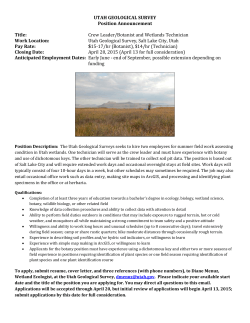
Metadata report for the Knowsley 3D geological model Engineering Geology Programme Open Report OR/15/020 BRITISH GEOLOGICAL SURVEY ENGINEERING GEOLOGY PROGRAMME OPEN REPORT OR/15/020 Metadata report for the Knowsley 3D geological model S Thorpe The National Grid and other Ordnance Survey data are used with the permission of the Controller of Her Majesty’s Stationery Office. Licence No: 100017897/2013. Bibliographical reference THORPE S. 2013. Metadata report for the Knowsley 3D geological model. British Geological Survey Open Report, OR/15/020. 13pp. Copyright in materials derived from the British Geological Survey’s work is owned by the Natural Environment Research Council (NERC) and/or the authority that commissioned the work. You may not copy or adapt this publication without first obtaining permission. Contact the BGS Intellectual Property Rights Section, British Geological Survey, Keyworth, e-mail [email protected]. You may quote extracts of a reasonable length without prior permission, provided a full acknowledgement is given of the source of the extract. Maps and diagrams in this book use topography based on Ordnance Survey mapping. © NERC 2013. All rights reserved Keyworth, Nottingham British Geological Survey 2013 BRITISH GEOLOGICAL SURVEY The full range of our publications is available from BGS shops at Nottingham, Edinburgh, London and Cardiff (Welsh publications only) see contact details below or shop online at www.geologyshop.com The London Information Office also maintains a reference collection of BGS publications, including maps, for consultation. We publish an annual catalogue of our maps and other publications; this catalogue is available online or from any of the BGS shops. The British Geological Survey carries out the geological survey of Great Britain and Northern Ireland (the latter as an agency service for the government of Northern Ireland), and of the surrounding continental shelf, as well as basic research projects. It also undertakes programmes of technical aid in geology in developing countries. The British Geological Survey is a component body of the Natural Environment Research Council. British Geological Survey offices BGS Central Enquiries Desk Tel 0115 936 3143 email [email protected] Fax 0115 936 3276 Kingsley Dunham Centre, Keyworth, Nottingham NG12 5GG Tel 0115 936 3241 Fax 0115 936 3488 email [email protected] Murchison House, West Mains Road, Edinburgh EH9 3LA Tel 0131 667 1000 email [email protected] Fax 0131 668 2683 Natural History Museum, Cromwell Road, London SW7 5BD Tel 020 7589 4090 Fax 020 7584 8270 Tel 020 7942 5344/45 email [email protected] Columbus House, Greenmeadow Springs, Tongwynlais, Cardiff CF15 7NE Tel 029 2052 1962 Fax 029 2052 1963 Maclean Building, Crowmarsh Gifford, Wallingford OX10 8BB Tel 01491 838800 Fax 01491 692345 Geological Survey of Northern Ireland, Colby House, Stranmillis Court, Belfast BT9 5BF Tel 028 9038 8462 Fax 028 9038 8461 www.bgs.ac.uk/gsni/ Parent Body Natural Environment Research Council, Polaris House, North Star Avenue, Swindon SN2 1EU Tel 01793 411500 Fax 01793 411501 www.nerc.ac.uk Website www.bgs.ac.uk Shop online at www.geologyshop.com OR/15/020; Version 0.1 Last modified: 2015/03/23 14:21 Contents Contents.......................................................................................................................................... 2 Summary ........................................................................................................................................ 3 1 Modelled volume, purpose and scale .................................................................................... 4 2 Modelled surfaces/volumes .................................................................................................... 5 3 Model datasets ........................................................................................................................ 6 4 Software Used and Model workflow .................................................................................... 7 4.1 Software Used................................................................................................................. 7 4.2 Model Workflow ............................................................................................................ 7 5 Model image .......................................................................................................................... 11 6 Reference List ....................................................................................................................... 11 Appendix ...................................................................................................................................... 12 FIGURES Figure 1 Modelled area (in red)....................................................................................................... 4 Figure 2 - Distribution of cross-sections and geological units at outcrop viewed in GSI3D .......... 5 Figure 3 - Sections showing erroneous borehole ............................................................................ 7 Figure 4 - Corrected sections after removing erroneous borehole .................................................. 8 2 OR/15/020; Version 0.1 Last modified: 2015/03/23 14:21 Summary This report describes the metadata generated during the creation of a 3D geological model for the Environment Agency (EA) in the Knowsley area in NW England. Knowsley Industrial Park, NW England and its buried sewerage network presents a potential source of pollution to the underlying Triassic Sherwood Sandstone Group aquifer. Weakly permeable superficial deposits beneath the site may provide a barrier to potential pollution of groundwater in the aquifer. The aim of the study was to develop and apply a 3D model of the superficial deposits beneath the park to a qualitative assessment of the vulnerability of the underlying aquifer to potential pollution. The study also aimed to devise a method for the integration of the 3D geological model of the shallow sub-surface with the buried utility network. The 3D model revealed 7 superficial units. Glacial till, comprising clay and silt, was the only weakly permeable deposit identified. Other deposits were interpreted as permeable. The underground utility network was integrated in 3D with the geological model. Those utilities overlying less than 2.5 m of till were interpreted to represent the most vulnerable parts of the underlying aquifer. The greatest relative vulnerability to the aquifer occurred in the south and south-west of the project area. The study identified a novel method for the integration of a 3D geological model and a buried sewerage network. The identification of these utilities prioritised the areas of highest relative vulnerability of the Sherwood Sandstone aquifer to potential pollution from utility leakage. This approach enabled the development of a hazard identification and prioritisation scheme for future improvements to the buried sewerage network serving Knowsley Industrial Park. 3 OR/15/020; Version 0.1 Last modified: 2015/03/23 14:21 1 Modelled volume, purpose and scale Figure 1 Modelled area (in red) The model incorporates the town of Kirkby and the Knowsley Industrial Park located in the northwest of the project area. This industrial area lies on a sequence of superficial deposits comprising glacial, post-glacial and artificial deposits overlying the Sherwood Sandstone Group, that in places are deeply weathered to form loose sand (Price et al., 2008). The Sherwood 4 OR/15/020; Version 0.1 Last modified: 2015/03/23 14:21 Sandstone Group is an important source of groundwater and identifying the vulnerability of the aquifer to potential pollution from the buried sewerage network was the driver for the project. United Utilities supplied the pipeline network for foul and surface water drainage, and the EA provided new boreholes which the project incorporated into the BGS systems. Using this additional borehole data, a detailed 3D geological model of superficial and artificial deposits was created. Once the model surfaces were created, they were interrogated in a GIS against the sewerage network data. This spatial data assessment was used to highlight the relative spatial vulnerability of the underlying Sherwood Sandstone Group aquifer to potential pollution based on the thickness and distribution of permeable and weakly-permeable superficial deposits. Figure 2 - Distribution of cross-sections and geological units at outcrop viewed in GSI3D 2 Modelled surfaces/volumes 7 superficial geological units and 5 glacial lenses were modelled and volumes generated for each. The interpreted weathered top of the Sherwood Sandstone Group was modelled as a separate unit. The base of the Sherwood Sandstone Group represents the base of the model corresponding to an elevation of approximately -10 mOD. The geological model comprises the following units: Madeground (mgr) Alluvium (alv_1) Surface Peat (peat_1) Shirdley Hill Sand (ssa) 5 OR/15/020; Version 0.1 Last modified: 2015/03/23 14:21 Buried Peat (peat_4) Till (till_1) Glaciofluvial Ice‐Contact Deposits (gfic_b) Weathered Sherwood Sandstone Group (w_ssg) Sherwood Sandstone Group (ssg) Lens of Glacial Deposits (gfic_l13_t) Lens of Glacial Deposits (gfic_l14_t) Lens of Glacial Deposits (gfic_l101_t) Lens of Glacial Deposits (gfic_l102_t) Lens of Glacial Deposits (gfic_l103_t) NB: The abbreviations in brackets after each unit correspond to named units within the geological model (Figure 2) and generalised vertical section (GVS) described further in this report. 3 Model datasets DTM The DTM source was NEXTMap (Intermap Technologies Inc) at a 25m cell size resolution. The date of the DTM extraction was not recorded but it is assumed to be the date that modelling commenced – Sep 2007 Borehole data Borehole information was taken from the current BGS corporate databases – Single Onshore Borehole Index. Additionally, over 300 paper borehole records were provided by the Agency from previous environmental site investigations carried out in the industrial park and incorporated into the BGS databases. In total, 1279 coded boreholes were used in the study. Of these, 733 were used to construct 58 geological cross-sections (Price et al., 2008). One site investigation containing 11 boreholes has subsequently been found to contain boreholes whose start height was based on a local survey. These boreholes sit approximately 26m above the model DTM, and in these cases the boreholes were hung from the DTM in order to use their data in drawing the sections. Map data The 1:50 000 DigMapGB-50 digital geological data (natural superficial deposits and bedrock) which was used to guide the cross-section drawing and creation of the geological unit distributions was extracted from version 4.16 in 2008 and was derived from the 1930s survey of the Wigan sheet which did not include artificially modified ground. Although modelling then took place approximately concurrently with resurvey of the district (1999-2010) any consequent revisions from the latter were not fed into the shapefiles that were utilised within the model. In addition, the Made Ground envelope drawn for the model differs in detail from the survey. Thus there are discrepancies from the final map data published in the Wigan 1:50 000 sheet in 2013 (and to be included in DiGMapGB-50 v8) which are only partly due to generalisation. Incorporating the updated natural superficial deposits and bedrock data into the model and the Made Ground into DiGMapGB-50 would require further intervention that for the moment cannot be justified [A J Mark Barron and S Thorpe, 09/03/2015] GVS data See appendix Geological Legend (GLEG) data 6 OR/15/020; Version 0.1 Last modified: 2015/03/23 14:21 See appendix 4 Software Used and Model workflow 4.1 SOFTWARE USED 4.2 GSI3D V2.6 ArcGIS 9.3 MS Excel MODEL WORKFLOW The standard GSI3D workflow was used to create the 3D model. (Kessler and Mathers, 2004) The interrogation of the pipeline data with the modelled surfaces was then completed using a series of spatial queries in ArcGIS (for more details see (Price et al., 2008)) A review of the model by Barron in Feb 2015 prompted further investigation into some small modelling errors that came to light. These included a Site Investigation whose boreholes had been entered into the BGS corporate system using a site datum without being converted to the correct level above Ordnance Datum (SI 44928 – corrected on 9th March 2015 by Sally Stolworthy) and a borehole that looked at odds with the rest of the cross-section (Figure ? below show Knowsley_NS_17 and Knowsley_WE_09). Figure 3 - Sections showing erroneous borehole As is clear, the borehole in question (SJ49NW1122.) appears to ‘force’ the superficial geology to a higher elevation than the surrounding correlations. Upon investigation it was revealed that this borehole isn’t located in the correct position by at least 1000m. The cross-sections were amended to exclude this false borehole information and this in turn altered the geological envelopes for the Peat_1 (dark brown – but transparency is set to 50% which allows the other units to show through), Shirdley Hill Sand (in dark orange) and the Weathered Sherwood Sandstone (in orange). The original project is shown on the left, and the amendments are shown on the right. 7 OR/15/020; Version 0.1 Last modified: 2015/03/23 14:21 The area in question can be seen here with the SSA and PEAT_1 extending/contracting south-westwards, and the removal of the outlier of weathered_SSG Figure 4 - Corrected sections after removing erroneous borehole 8 OR/15/020; Version 0.1 Last modified: 2015/03/23 14:21 Cross-section WE_12 also had a borehole at odds with the section. After reviewing the borehole and finding out that the start height had been input into the system incorrectly on loading the borehole appears fit the geology better as shown in the before and after view of the section. Before... ...After Some cross-sections show correlation lines that appear to be above the DTM. S Thorpe believes that this is because the original model was produced using a version of GSI3D which didn’t store the DTM. Therefore when the NGM checks were completed a new DTM was introduced which was slightly different (due a more recent flying date). This is unfortunate, but the sections have been modified to represent a better fit to this more recent DTM (derived from the BaldEarth DTM model). Below is a specific example of the changes made: Knowsley_WE_16 This section shows the MGR line floating above the DTM, the corrective action is shown in the figure labelled “After” 9 OR/15/020; Version 0.1 Last modified: 2015/03/23 14:21 After... After... 10 OR/15/020; Version 0.1 Last modified: 2015/03/23 14:21 5 Model image Madeground Soil Alluvium Peat Shirdley Hill Sand Formation Basal Peat Till 6 Reference List KESSLER, H, and MATHERS, S. 2004. GSI3D - The software and methodology to build systematic near-surface 3-D geological models - Version 1.5. PRICE, S J, CROFTS, R G, TERRINGTON, R L, and THORPE, S. 2008. A 3D geological background for Knowsley Industrial Park and surrounding area, NW England. Commisioned Report. 11 OR/15/020; Version 0.1 Last modified: 2015/03/23 14:21 Appendix GVS file name mgr id 10 Stratigraphy LEX_RCS MGR MGR‐ ARTDP RCS ARTDP Age Holocene soil alv_1 31 33 SOIL ALV SOIL‐SOIL ALV‐ZCV SOIL ZCV Holocene Holocene peat_1 ssa peat_4 till_1 gfic_b 45 70 72 100 105 PEAT SSA PEAT TILL GFIC PEAT‐P SSA‐S PEAT‐P TILL‐CZSV GFIC‐SV P S P CZSV SV Holocene Devensian Devensian Devensian w_ssg 123 W_SSG W_SSG‐ SV SV ssg 125 SSG SSG‐SDST SDST gfic_l13_t ‐713 GFIC GFIC‐SV SV Devensian gfic_l13 713 GFIC GFIC‐SV SV Devensian gfic_l14_t ‐714 GFIC GFIC‐SV SV Devensian gfic_l14 714 GFIC GFIC‐SV SV Devensian gfic_l100_t ‐800 GFIC GFIC‐SV SV Devensian gfic_l100 GFIC GFIC‐SV SV Devensian gfic_l101_t ‐801 GFIC GFIC‐SV SV Devensian gfic_l101 GFIC GFIC‐SV SV Devensian gfic_l102_t ‐802 GFIC GFIC‐SV SV Devensian 800 801 12 Description Made Ground (Undivided). Includes colliery spoil and industrial and commercial waste Soil Alluvium. East of tidal sluice river dominated processes depositing mainly silt, clay and sand. West of sluice active channel comprising mainly sand and gravel. Main peat deposit at surface Shirdley Hill Sand Formation Main till sheet Subtill Glaciofluvial Ice Contact lens Weathered Sherwood Sandstone Group. Sand and Gravels Sherwood Sandstone Group. Sandstone Intratill Glaciofluvial Ice Contact lens, base above 35m OD. In EA Knowsley Model Intratill Glaciofluvial Ice Contact lens, base above 35m OD Intratill Glaciofluvial Ice Contact lens, base above 35m OD. In EA Knowsley Model Intratill Glaciofluvial Ice Contact lens, base above 35m OD Intratill Glaciofluvial Ice Contact lens, base above 25m OD. In EA Knowsley Model Intratill Glaciofluvial Ice Contact lens, base above 25m OD Intratill Glaciofluvial Ice Contact lens, base above 40m OD. In EA Knowsley Model Intratill Glaciofluvial Ice Contact lens, base above 40m OD Intratill Glaciofluvial Ice Contact lens, base above 40m OR/15/020; Version 0.1 gfic_l102 802 Last modified: 2015/03/23 14:21 GFIC GFIC‐SV SV gfic_l103_t ‐803 GFIC GFIC‐SV SV gfic_l103 GFIC‐SV SV 803 GFIC OD. In EA Knowsley Model Devensian Intratill Glaciofluvial Ice Contact lens, base above 40m OD Devensian Intratill Glaciofluvial Ice Contact lens, base above 41m OD. In EA Knowsley Model Devensian Intratill Glaciofluvial Ice Contact lens, base above 41m OD GLEG file ALV ARTDP CZSV GFIC MGR P PEAT S SDST SSA SSG SV TILL W_SSG ZCV DESCRIPTION DESCRIPTION DESCRIPTION DESCRIPTION DESCRIPTION DESCRIPTION DESCRIPTION DESCRIPTION DESCRIPTION DESCRIPTION DESCRIPTION DESCRIPTION DESCRIPTION DESCRIPTION DESCRIPTION 248 200 153 50 191 188 188 255 255 171 255 255 68 217 206 231 200 176 250 187 130 130 249 201 88 201 249 200 136 212 40 200 190 0 187 92 92 158 84 46 84 158 200 15 174 13 255 255 255 255 255 255 255 255 255 255 255 255 255 255 255 TEXTURES\black.jpg TEXTURES\black.jpg TEXTURES\CZV.jpg TEXTURES\black.jpg TEXTURES\black.jpg TEXTURES\P.jpg TEXTURES\P.jpg TEXTURES\S.jpg TEXTURES\SV.jpg TEXTURES\black.jpg TEXTURES\black.jpg TEXTURES\SV.jpg TEXTURES\black.jpg TEXTURES\black.jpg TEXTURES\ZCV.jpg


© Copyright 2026