
EG2 Evaluating Software Reliability in port equipments a
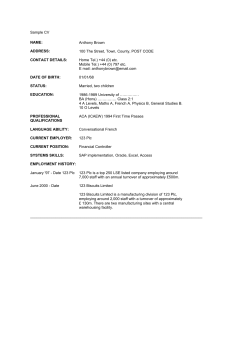
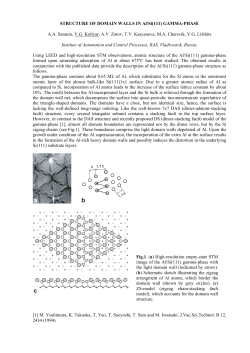
Evaluating Software Reliability in port equipments: a case study Mathew A G Rizwan S M Ministry of Higher Education, CAS-Sohar Engineering Department, Mechanical Unit Sohar, Oman [email protected] Caledonian College of Engineering Department of Mathematics & Statistics Abstract—Critical systems such as spacecraft, aircraft, nuclear power plant, heavy port equipment etc. need a very high level of dependability and reliability in their operations, a majority of which are software controlled. Two types of techniques are used in the design and implementation of dependable software systems: fault avoidance and fault tolerance techniques. Reliability is a very popular aspect of software dependability, which relies, in particular, on fault forecasting and fault removal. The real data of a software based system controlling critical port equipment has been used for this purpose. Any one software fault in the system brings the entire port equipment to a complete halt. The critical port equipment fails due to any one of the two types of software faults as categorized in the data. The reliability modeling methodology used here is from a wellknown model with the emphasis on its application to problems with software’s in critical port equipment. The paper outlines a modeling strategy by embedding the fault types as seen in the data and important reliability metrics such as: mean time to system failure (MTSF) and steady state availability are obtained using semi-Markov processes and regenerative point techniques. Graphs are essentially established to interpret the results. Keywords—software reliability; software dependability; semi– markov; regenerative processes; MTSF; I. INTRODUCTION Different types of industrial assets under varied operating situations have been studied and simulated by means of real and hypothetical data by a number of academics: Bhupender et al., (2007), Rizwan et al., (2011, 2013), including references there in. Recently, Mathew et. al (2012) wrote about the effects of planned and unplanned maintenance stops of a programmable logic controller (PLC) controlled quayside container crane number 15 (QC 15) which is used to load and unload the containers of the docks, which is the heart of the docks and port trade. The primary focus of the paper was from a mechanical maintenance perspective associated with mechanical systems only. Noting the above, and expanding the coverage of the case study further, to include the software based faults also, this case study performs a reliability modeling and analysis of the same 65 ton PLC controlled quayside container crane (QC 15) currently operational at a large strategic port in Oman. The port has in operation a number of PLC controlled quayside Muscat, Oman container cranes for trans-shipment purposes. It is understood from the data that frequent repair and replacement of PLC’s due to software faults, is a cause of concern to the port maintenance department as the downtime cost is significantly high resulting in, slowdown of the container trans-shipment process. For the purpose of reliability modeling and analysis, quayside container crane number 15 is selected. A specific software reliability model incorporating the actual software fault states and software outages as observed in the data is developed and optimized maintenance metrics are estimated. The emphasis of this paper is on the application of a reliability modeling methodology to PLC based software reliability problems by providing a context in which the effect of PLC reliability and availability can be quantified based on actual values of different rates and probabilities using a real time quayside container crane data to achieve all the concluding results. Any programmable or non-programmable software fault in the PLC stops the quayside container crane and halts the container trans-shipment process thereby causing a series of losses. A visual scrutiny of the fault display screen exposes the software fault type and decides the type of maintenance decision to be taken. The quayside container crane fails due to any one of the two types of software faults as seen within the data, i.e. programmable software faults and nonprogrammable software faults. The software fault is attended to by the port maintenance department as soon as it occurs. The system regenerates and works like new after each programmable software fault or non-programmable software fault removal. The collected data gives the following estimations: Probability of programmable software fault p1= 0.5. Probability of non-programmable software fault p2= 0.5. Estimated value of software fault rate λ = 0.000051408 per hour. Estimated value of programmable software fault removal rate α1 = 0.0833 per hour. Estimated value of non-programmable software fault removal rate α 2 = 0.0833 per hour. The PLC software system used in the QC 15 is analyzed using semi Markov process and regenerative point technique, and the following maintenance performance metrics are obtained: Mean time to QC 15 (PLC software) failure. QC 15 (PLC software) availability analysis. II. MODEL DETAILS AND ASSUMPTIONS The unit is initially operative at state 0 and transits probabilistically depending on the type of software fault to any of the two states 1 to 2 with probabilities p1and p2 respectively (refer figure 1). 1. All programmable and non-programmable software fault times are assumed to have exponential distribution with software fault rate (𝝺) whereas the repair times have general distributions. 2. After each programmable fault and non-programmable fault rectification at state’s 1 to 2, the system works as good as new and returns back to state 0. 3. The software (programmable/non-programmable) faults are self-announcing. 4. The software (programmable/non-programmable) fault port maintenance department comes as soon as the PLC unit fails. dQ01 = p1λe-λt dt dQ02 = p2 λe-λt dt dQ10 = g1 (t)dt dQ20 = g 2 (t)dt (1)- (4) The non-zero elements p ij are as given below: p01 = p1 (5)- (6) p02 = p 2 By these transition probabilities it is verified that: p01 + p02 = 1 p10 = p20 = 1 (7)- (8) III. NOTATIONS USED O 𝝺 p1 p2 SP SNP © pij, Qij * Operative PLC unit. Constant software fault rate of the PLC unit Probability of programmable software fault Probability of non-programmable software fault Quayside container crane (QC 15) is under programmable software fault removal Quayside container crane (QC 15) is under nonprogrammable software fault removal Convolution. p.d.f., c.d.f. of first passage time from a regenerative state i to j or to a failed state j in (0, t] c.d.f. of first passage time from a regenerative state i to a failed state j Laplace Transforms (LT), i.e., for any f(t) and g(t); f(t) *g(t) = g1(t), G1(t) g2(t), G2(t) t f(t - u)g(u)du 0 p.d.f., c.d.f. of programmable software fault removal time p.d.f., c.d.f. of non-programmable software fault removal time IV. TRANSITION PROBABILITIES AND MEAN SOJOURN TIMES A transition diagram showing the different states of transition of the PLC software system used in the QC 15 is as shown in figure 1. The epochs of entry into states 0, 1, and 2 are regeneration points and hence the states are regenerative states. The states 1 and 2 are fault states. The transition probabilities are as given below: Figure 1. Transition states of the PLC software system used in the QC 15 The mean sojourn time ( μ i ) in the regeneration state ‘i’ is called as the time of stay in that state before transition to any other state. If T shows the sojourn time in the regenerative state i, then: μi = E(T) = Pr[T > t]dt Thus: μ 0 = e-λt dt = 0 1 ; λ μ1 = G1 (t)dt; 0 μ 2 = G 2 (t)dt; (9)- (11) 0 The unconditional mean time taken by the PLC software system to change into regenerative state ‘j’ when it is counted from the epoch of entrance into state ‘i’ is mathematically stated as: mij = tdQij (t) = -qij * (0) 0 Thus, m10 = μ1 m 01 +m02 = μ0 m20 = μ 2 TABLE 1. SUMMARY OF THE DATA (12)- (14) V. MATHEMATICAL ANALYSIS A. Mean time to QC 15 (PLC software) failure (MTSF) By denoting ‘Ui’ as the random variable that shows the time to QC 15 (PLC software) failure, when the QC 15 (PLC software) starts from state i (i=0) then, the reliability of the QC 15 (PLC software) is given by: R i (t) P[Ui t]. Taking the software fault states 1, and 2 as absorbing states and employing the arguments used for regenerative processes, we have the following recursive relation for R0 (t) , R0 (t) = q01 (t) + q02 (t) (15) Resolving the equation as shown in (15) using Laplace Transforms (L.T.) the solution is derived the expression for R0 (t) in terms of its L.T, i.e., R0 *(t) , now using the formula for mean time to QC 15 (PLC software) failure (MTSF), it is got: E(T0 ) MTSF lim R 0 *(s) s 0 N D (16) Where N = μ 0 and D =1 The following particular case is considered for graphical analysis: g1 (t) = α1e-α1t ,g 2 (t) = α2e-α2 t p01 = p1, p 02 = p 2, p10 = 1, p 20 = 1 μ0 = B. QC 15 (PLC software) availability analysis Using the probabilistic arguments and by defining Ai(t) as the probability that the QC 15 (PLC software) is in upstate at the instant t, given that the QC 15 (PLC software) entered the regenerative state i at t = 0, the following recursive relations are obtained: A0 = M0 (t) + q01 (t)©A1 (t) + q02©A2 (t) A1 (t) = q10 (t)©A0 (t) A2 (t) = q 20 (t)©A0 (t) VI. PARTICULAR CASE 1 1 1 ,μ1 = ,μ 2 = λ α1 α2 Using the numerical values calculated from the data collected from the company as shown in table 1 and the expressions (16) and (20); the mean time to QC 15 (PLC software) failure and QC 15 (PLC software) availability are estimated as: Mean Time to QC 15 (PLC software) Failure: 19452.22533 hours QC 15 (PLC software) Availability: 0.999383238 (17)-(19) -λt Where M0 (t) = e . Taking the Laplace Transforms (L.T.) of the equations shown above and solving them for A0 *(s) , it is got: A0 * (s) = N1 (s) D1 (s) (20) The steady state availability of the QC 15 (PLC software) is given as: A0 = limsA0 * (s) = s 0 Where N1 D1 N1 (s) = μ 0 , D1 = μ 0 + p1μ1 + p 2μ 2 (21) Figure 2, MTSF vs. software fault rate (λ) The important reliability indices such as MTSF, availability are estimated numerically. A declining trend of MTSF and Availability with respect to the software fault rate can be seen in Figure 2 and Figure 3. REFERENCES [1] [2] Figure 3, Availability (A0) vs. software fault rate (λ) VII. CONCLUSIONS Reliability modeling and analysis proves to be an effective tool in achieving the goal of zero software failure performance of critical port equipment. Based on the risk factor, the model correctly predicts/determines the fault mechanisms, causes of faults and offers a scientific basis for achieving improved and better maintenance metrics. [3] [4] [5] A.G. Mathew and S.M. Rizwan, “Maintenance analysis of port Plc’s - A case study”, Caledonian Journal of Engineering, Vol.8,No.2, pp. 52-57, Jul-Dec 2012. M. N. Al Alawi, A.G Mathew. and J. Collington, “Attaining zero failure performance for GIV gulfstream aircraft through reliability modeling and analysis”, International Journal of Advanced Scientific Engineering and Technological Research, Vol.1, No. 2, pp. 1-9, 2012. Bhupender Parashar and Gulshan Taneja, “Reliability and profit evaluation of a PLC hot standby system based on a master-slave concept and two types of repair facilities”, IEEE Transactions on reliability, vol. 56, no. 3, pp. 534-539, 2007. S.M. Rizwan, N. Padmavathi, A. Pal, and G. Taneja, “Reliability analysis of a seven unit desalination plant with shutdown during winter season and repair/maintenance on FCFS basis”, International Journal of Performability Engineering, vol. 9, no. 5, pp. 523-528, 2013. S.M. Rizwan, A.G. Mathew, M.C. Majumder, K.P. Ramachandran and G. Taneja, “Reliability analysis of an identical two-unit parallel CC plant system operative with full installed capacity”, International Journal of Performability Engineering, vol. 7, no. 2, pp. 179-185, 2011.


© Copyright 2026