
Economic Data Report
Quarter 4 of 2014/15 Compiled by: NWDC Research and Development Unit Q4 2014 2015 TABLE OF CONTENTS 1. 2. 2.1 2.1.1 2.1.2 2.1.3 2. 2 2.2.1 2.2.2 2.2.3 2.2.4 2.2.5 2.2.6 2.3 2.3.1 2.3.2 3. 4. 4.1 4.2 4.3 4.4 5. 6. 7. 8. 9. 9.1 9.2 9.3 9.4 9.5 9.6 10. 11. INTRODUCTION MACRO ECONOMY The Global Economy IHS Top-10 Economic Predictions for 2015 Shockwaves and Economic Competitiveness Emerging Economies African Political Risk Sub-Saharan African Realities South African Realities Highlights Q4 2014/2015 Is South Africa a sustainable investment destination? IHS Global Insight Identifies 5 Critical Factors to Watch South Africa’s export intensity The following structural transformation in the economy is needed South Africa’s sustainability “hope”: National Development Plan (NDP) North West Province Economic Overview North West Key Economic Indicators Compared to South Africa Current Realities in the North West province SOUTH AFRICA’s GLOBAL COMPETITIVENESS FOREIGN DIRECT INVESTMENT (FDI) Global Investment Trends Africa South Africa North West Province TRADE SUMMARY OF STATE OF THE NATION ADDRESS AND NATIONAL BUDGET SPEECH 2015 BOKONE BOPHIRIMA STATE OF THE PROVINCE ADDRESS AND PROVINCIAL BUDGET SPEECH 2015 INTEGRATED MANUFACTURING STRATEGY FOR THE NORTH WEST PROVINCE MINING DEVELOPMENTS Amplats Reveals Roadmap to Automation Implats to Invest R30bn over 5 years Pallinghurst shares rise and a potentially industry-transforming range of energy-slashing beneficiation technologies Chamber of Mines (CoM) Fuel Cell Platinum-based Fuel Cell Technology Successfully Powers 34 Houses Implats Moves to Power Platinum Refinery with Platinum Fuel Cells ENERGY PROFILE OF AFRICA RECOMMENDATIONS Page 3 3 3 7 8 8 8 9 9 9 11 11 11 11 12 12 12 13 19 19 19 20 20 21 22 23 24 26 32 32 33 33 34 35 36 37 39 NWDC Economic Data Report. Qtr 4 of 2014.2015 www.nwdc.co.za Back to Table of Contents 1 12. 12.1 12.2 12.3 12.3.1 12.3.2 12.3.3 12.3.4 12.4 12.4.1 12.4.2 12.5 13. 14. RESEARCH AND DEVELOPMENT ACTIVITY REPORT Research and Development Annual Unit Plan Subscriptions Studies Outsourced/Purchased Support to DEED Support NWPC NWDC Geographical Information Systems (GIS) Desktop Studies/ Intelligence Intelligence International Reports including FDI and Global Competitiveness Engagement and/or participation in events with Economic Community, Research related meetings, Conferences, Workshops, IPA’s, World Economic Forum, WAIPA CHALLENGES RECOMMENDATIONS AND POSSIBLE SOLUTIONS TO CHALLENGES PORTFOLIO OF EVIDENCE INDEX 39 39 39 39 40 40 40 40 40 40 41 41 42 42 43 NWDC Economic Data Report. Qtr 4 of 2014.2015 www.nwdc.co.za Back to Table of Contents 2 1. INTRODUCTION The purpose of the Research and Development Unit is to gather, analyse and disseminate verified, reliable and relevant data, information and reports for the benefit of users to support informed decision making. The performance indicator of the unit is a quarterly economic data report. Economic data or economic statistics may refer to data (quantitative measures) describing an actual economy, past or present. These are typically found in time-series form, that is, covering more than one time period (say the monthly unemployment rate for the last five years) or in cross-sectional data in one time period (say for consumption and income levels for sample households). Data may also be collected from surveys of for example individuals and firms or aggregated to sectors and industries of a single economy or for the international economy. A collection of such data in table form comprises a data set. The purpose of this report is to supply an overview of the economic data and information gathered and shared from a global, South African, African and North West provincial perspective in order to ensure that recent, relevant and reliable economic data supports NWDC and other client and stakeholder decisions and activities. The report will include economic data as well as a report on research and development activities followed by a portfolio of evidence (PoE) index where the activities will be listed and the documents added in the PoE file. The economic data report will be structured as follows: First a macro-economic overview taking a global perspective in terms of developed and emerging economies moving to South Africa and the North West province. Secondly subjects that have an impact on the economy and relevance to NWDC will be covered including the Global Competitiveness, Foreign Direct Investment, Trade, The Future of Manufacturing and the State of the Province Address for the North West province (SOPA) as well as the Budget Speech of MEC of the Department of Economic and Enterprise Development and how it impacts on NWDC. 2. MACRO ECONOMIC OVERVIEW 2.1 The Global Economy Global growth is not gaining much traction: volatility will prevail The last two months have been increasingly challenging for the global economy as a result of greater volatility and uncertainty presenting a higher risk for 2015 and leading to some significant adjustments in The Conference Board Global Economic Outlook for 2015. Challenges include: The rapid decline in oil prices, Quick adjustments in exchange rates (with the US dollar appreciating and weakening of most other currencies, notably the euro), and New quantitative easing program of the ECB Increased geopolitical uncertainty related to the Russia-Ukraine and Middle East conflicts, NWDC Economic Data Report. Qtr 4 of 2014.2015 www.nwdc.co.za Back to Table of Contents 3 Increased concern about the economic and political future of the Euro Area and European Union. As a result, the global economic outlook for 2015 indicates that the overall global real GDP growth average is projected to be 3.3 %, the global average reflects a combination of upsides and downsides as follows: Russia (from +0.8 to −3.5 %) Euro Area (1.6 to 1.4 %), Japan (1.1 to 0.6 %), Brazil (1.5 to 0.5 %). United States (2.6 to 2.9 %), Mexico (2.8 to 3.5 %), India (5.5 to 5.9 %). The adjustments to India, however, do not reflect the recent substantial statistical upward revisions in India’s GDP growth measures, the reliability of which is still debated. The United States will continue to register stronger growth than its peers, but the expansionary phase will show signs of maturing, causing a moderation in profitability and a variety of cost pressures. European economies have more scope to recover, and the recently announced quantitive easing (QE) program may help improve business and consumer confidence, and the weakened euro could help offset negative effects from slower exports to emerging markets. However, Europe’s dysfunctional policy environment to accelerate growth through investment and reforms could make the recovery look moderate compared to the United States. China will continue its “soft fall” growth trajectory, as already limited government stimuli will have less effect despite recent monetary easing, and expose the weakening of China’s creditworthiness more clearly. Other major emerging markets will continue to grow, but their pace will vary depending on the net impact of declining oil prices and exchange rate depreciations, as well as progress of their own reform agendas. New geographies for growth, such as Africa and parts of Asia, offer opportunities to build sustainable growth models but they also bring challenges on economic, legal, and institutional fronts. Relative to the base scenario for the outlook, downsides to the global outlook could come from possible intensified political and economic risks. Upsides relate to: the ability of policy and business to invest in people, raise productivity, and rebuild trust and confidence, but they may need significantly more time than the current year to materialize. (Source: The Conference Board Global Economic Outlook 2015) Business Outlook US: Moderately positive US is projected to grow at a modest 2.9 percent in 2015. Profitability may come under increased pressure as the business cycle matures and cost increases are imminent. America’s strength in technological progress needs to help accelerate productivity. EURO-Area: Cautious short-term optimism, but downside risks accumulate Despite significant downside risks, the Euro Area is projected to grow at 1.4 percent in 2015. NWDC Economic Data Report. Qtr 4 of 2014.2015 www.nwdc.co.za Back to Table of Contents 4 The substantial QE program implemented by the European Central Bank can have a positive effect on sentiment, but whether it will produce significant effects to boost the growth outlook is debated. Modest recovery in domestic consumption is a likely source of growth as labour markets improve. However, disinflation or even deflation could bring growth rates further down. Asia-Pacific: Challenging in China; mostly positive elsewhere Despite softening growth rates, the Asia-Pacific region remains the leader for global growth. Growth rates of China and India are converging to 5.5 percent growth on average from 2015– 2019. Despite short-term headwinds from the global economy, Southeast Asia will continue to strengthen to become a global production hub. Latin America: Upside potential Economic conditions in Latin America are unlikely to improve rapidly in 2015, with regional growth at only 1.6 percent. Slowing prices for commodity and energy exports provide significant downside. Productivity growth should build on investment, improved business confidence, and a better educated labour force. Africa: Positive, but uncertain GDP growth in Africa in 2015 is projected at 4.4 percent. Nigeria will be the strongest performer at 6.7 percent growth in 2015, but it is heavily dependent on natural resources and vulnerable to global demand conditions as the economy is strongly represented by oil and gas. A positive growth outlook for Africa is strongly dependent on improved institutional performance and better governance. The World Economic Outlook Projections as per the World Economic Outlook Update January 2015 Overview of the World Economic Outlook Projections Update January 2015 Year over Year World Output (1) Advanced Economies United States Projections Difference from October 2014 Projections Q4 over Q4 Estimates Projections 2013 3.3 2014 3.3 2015 3.5 2016 3.7 2015 -0.3 2016 -0.3 2014 3.1 2015 3.4 2016 3.9 1.3 1.8 2.4 2.4 0.1 0.0 1.7 2.7 2.3 2.2 2.4 3.6 3.3 0.5 0.3 2.6 3.4 3.2 -0.5 0.8 1.2 1.4 -0.2 -0.3 0.7 1.4 1.4 Germany 0.2 1.5 1.3 1.5 -0.2 -0.3 1.0 1.7 1.3 France 0.3 0.4 0.9 1.3 -0.1 -0.2 0.3 1.2 1.3 -1.9 -0.4 0.4 0.8 -0.5 -0.5 -0.5 0.9 0.8 Euro Area Italy NWDC Economic Data Report. Qtr 4 of 2014.2015 www.nwdc.co.za Back to Table of Contents 5 Spain -1.2 1.4 2.0 1.8 0.3 0.0 1.9 1.8 1.7 Japan 1.6 0.1 0.6 0.8 -0.2 -0.1 -0.3 1.6 0.2 United Kingdom 1.7 2.6 2.7 2.4 0.0 -0.1 2.7 2.7 2.2 Canada 2.0 2.4 2.3 2.1 -0.1 -0.3 2.4 2.1 2.1 Other Advanced Economies (2) 2.2 2.8 3.0 3.2 -0.2 -0.1 2.3 Emerging Market and Developing Economies (3) Commonwealth of Independent States Russia 4.7 4.4 4.3 4.7 -0.6 -0.5 4.5 4.1 5.4 2.2 0.9 -1.4 0.8 -2.9 -1.7 -1.5 -3.5 1.8 1.3 0.6 -3.0 -1.0 -3.5 -2.5 0.0 -5.4 1.9 4.3 1.5 2.4 4.4 -1.6 -0.2 6.6 6.5 6.4 6.2 -0.2 -0.3 6.4 6.3 6.2 China 7.8 7.4 6.8 6.3 -0.3 -0.5 7.4 6.7 6.3 India (4) 5.0 5.8 6.3 6.5 -0.1 0.0 5.6 6.5 6.6 Asian-5 (5) 5.1 5.5 Excluding Russia Emerging and Developing Asia 5.2 4.5 5.2 5.3 -0.2 -0.1 4.6 Emerging and Developing Europe 2.8 2.7 2.9 3.1 0.1 -0.2 2.9 Latin America and the Caribbean 2.8 1.2 1.3 2.3 -0.9 -0.5 1.1 Brazil 2.5 0.1 0.3 1.5 -1.1 -0.7 -0.3 0.1 2.2 Mexico 1.4 2.1 3.2 3.5 -0.3 -0.3 2.6 3.4 3.5 2.2 2.8 3.3 3.9 -0.6 -0.5 2.7 3.6 2.8 2.7 -1.6 -1.7 5.2 4.8 4.9 5.2 -0.9 -0.8 Nigeria 5.4 6.1 4.8 5.2 -2.5 -2.0 South Africa 2.2 1.4 2.1 2.5 -0.2 -0.3 1.0 1.9 2.8 6.1 5.9 5.9 6.1 -0.6 -0.5 2.5 2.6 3.0 3.2 -0.2 -0.2 2.4 2.9 3.2 3.4 3.1 3.8 5.3 -1.1 -0.2 2.0 3.0 3.7 4.8 -0.6 -0.2 5.5 3.6 3.2 6.1 -2.9 -0.2 Oil (7) -0.9 -7.5 -41.1 12.6 -37.8 14.6 -28.6 -19.5 9.6 Nonfuel (average based on World commodity export weights) Consumer Prices -1.2 -4.0 -9.3 -0.7 -5.2 0.1 -7.4 -4.5 -0.4 Advanced Economies 1.4 1.4 1.0 1.5 -0.8 -0.4 1.4 1.0 1.8 Emerging Markets and Developing Economies (3) 5.9 5.4 5.7 5.4 0.1 0.2 5.8 6.3 5.6 Middle East, North America, Afghanistan and Pakistan Saudi Arabia (6) Sub-Saharan Africa Memorandum Low-Income Developing Countries World Growth Based on Market Exchange Rates World Trade Volume (Goods and Services) Imports Advanced Economies Emerging Markets and Developing Economies Commodity Prices (U.S. dollars) NWDC Economic Data Report. Qtr 4 of 2014.2015 www.nwdc.co.za Back to Table of Contents 6 London Interbank Offered Rate (%) On U.S. Dollar Deposits (6 month) 0.4 0.3 0.7 1.9 0.0 0.3 0.3 1.1 2.6 On Euro Deposit (3 month) 0.2 0.2 0.0 0.1 -0.1 -0.1 0.1 0.0 0.1 On Japanese Yen Deposit (6 month) 0.2 0.2 0.1 0.1 0 0 0.2 0.1 0.1 Note: Real effective exchange rates are assumed to remain consistent at the levels prevailing December 8, 2014 to January 5, 2015. When economies are not Listed alphabetically, they are ordered on the basis of economic size. The aggregated quarterly data are seasonally adjusted. (1) The quarterly estimates and projections amount to 90% of the world purchasing-power-parity weights. (2) Excludes the G7 (Canada, France, Germany, Italy, Japan, United Kingdom, United States) and euro area countries. (3) The quarterly estimates and projections amount for approximately 80% of the emerging market and developing economies. (4) For India, data and forecasts are presented on a fiscal year basis and output growth is based on GDP at market prices. Corresponding growth rates for GDP at factor costs are 4.7, 5.6, 6.3, and 6.5 % for 2013/14, 2014/15, 2015/16, and 2016/17, (5) Indonesia, Malaysia, Philippines, Thailand, Vietnam (6) For Saudi Arabia, the revisions to the growth forecasts for 2015-16 partly reflect a rebalancing of the national accounts to 2010, which resulted in a higher share of the oil sector in the economy and a downward revision of estimated actual growth in 2013 and 2014 (7) Simple average of prices of UK, Brent, Dubai Fateh, and West Texas Intermediate crude oil. The average price of oil in U.S. dollars a barrel was $96.26 in 2014: the assumed price based on futures markets is $56.73 in 2015 and $63.88 in 2016. 2.1.1 IHS Top-10 Economic Predictions for 2015 During the past three years, world growth has been stuck at around 2.5%—to be specific, 2.5% in 2012, 2.6% in 2013, and 2.7% in 2014. During that time, the contribution from the advanced economies (especially the United States and Europe) has increased, while the additions to global growth from emerging markets have decreased. IHS expects a slightly better overall performance for the world economy in 2015, with an expected growth rate of 3% or slightly higher. Solid and improving growth in the United States and a slight pickup in the pace of Eurozone economic activity are among the reasons for this moderately upbeat assessment. In the same vein, much lower oil prices and more monetary stimulus—in particular, from the Bank of Japan (BoJ), the European Central Bank (ECB), and the People’s Bank of China (PBoC)—will not only support growth, but could also provide the basis for some upside surprises. Unfortunately, many of the downside risks that have plagued the global economy since the end of the Great Recession remain in place, including high public- and private-sector debt levels, corporate risk aversion, and daunting geopolitical risks. i. US growth will be solid, in the 2.5–3.0% range. ii. The Eurozone recovery will proceed at a sluggish pace, but UK growth will be robust. iii. Japan’s economy will regain weak growth momentum. iv. China’s growth rate will decelerate more, but remain stronger than most. v. A few emerging markets will struggle, while many will see above-average growth. vi. Commodity prices will slide further. vii. Inflation will be a distant threat, while deflationary worries persist. viii. The Federal Reserve, Bank of Canada, and Bank of England will likely start raising interest rates, while most other central banks will be on hold or provide more stimulus. ix. The US dollar will rise against most currencies, while the euro and yen will fall. NWDC Economic Data Report. Qtr 4 of 2014.2015 www.nwdc.co.za Back to Table of Contents 7 x. 2.1.2 Perennial downside risks will be balanced by some upside risks. Shockwaves and Economic Competitiveness In the IHS Quarterly Economics of Q1 2015 Zbyszko Tabernacki; Vice President IHS Economics and Country Risk reports that Shockwaves and economic competitiveness are key issues that will influence the economy in 2015. The recent rapid decline in oil prices is one of the latest shockwaves that hit the economy. The lower oil prices will benefit oil importing countries and have a negative impact on oil exporting countries. This in turn will produce divergent responses from policy makers and central banks as they attempt to stimulate growth and prevent deflation. The resulting violent swings in interest and exchange rates will cause rapid shifts in capital flows as investors seek higher returns at lower risk. Competitiveness will thus be the main issue. 2.1.3 Emerging Economies Growth has weakened dramatically in some economies, and there are no clear signs of a strong rebound. The growth premium relative to the developed world is the smallest since 2002. Emerging markets currencies have depreciated since 2013 of which South Africa’s currency was the most severely affected. The new realities for emerging markets include: Both structural and cyclical forces contributed to the emerging markets’ slowdowns. There was no decoupling of growth in emerging and advanced economies. The era of easy credit is coming to an end. The commodity “super-cycle” is over. Globalization has slowed. While macroeconomic management has generally been sound, there have been too few structural reforms; the state still plays too large a role. Cheap credit was used to finance consumption rather than a deepening of the capital stock, thus creating bottlenecks and hurting productivity growth. A return to the boom years of the 2000s is unlikely without stronger productivity growth. African Political Risk Three key African political risks that will affect economic growth and investment in the five-year outlook are: Political change and influence Regulatory risk and ‘resource nationalism’ Political violence and security risk NWDC Economic Data Report. Qtr 4 of 2014.2015 www.nwdc.co.za Back to Table of Contents 8 Sub-Saharan African Realities Services play a bigger role in the economy Structural transformation in the economy has not yet taken place. Most economies are resource based. Pressure on current account increases Highly unequal society as agricultural sector employment dominate 2.2 South African Realities 2.2.1 Highlights Q4 2014/2015 South African Economic Growth Q4 2014/2015 Treasury has cut the economic growth outlook for South Africa to 2% for 2015 and 2.4% for 2016 from 2.5% and 2.8% previously. The table below reflects Statistics South Africa economic indicators in Q4 2014 2015: INDICATOR for SA MONTH /YEAR % GDP Growth CPI PPI 2014 Q4 Feb 2015 Jan 2015 4,1% 3,9% 3,5% Quarter on Quarter or Year on Year QoQ YoY YoY Budget 2015/2016 Finance Minister, Nhlanhla Nene, South Africans can expect a tough few years of higher taxation as government needs to address the national budget deficit (3.9% in 2014 2015, set to narrow to 2.5% in 2017/2018) while South Africa is hampered by a weak and uncertain economic growth outlook forecast. Government debt has raised from 21.8% in 2008 2009 to 40.8% in 2014 2015. Interest payments on this debt is was R155bn this year and has become the fastest growing item of government expenditure. SA is budgeting to spend R420 bn over the next 3 years to service debt at an interest rate of 9.4%. In addition to tax increases, curbs on wastage, and the deficit –neutral financing of state-owned enterprises, government still needs to reduce expenditure by R25 bn over the next two years and freeze personnel numbers. R17bn will be collected from taxpayers through a variety of measures including a 1%increase in the marginal personal income tax rates for all but the lowest earners.(Fiscal Drag is the deflationary effect of a progressive taxation system on a country's economy. As wages rise, a higher proportion of income is paid in tax). NWDC Economic Data Report. Qtr 4 of 2014.2015 www.nwdc.co.za Back to Table of Contents 9 A large part of tax changes will fall on indirect, consumption taxes of which the fuel levy of 80,5 cents is the highest and will raise government income from fuel levies from 27.6% to 41% generating an extra R6,4 bn in the coming fiscal year. Apart from the weak economic growth, energy supply concerns have further complicated the fiscal consolidation process. The 2% real GDP forecast for 2015 is premised on the assumption that there will be intermittent load shedding. Should there be further deterioration in electricity availability growth could fall to 1% this year. Exports are currently doing well with the exchange rate in favour of exports, however South African exports are commodity based and if the global economic growth slows down more than anticipated by the IMF, commodity prices will slide by a further 10% and SA growth will decline to 1,5% in 2015 and 2,1% in 2016. (Source: Financial Mail; Budget 2015/2016 Straining the limits – The budget shows government is serious about returning SA to fiscal health: February 26 to March 4 2015) CPI Consumer price inflation for 2014 was 6.18%. In January 2015 it was 4.4% and in February 2015 it was 3.9%. This was largely attributed to the drop in fuel prices resulting in a drop in food prices. However the CPI will increase again as hikes in fuel prices of up to R2 per litre are expected. Headline inflation fell within the South African Reserve Bank’s target range of 3 – 6%. General Remarks o Worldwide the consumer is under pressure in South Africa the retail sales over the last year have hovered between 1 and 2 % of GDP where in China it was 10%. o In terms of the monetary policy South Africa has a prime rate at 5% where Europe is below 1% and USA 0%. If South Africa increases the interest rate the spending will further decrease and impact on the growth it will hopefully then increase saving and investment. o South Africa’s Purchasing Managers Index (PMI) has dropped below 45 where the USA is increasing and is at 55. o South Africa’s large current account deficit is a problem. o Fiscally South Africa does not have much space to move for infrastructure investment and there is no fiscal support to counteract the increased deficit on the current account largely due to the weakening of the Rand against the Dollar. o South Africa has an external deficit and we need sustainable FDI. o Investors need certainty with regards to the safety of their investment. o South Africa needs sustainability o South Africa’s per capita growth is impressive. Nigeria might have a larger GDP but they have 3 x the population and 3,5 times the population growth of South Africa NWDC Economic Data Report. Qtr 4 of 2014.2015 www.nwdc.co.za Back to Table of Contents 10 o o o o 2.2.2 South Africa’s social spending is 60% and it is not sustainable. Poverty and inequality is levelling. Consumer spending dominates investment spending The tertiary sector (services) growth is bypassing mining- and to a large extent manufacturing growth. Is South Africa a sustainable investment destination? Traditional growth theories and modern day case studies are not enough anymore to determine whether a country’s growth will be sustainable to support profitable but also safe investment. Investment decisions are progressively being driven not only by the potential to maximise returns but also to improve the company’s socio-economic footprint. Africa is the fastest growing continent but is also unique in terms of challenges and opportunities Therefore, IHS recommends 5 critical criteria to guide investment decisions. South Africa’s attractiveness as investment destination will depend on structural reforms that lower labour market disruptions, raise productivity and increase capital spending. 2.2.3 IHS Global Insight Identifies 5 Critical Factors to Watch FACTOR Source of growth (IHS) Exports (IHS and (WTO) Fiscal and external balances(IHS) Level of transformation of economy Socio-economic development 2.2.4 COMPONENTS • Demand composition • Supply side (production) • Intensity • Diversity • Markets • Economic stability • Productivity • Technological upgrading • Employment • Equality • Education • Health • Environment • Governance South Africa’s Export intensity South Africa is not so exposed and can increase exports. South Africa has markets but the diversity and composition of exports is the problem as mining and manufacturing is the major sectors but our production sectors are not showing any growth of employment and investment as productivity is decreasing and costs are increasing and it is not sustainable. 2.2.5 The following structural transformation in the economy is needed NWDC Economic Data Report. Qtr 4 of 2014.2015 www.nwdc.co.za Back to Table of Contents 11 Rise in agricultural sector productivity Stronger links with manufacturing sector Skills development Labour shift from low-productive agricultural sector to higher productive manufacturing sector Worker income increases Poverty levels drop, income distribution improves Country production base broadens Economic diversification into high tech manufacturing and services 2.2.6 South Africa’s sustainability “hope”: National Development Plan (NDP) The NDP is South Africa’s long term plan to 2030 and might be the sustainability ‘hope” of the country. It seeks amongst other things to reduce unemployment by improving manufacturing. The NDP will also result in a change in the risk for labour unrest by reducing it. The New Growth Path, which is a short term plan drawing from the NDP goes into detail with the work that has to be done and sets a target of creating 5 million jobs in 10 years. It identifies inter alia: The mining value chain, with a particular emphasis on mineral beneficiation as well as on increasing the rate of mineral resource extraction as key activities to stimulate growth The following issues must be addressed as per the NDP: • Boost educational levels. • Promote industries that are labour-absorbing, such as mining, agriculture, construction, hospitality and small businesses. • Grow the more advanced sectors of the economy, such as manufacturing, parts of financial services, telecommunications and businesses services. • Provide a social wage to enable the poorest of South Africa's people to have a decent standard of living and to build their capabilities to get better jobs, higher incomes and a broader range of benefits. • The NDP seeks to place the economy on a production-led trajectory. 2.3 North West Province Economic Overview 2.3.1 North West Key Economic Indicators Compared to South Africa SOUTH AFRICA NORTH WEST NW as % of SA NWDC Economic Data Report. Qtr 4 of 2014.2015 www.nwdc.co.za Back to Table of Contents 12 TOTAL GDP-R: Constant 2005 prices (R 1000) GDP GROWTH: Constant 2005 prices GDP PER CAPITA: INFLATION (CPI) annual average: R 1 993 432 664 R 102 693 066 (2013) IHS Global Insight (2013) IHS Global Insight 1.9% 1.6% (2013) IHS Global Insight (2013) IHS Global Insight R37 632 R28 437 (2013) IHS Global Insight (2013) IHS Global Insight 6.1% 6.1% ( Average for 2014) STATSSA (Average for 2014) STATSSA EXPORTS VALUE: IMPORTS VALUE: R 924,5 Billion R 20,2 Billion (2013) IHS Global Insight (2013) IHS Global Insight R 991,2 Billion R 6 Billion (2013) IHS Global Insight (2013) IHS Global Insight 5.15% 75.5% 2.18% 0.6% From the above it is clear that the North West province has lower export and import figures compared to South Africa, however the trade balance is positive with more exports than imports. It must also be noted that companies with operations in the North West province office have head offices in Gauteng or other provinces and that imports and exports are often recorded in those provinces although the production takes place in the North West. 2.3.2 Current realities in the North West province The NWP and its four district municipalities’ key demographic and socio-economic characteristics are summarised in the table below and placed in context to the South African picture. The region covers approximately 105 076 square kilometres, forming 8.6% national area. The NWP is not densely populated when compared to the national population density. The NWP houses approximately 7% of the country’s total population. The 2013 IHS Global Insight Indicators show an improvement in most of the developmental indicators in 2013 (2008 used as baseline). Most notable is the improvement in the Human Development Index (HDI) currently at 0.59 from 0.52 in 2008. Similar improvements are seen in both the number and percentage of people living in poverty, currently measured at 1,695,269 (1,932,918 in 2008) and 46.9% (58% in 2008) respectively. Improvements in all measures relating to schooling and education are also reported. IHS Global Insight’s Index of Buying Power (IBP) indicates that only 5% of the country’s spending power is located in the NWP. Income levels in the NWP are below the national average (which is to be expected for the more rural areas in South Africa). The unemployment rate is slightly lower than that of the national average, while the percentage of people in poverty is marginally higher than the national average. The NWP has a share of approximately 10.8% of national employment. National, NWP and NWP district municipalities’ key comparative statistics (2013) Key Statistics 2 Region area (km ) Population Population density (number of 2 people per km ) NWP BJDM NMMDM RSMDM KKDM National 105 076 18 370 27 985 44 053 14 668 1 221 246 3 611 176 1 569 891 855 894 469 624 715 766 52 970 625 34 85 31 11 49 43 NWDC Economic Data Report. Qtr 4 of 2014.2015 www.nwdc.co.za Back to Table of Contents 13 Economically active population (as % of total pop.) 30.2% 36.7% 22.2% 20.0% 32.3% 35.6% 1 235 372 588 505 260 465 143 657 242 745 15 139 198 122 786 124 676 104 618 92 209 155 794 156 757 37 005 41 174 28 048 24 849 46 547 44 802 0.607 0.596 0.600 0.584 0.621 0.638 640 962 341 539 109 372 51 773 138 278 11 794 712 101 092 51 994 18 338 9 442 21 317 2 259 965 26.2% 24.6% 28.9% 29.6% 26.3% 25.0% Percentage of persons in poverty 46.9% 39.7% 56.6% 59.1% 43.2% 45.8% Poverty gap (R Million) 27.9% 27.2% 28.6% 28.7% 27.8% 28.1% Human Development Index (HDI) 0.590 0.616 0.544 0.516 0.619 0.637 Index of buying power (IBP) 0.0538 0.0256 0.0090 0.0044 0.0148 1.0000 Economic output (R Million current prices) Share of economic output (GVA % of SA in current prices) Economic output (R Million constant 2005 prices) Share of Economic output (GVA % of SA in constant 2005 prices) 171 421 565 5.66% 115 520 400 3.81% 22 603 501 8 387 462 24 910 201 0.75% 0.28% 0.82% 3 030 262 863 100.00% 92 228 431 55 727 727 14 491 624 5 320 765 16 688 314 5.19% 3.13% 0.82% 0.30% 0.94% Number of households Average household income (Rand, current prices) Annual per capita income (Rand, current prices) Gini coefficient Formal sector employment estimates Informal sector employment estimates Unemployment rate (Official definition) 1 777 953 664 100.00% Source: IHS Global Insight’s Regional eXplorer % Growth With regards to the growth rate it can be reported as follows: The Average Annual growth rate has recovered from the 2012 figure of -0.4% for the North West Province to 1.8% for 2013 5.0% 4.0% 3.0% 2.0% 1.0% 0.0% -1.0% -2.0% -3.0% Average annual growth (Constant 2005 Prices) National NW BPDM NMMDM DRSMDM DKKDM 2011 3.4% 2.9% 3.3% 2.0% 2.0% 2.8% 2012 2.4% -0.4% -2.1% 1.8% 2.3% 3.0% 2013 1.9% 1.8% 1.8% 0.1% 1.3% 3.7% 2006-2011 2.9% 2.1% 2.0% 2.7% 3.1% 1.5% 1996-2013 3.2% 2.0% 3.3% 1.5% 1.8% -0.7% NWDC Economic Data Report. Qtr 4 of 2014.2015 www.nwdc.co.za Back to Table of Contents 14 The NWP is a large and significant local economy in the South African economic context. The area contributes approximately 5.7% to national production with mining, agriculture and manufacturing contributing the largest portion of provincial output. According to the Regional Economic Review: Current realities in the North West Province, A report from the TRADE (Trade and Development) research niche area of the North West University; March 2014, the provincial economy is structurally unbalanced with the primary and tertiary sectors contributing more towards GDP-R and growing faster than the secondary sector. The situation is further exacerbated by limited water and electricity supply, the poor state of infrastructure, shortage of skilled labourers and rigid regulatory and legislative policies. A provincial input-output analysis points to a situation of high economic leakages and a dislocation of supply and demand across a number of industries. This has resulted in input and output activities between industries not operating in tandem, minimising the competitiveness of the province. 100% 90% Sector's share of regional total (%) 80% 48.3 48.9 70% 60% 59.9 76.7 67.4 72.1 56.1 75.4 82.1 50% 7.0 40% 22.9 6.0 8.5 30% 13.9 20% 10% 34.1 19.3 4.1 15.8 2.0 44.2 22.0 18.6 5.9 Secondary sector 35.4 3.5 0% Primary sector 28.8 21.1 Tertiary sector GVA sector share of provincial total, 2013 Source: IHS Global Insight’s Regional eXplorer Economic and structural realities in the North West province include; 65% of the province is rural with a low economic base, the province has poor and deteriorating economic infrastructure, mining contributes 36.6% of gross domestic product by region (GDPR) and 21.6% of provincial employment, the North West Province is the largest producer of platinum group metals in South Africa, accounting for some 64.7% of the nation’s output, the province is also home to gold, uranium, diamonds, fluorspar, copper, vanadium, limestone, slate, phosphate, coal, manganese, dimension stone, cement and nickel. the economy has a strong local Small and Medium Enterprise (SME) base, with many becoming involved in high-value activities such as exporting and investment in Research & Development NWDC Economic Data Report. Qtr 4 of 2014.2015 www.nwdc.co.za Back to Table of Contents 15 (R&D) and Innovation. As a result, the province has the opportunity to further develop these areas and work towards an economy based on innovative firms competing in export markets. tourism is the 4th most important economic sector in this predominantly rural, and scenic, province. The NWP has a total of 14 provincial parks within its borders. The most well-known are the Pilanesberg and Madikwe National Parks and the province boasts a wide array of species, ecosystem and habitats – including the Big Five in a malaria-free environment. the province accounts for a small share of South Africa’s overall international trade and contributed 4.4% to trade output in 2013. Close proximity to Gauteng provides access to markets making trade an important sector in the NWP. Mining was the most profitable sector in the NWP with a high concentration of profits accruing to mining firms in the BJDM. the NWP is a net exporter of goods. However, the NWP has a very concentrated export basket – not only in terms of products, but also in terms of the countries or regions traded with. In addition, the exported goods are largely commodity-based, implying a greater threat of price volatility and hence fluctuating export earnings. Exports from the NWP are concentrated within ten broad sectors, i.e. o SIC 71 – Pearls, precious or semi-precious stones, precious metals; o SIC 72 – Iron and steel; o SIC 99 – Other unclassified goods; o SIC 26 – Ores, slag and ash; o SIC 28 – Inorganic chemicals; o SIC 25 – Salt, sulphur, earths and stone, plastering materials, lime and cement; o SIC 10 – Cereals; o SIC 84 – Nuclear reactors, boilers, machinery and mechanical appliances; o SIC 31 – Fertilizers; and o SIC 74 – Copper and articles thereof. NWDC Economic Data Report. Qtr 4 of 2014.2015 www.nwdc.co.za Back to Table of Contents 16 Gross Value Added by Region (GVA-R) Broad Economic Sectors (9 sectors) Sector's share of regional total (%) (2013) 70.0% 60.0% Axis Title 50.0% 40.0% 30.0% 20.0% 10.0% 0.0% Agriculture Mining Manufactu ring Electricity Constructi on Trade Transport Finance Communit y services SA 2.4% 9.2% 11.6% 3.0% 3.7% 16.6% 8.9% 21.5% 23.1% NW 2.5% 41.6% 3.3% 1.6% 2.0% 10.8% 5.7% 12.7% 19.7% BPDM 0.8% 59.3% 3.0% 1.2% 1.6% 9.7% 4.8% 10.3% 9.3% NMMDM 5.6% 3.8% 4.5% 3.2% 2.0% 10.0% 5.6% 13.8% 51.4% DRSMDM 14.7% 3.1% 2.9% 2.4% 3.0% 13.4% 6.5% 16.7% 37.4% DKKDM 3.9% 6.8% 4.1% 2.1% 3.4% 16.1% 9.3% 21.4% 33.0% North West Location and Infrastructure Location is one of the NWP’s greatest natural advantages. The main Cape Town to Zimbabwe railway line runs through the provincial capital of Mahikeng, linking the NWP to several southern African countries, including Angola, Zambia and Botswana. An extensive road network connects the major commercial centres of the province to the rest of the country via a network of 1 785 km of national roads. The vital east-west corridor links the east Africa seaboard at Maputo to the western African seaboard at Walvis Bay, running through the NWP en-route. Its strategic positioning has been further improved with the completion of the Trans Kalahari Corridor through Botswana and Namibia – and these developments bode well for a thriving business and tourism economy. In terms of airports, Mahikeng has an established airport with one of the longest runways in the world and Pilanesberg (near Sun City) also has an international airport, servicing primarily the tourism industry. Water is considered one of the key limiting factors to development in the NWP. The province is not only depleting its precious water reserves, but suffers from an additional problem – that of pollution of groundwater caused by both natural and human-induced factors including mining and industrial activities, agriculture and domestic use. With regards to electricity, the NWP has a well-developed electricity distribution network due to mining activities. The current electricity crisis can also be seen as an opportunity to develop other energy technologies and to invest in renewable energy. NWDC Economic Data Report. Qtr 4 of 2014.2015 www.nwdc.co.za Back to Table of Contents 17 Given the economic growth forecasts, key demographic and socio-economic characteristics and the current economic and structural realities in the North West the NWPG has an important role to play in setting the framework for growth and outlining the necessary actions to stimulate growth in areas such as innovation, research and development, skills, education, exports, FDI and entrepreneurship. This also means identifying and supporting business growth in areas where there is the greatest potential, whilst ensuring that the necessary economic infrastructure Employment North West Employment Figures Compared to South Africa (Source: STASSA Q4 2014) Item Employment increase Unemployment increase Unemployment Rate Expanded unemployment rate Number % Change Oct -Dec 2014 Qtr-to- Qtr SA NW SA 203 000 80 000 1,3 -242 000 -6 000 -4,7 24,3% 25,2% -1,1 34.6% 40,0% -1,2 NW 3,0 -5,3 -1,6 -1,8 % Change Year on year SA NW 0,9 9,2 1,6 -1,8 0,2 -2,1 0,6 -2,2 Although the unemployment rate is high, the employment figures of the North West province compare favourably with those of South Africa and have been increasing over the last few quarters. North West Employment by Industry Figures Compared to South Africa (Source: STASSA Q4 2014) Item Number Employment by Industry SA Total Agriculture Mining Manufacturing Utilities Construction Trade Transport Finance and other business services Community and social services Private households 15 320 000 742 000 427 000 1 749 000 104 000 1 334 000 3 247 000 952 000 2 039 000 3 501 000 1 219 000 % Change Qtr-to- Qtr % Change Year on year NW OctNW OctSA NW SA NW Dec 2013 Dec 2014 869 000 948 000 1.3 3.0 0.9 9.2 42 000 42 000 8.2 8.6 4.0 0.2 163 000 150 000 -3.2 -10.5 0.3 -8.2 81 000 76 000 0.5 2.3 -1 -6.4 3 000 2 000 -12.5 -9.8 -18.3 -16 59 000 56 000 4.2 6.2 10.8 -5.1 163 000 177 000 1.6 7.7 0.7 8.7 31 000 36 000 2 6.8 -1 15.3 63 000 78 000 0.7 7.7 0.1 23.6 192 000 238 000 -0.4 2 0.9 24.4 72 000 93 000 3.2 15.2 -2.1 28.8 NWDC Economic Data Report. Qtr 4 of 2014.2015 www.nwdc.co.za Back to Table of Contents 18 According to the Q4 2014 Labour Force survey of Stats SA the North West province employs about 150 000 people in the mining sector, contributing 15.8% to the total employment of the North West. 3. SOUTH AFRICA’S GLOBAL COMPETITIVENESS The Global Competitiveness Report 2014 – 2015 by the World Economic Forum’s (WEF) assesses the competitiveness landscape of 144 economies, providing insight into the drivers of their productivity and prosperity and measures over 100 indicators. South Africa ranked no 56 in 2014 down from 53 in 2013. Positive rankings include: Quality of its institutions (36th), Including intellectual property protection (22nd), Property rights (20th), Efficiency of its legal framework in challenging and settling disputes (ninth and 15th, respectively), Accountability of private institutions (2nd ) Financial market development remained impressive at seventh place, although their data pointed to "more difficulties" in all channels of obtaining finance Efficient market for goods and services, business sophistication and innovation, benefiting from good scientific research institutions, and strong collaboration between universities and the business sector in innovation were also identified as points supporting competitiveness. Challenges include: "South Africa’s strong ties to advanced economies, notably the euro area, have made it more vulnerable to the economic slowdown of those economies," the WEF said. These ties were identified as likely contributors to the deterioration of fiscal indicators in South Africa, including macroeconomic environment performance which dropped sharply in this year’s index. Diversion of public funds, Perceived wastefulness of government spending, General lack of public trust in politicians Health of the workforce — at 132nd as a result of high rates of communicable diseases Higher education and training, Labour market efficiency Labour-employer relations (144th) "Raising education standards and making its labour market more efficient will thus be critical in view of the country’s high unemployment especially youth. 4. FOREIGN DIRECT INVESTMENT (FDI) 4.1 Global Investment Trends Cautious optimism returns to FDI; after 2012 slump a 9% increase in 2013, to $1.45 trillion. Developing economies maintain their lead in 2013 reaching a new high of $778 billion, or 54% of total FDI. FDI outflows from developing countries also reached a record level: Developing and transition economies together invested $553 billion, or 39%. NWDC Economic Data Report. Qtr 4 of 2014.2015 www.nwdc.co.za Back to Table of Contents 19 Mega regional groupings shape global FDI; Asia-Pacific Economic Cooperation (APEC) remains largest with 54% inflows. Poorest countries are less dependent on extractive industry investment; manufacturing and services now make up 90%of value of announced projects both in Africa and Least Developed Countries (LDCs). Private equity FDI is keeping its funds, thus there is potential for increased private equity FDI. State-owned TNCs are FDI heavyweights; although their number constitutes less than 1% of TNCs they contribute over 11% of global FDI flows. (Source: UNTAD World Investment Report 2014) 4.2 Africa Regional Investment Trends: FDI flows to all major developing regions increased; Africa saw increased flows of 4%, sustained by growing intra-Africa flows. Southern and East Africa received more than 50% of FDI inflows into Africa. There is a focus shift towards Sustainable Development Goals (SDGs) and an Action Plan for promoting private sector contributions. SDGs are being formulated by the United Nations. Foreign Direct investment (FDI) into Africa from 2008 to 2013 Foreign Direct Investment (FDI) into Africa 2008 to 2013, USD billion Sources: Standard Bank, UNCTAD 70.0 60.0 50.0 40.0 14.2 6.7 12.3 4.4 3.9 5.0 6.0 4.5 4.5 7.6 4.8 9.4 30.0 12.5 10.0 6.2 9.9 8.2 8.5 14.8 16.6 12.0 20.0 13.2 5.4 14.2 18.6 23.2 19.0 16.6 16.6 15.5 2012 2013 8.5 0.0 2008 Southern Africa 4.3 2009 2010 East Africa 2011 Central Africa West Africa2 North Africa South Africa NWDC Economic Data Report. Qtr 4 of 2014.2015 www.nwdc.co.za Back to Table of Contents 20 (Source: Prepared by Trade and Investment South Africa (TISA) a division in the dti) Between January 2008 and June 2014 a total of 563 FDI projects were recorded in South Africa. These projects represent a total capital investment of ZAR291.04 b which is an average investment of ZAR517.25 m per project. During the period, a total of 110,370 jobs were created. Destination State Projects Gauteng Western Cape Eastern Cape KwaZulu-Natal Northern Cape Mpumalanga North West Limpopo Free State Not Specified Total Notes: 1) 2) 3) 4) 4.4 247 89 39 37 23 13 8 7 7 93 563 CAPEX 77370.9 25686.9 26841.0 22086.0 27751.8 8981.2 6031.4 7719.8 11203.9 77366.1 291038.8 Avg. CAPEX 312.9 288.3 688.1 597.2 1206.7 690.8 753.7 1102.8 1600.3 831.6 517.2 Jobs Created 33665 9626 10613 9671 4149 4502 5078 3318 2880 26868 110370 Avg. Companies Jobs Created 136 225 108 84 272 29 261 29 180 14 346 12 634 8 474 5 411 7 288 91 196 442 ©fDi Intelligence, from the Financial Times Ltd 2014. Data subject to terms and conditions of use. All Capex Figures shown in the table are in ZAR - South African Rand millions. Capex data includes estimated values Financial Times Ltd takes no responsibility for the accuracy or otherwise of this data. Jobs data includes estimated values Financial Times Ltd takes no responsibility for the accuracy or otherwise of this data. North West Province The North West Province received 1.42% (8) of all project (563) in South Africa between 2008 and 2014. This represents 2.07% (R 6 billion) of the capital investment and 4.6% (5 078 jobs). North West FDI Projects Detail # Project Date Investing Company 1 Apr 2014 Syngenta IGE Resources (International 2 Dec 2011 Gold Exploration) 3 Apr 2011 Monsanto 4 Aug 2010 Xstrata-Merafe 5 Aug 2009 Platinum Australia 6 Nov 2008 Anglo Platinum 7 Jun 2008 Primus Special Projects (Pty) 8 Jun 2008 Guangzhou Pharmaceuticals Industry Sector Food & Tobacco Minerals Food & Tobacco Metals Metals Metals Minerals Food & Tobacco Capital R mil Jobs 63.545 57 379.908 383 153.740 934.739 1950.107 1950.107 379.908 219.335 127 1218 1398 1398 383 114 It must be noted that the information above was sourced from ©fDi Intelligence, from the Financial Times Ltd 2014 and that the projects above might not represent all the projects and expansions in the NWDC Economic Data Report. Qtr 4 of 2014.2015 www.nwdc.co.za Back to Table of Contents 21 North West province as some projects are reported in other provinces as the head office of the investing companies are located there. 5. TRADE Presenting the contents of the report in Johannesburg, Unctad economist Alex Izurieta said that international trade had slowed as a result of weak global demand. He also argued that demand was unlikely to strengthen materially in the near term, owing to a still weak global recovery. Unctad expects global growth of between 2.5% and 3% in 2014. The way to expand trade at global level is through a “robust domestic-demand-led output recovery at national level”, rather than through the current emphasis on the cost of trade. In the report, Unctad outlines a “balanced-growth scenario” premised on: income policies that support growth of demand; growth- enhancing fiscal policies; industrial policies to promote private investment and structural transformation; regulation of finance and capital controls to stabilise global financial markets; and development- orientated trade agreements. Such policy prescriptions mesh with South Africa’s current deliberations on the introduction of a national minimum wage, as well as using public infrastructure investment programmes to stimulate demand for locally made manufacturing inputs. However, there is less alignment in the area of trade policy, where South Africa aims to bolster the competitiveness of its tradeables sectors in a bid to materially increase exports, particularly the export of manufactured products. “It is possible to achieve higher levels of global growth of above 6% to 7% continuously over the next ten years through a coordinated effort to press the accelerator on fiscal support,” Izurieta, who co-authored the report, argues. Such support would be in the form of higher government spending on infrastructure, raising privatesector investments in productive activities and income policies that help bolster wages and, in so doing, create new demand. To support such an outcome, Unctad says developing countries should be allowed sufficient “policy space” to pursue proactive trade and industrial policies as part of the Post-2015 Development Agenda, currently under consideration. It also cautions developing countries not to enter into multilateral and bilateral agreements that will further erode their policy space to protect domestic industries, or to limit government’s ability to maximise the rents they are able to extract from the resources sector. Edited by: Terence Creamer The following trade statistics were sourced from IHS Global Insight Regional Explorer with regards to trade of South Africa and the North West province. NWDC Economic Data Report. Qtr 4 of 2014.2015 www.nwdc.co.za Back to Table of Contents 22 International Trade Totals 2013 Exports (R 1000) Imports (R 1000) Total Trade (R 1000) Trade Balance (R 1000) Exports as % of GDP Total trade as % of GDP Regional share - Exports Regional share - Imports Regional share - Total Trade 6 South Africa 924 055 893 991 185 991 1 915 241 883 -67 130 098 27.3% 56.6% 100.0% 100.0% 100.0% North West 20 156 967 6 022 629 26 179 596 14 134 338 10.5% 13.7% 2.2% 0.6% 1.4% SUMMARY OF STATE OF THE NATION ADDRESS AND NATIONAL BUDGET SPEECH 2015 The President outlined 9 strategic priorities to be pursued this year in partnership with the private sector and all stakeholders o Resolving the energy crisis o Revitalising agriculture o Adding value to our mineral wealth o Enhancement of Industrial Policy Action Plan o Encouragement of private investment o Reducing workplace conflict o Unlocking the potential of small enterprises o Infrastructure investment o Support implementation of NDP through Phakisa laboratories Consolidated Government Expenditure by Function 2014/15 – 2017/18 2014/15 R billion Basic Education Health Defence, Public order and safety Post school education and training Economic Affairs Local Development and social Infrastructure General public services Social Protection Allocated Expenditure Debt-service costs Unallocated reserves Consolidated expenditure Revised Estimates 2015/16 2016/17 2017/18 Medium- term estimates 189.5 144.6 163.0 56.6 189.4 176.6 203.5 157.3 171.2 62.2 206.2 199.6 216.0 167.5 181.2 65.6 219.5 210.2 227.8 177.5 192.7 69.6 225.5 223.8 64.7 143.9 1128.4 115.0 1243.4 64.4 155.3 1219.6 126.4 5.0 1351.0 66.8 166.0 1292.8 141.0 15.0 1448.8 69.8 176.5 1363.4 153.4 45.0 1561.7 2014/15 2017/18 Average Annual Growth 6.3% 7.1% 5.7% 7.1% 6.0% 8.2% 2.6% 7.0% 6.5% 10.1% 7.9% NWDC Economic Data Report. Qtr 4 of 2014.2015 www.nwdc.co.za Back to Table of Contents 23 Key Programmes Consolidated Government Expenditure R1.35 trillion o o R206.2bn o o o o R171.2bn Economic Infrastructure R72.3bn Industrial Development, trade and innovation R69.7bn Employment, labour affairs and social security funds R64.1bn Police Services R82.7bn Defence and State Security R49.4bn Law courts and prisons R39.1bn Social Services R777.9 billion R265.7bn o o o o o o o R157.3bn o o o o o R126.4bn R199.6bn o o o o o R64.4bn o o 7 General public administration and fiscal affairs R38.6bn Executive and legislative organs R12.3bn Home Affairs R6.3bn External affairs and foreign aid R7.1bn R155.3bn o o o o o o Basic Education R191.1bn University Transfers R26.2bn Skills Development and adult education R25.3bn Education Administration R13.1bn National Student Financial Aid Scheme R10bn District Health Services R66.7bn Provincial Hospital Services R30.2bn Other health services R26.4bn Central Hospital services R25.9bn Facilities management and maintenance R8.1bn Municipal equitable share and infrastructure grant R65.2bn Human settlements, water and electrification programs R49.3bn Public transport R41.3bn Other local development and social infrastructure R33.1bn Rural development and land reform R10.7bn Old age grant R53.5bn Child support grant R47.8bn Disability grant R20.2bn Provincial social development R16.7bn Other grants R8.5bn Policy oversight and grant administration R8.5bn BOKONE BOPHIRIMA STATE OF THE PROVINCE ADDRESS AND PROVINCIAL BUDGET SPEECH 2015 The compass that will guide the province in pursuing the objectives of the National Development Plan will be: Rebranding, Repositioning and Renewal Focus on Agriculture, Culture and Tourism as the strategic economic pillars Reconciliation, Healing and Renewal NWDC Economic Data Report. Qtr 4 of 2014.2015 www.nwdc.co.za Back to Table of Contents 24 Social Cluster Cluster Setsokotsane Bua le Puso Saam werk, Saam trek philosophy Radical socio-economic transformation by dedicating resources and efforts towards Villages, Townships and Small Dorpies (VTSD) Department Budget Allocation Education and Sports Development The department of Education and Sports Development receives R13.4 billion, representing 39.4% of the provincial budget in the 2015/16 financial year The Department of Health receives R8.9 billion for the 2015/16 financial year Health Economic Cluster including ACT as strategic economic pillar Cluster Finance, Economy and Enterprise Development Cluster Department Social Development Budget Allocation The Department of Social Development receives R1.3 billion for 2015/16, increasing to R1.5 billion in the outer MTEF, this translates to 6.1% year on year growth Rural, Environment and Agricultural Development The department is allocated R1.1 billion for 2015/16. Cumulatively the department will receive R3.5 billion over the 2015 MTEF Culture, Arts and Traditional Affairs The department is allocated R628.6 million in the 2015/16 financial year increasing to R718.8 million in the outer MTEF period Tourism The department is allocated R478 million over the MTEF period to promote tourism in the province Department Economy and Enterprise Development Allocation The department is allocated R255.1 million for 2015/16 Key Programmes Learner Teacher Support Materials Adult training at FET colleges Primary Healthcare reengineering TB program Key Programmes Early Childhood Development Construction of Taung inpatient Treatment Centre, An old age home in DRSM and Rehabilitation of the inpatient treatment centre in DRKK Smallholder Farmer and Development Support Programme Crop Massification Programme Mahika Mahikeng Music and Cultural Festival Construction of Libraries Commissioning of JB Marks and Moses Kotane Statues Economic Profile of tourism in the province Key Programmes Establish Enterprise Development Centres in all municipalities Establishment of Cooperatives for tuck shop NWDC Economic Data Report. Qtr 4 of 2014.2015 www.nwdc.co.za Back to Table of Contents 25 Finance The department is allocated R486 million in the 2015/16 financial year which will increase to R506 in the outer year of the MTEF Public Works and Roads The department is allocated R7.9 billion over the 2015/16 period Cluster Department Budget Allocation Governance and Administration Cluster Local Government and Human Settlement Office of the Premier The department receives R2.5 billion in st the 1 year of the MTEF and increasing to R2.95 billion in the outer year The office will receive an allocation of R730.6 million in 2015/16 Community Safety and Transport Management The Department will receive R1.8 billion in 2015/16 Provincial Legislature The Legislature is allocated R273 million, growing to R307.4 in the outer year of the MTEF 8 owners (warehousing) Formation of consortiums Assist provincial departments, public entities and municipalities to improve financial management Investment in infrastructure and management of the asset portfolio particularly in the VTSD Key Programmes Access to Basic Services Human settlement developments Research, Policy and Monitoring and Evaluation A proper bus system to serve rural communities Law enforcement and Social crime prevention Committee Services and public participation INTEGRATED_MANUFACTURING_STRATEGY FOR_THE_NORTH _WEST_PROVINCE NWDC Research and Development Unit was requested by The Department of Economic and Enterprise Development (DEED) to serve on a task team to oversee the development of studies conducted by the NWU TRADE Department. The first phase was a study on; Regional Economic Review: Current Realities in the North West; A Report on the Trade and Development research niche areas study commissioned to NWU with the purpose to identify unique opportunities for each district municipality based on their locational advantages. This study was completed by 28 March 2014. The second phase was a study An Integrated Manufacturing Strategy for the North West province. This study was completed on 26 February 2015. Following is a condensed abstract from the study. The NWP developed an integrated manufacturing strategy to guide the province and project partners as they target re-development and economic development efforts in the coming years towards providing NWDC Economic Data Report. Qtr 4 of 2014.2015 www.nwdc.co.za Back to Table of Contents 26 improved human development and economic benefit to the citizens of the province by transforming from primarily an agrarian to an industrial region. This was achieved by determining geographic and economic areas, within the industrial/manufacturing sphere, in the NWP with the greatest potential for development, re-development (that is, in order to address issues of historically skewed development where possible), and economic growth. International learning shows that manufacturing strategy is strongly linked with export success – and vice versa. Therefore the manufacturing strategy needs to incorporate and be integrated with the NWP export strategy (To be developed) . The outcome of the study proposes a 2-pronged approach: • “Outwards” focused industrialisation more strongly linked with exports and export strategy (still to be developed) based on agriculture and mining and related manufacturing activities; and • “Inwards” focused industrialisation more strongly linked with primary agricultural processing/ manufacturing activities. This can be achieved through the identification of prioritised key focus clusters informed by a fact-based pragmatic planning and implementation based on rigorous scientific analysis approaches. Achieving “sustainable” economic prosperity is crucial and implicates three interrelated goals for the provincial economy including: To sustain a high standard of living, To expand innovation and entrepreneurial capabilities, and To align economic outcomes with economic and financial stability. To embed sustainability in the provincial economy, progress is needed in three parallel, mutually reinforcing directions as indicated in the figure below. Sustainability and Economic Framework (Source: An Integrated Manufacturing Strategy for the North West province) NWDC Economic Data Report. Qtr 4 of 2014.2015 www.nwdc.co.za Back to Table of Contents 27 The outcomes of this work will contribute to developing an understanding of the province’s assets and opportunities related to key focus areas; inform a path for redevelopment and new economic development project priorities and focus; and guide the FEED to move forward with key identified opportunities 2 . South Africa’s manufacturing value added (MVA) share in GDP has declined from 20% in 1992 to 12% in 2013. South Africa’s manufacturing challenges since the 90’s include: abolishment of domestic market support, doubling of the global labour force (through China and Russia being integrated in the world market). Moreover, South Africa’s manufacturing is resource and energy intensive and not labour and technology intensive. Since the manufacturing sector in NWP is small, the gains from industrial policy in the short to medium term are likely to be limited. The implication for the development of an integrated manufacturing strategy for the NWP is that the manufacturing focus of such a strategy initially will have only a limited footprint in the province. The challenge will be to identify linkages between the primary, secondary and tertiary sectors via clusters, and to consider the product space and scope for down-stream beneficiation, linked to national and international opportunities for such products. A further key policy challenge for NWDC Economic Data Report. Qtr 4 of 2014.2015 www.nwdc.co.za Back to Table of Contents 28 the NWP is to use its mineral revenues to revitalise and modernise manufacturing and to diversify the economy more generally to allow it to reach a more stable growth path. Based on output and average annual growth, the research conducted shows that the province offers excellent opportunities and prospects in various manufacturing industries, particularly within the fabricated metal and food industries. The outlook for chemical processing, especially for value-added exports such as phosphate and nitrogen based fertilizers, is also becoming increasingly buoyant. Due to the province’s strategic location (proximity to the industrial hub of Gauteng and Botswana), natural resource endowment, easy market access (established trade routes), and relatively low production costs, attractive forward and backward horizontal integration opportunities exist in almost all of the manufacturing sub-sectors within the province. Economic clusters are identified as a geographical or activity concentration of actors/firms/sectors in vertical and horizontal relationships, showing a clear tendency of co-operating and of sharing their competences, all involved in a localised infrastructure of support. These clusters enable concentrated/focused action (e.g. from government) to grow, but result in spill over benefits to connected sectors via inter-linkages. Promotion of such clusters can be done via trade promotion, specifically promotion of products with specific skills and technology intensities mapped to the existing resources in the NWP or in the rest of South Africa. The top 10 economic clusters are identified for the NWP through structural path analysis, multiplier influence diagrams and product space network analysis and include: 1) Communication 2) Real estate 3) Grain mill, bakery & animal feed 4) Building and other construction 5) Basic metal products 6) Other food products 7) Agriculture 8) Non-metallic mineral products 9) Trade 10) Dairy products The identified economic clusters and their associated realistic export opportunities (REOs) were explored further to provide more details on the products or services identified as having REOs. For the product clusters, the basic metal products and non-metallic mineral products clusters were shown to have REOs with the highest export potential values. No REOs were identified for the agriculture and dairy products clusters. For the services clusters, the communications services cluster was found to have export opportunities that can be explored easily relative to the building and other construction cluster. This is owing to relatively lower market openness and market access of the building and other construction relative to the communications services REOs. No REOs were identified for the real estate and trade clusters. NWDC Economic Data Report. Qtr 4 of 2014.2015 www.nwdc.co.za Back to Table of Contents 29 The products currently produced in the NWP will to a great deal determine the “new” products it is able to produce in the future. This notion was conceptualised by Hidalgo and Hausmann (2009). They argue that the productive structure of a country, or province, is defined by the local availability of unique inputs or capabilities. They argue that these capabilities can be perceived as being specific building blocks of production. Capabilities may consist of tangible inputs, such as infrastructure and land, as well as intangible inputs, such as institutions, norms, skills and knowledge (Hidalgo and Hausmann, 2009). For instance, the production of oranges requires a certain type of soil, climatic conditions, farming knowledge, labour skills, farming equipment, food safety standards, and distribution network. The exact set of capabilities is unique to each product but the exchange of capabilities between products is possible. Only 6 of NWP’s core competencies are well-connected in the Product Space. The top “new” manufacturing opportunities identified, include: seats and chairs, parts of handling / loading / conveyor machinery, tubes and pipes fittings of iron/steel and furniture for medical / surgical / dental practices. The opportunities available and relatedness of the NWP across various national policies and programs, which might show opportunities for the province and which may be leveraged when promoting the identified projects, were investigated. Foreign Direct Investment (FDI) into Africa is increasing. The wood, paper and apparel sector witnessed the largest percentage increase, rising from a low of US$ 200 million in 2012 to US$ 3.8 billion in 2013. This sector experienced a successful 2013, also creating more than 12 000 new jobs when compared with the 2 235 recorded in 2012. The real estate, hotels and tourism; ICT; renewable energy; business and financial services; building materials, ceramics and glass; and transportation, warehousing and storage sectors all finished 2013 with an increase in FDI compared with that recorded in 2012. Other alternative opportunities not covered previously were also investigated and considered. These include opportunities in the areas of agro-processing, agricultural and other waste, waste recycling, pharmaceuticals, airports etc. Based on the manufacturing opportunities analysis of existing conditions as well as future opportunities, key provincial assets and economic drivers, twenty opportunity areas and project opportunities were identified as potential targets for future economic development and redevelopment focus in the NWP. The identified areas and economic development project/ programme opportunities in the NWP that requires further detailed investigation are divided into broad categories or related project groupings. These include (in no order of importance): 1) PGM beneficiation for the production of fuel cell components – Rustenburg (Platinum SEZ) and or Potchefstroom (HySA Infrastructure research centre) Area 2) Metals and supporting industries – Rustenburg (BJDM) Area 3) Chemicals (The missing piece) – BJDM Area 4) Charcoal – Toska / Brey / Vryburg Area 5) Food and tobacco (Opportunities abound) – Project Area 6) Sisal and Acacia seed – Rural Community Areas NWDC Economic Data Report. Qtr 4 of 2014.2015 www.nwdc.co.za Back to Table of Contents 30 7) Agro-processing upstream/inputs and downstream/outputs – Lichtenburg / Ventersdorp / Zeerust / Other Areas 8) Building-integrated agriculture (BIA) – Urban Areas (e.g. Rustenburg, Mahikeng, Brits etc.) 9) Strategically reuse landfill areas to maximise waste-to-energy opportunities – Urban (population centres) Areas 10) Waste recycling – Urban (population centres) Areas 11) Building board of wood pulp or of vegetable/vegetation fibre – Rural Community Areas 12) Low cost building material – Urban and/or Rural Areas 13) Automotive Components/ OEM Leverage existing automotive facilities and skills – Brits Area 14) Parts of handling/loading/conveyor machinery; Tubes and pipes fittings of iron/steel – Industrial Areas 15) Domestic-type, non-electric heating, cooking apparatus – Potchefstroom Area 16) Agricultural & horticultural machinery for soil preparation – Brits Area 17) Seats and chairs; Furniture for medical / surgical / dental practices – Rural Community Areas 18) Capitalise on the airport and promote ancillary business development – Airport Areas 19) Telecommunications – Any Urban Areas (Population centres) 20) Target healthcare industry growth and pharmaceutical prospects – Zeerust and other Areas. Following the identification of key potential opportunities, a filter for opportunity prioritisation was constructed – through the development of an economic development opportunities prioritisation matrix. This completed matrix provides a measure in which to hone in on the development and redevelopment potential and the ability to provide a catalyst for economic development for the twenty identified opportunities. The application of this opportunity prioritisation approach will follow in the implementation framework to support the manufacturing strategy. The identified opportunities constitute a set of comprehensive and multidimensional opportunities. Each opportunity entails diverse challenges, so careful implementation will be vital to its success. In many cases the machinery of implementation is/may already be in motion, but the pace needs to be accelerated and achievement strengthened. Success will depend foremost on demand by the provincial governments’ leadership for regular information on progress and results. It will also depend on mainstreaming the strategy across all spheres of provincial and local government. Provincial ministries and agencies will need to take ownership of these potential opportunities and develop their own projects from these opportunities with operational plans and accept accountability for delivery. At the centre, the integrated manufacturing strategy will have to influence processes that drive decisions on how resources are used and provide operational tools for assessing individual projects and policy proposals in an integrated way. Major challenges lie ahead, particularly in building the human and institutional capabilities for effective planning and project execution, but also in providing the legal basis for some proposed innovations. Moving from identifying opportunities to effecting interventions requires careful planning by implementing agencies and support from the central functions of government. The potential opportunities identified in this report and in the provincial status quo report will need to be transformed NWDC Economic Data Report. Qtr 4 of 2014.2015 www.nwdc.co.za Back to Table of Contents 31 into detailed project blueprints focused on achievable results that reflect the strategic directions outlined in national (e.g. National Development Plan (NDP), Industrial Policy Action Plan (IPAP), etc.) and provincial (e.g. Provincial Development Plan (PDP), Arts, Culture and Tourism (ACT), etc.) policies. To the extent possible, there should be a focus on “quick wins”. 9. MINING DEVELOPMENTS In the past quarter a few mines have reported new developments that they are embarking on and it is important that the North West province takes note of the developments as it will impact on the province and also create new opportunities to explore. Most of these developments are taking place in the Bojanala District Municipality area and the developers of the new technologies can be approached to consider establishing their initiatives in the Platinum SEZ. The following opportunities were reported on: 9.1 Amplats Reveals Roadmap to Automation (Source: Creamer Media; Samantha Moolman; 23rd January 2015) Anglo American Platinum(Amplats) prepares to overhaul its operations and begin the ten-year-long process of converting its mines into sustainable, mechanised mining systems which, results in improved safety and injury-free production, cost efficiency, increased profitability and a reduced energy footprint, working towards a sustainable automated industry.by introducing extra-low-profile (XLP) and ultralow-profile (ULP) trackless mechanised mining equipment into its narrow tabular mining operations since the mid-2000s. For the past seven years, the platinum major has been trialling two XLPequipment suites at its Rustenburg-based Bathopele platinum mine, as well as advanced ULP prototypes since 2010. The focus for 2015, reveals Amplats technical executive head Gordon Smith, is to make these ULP prototypes – designed and manufactured by Croatia-based unmanned vehicle producer Dok-Ing – production-ready for 2017. Once this is achieved, the company aims to complete the implementation of these new technologies by 2019. NWDC Economic Data Report. Qtr 4 of 2014.2015 www.nwdc.co.za Back to Table of Contents 32 The range of game-changing technologies also include laser cutting of rocks – to replace drilling and blasting – to real-time volumetric imaging of excavations and automated robotic equipment that can The effective use of information and communication technology (ICT) is a key enabler of operational effectiveness and efficiency, as mine operation systems that allow effective integration of people, operational processes and technology to achieve objectives are absolutely critical. 9.2 Implats to Invest R30bn over 5 years (Source: Creamer Media's Mining Weekly Online; Martin Creamer; 26th February 2015) With the long-term fundamentals for platinum-group metals (PGMs) remaining strong, platinummining major Impala Platinum plans to invest R30-billion across its operations in the next five years, but at a lower level than previously planned in the next two years, when PGMs prices are likely to be lower for longer. Projects included in the R30-billion are: Shaft 16 and Shaft 20 projects in the next three years, R6.6-billion was earmarked for the Shaft 17 project. Capex on the sinking of 17 Shaft would be reduced to achieve a saving of R2.5-billion over 2015 and 2016 $100-million for the base metals refinery in Zimbabwe, R1-billion a year for ongoing off-reef development, totalling R5-billion. Impala Rustenburg was destined for fewer vertical shaft systems, which would be run more efficiently within an improved cost structure. Projects to be sold and deferred: Marula, up for sale. Afplats project was being deferred for four years; all shaft sinking activities had been stopped and site demobilisation was under way. 9.3 Pallinghurst shares rise and a potentially industry-transforming range of energy-slashing beneficiation technologies (Source: Creamer Media's Mining Weekly Online; Martin Creamer; 23 March 2015) The shares of diversified mining company Pallinghurst rose by more than 4% after the company reported a rise on the performance of its platinum, manganese and coloured gemstones business units during troubled times. In the 12 months to December 31, the JSE-listed company’s profit was $55-million and its net asset value 35% higher after its Sedibelo Platinum operations recorded their first full year of profitability, along with three-million fatality-free shifts and yearly dispatches of 154 400 oz of 4E (platinum, palladium, rhodium and gold)platinum-group metals (PGMs). Credit must be given to the black economic-empowerment (BEE) partnership with Bakgatla Ba Kgafela for providing a BEE tailwind for the company’s PGMs business, which has added 100-million ounces of 4E PGMs to its resource base. NWDC Economic Data Report. Qtr 4 of 2014.2015 www.nwdc.co.za Back to Table of Contents 33 Sedibelo is also testing a potentially industry-transforming range of energy-slashing beneficiation technologies involving a low-energy hydrometallurgical alternative to high-energy smelting. The environment-friendly Kell process, which Pallinghurst has been studying over a prolonged period, requires only a fifth of the electricity required for conventional smelting and has the potential to increase the recoveries from PGM concentrates. Initial test results at the platinum mine in the North West province have been positive. Recovery of 99.9% of PGMs is being achieved in a scaled-up pilot plant. Patented technology that former Mintek researcher Keith Liddell has been developing for a decade-and-a-half is expected to be the catalyst that provides the potential for a Silicon Valley-type Platinum Valley, which is being strongly supported by the large near-mine shareholder community as well as Sedibelo’s sovereign Dutch, Singaporean and South African Industrial Development Corporation (IDC) shareholders. Instead, it consumes a mere 140 kWh of electricity for every ton of concentrate processed, compared with 1 000 kWh of electricity for every ton of concentrate smelted, recovering 99%-plus of the platinum and 98% of the remaining PGMs, as well as the base metals. It requires no milling and emits only 440 kg of carbon dioxide (CO2) a ton of concentrate treated compared with 1 400 kg of CO2/t for the estimated two-million tons of concentrate treated in South Africa a year. To build, it’ll cost a tenth of the normal cost, you’ll use between 10% and 15% of the usual electricity and your working capital normally tied up for long periods in all kinds of traditional processes will be rapidly released. The refining end for the PGMs is within the Kell process, so you can actually go from mining to making the final major PGM products within a week of mining them. Kell is also able to reprocess recycled autocatalysts, again effectively replacing the high-energy smelting of autocatalysts and fitting in with Sedibelo’s philosophy of using Kell to recycle as much used metal as possible as a mix with primary ore to provide high concentration, which is seen as creating the backbone for the envisaged Platinum Valley. The idea is to get the benefits of the entire PGMs value chain to flow into the South African economy. 9.4 Chamber of Mines (CoM) Fuel Cell (Source: Creamer Media's Mining Weekly Online; David D’Oliveira; 13 March 2015) Energy solutions provider Mitochondria Energy Company (MEC) will unveil a 100 kW fuel-cell solution, which was installed at the Chamber of Mines’ (CoM’s) Johannesburg offices, on 31 March 2015. MEC CEO Anthea Bath told Mining Weekly Online that the natural gas-fuelled solution had been designed to supply between 30 kWh and 80 kWh of electricity, depending on periods of low or high demand at the CoM. Egoli Gas had been contracted to supply the natural gas for the fuel-cell solution. NWDC Economic Data Report. Qtr 4 of 2014.2015 www.nwdc.co.za Back to Table of Contents 34 The system generated enough electricity to keep the building running in the event of load-shedding. Bath pointed out that the onsite fuel-cell solution, which was designed by MEC, JSE-listed Allied Electronics subsidiary Powertech and independent consultant Ralph Jones, had taken ten days to install and commission. Japanese electrical solutions provider Fuji Electric had manufactured the 5.6m x 2.2m x 3.4m fuel cell. Bath highlighted that fuel-cell technology offered an alternative energy source at prices lower than current grid-based electricity costs for commercial, industrial and building users. MEC would also, during the CoM fuel-cell solution unveiling, launch a miniature 5 kWh fuel-cell system, which Bath said would be used to power the sound and projectors at the March 31 event. 9.5 Platinum-based Fuel Cell Technology Successfully Powers 34 Houses (Source: Creamer Media's Mining Weekly Online; David D’Oliveira; 6 February 2015) Photo by Duane Daws The Platinum mining major Anglo American Platinum’s (Amplats’)platinum-based fuel cell, 12-month mini-grid trial in the Naledi Trust community, in the Moqhaka municipality of the Free State, has successfully supplied low-cost electricity to the 34 participating households. The 15 kW system has made about 99% of its capacity available to the community since the inception of the project in July last year. The system comprises three 5 kW fuel cells, which are manu- factured by Canada-based Ballard Power Systems and integrated into a power generation system that includes batteries, direct- to alternatingcurrent inverters, controls and a methanol fuel supply tank. Each fuel cell also has its own methanol reformer and about 6 g of platinum, which acts as a catalyst to generate electricity from the methanol fuel source. NWDC Economic Data Report. Qtr 4 of 2014.2015 www.nwdc.co.za Back to Table of Contents 35 With the aid of batteries, the solution can generate up to 70 kW. The fuel cell mini grid is a complete offgrid and automatic solution, the first of its kind in the world, Amplats says. The technology employs a tele- metric data-logging and warehousing solution, which allows for nearreal-time remote monitoring of system operations from three continents and can also be programmed to schedule maintenance, detect faults and schedule fuel supply delivery. The fuel cell mini grid provides the households forming part of the pilot project with sufficient electricity for lighting, cooking, refrigeration and charging laptops and cellphones, as well as using radios and television sets. The systems is specifically suited to communities comprising 50 to 200 households that are between 8 km and 22 km from existing power infrastructure. Platinum-based fuel cell technology offers Amplats a means of developing a new market for the precious metal, which will help improve demand for platinum-group metals (PGMs). Amplats and its partner, Ballard, have invested $20-million in the development of mini-grid fuel cell technology. Public procurement or government commitment to the use of fuel cell systems, as an alternative to electricity supplied from the national grid, is key to the successful deployment of the technology and the creation of a local fuel cell industry. 9.6 Implats Moves to Power Platinum Refinery with Platinum Fuel Cells (Source: Creamer Media's Mining Weekly Online; Martin Creamer; 26 February 2015) Platinum major Impala Platinum (Implats) is studying the feasibility of taking its entire platinum refinery off the national electricity grid and powering it with platinum fuel cells. The refinery already has a supply of available hydrogen to fuel the cells and would need some 20 MW of fuel-cell power if it were to do without the Eskom grid. In the interim, plans for an initial 2 MW fuel cell, which would be the biggest such unit in the southern hemisphere, are at an advanced stage. They have a ready supply of hydrogen, which is used in the refinery and it is envisaged to take the whole refinery off grid power through putting in fuel cells, and at mine level, fuel cells are also being tested to power locomotives and load haul dumpers. From a pure total cost of ownership perspective, fuel cells are already cost effective, given that they require very little management, have no moving parts, operate noiselessly and are emission free. However, every seven or eight years, their membranes need replacing. Implats is working closely with local companies as well as a Japanese fuel cell manufacturer and believes there is an opportunity opening up for the membranes used in the fuel cells to be locally manufactured. NWDC Economic Data Report. Qtr 4 of 2014.2015 www.nwdc.co.za Back to Table of Contents 36 The company is in discussion with the Department of Trade and Industry (DTI), which has set up a special economic zone in Rustenburg for platinum beneficiation. Fuel cells are currently consuming only about 200 000 oz to 300 000 oz of platinum a year and not rising as fast as hoped. However, Toyota and Hyundai are due to launch fuel cell cars this year and the Japanese government is putting in fuelling stations. 10. ENERGY PROFILE OF AFRICA Source: OECD/IEA, 2014:14 World Energy Outlook | Special Report Sub-Saharan Africa is rich in energy resources, but very poor in energy supply. Making reliable and affordable energy widely available is critical to the development of a region that accounts for 13% of the world’s population, but only 4% of its energy demand. Since 2000, sub-Saharan Africa has seen rapid economic growth and energy use has risen by 45%. Many governments are now intensifying their efforts to tackle the numerous regulatory and political barriers that are holding back investment in domestic energy supply, but inadequate energy infrastructure risks putting a brake on urgently needed improvements in living standards. The data gathered for this World Energy Outlook Special Report – the first of its kind to provide a comprehensive picture of today’s sub-Saharan energy sector and its future prospects in a global context – underlines the acute scarcity of modern energy services in many countries. The picture varies widely across the region, but, in sub-Saharan Africa as a whole, only 290 million out of 915 million people have access to electricity and the total number without access is rising. Efforts to promote electrification are gaining momentum, but are outpaced by population growth. Although investment in new energy supply is on the rise, two out of every three dollars put into the subSaharan energy sector since 2000 have been committed to the development of resources for export. Key Issues include: Power to shape the future o A severe shortage of essential electricity infrastructure is undermining efforts to achieve more rapid social and economic development. o Sub-Saharan Africa starts to unlock its vast renewable energy resources, with almost half of the growth in electricity generation to 2040 coming from renewables. Bioenergy is at the heart of the energy mix The rise of the African energy consumer brings a new balance to oil and gas Almost 30% of global oil and gas discoveries made over the last five years have been in subSaharan Africa, reflecting growing global appetite for African resources. o Natural gas resource-holders can power domestic economic development and boost export revenues, but only if the right regulation, prices and infrastructure are in place. o Coal production and use gradually spreads beyond South Africa, but coal is overtaken by oil as the second-largest fuel in the sub-Saharan energy mix. Releasing the energy brake on development o In our main scenario, the sub-Saharan economy quadruples in size and energy demand grows by 80%, but energy could do much more to act as an engine of inclusive economic NWDC Economic Data Report. Qtr 4 of 2014.2015 www.nwdc.co.za Back to Table of Contents 37 and social growth. The international arena brings capital and technology, but mixed blessings in other areas. Accelerating towards an African Century? Three actions in the energy sector, if accompanied by more general governance reforms, could boost the sub-Saharan economy by 30% in 2040, an extra decade’s worth of growth in percapita incomes: o An additional $450 billion in power sector investment, reducing power outages by half and achieving universal electricity access in urban areas. o Deeper regional co-operation and integration, facilitating new large-scale generation and transmission projects and enabling a further expansion in cross-border trade. o Better management of resources and revenues, adopting robust and transparent processes that allow for more effective use of oil and gas revenues. Broad improvements in governance, both inside and outside the energy sector, underpin the achievements of an African Century Case, involving, among many other things, heavy investment in the capacity to formulate and implement sound energy policies, as well as the consultation and accountability that is essential to win public consent. o A modernising and more integrated energy system allows for more efficient use of resources and brings energy to a greater share of the poorest parts of sub-Saharan Africa. Of the extra 230 million people that gain access to electricity in this Case by 2040, 70% are in rural areas, the supply coming primarily from mini-grid and off-grid systems. This investment is instrumental in helping to close the gap in energy provision and economic opportunity between sub-Saharan Africa’s rural communities and the people in its cities. Concerted action to improve the functioning of the sub-Saharan energy sector is essential if the 21 st is to become an African century. Primary Energy Demand in Africa and South Africa in the New Policy Scenarios 2012 and 2040 (Mtoe) 2012 Africa South Africa 2040 Africa South Africa OIL GAS COAL NUCLEAR BIOENERGY HYDRO OTHER TOTAL SA as % of Africa 168 21 100 4 105 97 3 3 352 15 10 0.2 2 <0.1 739 141 19% 278 27 243 9 164 101 12 12 496 26 38 0.4 91 10 1322 186 14% Other includes geothermal, wind, solar PV, concentrating solar power and marine. Each year, the International Energy Agency’s (IEA) World Energy Outlook (WEO) conducts a detailed study of the energy sector of a particular country or region. This year – as a Special Report within its WEO-2014 series – the IEA presents its most comprehensive analytical study to date of the energy outlook for Africa, specifically sub-Saharan Africa. Modern economies are built upon modern energy systems, but the sub-Saharan energy sector has not yet achieved this status. This report draws on NWDC Economic Data Report. Qtr 4 of 2014.2015 www.nwdc.co.za Back to Table of Contents 38 extensive new data to shine light on the existing energy system in sub-Saharan Africa, but also to illuminate the future energy outlook, showing what actions can release the energy brake on development. The Africa Energy Outlook of 2014 http://www.iea.org/publications/freepublications/publication/WEO2014_AfricaEnergyOutlook.pdf 11. RECOMMENDATIONS When considering the above it is recommended that attention should be given to the following: Diversify the economy of the NW province Develop SMMEs Adhere to the ACTION strategic direction of the Premier being Agriculture, Culture and Tourism through Investment through Organizes Networking Develop and diversify the manufacturing sector. Identify leakages in the current manufacturing value chains to attract investment as well as investigate global value chains as the new trend. Utilise localisation strategies and products identified for local procurement by Eskom and Transnet to link to local suppliers and SMMEs that can benefit from the infrastructure development programmes. Increase agricultural activity and agro-processing. Contribute to rural development programmes. Utilise co-operatives to stimulate these economies. Utilise ICT for communication and training purposes Include designated groups, youth, women and disabled as beneficiaries of projects. The unemployed graduates database and other databases can be consulted for possible beneficiaries. Skilling in line with provincial plans is very important and closer co-operation should be encouraged between tertiary institutions and project drivers to be able to develop appropriate skills. 12. RESEARCH AND DEVELOPMENT ACTIVITY REPORT 12.1 Research and Development Annual Unit Plan The Annual Research and Development Unit Plan for 2015 2016 was compiled. 12.2 Subscriptions No subscriptions were procured this quarter. 12.3 Studies Outsourced/Purchased Information that is not available through subscriptions or desktop research needs to be purchased or commissioned. It is important to avoid duplication and therefore the NWDC Research and Development Unit liaises with the mother department, the Department of Economic and Enterprise Development (DEED), The North West Planning Commission (NWPC) as well as the North West University (NWU) to support them with the studies that fall within their mandates. The intention is that the NWDC amongst others also identify their needs and commission studies that build on existing research. NWDC Economic Data Report. Qtr 4 of 2014.2015 www.nwdc.co.za Back to Table of Contents 39 The Office of the Premier has signed a MoU with the NWU on Research that will be utilized to commission studies to the NWU. 12.3.1 Support to DEED NWDC supported DEED with a Regional Economic Review: Current Realities in the North West; A Report on the Trade and Development research niche areas study commissioned to NWU with the purpose to identify unique opportunities for each district municipality based on their locational advantages, delivered to DEED by 28 March 2014. A second study as phase two An Integrated Manufacturing Strategy for the North West province, was completed on the 26th of February 2015 of which and abstract is included in the report. 12.3.2 Support NWPC NWDC Research and Development Unit is a member of the Inter Departmental Research Forum (IDPRF) convened by the by North West Planning Commission. A meeting was attended on the 20th of March 2015. 12.3.3 NWDC A Outbound Mission Framework and Policy was compiled and submitted to the ACEO. 12.3 4 Geographical Information Systems (GIS) NWDC is also exploring Geographical Information Systems (GIS) to assist in supplying information to be able to create interactive maps with relevant provincial information especially with regards to NWDC and investment opportunities. 12.4 Desktop Studies/ Intelligence 12.4.1 Intelligence Desktop studies were conducted and intelligence gathered and distributed on request and as general information distribution on the following 28 items and are included in the portfolio of evidence: Balanced Score Card Sub-Saharan FDI Amplats Reveals Roadmap to Automation Gates Foundation Annual Letter 2015 Mining Boosts World’s Poorest Regions UNCTAD Global Investment Trends no 18 Real Estate Investment Indicators and Benchmarking SONA Summary North West Mining 23 February 2013 Quarterly Labour Force Survey 4th Quarter 2014 Implats to Invest R30bn over the next 5 years Youth Unemployment The Economist Chamber of Mines Fuel Cell 2 March 2015 Salary Increase Supporting Information NWDC Economic Data Report. Qtr 4 of 2014.2015 www.nwdc.co.za Back to Table of Contents 40 2015 2016 Budget Speech MIPIM Real Estate Conference in Cannes 10-13 March 2015 NW SOPA 2015 Bakwena Upgrades Major Routes Real Estate in Africa show 8 Mega Trends Pallinghurst Shares Rise Bill and Melinda Gates on Small Farmers NWDC Strategic Plan Situational Analysis Update Criptic SONA and Budget 2015 Criptic SOPA and Budget 2015 Benchmarking with other Agencies for Structures and Board Remuneration Supply NMMDM with Statistics Venture Capital Database Agriculture Database 12.4.2 International Reports including FDI and Global Competitiveness Bilateral Trade Agreements between RSA and European Union Bilateral Trade Agreements between RSA and Russian Federation Bilateral Trade Agreements between RSA and Japan Also see 3, 4, and 5 in the report. 12.5 Engagement and/or participation in events with Economic Community, Research related meetings, Conferences, Workshops, IPA’s, World Economic Forum, WAIPA Attend the IDPRF meeting 27 and 28 November 2014 Attend Innovation Bridge 2-3 February 2015 RECOMMENDATIONS o The Regional Innovation Forum should be established. o NWDC IT should contact Alan Knott-Graig Jr and discuss how NWDC can implement free Wi-Fi at the NWDC sites and also link up with their virtual SMME Growth Accelerator, Grindstone, that has developed a successful model for virtual incubation. o Explore possible funding by Elke Simon-Keller, SAP Innovation Centre Pretoria 082 333 3450 Supports ICT enabler projects. o The Technologies highlighted should be explored by Trade and Invest and the PV SEZ as investment opportunities. Attend the DTI Black Industrialist Indaba POLICY FRAMEWORK ON THE DEVELOPMENT OF BLACK INDUSTRIALIST Black Industrialist programme is a Government agenda spearheaded by the Department of Trade and Industry .The State President launched the programme on the 25-26 March at Gallagher Estate. Black Business was called to give input on policy as the programme has already been tabled in Parliament by Minister Davies. South Africa has the moral obligation to harness national resources towards the resolution of the historical injustice. In the realm of economic life, this implies the need NWDC Economic Data Report. Qtr 4 of 2014.2015 www.nwdc.co.za Back to Table of Contents 41 to transform patterns of asset ownership. The bulk of industrial assets in SA have been racially concentrated. The government has evolved policy with the objective as an inclusive economy within the strategic framework of BEE. The prioritisation of industrial sectors will be informed by a combination of factors and presence of black players in a specific value chain. Access to finance through DFI’s has been secured and amongst others relevant incentives for black enterprise within DTI will be enhanced. 13. CHALLENGES Knowledge Management function without a Knowledge Management Specialist. 14. RECOMMENDATIONS AND POSSIBLE SOLUTIONS TO CHALLENGES Appointment of Knowledge Management Specialist Unit plans need to be approved and integrated based on the directives of the new leadership. NWDC Economic Data Report. Qtr 4 of 2014.2015 www.nwdc.co.za Back to Table of Contents 42 RESEARCH AND DEVELOPMENT UNIT Economic Data Report Q4 2014 2015 PORTFOLIO OF EVIDENCE INDEX (Any of the documents below can be made available on request) 2.2 2.3 INDICATOR: ACTIVITY (REPORTING CYCLE) Economic Data Report (Quarterly) Research Activities Research and Development Annual Unit Plan Subscriptions Studies Outsourced/ Purchased 2.4 2.4.1 Desktop Studies/ Intelligence Intelligence 1 2 2.1 DOCUMENTS Update Research and Development Unit Plan and Budget 1. Attend Task Team Meeting with NWU, FEED and NWDC on the study commissioned to NWU by DEED on An Integrated Manufacturing Strategy for the NW – Innovation through Diversity 22 January 2015 and 25 February 2015. The study is completed and had been forwarded to relevant Managers to guide strategic planning. 1. 2. 3. 4. 5. 6. 7. 8. 9. 10. 11. 12. 13. 14. 15. 16. 17. 18. 19. 20. 21. 22. 23. 24. 25. Balanced Score Card Sub-Saharan FDI Amplats Reveals Roadmap to Automation Gates Foundation Annual Letter 2015 Mining Boosts World’s Poorest Regions UNCTAD Global Investment Trends no 18 Real Estate Investment Indicators and Benchmarking SONA Summary North West Mining 23 February 2013 th Quarterly Labour Force Survey 4 Quarter 2014 Implats to Invest R30bn over the next 5 years Youth Unemployment The Economist Chamber of Mines Fuel Cell 2 March 2015 Salary Increase Supporting Information 2015 2016 Budget Speech MIPIM Real Estate Conference in Cannes 10-13 March 2015 NW SOPA 2015 Bakwena Upgrades Major Routes Real Estate in Africa show 8 Mega Trends Pallinghurst Shares Rise Bill and Melinda Gates on Small Farmers NWDC Strategic Plan Situational Analysis Update Criptic SONA and Budget 2015 Criptic SOPA and Budget 2015 Benchmarking with other Agencies for Structures and Board Remuneration 26. Supply NMMDM with Statistics 27. Venture Capital Database 28. Agriculture Database NWDC Economic Data Report. Qtr 4 of 2014.2015 www.nwdc.co.za Back to Table of Contents 43 2.4.2 International Reports including FDI and Global Competitiveness Country Briefs Contained in Economic Data Report 2.4.4 Bilateral Agreements signed between the North West Province/South Africa and other Countries 1. 2. 2.4.5 SOPA and DEED Budget Speeches Summarised Engagement and/or participation in events with Economic Community, Research related meetings, Conferences, Workshops, IPA’s, World Economic Forum, WAIPA 2.4.3 None 3. 2.5 Report Submitted By Bilateral Trade Agreements between RSA and European Union Bilateral Trade Agreements between RSA and Russian Federation Bilateral Trade Agreements between RSA and Japan 1. Q2 1. 2. 3. Attend the IDPRF meeting 20 March 2015 Attend Innovation Bridge Conference 2-3 February 2015 Attend the Black Industrialists Indaba 25-26 March Date: 1 April 2015 JA Hoogkamer Manager Research and Development, North West Development Corporation +27 14 594 2570 NWDC Economic Data Report. Qtr 4 of 2014.2015 www.nwdc.co.za Back to Table of Contents 44
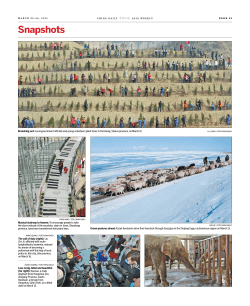
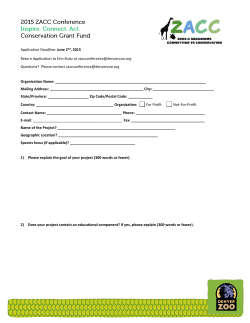


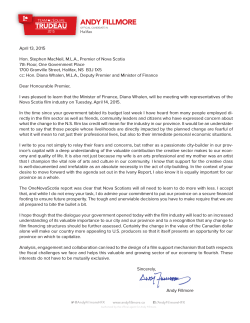


© Copyright 2026