
Technical Report Miller Gold Property
INDEPENDENT TECHNICAL REPORT MILLER GOLD PROPERTY Kirkland Lake, Ontario, Canada Oban Mining Corporation 150 York Street, Suite 410 Toronto, Ontario M5H 3S5 Effective Date: March 29, 2015 Submission Date: April 17, 2015 Prepared By: CARACLE CREEK INTERNATIONAL CONSULTING INC. Trevor Boyd, Ph.D., P.Geo Julie Selway, Ph.D., P.Geo Independent Technical Report: Miller Gold Property Oban Mining Corporation Office Locations This report has been prepared by Toronto 34 King Street East, 9th Floor Toronto, ON Canada, M5C 2X8 Tel: +1.416.368.1801 [email protected] Caracle Creek International Consulting Inc. (Caracle Creek) on behalf of Oban Mining Corporation 2015 Vancouver 409 Granville Street, Suite 1409 Vancouver, BC Canada, V6C 1T2 Tel: +1.604.637.2050 [email protected] Sudbury 1545 Maley Drive, Suite 2019 Sudbury, ON Canada, P3A 4R7 Tel: +1.705.671.1801 TF: +1.866.671.1801 [email protected] Johannesburg 7th Floor, The Mall Offices 11 Cradock Avenue, Rosebank South Africa Tel: +1.27 (0) 11.880.0278 [email protected] Issued by: Toronto www.caraclecreek.com March 29, 2015 CARACLE CREEK INTERNATIONAL CONSULTING INC. TORONTO – VANCOUVER – SUDBURY–JOHANNESBURG WWW.CARACLECREEK.COM Page | 1 Independent Technical Report: Miller Gold Property Oban Mining Corporation TABLE OF CONTENTS 1.0 SUMMARY ..................................................................................................................................................... 6 2.0 INTRODUCTION .......................................................................................................................................... 7 2.1 INTRODUCTION........................................................................................................................................ 7 2.2 TERMINOLOGY ........................................................................................................................................ 8 2.3 UNITS .......................................................................................................................................................... 9 2.4 CARACLE CREEK QUALIFICATIONS ................................................................................................. 10 3.0 RELIANCE ON OTHER EXPERTS ......................................................................................................... 11 4.0 PROPERTY DESCRIPTION AND LOCATION ..................................................................................... 12 4.1 LOCATION ............................................................................................................................................... 12 4.2 DESCRIPTION AND OWNERSHIP ........................................................................................................ 14 4.3 OBAN – NORTHSTAR OPTION TO ACQUIRE 70% INTEREST IN MILLER PROPERTY .............. 17 4.4 OBLIGATIONS ......................................................................................................................................... 17 5.0 ACCESSIBILITY, CLIMATE, LOCAL RESOURCES, INFRASTRUCTURE, AND PHYSIOGRAPHY..................................................................................................................................................... 19 5.1 ACCESS .................................................................................................................................................... 19 5.2 CLIMATE AND VEGETATION .............................................................................................................. 19 5.3 PHYSIOGRAPHY ..................................................................................................................................... 19 5.4 INFRASTRUCTURE AND LOCAL RESOURCES ................................................................................. 19 6.0 6.1 7.0 HISTORY...................................................................................................................................................... 20 SUMMARY OF EXPLORATION HISTORY .......................................................................................... 20 GEOLOGICAL SETTING AND MINERALIZATION ........................................................................... 22 7.1 REGIONAL GEOLOGY ........................................................................................................................... 22 7.2 LOCAL AND PROPERTY GEOLOGY ................................................................................................... 24 8.0 DEPOSIT TYPES ......................................................................................................................................... 25 9.0 EXPLORATION .......................................................................................................................................... 29 9.1 LOCATING HISTORIC DRILL HOLES ................................................................................................. 29 9.2 MAPPING AND SAMPLING ................................................................................................................... 31 9.3 GEOPHYSICS ........................................................................................................................................... 32 9.4 DRILLING ................................................................................................................................................. 34 March 29, 2015 CARACLE CREEK INTERNATIONAL CONSULTING INC. TORONTO – VANCOUVER – SUDBURY–JOHANNESBURG WWW.CARACLECREEK.COM Page | 2 Independent Technical Report: Miller Gold Property Oban Mining Corporation 10.0 DRILLING .................................................................................................................................................... 36 10.1 DRILLING DATA AND PROGRESS ...................................................................................................... 36 10.2 DRILLING RESULTS............................................................................................................................... 37 11.0 SAMPLE PREPARATION, ANALYSES AND SECURITY ................................................................... 43 11.1 SAMPLE SECURITY ............................................................................................................................... 43 11.2 SAMPLE PREPARATION ....................................................................................................................... 44 12.0 DATA VERIFICATION .............................................................................................................................. 45 12.1 CARACLE CREEK SITE VISITS ............................................................................................................ 45 12.2 QUALITY CONTROL .............................................................................................................................. 49 12.2.1 Blanks ................................................................................................................................................ 50 12.2.2 Standards........................................................................................................................................... 52 12.2.3 Core Duplicates ................................................................................................................................. 59 12.2.4 Summary ............................................................................................................................................ 64 13.0 MINERAL PROCESSING AND METALLURGICAL TESTING ......................................................... 65 13.1 GRAVITY RECOVERABLE GOLD TESTING ...................................................................................... 65 13.2 MINERALOGICAL TESTING ................................................................................................................. 65 14.0 MINERAL RESOURCE ESTIMATES ..................................................................................................... 66 15.0 ADJACENT PROPERTIES ........................................................................................................................ 67 16.0 OTHER RELEVANT DATA AND INFORMATION .............................................................................. 67 17.0 INTERPRETATION AND CONCLUSIONS ............................................................................................ 67 18.0 RECOMMENDATIONS ............................................................................................................................. 68 18.1 PROPOSED BUDGET .............................................................................................................................. 69 19.0 REFERENCES ............................................................................................................................................. 71 20.0 STATEMENT OF AUTHORSHIP ............................................................................................................. 73 FIGURES Figure 4-1Location of Miller Gold Property, near Kirkland Lake, Ontario ................................................................ 13 Figure 4-2 Claim map of Miller Gold Property, near Englehart, Ontario .................................................................... 16 March 29, 2015 CARACLE CREEK INTERNATIONAL CONSULTING INC. TORONTO – VANCOUVER – SUDBURY–JOHANNESBURG WWW.CARACLECREEK.COM Page | 3 Independent Technical Report: Miller Gold Property Oban Mining Corporation Figure 7-1Interpretative geology of the Miller Gold Property..................................................................................... 23 Figure 7-2 Au-Bi-Te stringers in quartz vein from 54.6 m, MG-14-12. ...................................................................... 25 Figure 9-1IPower 3D Survey Plan of the Miller Gold Property .................................................................................. 33 Figure 9-2 Drill plan map for 2014 drill program........................................................................................................ 35 Figure 10-1 Drill hole MG14-09, NQ cut core containing visible coarse gold with black chlorite grains directly hosted in syenite, sample 14149 assayed 10.7g/t Au/1.0 metre. .................................................................................. 40 Figure 12-1 Claim Post #1 (NE corner) of claim 4275152 (0582537E, 5319103N, NAD83, Zone 17U) ................... 47 Figure 12-2 Control chart for Au analyses of granite blank by A) Swastika and B) Actlabs. ..................................... 51 Figure 12-3Control chart for Au analyses of marble blank by Actlabs. ...................................................................... 52 Figure 12-4 Control chart for Au standard Oreas 204 analyzed by Swastika. ............................................................. 53 Figure 12-5 Control chart for Au standard Oreas 204 analyzed by Actlabs. ............................................................... 54 Figure 12-6 Control chart for Au standard Oreas 19a analyzed by Swastika. ............................................................. 55 Figure 12-7Control chart for Au standard Oreas 19a analyzed byActlabs .................................................................. 56 Figure 12-9 Control chart for Au standard CDN-ME-16 analyzed by Actlabs. .......................................................... 57 Figure 12-10 Control chart for Au standard CDN-GS-2K analyzed by Actlabs. ........................................................ 58 Figure 12-11 Control chart for Au standard CDN-GS-10D analyzed by Actlabs. ...................................................... 59 Figure 12-12 Control chart for core duplicates analyzed for Au by Swastika by fire assay. ....................................... 60 Figure 12-13 Control chart for core duplicates analyzed by Au by Actlabs by fire assay. .......................................... 62 Figure 12-14 Control chart for core duplicates analyzed for Au by Actlabs by metallic screen. ................................ 63 Figure 12-15 Plot of the average of the fine fraction vs. the coarse fraction for the metallic screen samples. ............ 64 TABLES Table 4-1Miller Gold Property mineral claims ............................................................................................................ 14 Table 4-2 Miller Gold Property patents ....................................................................................................................... 15 Table 9-1 Miller Gold Property historical drill hole collars (NAD83, Zone 17U) ...................................................... 30 Table 9-2 Miller Gold Property prospecting surface samples (NAD83, Zone 17U) ................................................... 31 Table 10-1Miller Gold Property 2014 drill hole collars (NAD83, Zone 17U). ........................................................... 36 Table 10-2 Miller Gold Property 2014 assay highlights table. .................................................................................... 42 Table 12-1 Miller Gold Property 2014 assay highlights table(NAD83, Zone 17U). ................................................... 46 Table 12-2 Miller Gold Property 2015 site visit core samples. ................................................................................... 49 Table 12-32014 Drill program blanks and standards ................................................................................................... 50 Table 13-1 Table of modal mineralogy for samples from MG-14-09 ......................................................................... 66 Table 18-1.Recommended exploration budget. ........................................................................................................... 69 March 29, 2015 CARACLE CREEK INTERNATIONAL CONSULTING INC. TORONTO – VANCOUVER – SUDBURY–JOHANNESBURG WWW.CARACLECREEK.COM Page | 4 Independent Technical Report: Miller Gold Property Oban Mining Corporation APPENDIX Appendix 1 – Certificates of Author March 29, 2015 CARACLE CREEK INTERNATIONAL CONSULTING INC. TORONTO – VANCOUVER – SUDBURY–JOHANNESBURG WWW.CARACLECREEK.COM Page | 5 Independent Technical Report: Miller Gold Property Oban Mining Corporation 1.0 SUMMARY Caracle Creek International Consulting Inc. ("Caracle Creek") of Toronto, Ontario, Canada was contracted by Oban Mining Corporation (Oban) to review the Miller Gold Property (the “Property”) located in the Catharine, Pacaud, Boston and McElroy Townships in northeastern Ontario and prepare an Independent Technical Report (the "Report"), compliant with National Instrument 43-101 ("NI43-101"), companion policy NI43-101CP and Form 43-101F1. The Property is located in the Larder Lake Mining Division of Northeastern Ontario 18 km south of Kirkland Lake and 5 km east of the village of Boston Creek within the Catharine, Pacaud, Boston and McElroy Townships. The Property consists of 30 contiguous, unpatented claims comprising of 65 units and 1040 ha in the Larder Lake Mining Division. All claims are 100% owned by Northstar Gold Corp. In addition, the Company also holds two Freehold Patents L17916 and L17917 with both mining and surface rights in the northwest corner of Catharine township which are contiguous with the rest of the property. Each patent has an area of 15.83 ha for a total of 31.67 ha. Surface rights for the mining claims are owned by the crown, except for 11 SRO patents which are not owned by Northstar. In February 2015, a joint venture agreement (Agreement) was signed between Oban and Northstar which allows Oban to acquire up to 70% interest on the Miller Property from Northstar. The Miller Gold Property is located within the Archean volcano sedimentary assemblage of rocks of the Western Abitibi Subprovince in the Superior Province. Metavolcanic rocks in the property area of known age fall in the range of 2750 - 2700 Ma and are cut by a an Algoman Age granitic intrusions. Most of these metavolcanics are the Catharine Assemblage of rocks which consist of mafic to intermediate volcanic rocks, subordinate pyroxene komatiite and minor felsic metavolcanic rocks. Numerous faults transect the predominately pillow, tholeiitic, mafic metavolcanic, supracrustal rocks. The most important are the north-west striking Pacaud fault and Catharine fault plus there are east-northeast striking secondary faults all of which displace the assemblage units. The gold on the property is known to be situated within both shallowly dipping and vertical quartz veins along with northwest trending porphyritic dikes and syenite stocks hosted within the mafic volcanic rocks. Gold mineralization in the area commonly has a nuggety character and coarse texture occurring in native form or as tellurides, and may or may not be associated with disseminated pyrite. March 29, 2015 CARACLE CREEK INTERNATIONAL CONSULTING INC. TORONTO – VANCOUVER – SUDBURY–JOHANNESBURG WWW.CARACLECREEK.COM Page | 6 Independent Technical Report: Miller Gold Property Oban Mining Corporation Caracle Creek visited the Property, logged and monitored QA/QC for its diamond drill program, and reviewed its ground exploration work on the Property during the summer of 2014 on behalf of Northstar Gold Corp. (“Northstar”). The 2014 drill program was undertaken to follow-up on positive historic drilling and previous ground Induced Polarization (IP) survey results on the Property completed in early 2014. The drilling was completed from June 4 - 27, 2014 comprised of fifteen NQ holes totaling 1,778.5 metres with the purpose of confirming and following up on significant Au intersections from historic drilling, and testing attractive ground IP chargeability and resistivity targets. In addition, 563 surface samples have been obtained and analyzed during the summers of 2012 - 14. The most encouraging results from this drill program came from the drill testing of the ‘Allied Syenite’ in holes MG14-03, MG14-07, and MG14-09 to MG14-12 located in the northern central part of the property in northeastern Pacaud Township. The 2014 summer drilling program established that the Allied Syenite is part of a large-scale gold enriched intrusive system that hosts widespread stringers and historically mined veins both within the intrusive and the surrounding basaltic rocks on the Miller Property. Determining a final size and gold grade for the mineralized alkaline intrusive hosted system will require a follow-up with a major drilling program. 2.0 INTRODUCTION 2.1 Introduction Caracle Creek International Consulting Inc. ("Caracle Creek") of Toronto, Ontario, Canada was contracted by Northstar Gold Crop. ("Northstar") of New Liskeard, Ontario, Canada to log the diamond drill core and compile, monitor, and review the diamond drilling results and ground exploration on the Miller Property (the “Property”) during the summer of 2014. This was followed by the contract by Oban Mining Corporation (“Oban”) to conduct this review of the Property and to prepare an Independent Technical Report (the "Report"), compliant with National Instrument 43-101 ("NI43-101"), companion policy NI43-101CP and Form 43-101F1. The drill program was managed and supervised by George Pollock, President and CEO of Northstar. March 29, 2015 CARACLE CREEK INTERNATIONAL CONSULTING INC. TORONTO – VANCOUVER – SUDBURY–JOHANNESBURG WWW.CARACLECREEK.COM Page | 7 Independent Technical Report: Miller Gold Property Oban Mining Corporation This report summarizes the historical information and the results of exploration to-date completed by Northstar with a focus on the diamond drilling undertaken on the Property from June 4 - 27 2014, and presents recommendations for future work based upon the results. The objectives of the drilling program were to: To follow-up on positive drilling and mining results from previous exploration and development work on the property from the 1918 to 1987 including the twinning of historic drill holes. To target and test prospective surface IP chargeability and resistivity anomalies from ground survey completed earlier in 2014. The Property has been visited by independent Caracle Creek geologists twice in the past year. The first visit was conducted by Trevor Boyd and Elisabeth Ronacher, both "independent qualified persons" in accordance with National Instrument 43-101, from June 2 – 27, 2014 to log and sample the drill core, inspect the drill, conduct independent surface sampling at the Property and monitor the QA/QC during the drill program. The second visit was conducted by Trevor Boyd on March 27, 2015 with the purpose of checking locations of claim posts using GPS focusing on the newly staked claims in January, 2015 and choosing independent site-visit drill core samples to be analyzed at a third laboratory. The sources of information for this Report include exploration and tenure data provided by Oban and Northstar, publically available data, information collected during the site visit and references cited in section 19.0. 2.2 Terminology Fire assay: Fire assay is the method of choice for gold analysis. The procedure involves mixing an aliquot of the sample (e.g., 30 g or 50 g) with a flux agent (e.g., sodium borate, PbO) and a “collector” such as silver. The mixture is heated to ~1150 °C. The lead and silver settle to the bottom of the melt and the silver scavenges gold as it sinks. The lead and silver button is cupelled at 950 °C. The silver bead (which also contains gold) is dissolved and analyzed by atomic absorption or other techniques (http://actlabs.com). ICP-MS: Inductively Coupled Plasma - Mass Spectrometer: An instrument capable of determining the concentrations of 70+ elements simultaneously by measuring the mass of ions generated by an argon gas March 29, 2015 CARACLE CREEK INTERNATIONAL CONSULTING INC. TORONTO – VANCOUVER – SUDBURY–JOHANNESBURG WWW.CARACLECREEK.COM Page | 8 Independent Technical Report: Miller Gold Property Oban Mining Corporation plasma heated to 10,000°K and passing through a magnetic quadrupole to the detector. Capable of ultra low detection limits (ppb to ppt) with very wide linear ranges (up to 7 orders of magnitude) (Acme Analytical Laboratories Ltd: www.acmelab.com). QA/QC: Quality Assurance/ Quality Control 2.3 Units The Metric System is the primary system of measure and length used in this Report and is generally expressed in kilometres (km), metres (m) and centimetres (cm); volume is expressed as cubic metres (m3), mass expressed as metric tonnes (t), area as hectares (ha), and gold and silver concentrations as grams per tonne (g/t). Conversions from the Metric System to the Imperial System are provided below and quoted where practical. Many of the geologic publications and more recent documents now use the Metric System but older documents almost exclusively refer to the Imperial System. Metals and minerals acronyms in this report conform to mineral industry accepted usage and the reader is directed to www.maden.hacettepe.edu.tr/dmmrt/index.html for a glossary. Conversion factors utilized in this report include: 1 troy ounce/ton = 34.285714 grams/tonne 1 gram/tonne = 0.029167 troy ounces/ton 1 troy ounce = 31.103477 grams 1 gram = 0.032151 troy ounces The term gram/tonne or g/t is expressed as “gram per tonne” where 1 gram/tonne = 1 ppm (part per million) = 1000 ppb (part per billion). The mineral industry accepted terms Au g/t and g/t Au are substituted for “grams gold per metric tonne” or “g Au/t”. Other abbreviations include ppb = parts per billion; ppm = parts per million; oz/t = troy ounce per short ton; Moz = million ounces; Mt = million tonne; t = tonne (1000 kilograms); SG = specific gravity; lb/t = pound/ton; and, st = short ton (2000 pounds). March 29, 2015 CARACLE CREEK INTERNATIONAL CONSULTING INC. TORONTO – VANCOUVER – SUDBURY–JOHANNESBURG WWW.CARACLECREEK.COM Page | 9 Independent Technical Report: Miller Gold Property Oban Mining Corporation Dollars are expressed in Canadian currency (CAD$) unless otherwise noted. Gold (Au) and silver (Ag) are stated in US$ per troy ounce (US$/oz). Where quoted, Universal Transverse Mercator (UTM) coordinates are provided in the datum of Canada, NAD83, Zone 17U North. 2.4 Caracle Creek Qualifications Caracle Creek International Consulting Inc. is an international consulting company with the head office of Canadian operations based in Sudbury, Ontario, Canada. Caracle Creek provides a wide range of geological and geophysical services to the mineral industry. With offices in Canada (Sudbury and Toronto, Ontario and Vancouver, British Columbia) and South Africa (Johannesburg), Caracle Creek is well positioned to service its international client base. Caracle Creek's mandate is to provide professional geological and geophysical services to the mineral exploration and development industry at competitive rates and without compromise. Caracle Creek's professionals have international experience in a variety of disciplines with services that include: Exploration Project Generation, Design and Management Data Compilation and Exploration Target Generation Property Evaluation and Due Diligence Studies Independent Technical Reports (43-101)/Competent Person Reports Mineral Resource/Reserve Modelling, Estimation, Audit; Conditional Simulation 3D Geological Modelling, Visualization and Database Management In addition, Caracle Creek has access to the most current software for data management, interpretation and viewing, manipulation and target generation. The primary Qualified Person and author for this Report is Trevor Boyd, Ph.D., P.Geo. Associate for Caracle Creek Canada and a geologist in good standing with the Association of Professional Geoscientists of Ontario (APGO #1023). Trevor Boyd has over 25 years of experience working as an economic geologist. March 29, 2015 CARACLE CREEK INTERNATIONAL CONSULTING INC. TORONTO – VANCOUVER – SUDBURY–JOHANNESBURG WWW.CARACLECREEK.COM Page | 10 Independent Technical Report: Miller Gold Property Oban Mining Corporation Another Qualified Person and co-author of this Report is Julie Selway, Ph.D., P.Geo. Senior Geologist for Caracle Creek Canada and a geologist in good standing with the Association of Professional Geoscientists of Ontario (APGO #738). Julie Selway has 15 years of experience in the mineral exploration industry and in academia and has authored/co-authored numerous Independent Technical Reports (NI43-101) on gold, Cu-Ni-PGE, VMS, porphyry copper, stratiform copper, rare-element pegmatites and potash. Certificates of Qualifications are provided in Appendix I. 3.0 RELIANCE ON OTHER EXPERTS Caracle Creek has completed this Report in accordance with the methodology and format outlined in National Instrument 43-101, companion policy NI43-101CP and Form 43-101F1. This Report was prepared by competent and professional individuals from Caracle Creek on behalf of the Company and is directed solely for the development and presentation of data with recommendations to allow the Company and current or potential partners to reach informed decisions. The information, conclusions and recommendations contained herein are based on a review of digital and hard copy data and information supplied to Caracle Creek by the Company, as well as various published geological reports, and discussions with representatives from the Company who are familiar with the Property and the area in general. Caracle Creek has assumed that the reports and other data listed in the “References” section of this report are substantially accurate and complete. Caracle Creek has relied exclusively on information provided by the Company regarding land tenure and underlying agreements not in the public domain, and all of these sources appear to be of sound quality. The non-public source of information regarding land tenure is a Joint Venture Agreement between Oban Mining Corporation and Northstar Gold Corp. which was provided to the author by Gernot Wober, VP Exploration of Oban Mining Corporation. The public source of information regarding land tenure is the MNDM website (MNDM website: http://www.mndm.gov.on.ca). Caracle Creek did not conduct an indepth review of mineral title and ownership and the title ownership and status of claims as outlined in this Report was obtained from George Pollock, President of Northstar. While title documents and option/purchase agreements were reviewed for this study as provided by George Pollock, it does not constitute, nor is it intended to represent, a legal, or any other opinion as to title. March 29, 2015 CARACLE CREEK INTERNATIONAL CONSULTING INC. TORONTO – VANCOUVER – SUDBURY–JOHANNESBURG WWW.CARACLECREEK.COM Page | 11 Independent Technical Report: Miller Gold Property Oban Mining Corporation The dates, titles and authors of all reports that were used as a source of information for this Technical Report are listed in the “References” section of this report. The dates and authors of these reports also appear in the text of this Report where relevant, indicating the extent of the reliance on these reports. 4.0 PROPERTY DESCRIPTION AND LOCATION 4.1 Location The Property is located in the Larder Lake Mining Division of Northeastern Ontario 18 km south of Kirkland Lake and 5 km east of the village of Boston Creek at approximately 582800E and 5317700N, UTM Zone 17N NAD83 (Figure 4-1). The Property is located within the Catharine, Pacaud, Boston and McElroy Townships. March 29, 2015 CARACLE CREEK INTERNATIONAL CONSULTING INC. TORONTO – VANCOUVER – SUDBURY–JOHANNESBURG WWW.CARACLECREEK.COM Page | 12 Independent Technical Report: Miller Gold Property Oban Mining Corporation Figure 4-1Location of Miller Gold Property, near Kirkland Lake, Ontario March 29, 2015 CARACLE CREEK INTERNATIONAL CONSULTING INC. TORONTO – VANCOUVER – SUDBURY–JOHANNESBURG WWW.CARACLECREEK.COM Page | 13 Independent Technical Report: Miller Gold Property Oban Mining Corporation 4.2 Description and Ownership The Property consists of 30 contiguous, unpatented claims comprising of 65 units and 1040 ha in the Larder Lake Mining Division within the Catharine, Pacaud, Boston and McElroy Townships as shown on Figure 4-1 and Figure 4-2. All claims are 100% owned by Northstar Gold Corp. of 17 Wellington Street, New Liskeard, Ontario. In addition, the Company also holds two Freehold Patents L17916 (PIN 61250-0076, Parcel 323SST) and L17917 (PIN 61250-0075, Parcel 322SST) with both mining and surface rights in the northwest corner of Catharine township which are contiguous with the rest of the property (Figure 4-2, Table 4-2). Each patent has an area of 15.83 ha for a total of 31.67 ha. Surface rights for the mining claims are owned by the crown, except for 11 SRO patents which are not owned by Northstar listed in Table 4-2. Northstar has legal access to the Miller Gold Property, but it is professional courtesy to notify surface rights owners before commencing an exploration program. Table 4-1Miller Gold Property mineral claims Township Boston Boston Catherine Catherine Catherine Catherine Catherine McElroy McElroy McElroy McElroy McElroy McElroy McElroy McElroy Pacaud Pacaud Pacaud Pacaud Pacaud Pacaud Pacaud March 29, 2015 Claim Number 4271892 4272892 4201239 4201240 4215970 4217728 4224525 4272022 4272893 4272895 4275033 4275152 4275153 4275154 4275156 4207125 4241927 4241928 4242310 4243470 4243545 4246848 Recording Date 2012-Dec-27 2014-Mar-20 2006-Jun-28 2006-Jun-28 2007-Jun-26 2007-Jan-10 2008-Mar-11 2014-Mar-24 2014-Mar-19 2014-Mar-19 2015-Jan-19 2015-Jan-19 2015-Jan-19 2015-Jan-19 2015-Jan-19 2009-Dec-24 2009-Nov-09 2009-Nov-09 2009-Jul-23 2010-Jan-21 2010-Mar-05 2009-Jun-02 Claim Due Date 2019-Dec-27 2019-Mar-20 2018-Jun-28 2019-Jun-28 2020-Jun-26 2018-Jan-10 2018-Mar-11 2019-Mar-24 2019-Mar-19 2019-Mar-19 2017-Jan-19 2017-Jan-19 2017-Jan-19 2017-Jan-19 2017-Jan-19 2018-Dec-24 2018-Nov-09 2018-Nov-09 2018-Jul-23 2019-Jan-21 2019-Mar-05 2020-Oct-16 Claim Units 2 2 5 5 6 4 1 1 1 5 1 2 1 1 2 3 1 2 4 4 1 1 Area (ha) 32 32 80 80 96 64 16 16 16 80 16 32 16 16 32 48 16 32 64 64 16 16 Work Required $800 $800 $2,000 $2,000 $2,400 $1,600 $400 $400 $400 $2,000 $400 $800 $400 $400 $800 $1,200 $400 $800 $1,600 $1,600 $400 $400 CARACLE CREEK INTERNATIONAL CONSULTING INC. TORONTO – VANCOUVER – SUDBURY–JOHANNESBURG WWW.CARACLECREEK.COM Total Applied $4,000 $2,400 $20,000 $22,000 $26,400 $14,400 $3,200 $1,200 $1,200 $6,000 $0 $0 $0 $0 $0 $8,400 $2,800 $5,600 $11,200 $11,200 $2,800 $3,600 Total Reserve $0 $0 $0 $527 $395 $0 $0 $0 $0 $0 $0 $0 $0 $0 $0 $0 $0 $0 $0 $0 $0 $0 Page | 14 Independent Technical Report: Miller Gold Property Oban Mining Corporation Township Pacaud Pacaud Pacaud Pacaud Pacaud Pacaud Pacaud Pacaud Claim Number 4255264 4255265 4267275 4267276 4267277 4267278 4267279 4267280 Recording Date 2010-Jul-02 2010-Jul-02 2012-Jun-05 2012-Jun-05 2012-Jun-05 2012-Jun-05 2012-Jun-05 2012-Jun-05 Claim Due Date 2019-Jul-02 2019-Jul-02 2020-Jun-05 2020-Jun-05 2020-Jun-05 2020-Jun-05 2020-Jun-05 2020-Jun-05 Total Claim Units 1 1 2 1 1 1 1 2 65 Area (ha) 16 16 32 16 16 16 16 32 1040 Work Required $400 $400 $800 $400 $400 $400 $400 $800 Total Applied $2,800 $2,800 $4,800 $2,400 $2,400 $2,400 $2,400 $4,800 Total Reserve $0 $0 $0 $116,896 $85 $0 $0 $0 Table 4-2 Miller Gold Property patents Township Catharine Catharine McElroy McElroy McElroy Boston Boston Boston Pacaud Pacaud Pacaud Pacaud Pacaud Catharine Patent L17917 L17916 L5097 L5098 L5128 L4906 L4737 L5025 L17987 L17988 L52238 L52237 L52235 L11175 Rights SRO, MRO SRO, MRO SRO SRO SRO SRO SRO SRO SRO SRO SRO SRO SRO SRO PIN 61250-0075 61250-0076 61245-0027 61245-0026 61245-0111 61244-0121 61244-0118 61244-0116 61251-0047 61251-0048 61251-0053 61251-0055 61251-0054 61250-0079 Relationship to MRO overlaps with mining claim 4275156 overlaps with mining claim 4275156 overlaps with mining claim 4272895 overlaps with mining claim 4271892 overlaps with mining claim 4271893 overlaps with mining claim 4275152 overlaps with mining claim 4255265 overlaps with mining claim 4255264 overlaps with mining claim 4241927 overlaps with mining claim 4241928 overlaps with mining claim 4241928 overlaps with mining claim 4224525 Status of PIN active active active closed active active active active active active active active active active MRO = mineral rights only, SRO = surface rights only Northstar owns L17917 and L17916, Northstar does not own surface rights on the other Patents March 29, 2015 CARACLE CREEK INTERNATIONAL CONSULTING INC. TORONTO – VANCOUVER – SUDBURY–JOHANNESBURG WWW.CARACLECREEK.COM Page | 15 Independent Technical Report: Miller Gold Property Oban Mining Corporation Figure 4-2 Claim map of Miller Gold Property, near Englehart, Ontario March 29, 2015 CARACLE CREEK INTERNATIONAL CONSULTING INC. TORONTO – VANCOUVER – SUDBURY–JOHANNESBURG WWW.CARACLECREEK.COM Page | 16 Independent Technical Report: Miller Gold Property Oban Mining Corporation 4.3 Oban – Northstar Option to Acquire 70% Interest in Miller Property On February 22, 2015, a joint venture agreement (Agreement) was signed between Oban and Northstar which allows Oban to acquire up to 70% interest on the Property from Northstar. Under the terms of the Agreement, the Company can earn up to a 51% interest in the Property by subscribing for $300,000 in common shares of Northstar at $0.10 per share, and making payments and incurring expenditures of $3 million over three years. Oban can earn a further 9% interest by making payments and incurring expenditures equal to $2 million by the fifth anniversary, and a further 10% by the sixth anniversary for payments and expenditures equal to a further $3.3 million or, at the option of Oban, $2 million and a commitment to fund the Property through to completion of a pre-feasibility study. The QP has reviewed a copy of the Oban – Northstar agreement and is relying on Oban’s legal counsel that the agreement is sound. Mineral claims 4275033 and 4241927 are not included in the current agreement between Oban and Northstar, but their addition to the agreement is in progress. 4.4 Obligations In Ontario, to retain a mining claim, companies must submit an assessment file to the MNDM Geoscience Assessment Office showing that they have spent $400/per claim unit on exploration on each claim. One claim unit is equal to 16 hectares. A mining claim is issued for a term of 2 years. Property tax is required to be paid to Ontario Ministry of Finance on each patent. In 2014, the property tax for Northstar’s L17917 (Parcel 322 SST) was $50.74 due June 27, 2014. The property tax for L17916 (Parcel 323 SST) was also $50.74. The property taxes were paid and are in good standing. The Miller Property is subject to three royalities: 1. Ashley Gold Mines Royalty: There is a 0.25% NSR with an option to buy out for $250,000 owed to Ashley Gold Mines on the Com Copper mine which represents 16 hectares (claim 4246848) in Pacaud Township. The remaining 15 mining claims representing 240 hectares (claim 4201240 with 5 units, 4224525 with 1 unit, 4201239 with 5 units, 4217728 with 4 units) in Catherine township also carry a 2% NSR owed to Ashley Gold Mines with a 1% buy back for 1 million dollars and a right of first refusal on the remaining 1% NSR. March 29, 2015 CARACLE CREEK INTERNATIONAL CONSULTING INC. TORONTO – VANCOUVER – SUDBURY–JOHANNESBURG WWW.CARACLECREEK.COM Page | 17 Independent Technical Report: Miller Gold Property Oban Mining Corporation 2. Franco-Nevada Corporation Royalty: There is a 3% NSR belonging to Franco-Nevada Corporation carried over in the deal on 32 hectare Campbell Property in the northeast corner of Catherine township (patents L17916 and L17917). 3. Lake Shore Gold Royalty: There is a 2% NSR owed to Lake Shore Gold on the Shoebox Property (claim 4215970 with 6 units) representing 96 hectares with a 1% buy back for 1 million dollars and a right of first refusal on the remaining 1% NSR. Other than the agreement with Oban Mining (section 4.3) and the above royalities, there are no other agreements on the Miller Property. An Exploration Plan or Exploration Permit is required from the Ministry of Northern Development and Mines in order to be allowed to undertake exploration activities on mining claims, leases or licences of occupation are required to submit an Exploration Permit application (http://www.mndm.gov.on.ca/en/mines-and-minerals/mining-act/mining-act-modernization/explorationplans). These exploration activities include ground geophysical surveys, mechanized drilling, surface stripping, line cutting and pitting and trenching. Surface rights owners must be notified when applying for a permit. Aboriginal communities potentially affected by the exploration permit activities will be consulted and have an opportunity to provide comments and feedback before a decision is made on the permit. Northstar had an exploration permit at the time of the 2014 drill program, but this permit has expired. Northstar has applied for another exploration permit which is in progress, to cover the claims for the proposed 2015 drill program. There are no environmental liabilities on the mineral claims as the environmental liability of mineral claims is the responsibility of the crown. In the future, if the mineral claims are converted to leases, then there are historic shafts on the property which should be capped. Currently, two historic shafts near the main road have been capped. Even though the Property is a brownfields site, there are no visible tailings on the surface. To the best of Caracle Creek’s knowledge, there are no significant factors and risks that may affect access to title, or the right or ability to perform work on the property. March 29, 2015 CARACLE CREEK INTERNATIONAL CONSULTING INC. TORONTO – VANCOUVER – SUDBURY–JOHANNESBURG WWW.CARACLECREEK.COM Page | 18 Independent Technical Report: Miller Gold Property Oban Mining Corporation 5.0 ACCESSIBILITY, CLIMATE, LOCAL RESOURCES, INFRASTRUCTURE, AND PHYSIOGRAPHY 5.1 Access The most convenient access to the Miller Property is from Kirkland Lake via Highway 66, then south on Highway 112, then turning east on local road 564 to Boston Creek, then further east along logging road for about 4 km to the property. Depending upon the weather the logging road may be at times only 4wheel drivable and have load restrictions on heavy vehicles. During the winter the road is ploughed only to Boston Creek. 5.2 Climate and Vegetation The climate normals for 1971-2000 from Environment Canada for Kirkland Lake (closest weather station to the property) indicate that the daily average temperature ranges from -18ºC in January to 17ºC in July. The average monthly accumulation of rain is around 95 mm from June to September. The average monthly accumulation of snow is 65 cm from December to January. Drilling can be conducted year round except for spring thaw in mid-March to May. Geological mapping and outcrop sampling can be conducted May to November when there is no snow on the ground. 5.3 Physiography The topography of the property consists of moderate to low relief with elevations ranging from 300 to 330 metres above sea level. Most of the property is wooded with a number of creeks and swampy areas throughout. 5.4 Infrastructure and Local Resources The population of the nearest town, Kirkland Lake is 8,483 people (Statistics Canada, www.statcan.gc.ca). Kirkland Lake is an economically vibrant mining town and a good source for labour, exploration supplies and general services. The area is well serviced by highways, a railway line and hydro-electric power lines which extend to within four kilometres of the property at Boston Creek. March 29, 2015 CARACLE CREEK INTERNATIONAL CONSULTING INC. TORONTO – VANCOUVER – SUDBURY–JOHANNESBURG WWW.CARACLECREEK.COM Page | 19 Independent Technical Report: Miller Gold Property Oban Mining Corporation The Miller Property is in the exploration stage and does not yet have 43-101 compliant resource/reserve or a prefeasibility study; therefore, discussion on potential tailings storage areas, potential waste disposal areas, heap pad leach pad areas and potential processing tailings storage area for mining operations is not relevant. 6.0 HISTORY 6.1 Summary of Exploration History The work history on the property area is poorly documented but briefly outlined below. There is, however, a description of the early exploration and mining activity from the Nortek Exploration 1986-87 program covering much of the property area which is available in French (1988). 1918-20 Reported Miller – Independence Mine production of 58.5 ounces Au, 70 ounces Ag from 31 ton bulk sample of recovery grade of 1.89 oz/ton Au. French (1988) discusses the mine development activity and workings including continuing work on the mine into the 1930s. 1920s-39 Intermittent exploration of the historic Planet Gold claims since the 1920s located in Boston and McElroy townships north of the Miller-Independence mine workings (incorporated into the greater Miller Property) including the mining of a 16 ton bulk sample. In 1938, a 3.35 ton portion of the bulk sample was milled by gravity methods on behalf of Howey Gold Mines and reported a grade of 0.0845 oz/ton gold (Seeber 1982). A company document from period suggested the Planet Gold claims hold 5 Mt of gold mineralized material of unknown grade hosted in a syenite intrusion (Massore Mining Syndicate Limited 1941), but this is reported for information only and is not to be relied upon. The Qualified Person has not verified this information in this document. 1961-63 Tagiamonte drilled three diamond drill holes testing quartz veins in area, no assays reported. 1963 March 29, 2015 ODM Report #18 – The geology of Catharine and Marter Township by J.A. Grant. CARACLE CREEK INTERNATIONAL CONSULTING INC. TORONTO – VANCOUVER – SUDBURY–JOHANNESBURG WWW.CARACLECREEK.COM Page | 20 Independent Technical Report: Miller Gold Property Oban Mining Corporation 1982 Rotary drill program completed on the historic Planet Gold claims with low gold grade results, see Seeber (1982). 1984 1983-86 1987 Alex Perron completes VLF-EM and ground magnetic surveys. Shenandoh Resources Ltd., Surface stripping and bulk sampling, see French (1988) Nortek Exploration - 37 diamond drill holes, a grade and tonnage for the MillerIndependence deposit estimated at 808,000 tons at 0.335 oz/ton Au is reported in the document. This number is a historical estimate, not compliant to 43-101 guidelines, provided for information only and is not to be relied upon. The relevance of this historical estimate is as a rough guideline of possible resource on the Property. The key assumptions, parameters and methods to prepare this historical estimate are not known. The historical estimate does not use categories set out in sections 1.2 and 1.3 NI 43-101. A full assessment report is filed with MNDM by G.B. French (1988). This historical estimate can be updated to a current mineral resource by additional drilling. The Qualified Person has not done sufficient work to classify the historical estimate as current mineral resource and the issuer is not treating this historical estimate as a current mineral resource. 1994 OGS OFR5884 – The Precambrian Geology of Pacaud and Catharine Townships and portions of adjacent townships, District of Timiskaming, Ontario by S.L. Jackson (1994). 2009 John Mckenzie did some prospecting on the Perron claims (Shoebox Property) directly east of the Miller – Independence mine workings (incorporated into the greater Miller Property), and filed assessment report with MNDM (Mackenzie 2009). 2012-14 Northstar stakes most of the present Miller Property including the original Pacaud claims area and completes line cutting, ground magnetic survey and surface prospecting, followed by ground IP - IPower 3D survey in 2014 over the cut line grid. Report prepared by T. Loader (2014). 2015 Northstar stakes the adjacent Planet Property in January, 2015 and incorporates it into the joint venture agreement with Oban Mining Corporation. March 29, 2015 CARACLE CREEK INTERNATIONAL CONSULTING INC. TORONTO – VANCOUVER – SUDBURY–JOHANNESBURG WWW.CARACLECREEK.COM Page | 21 Independent Technical Report: Miller Gold Property Oban Mining Corporation 7.0 GEOLOGICAL SETTING AND MINERALIZATION 7.1 Regional Geology The geological description of the property area and information on geological figures are drawn mostly from Jackson (1994) and French (1988). The Miller Gold Property is located within the Archean volcano sedimentary assemblage of rocks of the Western Abitibi Subprovince in the Superior Province. Metavolcanic rocks in the property area of known age fall in the range of 2750 - 2700 Ma and are cut by a an Algoman Age granitic intrusions. Most of these metavolcanics are the Catharine Assemblage of rocks which consist of mafic to intermediate volcanic rocks, subordinate pyroxene komatiite and minor felsic metavolcanicrocks (Figure 7-1). Intermittent small pyritic sulphide zones occur in the metavolcanic rocks. Early Proterozoic diabase dykes crosscut the Archean rocks. Regional metamorphic grade is greenschist facies. March 29, 2015 CARACLE CREEK INTERNATIONAL CONSULTING INC. TORONTO – VANCOUVER – SUDBURY–JOHANNESBURG WWW.CARACLECREEK.COM Page | 22 Independent Technical Report: Miller Gold Property Oban Mining Corporation Figure 7-1Interpretative geology of the Miller Gold Property March 29, 2015 CARACLE CREEK INTERNATIONAL CONSULTING INC. TORONTO – VANCOUVER – SUDBURY–JOHANNESBURG WWW.CARACLECREEK.COM Page | 23 Independent Technical Report: Miller Gold Property Oban Mining Corporation 7.2 Local and Property Geology Numerous faults transect the predominately pillow, tholeiitic, mafic metavolcanic, supracrustal rocks (Figure 7-1). The most important are the north-west striking Pacaud fault and Catharine fault plus there are east-northeast striking secondary faults all of which displace the assemblage units. The largest intrusive body in the area is the tonalite dominated Round Lake Batholith located in the southwest part of Pacaud Township. In general, cleavage and shear zones tend to parallel the batholith margin and in the property area strike northwest, steeply dipping, and facing northeast. In terms of economic geology, the gold on the property is known to be situated within both shallowly dipping and vertical quartz veins along with northwest trending porphyritic dikes and syenite stocks hosted within the mafic volcanic rocks. Gold mineralization in the area commonly has a nuggety character and coarse texture occurring in native form or as tellurides, and may or may not be associated with disseminated pyrite. Presently, the most economically interesting veins are located in the northeastern Pacaud Township, within in the centre of the property on claims 4267276 and 4267277 (Figure 9-2).Historical interest has been on a series of east-west trending veins, the most predominant being the north shallowly dipping Vein #1 which was the focus of exploration and development activity reported in the Nortek 1986-87 work program (French 1988). Other veins of historical interest include the steeply dipping D Vein which trends northeast to the immediate west of Vein #1. Alkaline intrusives named the Allied Syenite in Pacaud Township and Planet Syenite in Boston Township plus a number of northwest trending sinuous feldspar porphyry bodies are noted north of the Vein 1 and may have a genetic relationship to the gold mineralization (Figure 9-2). The syenite in places may have a more granitic appearance and composition but this is believed to be a function of introduced quartz in the form of veins and silicification in the matrix. The Allied Syenite is part of an arc of alkaline magmatism that extends for 3,000 metres to the north and may be connected to the Planet Syenite. Au-Bi-Te association was identified in drill hole MG-14-12, sample 14624 at 54.6 m (Figure 7-2). This sample was logged as a quartz vein with visible gold, tellurides and chalcopyrite. The quartz vein intrudes a syenite. Assay results show that this sample has 12.2 g/t Au by metallic screen, 1260 ppm Bi, 359 ppm Cu, 296 ppm Pb and 79.4 ppm Te. March 29, 2015 CARACLE CREEK INTERNATIONAL CONSULTING INC. TORONTO – VANCOUVER – SUDBURY–JOHANNESBURG WWW.CARACLECREEK.COM Page | 24 Independent Technical Report: Miller Gold Property Oban Mining Corporation Figure 7-2 Au-Bi-Te stringers in quartz vein from 54.6 m, MG-14-12. 8.0 DEPOSIT TYPES The Property lies in the Kirkland Lake Mining District of northeast Ontario in which historically gold has been mined as typical Mesothermal, replacement type, high-grade, quartz veins found along or close to a major east-west trending Archean deformation/structural feature named the Kirkland Lake Main break within the Larder Lake - Cadillac Deformation Zone. Gold production since 1915 from seven gold mines has collectively produced more than 24 million ounces of gold. (Clark 2013). March 29, 2015 CARACLE CREEK INTERNATIONAL CONSULTING INC. TORONTO – VANCOUVER – SUDBURY–JOHANNESBURG WWW.CARACLECREEK.COM Page | 25 Independent Technical Report: Miller Gold Property Oban Mining Corporation More recently identified gold deposits in the camp such as the Upper Beaver deposit held by Agnico Eagle Mines Limited consists of disseminated to quartz filled fractures, stockworks, breccias, and pyritic zones associated with igneous intrusives commonly of syenite composition (Agnico Eagle Mines website: http://www.agnicoeagle.com/). At the Macassa Mine presently operated by Kirkland Lake Gold Inc., higher grade shoots constitute about 30% of the overall gold mineralized structures cutting the syenites. The following description of the Kirkland Lake Camp gold mineralization is taken from Ispolatov et al. (2005). March 29, 2015 CARACLE CREEK INTERNATIONAL CONSULTING INC. TORONTO – VANCOUVER – SUDBURY–JOHANNESBURG WWW.CARACLECREEK.COM Page | 26 Independent Technical Report: Miller Gold Property Oban Mining Corporation “CHARACTERISTICS OF GOLD MINERALIZATION HOSTED BY THE LARDER LAKE–CADILLAC DEFORMATION ZONE Gold mineralization at the Anoki and McBean properties is similar to the abovedescribed gold deposits of McVittie and McGarry townships. In particular, the replacement-style, pyrite-rich Anoki Main zone shares strong analogies with the Kerr Addison-Chesterville flow ore, and replacement ores of Cheminis and Omega mines. Gold-bearing quartz stockworks in carbonate-fuchsite schists explored at depth at the McBean deposit and within the Anoki Deep zone are similar to the “green carbonate” ore at Kerr Addison-Chesterville. Mineralized aphyric dikes of the McBean ore zone strongly resemble the albitite ore of the Kerr Addison Mine described by Smith et al. (1993). Mineralization of the Anoki South zone that is hosted by a graphitic exhalite horizon may correlate to the graphite ore of the Kerr Addison-Chesterville Mine. Similarities in mineralization styles as well as analogous structural setting within the Larder Lake–Cadillac deformation zone suggest that gold-bearing zones of the Anoki and McBean properties are likely related to mineralization of Kerr Addison-Chesterville, Cheminis, and Omega mines. All these occurrences of gold mineralization are parts of a single regional hydrothermal system. The most characteristic features of this system are summarized below: 1. Gold mineralization is localized within a first-order structure, that is, the Larder Lake–Cadillac deformation zone (Smith et al. 1993), and (as far as we are aware) there is no tendency for preferential occurrence of larger deposits in second- and third-order structures; 2. Mineralization is commonly associated with gentle S-shaped bends along the Larder Lake–Cadillac deformation zone (Anoki, McBean, Omega, and Cheminis); 3. On the scale of the host deformation zone, mineralization tends to form linear shoots (strike length<dip length) that plunge roughly parallel to the regional stretching lineation (L2): e.g., 40-50° east at McBean (this study); approximately 70º E at Kerr Addison-Chesterville (Smith et al. 1993, p. 30); near vertical at Cheminis (longitudinal section in Clark and Bonnar 1987; structural data in Wilkinson 1993, p.142). 4. At least some mineralized zones are centered on relatively competent lava flow units (e.g., Omega, Cheminis, possibly Kerr Addison) that are flanked by rheologically weak and probably impermeable ultramafic talc-chlorite schists (e.g., Thomson 1941; Smith et al. 1993). March 29, 2015 CARACLE CREEK INTERNATIONAL CONSULTING INC. TORONTO – VANCOUVER – SUDBURY–JOHANNESBURG WWW.CARACLECREEK.COM Page | 27 Independent Technical Report: Miller Gold Property Oban Mining Corporation 5. There are two principal types of gold mineralization: a) the economically most important style is the pyritic replacement ore where gold is present largely as submicroscopic particles in pyrite (accounts for about 65% of gold at Kerr AddisonChesterville, most gold at Cheminis and Omega, and Anoki Main zone), and b) the second in importance are quartz stockworks and veins in carbonate-fuchsite-altered ultramafic rocks, where coarser gold is present principally in quartz. The two mineralization types coexist within individual deposits and are probably related to the same hydrothermal episode (e.g., Smith et al. 1993). Localization and shape of individual replacement ore bodies is typically defined by primary or structurally modified geometry of geochemically and rheologically favourable units (Smith et al. 1993; present study of the Anoki Main zone). Volcanic rocks of the Larder Lake Group constitute the most common protolith for replacement ores. Volcanic protoliths of the Anoki Main zone and Kerr Addison-Chesterville flow ore (Warwick 1981; Kishida and Kerrich 1987) are Fe-tholeiites. Carbonate is the major component in both mineralization types, which indicates that ore was generated by carbonic, CO2 – rich fluids (e.g., Kishida and Kerrich 1987). Sulphidation of the Fe-rich, high Fe/Mg tholeiitic rocks must have constituted the main gold deposition mechanism for pyritic replacement mineralization (Böhlke 1988; Phillips et al. 1984; Smith et al. 1993), whereas relatively coarse gold in quartz veins enclosed in carbonate-fuchsite alteration was most likely deposited through phase separations (e.g., Smith et al. 1993). The latter mechanism agrees well with the rather irregular distribution of gold in “green carbonate ore” (Smith et al. 1993) and occurrence of gold-barren quartz stockworks in carbonate-fuchsite schists. Both types of mineralization most probably belong to the syn-deformation greenstone-hosted quartz-carbonate vein (mesothermal-orogenic) deposit class. 6. Syn-mineralization hydrothermal alteration likely increased competency of host rocks; ultramafic talc-chlorite schists were modified into carbonate-fuchsite rocks with abundant quartz veining, the largely chloritic flow unit of the Anoki zone was replaced by albite-rich aggregate. In both cases, hydrothermal products are more rigid than the protolith, and are likely to respond more brittley to continuing deformation and maintain or even enhance permeability. Occurrence of mesothermal gold mineralization in the first order deformation zone is unusual. Within the most economically significant gold camps, the largest gold deposits are typically found in subsidiary second- and third-order structures (e.g., Eisenlohr et al. 1989; Robert 1990; McCuaig and Kerrich 1998). This atypical localization pattern may be due to the nature of the Larder Lake–Cadillac deformation zone in the Larder Lake area. Lithological assemblage of the Larder Lake–Cadillac deformation zone includes competent mafic volcanic units intermingled with or enveloped by incompetent and impermeable ultramafic talcchlorite schists (Thomson 1941). This combination probably constituted favourable ground for maintaining isolated discrete permeable fluid conduits within the deformation zone. Competent tholeiitic volcanic units responded more brittley, thus enhancing their overall permeability. Rheologically weak talc-chlorite schists enveloped these permeable zones, preventing fluid dispersal and maintaining high fluid/rock ratios within fluid pathways. Some of these competent units were also March 29, 2015 CARACLE CREEK INTERNATIONAL CONSULTING INC. TORONTO – VANCOUVER – SUDBURY–JOHANNESBURG WWW.CARACLECREEK.COM Page | 28 Independent Technical Report: Miller Gold Property Oban Mining Corporation geochemically favourable for sulphidation (e.g., Fe-tholeitic, high Fe/Mg rocks), and gold deposition occurred. The location of gold deposits in the Larder Lake–Cadillac deformation zone may (at least in part) reflect biases in exploration strategies, that is, the “Larder Lake Break” has for almost 100 years attracted the most attention from geologists and prospectors alike, and potentially gold-bearing subsidiary structures may have been overlooked. There is no geological factor precluding the occurrence of gold mineralization along subsidiary faults or shear zones that were hydraulically connected to the Larder Lake–Cadillac deformation zone during a regional hydrothermal mineralizing event. The presence of Fe-tholeiites in the Kinojevis assemblage and Larder Lake Group (north and south of the Larder Lake– Cadillac deformation zone) supports the possibility for formation of replacement-style gold mineralization along subsidiary splays of the Larder Lake–Cadillac deformation zone.” 9.0 EXPLORATION 9.1 Locating Historic Drill Holes The locations of historical diamond drill holes from previous work are shown in Table 9-1 distributed throughout the property on claims 4267277, 4267276, 4215970 and on the adjacent patented land Lot 12 Con 6 in Catharine Township south of 4215970 and east of 4267277. The holes highlighted in yellow possess collars that have been located on the ground and surveyed by handheld GPS while the remainder are estimated from historical property maps and reports of work, predominantly French (1988), and their locations have not been verified in the field. All of the ground located collars were re-found in May, 2014 on claim 4267276 except for DDH 204 on claim 4267277. March 29, 2015 CARACLE CREEK INTERNATIONAL CONSULTING INC. TORONTO – VANCOUVER – SUDBURY–JOHANNESBURG WWW.CARACLECREEK.COM Page | 29 Independent Technical Report: Miller Gold Property Oban Mining Corporation Table 9-1 Miller Gold Property historical drill hole collars (NAD83, Zone 17U) DDH Number Elevation (m) Collar Location (UTM NAD83 Zone 17U) 582870E, 5317811N actual 582869E, 5317859N estimate Dip and Azimuth (º) N-87-3 336 582875E, 5317947N act. N-87-4 327 582874E, 5317994N act. DIP -90 NO AZ DIP -90 NO AZ DIP -90 NO AZ DIP -90 NO AZ N-87-5 332 582852E, 5318023N act. DIP -90 NO AZ N-87-6 333 582810E, 5317804N act. N-87-1 337 N-87-2 N-87-8 582911E, 5317740N est. N-87-9 582955E, 5317742N est. N-87-10 582998E, 5317741N est. N-87-11 583052E, 5317741N est. N-87-14 582790E, 5317857N est. N-87-15 327 582809E, 5317954N act. N-87-16 582846E, 5318056N est. N-87-17 Cotter DDH1 Cotter DDH2 Cotter DDH 3 Cotter DDH 4 582869E, 5317700N est. GW-88-2 582956E, 5317765N est. GW-88-3 583005E, 5317792N est. GW-88-4 583055E 5317794N est. GW-88-5 583119E 5317798N est. DDH 204 MILLER DDH1 DDH N88-3 MILLER DDH2 March 29, 2015 582901E, 5317781N est. 582915E, 5317780N est. 582940E, 5317780N est. 582974E, 5317773N est. 322 582876E 5317744N act. 582816E 5317741N est. 582545E 5317646N est. 582757E 5317600N est. DIP -90 NO AZ DIP -90 NO AZ DIP -90 NO AZ DIP -90 NO AZ DIP -90 NO AZ DIP -90 NO AZ DIP -90 NO AZ DIP -90 NO AZ DIP -90 NO AZ DIP -90 NO AZ DIP -90 NO AZ DIP -90 NO AZ DIP -45 0 AZ DIP -90 NO AZ DIP -90 NO AZ DIP -90 NO AZ DIP -90 NO AZ DIP -90 NO AZ DIP -90 NO AZ DIP -49 315 AZ DIP -90 NO AZ Vein 1 Zone Intercept (feet) 275-286 feet (EOH 329'), Vein#1 int. 83.3m to 86.7m 367-373 feet (EOH 407') 407-425 feet (EOH 425'), Vein#1 int. 123.3m to 128.8m FZ at 343 feet? (EOH 343 feet), Vein #1 not reached 220-224 feet , 282-286 feet (EOH 307'), Vein#1 probably not reached FZ @ 272 feet, 379-382 feet (EOH 407'), Vein#1 int. 114.8m to 115.8m Comments gold mineralization gold mineralization gold mineralization high grade zone high grade zone 161-172 feet (EOH 199') high grade zone 167-175 feet (EOH 189') high grade zone gold mineralization 169-179 feet (EOH 200') no intercept on vein 1 but alteration from 149-235 feet (EOH 235') FZ @ 88 feet, 346' -454'(EOH 454') syenite intercept 312-330 feet, FZ at 310' feet, Vein#1 int. 94.5m to 100m, syenite(EOH 430') FZ intercept 283-308 feet (EOH 308 feet) no zone no zone high grade zone 220-225 feet no zone gold mineralization gold mineralization 206-221 feet high grade zone 217-222 feet zone from 698-712 feet (EOH 730') Vein#1? high grade zone 98-101 feet (EOH 151') 185-196 feet (EOH 250') 237-247 feet (EOH 280') 252-264 feet (EOH 280') 205-209 feet (EOH 260') 180-188 feet (EOH 201') Vein#1 int. 54.5m to 57m 153-160 feet (EOH 166') Fault Zone @ 150' ,intercept from 186-197 feet (EOH 303') 19-24 feet CARACLE CREEK INTERNATIONAL CONSULTING INC. TORONTO – VANCOUVER – SUDBURY–JOHANNESBURG WWW.CARACLECREEK.COM high grade zone high grade zone gold mineralization gold mineralization gold mineralization high grade zone gold mineralization low grade zone gold mineralization Page | 30 Independent Technical Report: Miller Gold Property Oban Mining Corporation MILLER DDH3 582797E 5317675N est. DIP -90 NO AZ 80-85 feet gold mineralization 9.2 Mapping and Sampling Since the acquisition of the property in 2012, a series of a prospecting and sampling programs have been undertaken by Northstar in order to confirm and define the extent of gold mineralization in trenches, exposed adit openings and scattered outcrop exposures. A total of 137 grab, composite grab, and single chip samples were obtained by George Pollock and geological technician Marc Cardinal during the summer of 2012, 327 grab, composite grab and single chip samples during the summer of 2013, and 169 grab and chip samples during the summer of 2014. Analytical results were highly variable and biased by the high grade grab samples as summarized in Table 9-2. Most of the samples were collected from claims 4267276 and 4267277 covering the area of the majority of historic workings in Northeat Pacaud Township on the Property. Table 9-2 Miller Gold Property prospecting surface samples (NAD83, Zone 17U) Year No. of samples Au (g/t) Mean Au (g/t) Median Au (g/t) Mode Au (g/t) Range Comments 2012 137 4.30 0.274 <0.03 <0.03 – 70.2 (39% of the samples below dectection) 2013 328 6.25 0.04 <0.03 <0.01 – 247 (37% of the samples below dectection) 2014 169 1.57 0.07 <0.01 <0.01 – 55.5 (25% of the samples below dectection) It is noted these results are from prospecting surface samples collected over a non-systematic, highly variable spacing throughout the property and thus should not be treated in a “material” representative fashion with respect to the overall grade of the mineralized zone on the surface. They are presented and discussed here in a limited fashion for information only for that reason. In general, higher grade surface samples were reported to be commonly associated with significant visible gold and telluride mineralization associated with quartz veins cutting meta-volcanic and intrusive rocks. In the area where Vein #1 is projected to trend to the surface south of hole MG14-15 and in the vicinity of the Miller-Independence historic workings, sampling of exposed quartz veins has reported high grade Au assays. The quartz veins were found to contain lesser sulphides and tellurides in comparison to those March 29, 2015 CARACLE CREEK INTERNATIONAL CONSULTING INC. TORONTO – VANCOUVER – SUDBURY–JOHANNESBURG WWW.CARACLECREEK.COM Page | 31 Independent Technical Report: Miller Gold Property Oban Mining Corporation observed in the drill core, but host multiple occurrences of visible coarse gold associated with black tourmaline. George Pollock (personal communication) of Northstar notes: “The highest grade surface samples are clustered around the Vein 1, D vein exposures and the contact zone around the Allied Syenite, particularly in vertical E-W trending veins near the eastern syenite contact.” 9.3 Geophysics During 2013, an approximately 11 km ground magnetic survey was completed on a 50 metres spaced north-south cut grid covering the central portion of the Miller property over claims 4267276, 4267277, southeastern part of 4267275 and western part of 4215970 in northeastern Pacaud Township and northwestern Catharine Township. The dominant features identified from the magnetic survey are the main northwest trending lineament defining the Catharine Fault trending through northwestern Catharine Township as well as the general northwestern trend of the geological terrain. During the winter of 2014, Abitibi Geophysics completed an 11.3km ground time domain 3D IP (IPower 3D on five simultaneous lines) chargeability and resistivity survey on the grid. The data values were inverted using computer software calculating three dimensional patterns of resistivity and chargeability of the subsurface that best explain the values recorded at surface. The depth and quality of the survey results are variable and limited by the character of the bedrock, however, plans at 50, 75, and 100 metres depths were provided by the geophysical contractor as shown in Figure 9-1. March 29, 2015 CARACLE CREEK INTERNATIONAL CONSULTING INC. TORONTO – VANCOUVER – SUDBURY–JOHANNESBURG WWW.CARACLECREEK.COM Page | 32 Independent Technical Report: Miller Gold Property Oban Mining Corporation Figure 9-1IPower 3D Survey Plan of the Miller Gold Property It was stated in the final report (Loader 2014): “The #1 quartz vein (Vein #1) correlates well with a resistive layer immediately overlying a highly conductive layer that was detected by the IPower3D® survey. The survey results indicate that this zone extends significantly further than the area known from (historic) drilling”. “The results of the chargeability inversion have also shown that the chargeable mineralization forms bands the stretch across the grid, branching and forking. Previous drilling also located a syenite body (Allied Syenite) on the eastern side of the grid. This appears to be well defined as a high resistivity zone and includes some significant chargeable character. The resistivity anomaly reaches its March 29, 2015 CARACLE CREEK INTERNATIONAL CONSULTING INC. TORONTO – VANCOUVER – SUDBURY–JOHANNESBURG WWW.CARACLECREEK.COM Page | 33 Independent Technical Report: Miller Gold Property Oban Mining Corporation maximum where it intersects the sub-horizontal resistive zone interpreted as the #1 quartz vein (Vein #1).” The Abitibi Geophysics report recommended diamond drilling for 11 distinctive chargeable anomalies, seven of which are associated with the Vein #1 zone. The drill targets chosen in the 2014 program were consistent with these recommendations. The results of this geophysical survey are presented and discussed in their logistics and interpretation report listed in the references. 9.4 Drilling Northstar Gold conducted its diamond drilling in this program in order to: Validate the results of the historical drilling focusing on following up predominately on the results of the 1986-87 Nortek work program on the property and; Test drill targets within chargeability and resistivity anomalies generated from the ground IP survey conducted by the company early in 2014 in advance of the drilling program. The 2014 Northstar Gold diamond drill holes are located on claims 4267277, 4267276, and 4215970 listed in Table 4-1. The drilling program consisted of fifteen (MG14-01 to 15) NQ holes totalling 1,778.5 metres. All the holes were drilled vertically with the exception of holes MG14-04, 06 and 12. The drill holes and their specifications are listed in Table 10-1. As well as collars listed in Table 10-1, a detailed geological plan is given in Figure 9-2 shows both the Northstar Gold and historical drill holes in the area of predominant economic interest on the property. March 29, 2015 CARACLE CREEK INTERNATIONAL CONSULTING INC. TORONTO – VANCOUVER – SUDBURY–JOHANNESBURG WWW.CARACLECREEK.COM Page | 34 Independent Technical Report: Miller Gold Property Oban Mining Corporation Figure 9-2 Drill plan map for 2014 drill program March 29, 2015 CARACLE CREEK INTERNATIONAL CONSULTING INC. TORONTO – VANCOUVER – SUDBURY–JOHANNESBURG WWW.CARACLECREEK.COM Page | 35 Independent Technical Report: Miller Gold Property Oban Mining Corporation 10.0 DRILLING 10.1 Drilling Data and Progress The 2014 Northstar Gold diamond drill holes are located on claims 4267277, 4267276, and 4215970 listed in Table 4-1. The exploration work described in this report is Northstar Gold’s initial (Phase 1) diamond drilling program, consisting of fifteen (MG14-01 to 15) NQ holes totalling 1,778.5 metres. All the holes were drilled vertically with the exception of holes MG14-04, 06 and 12. The drill holes and their specifications are listed in Table 10-1. Forage Asinii of Notre-Dame du Nord was the diamond drilling contractor and the program was supervised in the field by George Pollock while geologists Trevor Boyd and Elizabeth Ronacher from Caracle Creek logged the core and monitored QA/QC for the program. A Reflex down-hole survey was performed at approximately 50 m intervals. The drill casing was kept in the holes. GPS coordinates of all collar locations were recorded and at the end of the drill program all of the holes were surveyed using Trimble DGPS. The overburden depths were between 2 - 5 m. The samples were gathered as NQ core with recoveries of over 95 per cent.The core was logged and stored at Northstar’s secure warehouse at Earlton, Ontario. Table 10-1Miller Gold Property 2014 drill hole collars (NAD83, Zone 17U). Hole ID MG14-01 MG14-02 MG14-03 MG14-04 MG14-05 MG14-06 MG14-07 MG14-08 MG14-09 MG14-10 MG14-11 MG14-12 MG14-13 MG14-14 MG14-15 March 29, 2015 Elevation asl. (m) 337 322 331 336 339 340 323 327 329 327 327 332 324 321 327 Claim # 4267276 4267277 4267276 4215970 4215970 4215970 4267277 4267277 4267277 4267277 4267277 4267277 4267276 4267276 4267276 UTM NAD83 Zone17U Easting 582781 582875 582813 582895 583021 582995 582818 582809 582775 582780 582753 582832 582804 582785 582848 Northing 5317806 5317751 5317977 5317990 5318104 5317867 5318026 5318076 5317979 5318009 5318036 5317969 5317678 5317601 5317592 Dip (deg.) -90 -90 -90 -75 -90 -55 -90 -90 -90 -90 -90 -60 -90 -90 -90 Az dir. (deg.) NA NA NA 012 NA 000 NA NA NA NA NA 000 NA NA NA CARACLE CREEK INTERNATIONAL CONSULTING INC. TORONTO – VANCOUVER – SUDBURY–JOHANNESBURG WWW.CARACLECREEK.COM Length (m) 138 75.5 162 102 81 222 137 87 147 177 186 159 45 30 30 1778.5 Start-End Dates June 4-6/14 June 6-7/14 June 8-9/14 June 9-10/14 June 11-12/14 June 12-14/14 June 18-19/14 June 19-20/14 June 20-21/14 June 21-22/14 June 22-24/14 June 24-25/14 June 25-26/14 June 26-26/14 June 26-26/14 Page | 36 Independent Technical Report: Miller Gold Property Oban Mining Corporation As well as collars listed in Table 9-1 and Table 10-1, a detailed geological plan is given in Figure 9-2 shows both the Northstar Gold and historical drill holes in the area of predominant economic interest on the property. Specifically, during the 2014 program the drilling was clustered in two areas on the map based upon; the area of main Vein #1 zone(s) on claims 4267276 and 4267277 in northeastern Pacaud Township which has been the historical focus for exploration and development on the property and; the area of the Allied Syenite immediately to the north on claim 4367276. In addition, three exploration holes were drilled to the east of the Allied Syenite on claim 4515970 in northwestern Catharine Township which originally was part of the historically named “Perron” claims. During the drill program, a total of 1,111 core samples were obtained from the drilling most of which were one metre in length but ranging from 0.25 to 2.0 metres. All of the samples were analyzed for at least gold of which 51 were also analyzed for multi-elements. The analyzed samples covered approximately 61% of the core obtained from drilling. All the assays highlights listed in Table 10-2. Mineralized Intervals reported are core lengths and true widths at this stage can’t be confidently ascertained. 10.2 Drilling Results The program was successful in confirming the trend of the shallowly dipping Vein #1 Zone in holes MG14-02, 3, 7, 9, 12 and 13. In addition, a bulk tonnage, near surface gold target was discovered within the Allied Syenite with 6 drill holes (MG14-03, 7, 9, 10, 11, 12) intersecting gold zone(s) between 20m and 120m vertical depth within the intrusive body. Drill hole spacing in the vicinity of the Allied Syenite was between 30 -50m for the six holes. Best results of the drilling came from holes MG14-07, 09 and 12.Specific features of interest for each drill hole are detailed as follows: MG14-01 Hole MG14-01 was collared within ten metres adjacent to historic hole 86-6 drilled vertically in order to test for high grade Vein 1 zone mineralization at approximately 115 metres depth. It intersected alternating units of steeply dipping altered mafic volcanic and feldspar quartz porphyry rocks. Best results were a pyritic quartz vein grading 3.3 g/t Au at 3.00 - 3.30 metres over 0.3 metres and pervasively silicified and pyritic rock grading 1.56 g/t Au at 58.15 – 58.65 metres over 0.50 metres down hole. March 29, 2015 CARACLE CREEK INTERNATIONAL CONSULTING INC. TORONTO – VANCOUVER – SUDBURY–JOHANNESBURG WWW.CARACLECREEK.COM Page | 37 Independent Technical Report: Miller Gold Property Oban Mining Corporation MG14-02 Hole MG14-02 was collared within two metres of historic hole 204 drilled vertically in order to test for high grade Vein 1 zone mineralization at approximately 55 metres depth. It intersected mostly altered mafic volcanic rocks hosting the pyritic Vein 1 zone with a high grade assay of 86.6 g/t Au at 49.7 – 50.15 metres over 0.45 metres down hole. Visible tellurides were reported in the core. MG14-03 Hole MG14-03 was collared 20 metres north of historic hole 87-15 drilled vertically to test for high grade Vein 1 zone mineralization at approximately 95 metres depth. It intersected predominantly quartz veined, pyritic, altered syenite grading 0.58 g/t Au at 41.7 – 111.3 metres over 69.6 metres down hole. Distinctive black chlorite grains and jasper veining were observed in the zone in association with the strong silicification and hematization. In addition, visible gold and tellurides were reported in the hole. MG14-04 Hole MG14-04 was collared approximately 80 metres east of MG14-03 and east of the Allied Syenite drilled at 75º angle to the northeast test its extent in that direction. It intersected steeply dipping mafic volcanic rocks with no significant assay results or mineralization noted in the core. MG14-05 Hole MG14-05 was collared approximately 150 metres northeast of MG14-05 drilled vertically as an exploration hole for shallowly dipping quartz vein hosted mineralization. It intersected steeply dipping mafic volcanic rocks with no significant assay results or mineralization noted in the core. MG14-06 Hole MG14-06 was collared approximately 150 metres northeast of MG14-02 and drilled at 55 degree angle to the north to test for both flat and steeply dipping east-west trending quartz veining east of Vein 1 and the Allied Syenite. It intersected predominantly steeply dipping mafic volcanic rocks and a zone of silicified, sulphidic, pervasively altered rock grading 0.94 g/t Au from 171.6 - 177.7 metres over 6.1 metres down hole. Historic vertical veins in the vicinity, named Vein 2 here, report grades of 19.88 g/t Au over 4.1 metres. March 29, 2015 CARACLE CREEK INTERNATIONAL CONSULTING INC. TORONTO – VANCOUVER – SUDBURY–JOHANNESBURG WWW.CARACLECREEK.COM Page | 38 Independent Technical Report: Miller Gold Property Oban Mining Corporation MG14-07 Hole MG14-07was collared approximately 50 metres north of MG14-03 and drilled vertically to test the Allied Syenite in that direction. It intersected predominantly quartz and jasper veined, pyritic, silicified and hematized syenite interspersed with short sections of mafic volcanic and feldspar quartz rocks grading 1.04 g/t Au from 22 – 119.5 metres over 97.5 metres down hole. Samples from the projected depth of the Vein 1 zone reported higher grade results of 3.55 g/t Au from 105.47 to 119.5 metres over 14.03 metres down hole. Nuggety visible gold and tellurides were reported in the core. MG14-08 Hole MG14-08 was collared approximately 50 metres north of MG14-07 and drilled vertically to test the extent of the Allied Syenite in that direction. It intersected predominantly mafic volcanic rocks with best assay of 1.11 g/t Au from 10.0 – 11.0 metres down hole. MG14-09 Hole MG14-09 was collared approximately 40m to the west of MG14-03and drilled vertically to test the extent of the Allied Syenite in that direction. It intersected predominantly syenite cut by numerous narrow mostly flat quartz veins but with significantly less silicification and chloritization in comparison to that found in holes MG14-03 and 07. However despite the less alteration, occurrences of visible coarse nuggety gold and tellurides hosted directly in the syenite were noted in the drill core associated with grains of black chlorite particularly after being sawed for sampling as shown in Figure 10-1. The mineralized zone in the hole was outlined grading 0.89 g/t from 44 – 107 metres over 63 metres down hole. Samples from the projected depth of the Vein 1 zone reported higher grade results of 1.99 g/t Au from 88.95 to 107.0 metres over 18.05 metres down hole. March 29, 2015 CARACLE CREEK INTERNATIONAL CONSULTING INC. TORONTO – VANCOUVER – SUDBURY–JOHANNESBURG WWW.CARACLECREEK.COM Page | 39 Independent Technical Report: Miller Gold Property Oban Mining Corporation Figure 10-1 Drill hole MG14-09, NQ cut core containing visible coarse gold with black chlorite grains directly hosted in syenite, sample 14149 assayed 10.7g/t Au/1.0 metre. MG14-10 Drill hole MG14-10 was collared 30m north of hole MG14-09 and drilled vertically to test the extent of the Allied Syenite towards its centre. It intersected predominantly syenite similarly altered as MG14-09 but with lesser visible gold and tellurides reported. The mineralized zone graded 0.60 g/t Au from 41 – 109 metres over 68 metres down hole. March 29, 2015 CARACLE CREEK INTERNATIONAL CONSULTING INC. TORONTO – VANCOUVER – SUDBURY–JOHANNESBURG WWW.CARACLECREEK.COM Page | 40 Independent Technical Report: Miller Gold Property Oban Mining Corporation MG14-11 Hole MG14-11 was collared approximately 40 metres northwest of hole MG14-10 and drilled vertically in what appears to be the centre of the Allied Syenite body. The vertical hole intersected quartz veined, pyritic and altered syenite similar to that found in hole MG14-07 and the mineralized zone returned assays grading 0.72 g/t Au at 43.5 – 95 metres over 51.5 metres down hole. MG14-12 Drill hole MG14-12 was collared approximately 20 metres east of hole MG14-03 drilled at 60 degrees towards the north. The hole crossed the eastern side of the Allied Syente east of holes MG14-03 and 07 and intersected silicified and hematized, quartz and jasper veined, pyritic syenite and mafic volcanic and feldspar quartz porphyry rocks. Tellurides and nuggety visible gold were reported in all three rock units, and the mineralized zone returned assays grading 0.99 g/t Au at 54 – 156 metres over 102 metres down hole encompassing all the units. Samples from the believed Vein 1 zone reported high grade results of 11.62 g/t Au from 138.05 to 142.0 metres over 3.95 metres down hole. MG14-13 Hole MG14-13 was collared approximately 120 metres south of hole MG14-01 drilled vertically to test for Vein 1 zone mineralization. It intersected a zone of flat quartz veining hosted within mafic volcanic rocks grading 1.90 g/t Au from 21.9 – 24 metres over 2.1 metres down hole. MG14-14 Hole MG14-14 was collared approximately 80 metres south of hole MG14-13 drilled vertically to define at depth a shallow, north dipping, quartz veined surface showing which had returned an average grade of 10.7 g/t Au over an area 2 metres wide and 25 metres along the strike of the veining located 80 metres to the SW. Tellurides and visible gold had been noted at the surface showing. An intersection of quartz veining was encountered in the hole containing tellurides and possible visible gold grading 8.34 g/t Au from 3.0 – 4.0 metres depth likely from the Vein 1 zone. March 29, 2015 CARACLE CREEK INTERNATIONAL CONSULTING INC. TORONTO – VANCOUVER – SUDBURY–JOHANNESBURG WWW.CARACLECREEK.COM Page | 41 Independent Technical Report: Miller Gold Property Oban Mining Corporation MG14-15 Hole MG14-15 was collared approximately 60 metres east of hole MG14-15 and 60 metres directly north of the aforementioned surface showing drilled vertically to test the showing at depth further to the east. The hole intersected quartz veining in mafic volcanic rocks returning 0.47 g/t Au from 5.5 – 6.0 metres depth. The highlights of the results for the drilling are summarized in Table 10-2as follows: Table 10-2 Miller Gold Property 2014 assay highlights table. Hole ID From (m) To(m) Core Length(m) Au (g/t) MG14-01 3.0 3.3 0.3 3.30 and 58.15 58.65 0.5 1.56 MG14-02 49.7 57.65 7.95 5.26 including MG14-03 including including Including MG14-06 MG14-07 including including MG14-08 MG14-09 including including MG14-10 Including including MG14-11 and Including Including Including and MG14-12 Including Including including including MG14-13 MG14-14 MG14-15 49.7 41.7 41.7 41.7 110.0 171.6 22.0 105.47 112.43 10.0 44.0 75.0 88.95 41.0 46.0 76.5 20.0 43.5 43.5 79.0 92.0 110.0 54.0 54.0 78.0 113.0 138.05 21.9 3.0 5.5 50.15 111.3 62.0 42.0 111.3 177.7 119.5 119.5 114.25 11.0 107.0 107.0 107.0 109.0 52.0 87.0 21.0 95.0 49.5 81.0 95.0 111.0 156.0 56.0 82.0 156.0 142.0 24.0 4.0 6.0 0.45 69.6 20.3 0.3 1.3 6.1 97.5 14.03 1.82 1.0 63.0 32.0 18.05 68.0 6.0 10.5 1.0 51.5 6.0 2.0 3.0 1.0 102.0 2.0 4.0 43.0 3.95 2.1 1.0 0.5 86.6 0.58 1.27 36.2 1.21 0.94 1.04 3.55 11.3 1.11 0.88 1.27 1.99 0.60 2.43 1.18 8.20 0.70 2.29 3.60 1.47 7.42 0.99 4.47 2.59 1.70 11.6 1.90 8.34 0.47 March 29, 2015 Comments within 10m of historic hole 86-6 Vein #1 zone Within 2m of historic hole 204 Vein #1 zone-C shaft Allied Syenite Vein #1 zone 20m north of Historic hole 86-15 E-W? trending zone Allied Syenite Vein #1 zone Allied Syenite Vein #1 zone Allied Syenite Allied Syenite Vein #1 zone Allied Syenite Vein #1 zone Vein #1 zone-C shaft Vein #1 zone-C shaft Vein #1 zone-C shaft CARACLE CREEK INTERNATIONAL CONSULTING INC. TORONTO – VANCOUVER – SUDBURY–JOHANNESBURG WWW.CARACLECREEK.COM Page | 42 Independent Technical Report: Miller Gold Property Oban Mining Corporation In summary, gold mineralization in the Vein #1 zone is characterized by widely distributed coarse native gold and gold tellurides hosted by quartz veins, disseminated pyrite, intense chlorite alteration and rare chalcopyrite stringers. Fine gold is associated with heavy disseminated pyrite mineralization. Diamond drilling confirmed the presence of Vein #1 hosting potentially economic grades of gold mineralization in the area of the Miller–Independence historic mine workings at shallow depths. The program also showed Vein #1 dips shallowly to the north towards the Allied Syenite where the vein system may widen and become incorporated into the Allied Syenite as multiple sub-horizontal narrow veins in a fingering manner suggestive of a genetic relationship in the gold mineralization. Gold is very widely distributed throughout Allied Syenite from 20 to 120 metres vertical depth with the majority of samples showing anomalous results. Gold mineralization in the intrusive is commonly associated with intense silicification, hematization, pyritization, black chlorite, and quartz and jasper veining of the syenite but is also found in spatially associated mafic volcanicand feldspar porphyry rocks, and within parts of the syenite exhibiting apparent lesser alteration such as within hole MG14-09. Within these less altered host rocks the gold mineralization, however, still appears to be associated with distinctive speckled grains of black chlorite of likely iron rich composition and secondary origin.Based upon whole rock analyses of core samples obtained from hole MH14-09 during this program, the intrusive is classified as a sodicsyenite or albitite. At this early stage of exploration, the orientation of the mineralized zone is not well defined and sample lengths do not reflect the true lengths or widths of the mineralized zone. 11.0 SAMPLE PREPARATION, ANALYSES AND SECURITY 11.1 Sample Security The drill core was placed in wooden core trays at the drill site, labelled with the hole ID and box number and transported to the core logging facility in Earlton, Ontario. At the core logging facility, the core boxes were labelled with aluminum tag indicating the hole number and the core interval stored in each box. The core is stored in core racks inside the core logging facility or staked in its yard. The core storage facility is locked and the property is fenced with a locked gate. March 29, 2015 CARACLE CREEK INTERNATIONAL CONSULTING INC. TORONTO – VANCOUVER – SUDBURY–JOHANNESBURG WWW.CARACLECREEK.COM Page | 43 Independent Technical Report: Miller Gold Property Oban Mining Corporation 11.2 Sample Preparation During this program, Northstar Gold implemented an industry standard QA/QC program under the supervision of Trevor Boyd and Elisabeth Ronacher of Caracle Creek International Consulting Inc. that includes insertion of blanks, blind commercial standards and duplicate quarter core samples in order to ensure best practice in sampling and analysis. During the logging the NQ drill core was laid out on racks at Northstar’s Earlton warehouse facility with the technician Marc Cardinal measuring recoveries and RQD and taking photographs while the geologist described the core. The geologist then assessed the intervals of mineralization for sampling and placed sample tags accordingly. The core was then ready for cutting. Core recoveries were over 95 per cent. The selected drill core samples ranged from 0.25 to 2.0 metres in length, but mostly were one metre. The samples were prepared from core cut in half using a diamond saw, sealed in secure packages with a sample tag, and shipped by either company personnel or bonded carrier to either the Swastika Laboratories facility in Kirkland Lake, Ontario or the Activation Laboratories accredited facility (ISO/IEC 17025:2005) in Ancaster, Ontario for preparation and analysis. One tag was left remaining in the core box stapled at the beginning of each sample interval for future reference. Once the samples arrived in the laboratory, as a routine practice with rock and core at both facilities, the entire sample was crushed up to 90% passing 2 mm, mechanically split (250gms) and then pulverized to 95% passing 150 mesh (105 microns).The prepared sample pulps were analyzed by fire assay for gold on a 30 gram split with either AAS or ICP Finish, and in some cases by either 45 multi-element analysis with Aqua Regia Digest and ICP-OAS and ICP-MS method finishes or by 35 elements using Instrumental Neutron Activation Analysis (INAA) at Activation Laboratories. Samples at both laboratories reporting greater than 3 g/t gold were check assayed by fire assay with a gravimetric finish. Selected samples were analyzed using the metallic screen technique by Activation Laboratories. The metallic screen procedure involves the collection of a 500g or 1000g split, which is taken and sieved at 100 mesh; the entire +100 mesh fraction is fired and two 30g samples collected from the -100 mesh are fired in duplicate. Both Swastika Laboratories and Activation Laboratories fulfill standard quality assurance/quality control protocols. In greater detail, the following is a discussion of how the sample preparation and analytical procedures changed during the program.Initially, during the program 355 drill core samples were sent to Swastika March 29, 2015 CARACLE CREEK INTERNATIONAL CONSULTING INC. TORONTO – VANCOUVER – SUDBURY–JOHANNESBURG WWW.CARACLECREEK.COM Page | 44 Independent Technical Report: Miller Gold Property Oban Mining Corporation Laboratories for gold analysis by fire assay. Based upon the discovery of telluride minerals in the core it was believed that the assays were significantly under-reporting the amount of gold in the core. Selected sample rejects and pulps were sent to Activation Laboratories for check analyses by fire assay with ICP finish, INAA, and fire assay metallic screen analysis. It was discovered during the sample preparation at the Activation Laboratories facility that the Swastika preparation of its samples was inadequate, allowing only approximately 50% of sample through 2 mm, much lower than the minimum acceptable level of 80%. The result was the reporting of significantly less representative and more erratic gold from the Swastika facility which was supported by the results from selected samples being analyzed using metallic screen methodology at the Activations Laboratories facility, although this was not a consistent pattern. INAA successfully detected all the gold in sample aliquot but the reporting of meaningful results was hampered by a failed internal standard and its small sample aliquot size (<25 gm) per analysis in samples commonly weighing 3-4 kg in size and possessing a heterogeneous distribution of gold and telluride grains. Based upon these findings, the remaining 756 core samples were analyzed by fire assay with ICP finish at Activation Laboratories. In summary, 84 and 24 samples also underwent metallic screen and INAA analyses, respectively. Generally, the metallic screen analytical results were considered more credible than standard fire assay methods because it analysed more the sample material, and in cases of samples undergoing multiple analyses, they were chosen as the accepted value despite, in many cases, the results being lower than those obtained from the standard fire assay techniques. In the author’s opinion, the sample preparation, security and analytical procedures follow industry standards and are suitable for the purpose of identifying mineralization in drill core. 12.0 DATA VERIFICATION 12.1 Caracle Creek Site Visits The Property has been visited by independent Caracle Creek geologists twice in the past year. The first visit was conducted by Trevor Boyd and Elisabeth Ronacher, both "independent qualified persons" in accordance with National Instrument 43-101, from June 2 – 27, 2014 to log and sample the drill core, inspect the drill, conduct independent surface sampling at the Property and monitor the QA/QC during the drill program. The second visit was conducted by Trevor Boyd on March 27, 2015 with the purpose of March 29, 2015 CARACLE CREEK INTERNATIONAL CONSULTING INC. TORONTO – VANCOUVER – SUDBURY–JOHANNESBURG WWW.CARACLECREEK.COM Page | 45 Independent Technical Report: Miller Gold Property Oban Mining Corporation checking locations of claim posts using GPS focusing on the newly staked claims in January, 2015 and choosing independent drill core samples to be analyzed at a third laboratory. During the period of the first site visit, Trevor Boyd, collected a series of check samples from two main re-discovered surface exposures of visible gold mineralization overlying the area of where Vein #1 is projected to trend towards the surface in the vicinity of drill holes MG14-14 and 15. The first area (Area 1) was covered by six composite grab samples consisting of mixed quartz vein and wall rock material over an exposed mineralized zone approximately 2 metres wide and 25 metres long cut-off along strike by swamp and overburden. The six samples totalling 51.5 kg returned a weight averaged grade of 10.7 g/t Au. The second area (Area 2) of mixed quartz veins and wallrock was covered by five composite grab samples totalling 40 kg over an approximate 20 by 2 metre mineralized exposure adjacent to a historic adit portal and returned a weight averaged grade of 4.2 g/t Au. The results are tabulated in Table 12-1. Table 12-1 Miller Gold Property 2014 assay highlights table(NAD83, Zone 17U). Assays g/t Au Sample # Outcrop Easting Northing Rock Description 29558 yes 582821 5317545 6.27 Area 1. TB-M-01 29559 yes 582823 5317541 1.23 Area 1 TB-M-02 29560 yes 582828 5317541 4.32 Area 1 TB-M-03 29561 yes 582834 5317540 5.44 Area 1 TB-M-04 29562 yes 582837 5317536 44.5 Area 1 TB-M-05 29563 Weight Avg. yes 582852 5317531 1.26 Area 1 TB-M-06 29564 yes 582667 5317534 29565 yes 582672 29566 yes 582675 29567 yes 29568 Weight Avg. yes 10.7 0.29 Area 2 TB-M-07 5317543 1.03 Area 2. TB-M-08 5317543 17.52 Area 2. TB-M-09 582685 5317546 0.54 Area 2. TB-M-10 582699 5317545 4.16 Area 2. TB-M-11 4.2 Sample #29561 in Area 1 weighing nine kilograms and assaying 44.5 g/t Au is from the same approximate location which is reported to be previously sampled by Northstar in 2013 in which a 30 kg sample was submitted for metallurgical testing and assayed 51.1 g/t Au (Section 13.0). March 29, 2015 CARACLE CREEK INTERNATIONAL CONSULTING INC. TORONTO – VANCOUVER – SUDBURY–JOHANNESBURG WWW.CARACLECREEK.COM Page | 46 Independent Technical Report: Miller Gold Property Oban Mining Corporation During the second site visit, access to the Property was made by 4-wheel truck and snow-tracked ATV whereupon property claim posts were located by GPS cords and photographed as shown in Figure 12-1. An attempt was made to reach bedrock but due to the thickness of the snow cover at this time of the year this was not successful. Figure 12-1 Claim Post #1 (NE corner) of claim 4275152 (0582537E, 5319103N, NAD83, Zone 17U) In addition, during the second trip Northstar’s secured core storage facility in Earlton was visited (Figures 12-2 and 12-3) in which eight quarter core samples from the 2014 drill program plus a gold standard and blank were chosen, bagged, and submitted to the AGAT Laboratories preparation facility in Sudbury. March 29, 2015 CARACLE CREEK INTERNATIONAL CONSULTING INC. TORONTO – VANCOUVER – SUDBURY–JOHANNESBURG WWW.CARACLECREEK.COM Page | 47 Independent Technical Report: Miller Gold Property Oban Mining Corporation Figure 12-2Northstar locked core storage warehouse and gate, Earlton, Ontario. Figure 12-3Drill core racks for logging and sampling inside storage warehouse The submitted samples were prepared by crush to 90% passing 2mm, split to 250 gm and pulverize to 85% passing 75um. The laboratory was notified of the possible presence of tellurides and nuggety nature of the gold distribution within the samples. March 29, 2015 The samples were analyzed for gold at the AGAT CARACLE CREEK INTERNATIONAL CONSULTING INC. TORONTO – VANCOUVER – SUDBURY–JOHANNESBURG WWW.CARACLECREEK.COM Page | 48 Independent Technical Report: Miller Gold Property Oban Mining Corporation Laboratories facility at Mississauga by method code 202-552, Au by fire assay, ICP-OES Finish, 50g with a range 0.001 – 10 ppm. Table 12-2 Miller Gold Property 2015 site visit core samples. Original From Hole ID To (m) Sample# Sample # (m) 1058051 13548 MG14-01 58.15 58.65 1058052 13649 MG14-03 32 33 1058053 13987 MG14-07 118.6 119.5 1058054 14135 MG14-09 94 95 1058055 14326 MG14-10 106.5 107.5 1058056 14474 MG14-11 68 69 1058057 14686 MG14-12 122 123 1058058 14728 MG14-13 23.5 24 1058059 na na 1058060 na na Te (g/t) 3.65 1.51 2.07 22.2 1.85 0.97 1.01 6.98 0.28 Au (g/t) 0.892 0.234 0.748 4.59 0.279 0.203 0.705 4.72 2.05 0.14 0.012 Comments, original accepted assays (g/t) 1.56 2.95 10.1 1.65 1.14 2.92 0.882 1.95 CDN-GS-2K gold standard 1.97 +-0.18 (2 std. devs.) Limestone gravel blank Despite the high variability of the analytical results in comparison to the original sample assays, they are generally positive in context of the nuggety character of the gold mineralization. 12.2 Quality Control During the drill program Northstar submitted with the core samples a total of 130 blind gold standard samples and coarse granite or marble blanks at an average rate of one standard and one blank for every 17 samples. A summary of the blanks and standards is given in Table 12-3. March 29, 2015 CARACLE CREEK INTERNATIONAL CONSULTING INC. TORONTO – VANCOUVER – SUDBURY–JOHANNESBURG WWW.CARACLECREEK.COM Page | 49 Independent Technical Report: Miller Gold Property Oban Mining Corporation Table 12-32014 Drill program blanks and standards QC Sample crushed granite blank crushed granite blank crushed marble blank Oreas 204 Oreas 204 Oreas 19a Oreas 19a CDN-ME-16 CDN-GS-2K CDN-GS-10D Element Units Certified Value 1 Standard Deviation Drill Holes Lab Au g/t <0.01 N/A MG-14-01, 02, 03, 06 Swastika Au ppb <5 N/A MG-14-07, 08 Actlabs Au ppb <5 N/A MG-14-09, 10, 11, 12, 13 Actlabs Au Au Au Au Au Ag Cu Pb Zn Au Au ppm ppm ppm ppm g/t g/t % % % g/t g/t MG-14-01, 02, 03, 05, 06 MG-14-07, 09, 10, 11 MG-14-01, 03, 06 MG-14-07, 08, 09, 10, 11 MG-14-11, 12 Swastika Actlabs Swastika Actlabs Actlabs MG-14-11, 12 MG-14-03, 12, 15 Actlabs Actlabs 1.043 1.043 5.49 5.49 1.48 30.8 0.671 0.879 0.807 1.97 9.50 0.039 0.039 0.10 0.10 0.14 2.2 0.036 0.040 0.040 0.18 0.56 12.2.1 Blanks A total of 27 crushed granite blank samples were inserted into the sample stream with the 2014 drill program (Figure 12-2). A total of 17 crushed granite blank samples were sent to Swastika with drill core from MG-14-01 to 06. Swastika analyzed the samples for Au using fire assay with an ICP finish. All of the granite blanks submitted to Swastika passed. All of the granite blank assays were less than three times the detection limit of 10 ppb (0.01 ppm). A total of 10 crushed granite blank samples were sent to Actlabs with drill core from MG-14-07 and 08. Actlabs analyzed the samples for Au using fire assay with an AA finish. All of the granite blanks submitted to Actlabs passed. All of the granite blank assays were less than three times the detection limit of 5 ppb (0.005 ppm). March 29, 2015 CARACLE CREEK INTERNATIONAL CONSULTING INC. TORONTO – VANCOUVER – SUDBURY–JOHANNESBURG WWW.CARACLECREEK.COM Page | 50 Independent Technical Report: Miller Gold Property Oban Mining Corporation Figure 12-2 Control chart for Au analyses of granite blank by A) Swastika and B) Actlabs. March 29, 2015 CARACLE CREEK INTERNATIONAL CONSULTING INC. TORONTO – VANCOUVER – SUDBURY–JOHANNESBURG WWW.CARACLECREEK.COM Page | 51 Independent Technical Report: Miller Gold Property Oban Mining Corporation A total of 38 crushed marble blank were sent to Actlabs with drill core from MG-14-09 to 13. Actlabs analyzed the samples for Au using fire assay with an AA finish. Only one analyses of the marble blank failed (sample 14430, MG-14-11) for a failure rate of 2.6%. Figure 12-3Control chart for Au analyses of marble blank by Actlabs. Overall, the quality of the analyses from the crushed granite and marble blanks from both labs is excellent. 12.2.2 Standards A total of five different gold standards were used during the drill program because due to the considerable sampling of the core, the two main standards, Oreas 204 and Oreas 19a, were used up.The certified values of all these standards are summarized in Table 12-3. A total of 8 analyses of low grade standard Oreas 204 with a certified value of 1.043 g/t Au were inserted into the sample stream with drill holes MG-14-01, 02, 03, 05 and 06 and submitted to Swastika. All of the standards passed. March 29, 2015 CARACLE CREEK INTERNATIONAL CONSULTING INC. TORONTO – VANCOUVER – SUDBURY–JOHANNESBURG WWW.CARACLECREEK.COM Page | 52 Independent Technical Report: Miller Gold Property Oban Mining Corporation Figure 12-4 Control chart for Au standard Oreas 204 analyzed by Swastika. A total of 15 analyses of low grade standard Oreas 204 with a certified value of 1.043 g/t Au were inserted into the sample stream with drill holes MG-14-07, 09, 10 and 11 and submitted to Actlabs (Figure 12-5). All of the standards passed, but there is a minor bias low as the majority of the analyses are below the certified value. Sample 14280 from drill hole MG-14-10 was originally labeled as Oreas 204 with < 5 ppb Au but it is actually drill core. Sample 14281 was originally labeled as drill core with 1.01 g/t Au but it is actually Oreas 204. The sample numbers were likely switched in the lab, as the standards were bagged and the sample tags were removed from the sample tag book in the core shack before any drill core was cut. March 29, 2015 CARACLE CREEK INTERNATIONAL CONSULTING INC. TORONTO – VANCOUVER – SUDBURY–JOHANNESBURG WWW.CARACLECREEK.COM Page | 53 Independent Technical Report: Miller Gold Property Oban Mining Corporation Figure 12-5 Control chart for Au standard Oreas 204 analyzed by Actlabs. A total of 7 analyses of high grade Oreas 19a with a certified value of 5.49 g/t Au were inserted into the sample stream with drill holes MG-14-01, 03 and 06 and submitted to Swastika (Figure 12-6). All of the standards passed, but they are slightly bias high as all of the analyses are above the certified value. March 29, 2015 CARACLE CREEK INTERNATIONAL CONSULTING INC. TORONTO – VANCOUVER – SUDBURY–JOHANNESBURG WWW.CARACLECREEK.COM Page | 54 Independent Technical Report: Miller Gold Property Oban Mining Corporation Figure 12-6 Control chart for Au standard Oreas 19a analyzed by Swastika. A total of 16 analyses of high grade Oreas 19a with a certified value of 5.49 g/t Au were inserted into the sample stream with drill holes MG-14-07, 09, 10 and 11 and submitted to Actlabs (Figure 12-7). All of the standards passed, but they are slightly bias high as several of the analyses are above the certified value. Sample 14420 from drill hole MG-14-11 originally was labelled as Oreas 19a, but it had 13 ppb Au and is actually drill core. Sample 14419 was originally labelled as drill core, but it Oreas 19a with 5.7 g/t Au. The sample numbers were likely switched in the lab, as the standards were bagged and the sample tags were removed from the sample tag book in the core shack before any drill core was cut. March 29, 2015 CARACLE CREEK INTERNATIONAL CONSULTING INC. TORONTO – VANCOUVER – SUDBURY–JOHANNESBURG WWW.CARACLECREEK.COM Page | 55 Independent Technical Report: Miller Gold Property Oban Mining Corporation Figure 12-7Control chart for Au standard Oreas 19a analyzed byActlabs A total of 6 analyses of low grade standard CDN-ME-16 with a certified value of 1.48 g/t Au were inserted into the sample stream with drill holes MG-14-11 and 12 and submitted to Actlabs (Figure 12-8). All of the standards passed. March 29, 2015 CARACLE CREEK INTERNATIONAL CONSULTING INC. TORONTO – VANCOUVER – SUDBURY–JOHANNESBURG WWW.CARACLECREEK.COM Page | 56 Independent Technical Report: Miller Gold Property Oban Mining Corporation Figure 12-8 Control chart for Au standard CDN-ME-16 analyzed by Actlabs. A total of 2 analyses of medium grade standard CDN-GS-2K with a certified value of 1.97 g/t Au were inserted into the sample stream with drill holes MG-14-11 and 12 and submitted to Actlabs (Figure 12-9). Both of the standards passed. March 29, 2015 CARACLE CREEK INTERNATIONAL CONSULTING INC. TORONTO – VANCOUVER – SUDBURY–JOHANNESBURG WWW.CARACLECREEK.COM Page | 57 Independent Technical Report: Miller Gold Property Oban Mining Corporation Figure 12-9 Control chart for Au standard CDN-GS-2K analyzed by Actlabs. A total of 7 CDN-GS-10D high grade standard samples with a certified value of 9.50 g/t Au were inserted into the sample stream with drill holes MG-14-03, 12 and 15 and submitted to Actlabs (Figure 12-10). All of the standards passed. March 29, 2015 CARACLE CREEK INTERNATIONAL CONSULTING INC. TORONTO – VANCOUVER – SUDBURY–JOHANNESBURG WWW.CARACLECREEK.COM Page | 58 Independent Technical Report: Miller Gold Property Oban Mining Corporation Figure 12-10 Control chart for Au standard CDN-GS-10D analyzed by Actlabs. None of the analyses of the five standards sent to two labs failed. The quality of the analyses is excellent for both labs. 12.2.3 Core Duplicates A total of 20 core duplicates from drill holes MG-14-01 to MG-14-06 were analyzed by fire assay by Swastika. All of the core duplicates passed, as the majority of them were low grade samples <0.20 g/t Au (Figure 12-11). One high grade core duplicate pair (samples 13693 and 13694, MG-14-03) had 4.3 g/t Au and 4.02 g/t Au which are similar. March 29, 2015 CARACLE CREEK INTERNATIONAL CONSULTING INC. TORONTO – VANCOUVER – SUDBURY–JOHANNESBURG WWW.CARACLECREEK.COM Page | 59 Independent Technical Report: Miller Gold Property Oban Mining Corporation Figure 12-11 Control chart for core duplicates analyzed for Au by Swastika by fire assay. March 29, 2015 CARACLE CREEK INTERNATIONAL CONSULTING INC. TORONTO – VANCOUVER – SUDBURY–JOHANNESBURG WWW.CARACLECREEK.COM Page | 60 Independent Technical Report: Miller Gold Property Oban Mining Corporation A total of 41 core duplicates from drill holes MG-14-07 to 15 were analyzed by fire assay by Actlabs. A total of 8 of the 41 core duplicates failed for a failure rate of 19.5% (Figure 12-13). This is a high failure rate, but note the failed duplicates had one sample with > 0.2 g/t Au. The core duplicates that passed had one or both samples with < 0.2 g/t Au. It appears that the high failure rate for core duplicates is more likely due to the nugget effect at higher grades than an issue with the analytical method. March 29, 2015 CARACLE CREEK INTERNATIONAL CONSULTING INC. TORONTO – VANCOUVER – SUDBURY–JOHANNESBURG WWW.CARACLECREEK.COM Page | 61 Independent Technical Report: Miller Gold Property Oban Mining Corporation Figure 12-12 Control chart for core duplicates analyzed by Au by Actlabs by fire assay. March 29, 2015 CARACLE CREEK INTERNATIONAL CONSULTING INC. TORONTO – VANCOUVER – SUDBURY–JOHANNESBURG WWW.CARACLECREEK.COM Page | 62 Independent Technical Report: Miller Gold Property Oban Mining Corporation Six core duplicate pairs from drill holes MG-14-03, 09, 11 and 12 were analyzed for Au by Actlabs by metallic screen. The total Au value was plotted for the primary vs. secondary samples and most of the samples do not plot along the ideal 1:1 regression line. For three samples, the difference between the primary and secondary samples is significant due to the heterogeneous distribution of Au in the drill core. Figure 12-13 Control chart for core duplicates analyzed for Au by Actlabs by metallic screen. A plot of the fine fraction vs. the coarse fraction of the same core duplicate samples analyzed by Actlabs by metallic screen show that for the low grade samples the fine and coarse fraction give a similar result, but for high grade samples > 3 g/t Au the coarse fraction is significantly higher grade than the fine fraction. This is further evidence of the gold nugget effect in the drill core. For example, sample 14624 from MG-14-12 from 54.0 to 55.0 m has an average of 7.135 g/t Au in the fine fraction and 231 g/t Au in the coarse fraction for a total gold value of 12.2 g/t. Sample 14143 from MG-14-09 from 101.0 to 102.0 m has an average of 14.35 g/t Au in the fine fraction and 214 g/t Au in the coarse fraction for a total gold value of 24.9 g/t Au. Sample 14443 from MG-14-11 from 43.5 to 44.50 m has an average of 10.155 g/t March 29, 2015 CARACLE CREEK INTERNATIONAL CONSULTING INC. TORONTO – VANCOUVER – SUDBURY–JOHANNESBURG WWW.CARACLECREEK.COM Page | 63 Independent Technical Report: Miller Gold Property Oban Mining Corporation Au in the fine fraction and 74.3 g/t Au in the coarse fraction for a total gold value of 12.7 g/t Au. The relationship between sample length and true thickness of the mineralization is not yet known. Figure 12-14 Plot of the average of the fine fraction vs. the coarse fraction for the metallic screen samples. 12.2.4 Summary The author’s opinion is that the quality control review of the results the analyses of the standards, blanks and core duplicates that the results from the 2014 drill program are of good quality and adequate for the purpose of identifying mineralization at depth in drill core. Core duplicates indicate that the coarse-grain size of the gold in both its native and telluride forms results a strong nugget effect for the assays. March 29, 2015 CARACLE CREEK INTERNATIONAL CONSULTING INC. TORONTO – VANCOUVER – SUDBURY–JOHANNESBURG WWW.CARACLECREEK.COM Page | 64 Independent Technical Report: Miller Gold Property Oban Mining Corporation 13.0 MINERAL PROCESSING AND METALLURGICAL TESTING 13.1 Gravity Recoverable Gold Testing To confirm historic and current high grade results from the area, an approximately 15 tonne bulk sample from two main exposures (Areas 1 and 2 in Section 12.1) was collected in late 2013 for processing. The sample material is presently stored at Northstar’s secured warehouse facility to be processed at a local mill pending permission from the Ontario Ministry of Northern Development and Mines once the Property is taken to mining lease. A 30 kg sample obtained from Area 2 with quartz veining hosting visible gold was submitted by Northstar for gravity recoverable gold (GRG) bench testing in September 2013 at the Activation Laboratories Ltd. Metallurgy Department using a Knelson Concentrator in a gold recovery circuit (Steyn 2013). The sample graded 51.1 g/t Au with a 94.2% gold recovery using gravity concentration and the final tails from the test had 2.93 g/t of gold remaining. Two gold recovery tests were also conducted by SMC (Canada) Ltd. with inconclusive results. 13.2 Mineralogical Testing Two drill core samples from MG-14-09 were submitted to Actlabs for modal mineralogy late in 2014: Sample 14143 from 101.0 to 102.0 m with 24.9 g/t Au determined by metallic screen Sample 14149 from 106.0 to 107.0 m with 10.7 g/t Au determined by metallic screen Both samples were logged as being syenite with intense chlorite alteration with disseminated pyrite. One polished section from each sample was prepared for analysis with carbon coating (Bindi, 2014).The polished sections were analyzed for modal mineralogy on a Quanta 600F scanning electron microscope (SEM). By a combination of image analysis employing atomic number contrast imaging (from backscattered electron – or BSE- signal intensity) and Energy Dispersive Spectrometry (EDS) using Bruker 5010 SDD detectors, minerals and other attributes are directly measured on the MLA. BSE signal intensity is proportional to the mean atomic number of minerals. The Field Emission Gun was used at an accelerating voltage of 20 kV and a spot size of 5 and a working distance of 12.5 mm. March 29, 2015 CARACLE CREEK INTERNATIONAL CONSULTING INC. TORONTO – VANCOUVER – SUDBURY–JOHANNESBURG WWW.CARACLECREEK.COM Page | 65 Independent Technical Report: Miller Gold Property Oban Mining Corporation The modal mineralogy of the entire samples confirmed the logged lithology of syenite (high albite, low quartz and K-feldspar content) and the presence of strong chlorite alteration and disseminated pyrite (Table 13-1). Four gold grains were identified in sample 14149 which were both liberated and locked, ranging in size from 5-75 μm and associated with tsumoite (BiTe). The gold grains were Au-Ag alloys of variable composition. Table 13-1 Table of modal mineralogy for samples from MG-14-09 Client ID 14143 14149 Mineral (wt%) Gold Gold 0.00 <0.01 Telluride Tsumoite <0.01 0.00 Sulphide Pyrite 1.04 0.62 Mica and Clay Biotite 0.53 0.61 Chlorite 7.93 10.22 Quartz 0.50 0.13 K-feldspar 0.12 0.13 Albite 87.07 84.65 Plagioclase 1.39 1.27 Epidote 0.05 0.19 Amphibole 0.28 0.27 Zircon 0.03 0.11 Titanite 0.54 1.18 Rutile 0.03 0.01 Fe Oxy/hydroxide <0.01 0.05 Other Silicates Oxides and Carbonates Calcite 0.11 0.26 Phosphates Apatite 0.07 0.05 Others 0.30 0.26 Total 100 100 14.0 MINERAL RESOURCE ESTIMATES No mineral resources have been estimated on the Miller Property. March 29, 2015 CARACLE CREEK INTERNATIONAL CONSULTING INC. TORONTO – VANCOUVER – SUDBURY–JOHANNESBURG WWW.CARACLECREEK.COM Page | 66 Independent Technical Report: Miller Gold Property Oban Mining Corporation 15.0 ADJACENT PROPERTIES The Property is surrounded by mineral claims belonging to Orefinders Resources Inc. bounding on its north side in Boston and McElroy townships, Barry-Hollinger Gold Mines Ltd. to the immediate northwest in Boston Township, and Les Entreprises Ogima Inc. bounding on the south side in Pacaud and Catherine townships. The Barry-Hollinger Gold Mines claims with patent land holdings cover the closed Barry Hollinger Mine which has reported a production of 77,000 ounces of gold from 267,741 tons intermittently from 1918 to 1946 (website: kirklandlakeplaque.ca/). In general, patent land holdings are scattered throughout the area, the most significant being the 160 acre Searles Patented holding in Lot 12, Con 6 of Catherine Township bounding to the immediate southeast of the main Property workings. This holding is included in the discussion of the 1987 Miller-Independence exploration work report (French 1988). The Qualified Person has been unable to verify this information and the information on adjacent properties is not necessarily indicative of the mineralization on the property that is subject of this Report. 16.0 OTHER RELEVANT DATA AND INFORMATION No additional information or explanation is necessary to make this technical report more understandable. 17.0 INTERPRETATION AND CONCLUSIONS The diamond drilling results for the historically known Vein #1 zone in holes MG14-02, MG14-03, MG14-07, MG14-09 and MG14-12 suggest this mineralized zone extends to the north, incorporates into the Allied Syenite, and then remains open continuing further along plunge to the north. Further to the south this vein system trends up dip to shallow depths and appears in places to become exposed on the surface about 30 and 60 metres south of hole MG14-15, but the auriferous veining here is scattered and difficult to delineate. This may be because of the tree cover and paucity of detailed surface exploration and sampling on the property for the past 80 years. March 29, 2015 CARACLE CREEK INTERNATIONAL CONSULTING INC. TORONTO – VANCOUVER – SUDBURY–JOHANNESBURG WWW.CARACLECREEK.COM Page | 67 Independent Technical Report: Miller Gold Property Oban Mining Corporation North of hole MG14-01, the demonstration of the relationship of the gold mineralization between Vein #1 and the Allied Syenite, and the knowledge that the intrusive is part of a continuous arc of alkaline magmatism that extends for 3,000 metres to the north suggests that the gold potential for the property is more extensive and economically attractive than historically believed. In general, the exploration of the Miller Property has been conducted in accordance with 43-101 protocols with no material errors in procedures or significant deficiencies in the integrity of the results. The results from the 2014 drill program are of good quality and adequate for the purpose of their utilization in any subsequent resource estimations. It is cautioned that the gold distribution in the mineralized zones is highly variable due to its nuggety character and often coarse texture. It is the opinion of the authors of this report that the work completed to-date by Northstar has returned sufficient positive results to justify an enlarged follow-up exploration program consisting mostly of diamond drilling with the purpose of defining a 43-101 compliant geological resource. RECOMMENDATIONS 18.0 Based upon these results, the following recommendations for further work on the Miller Property are proposed: It is recommended that a focused 5,000 metre program of vertical definition diamond drilling of the Allied Syenite and associated Vein #1 be completed with the purpose of defining the overall size of the gold resource. The program would cover the area especially to the north, west and south of holes MG14-03, MG14-07 and MG14-09 where the mineralized system appears to be laterally open. Follow-up drilling is also needed among the area of holes MG14-02, MG14-03 and historical hole N87-6, and west from the vicinity of hole MG14-06 towards Vein 1 and the Allied Syenite. Ground IP chargeability and resistivity surveying followed by approximately 2,000 metres of reconnaissance drilling in the vicinity of the Planet Syenite is also recommended as a top priority in order to test and follow up on historically reported gold mineralized bodies and to define additional intrusive hosted mineralized zones. March 29, 2015 CARACLE CREEK INTERNATIONAL CONSULTING INC. TORONTO – VANCOUVER – SUDBURY–JOHANNESBURG WWW.CARACLECREEK.COM Page | 68 Independent Technical Report: Miller Gold Property Oban Mining Corporation Systematic stripping, shallow drilling, surface chip sampling and bulk sampling is needed south of drill hole MG14-01. Specifically, a program of vertical definition drilling, consisting of approximately 1,000 metres made up of short holes (<50 metres depth) is recommended southwest of drill hole MG14-02 and north of the believed surface exposures (Areas 1 and 2 in Section 12.1) of Vein #1 (south of the B shaft), focusing on the vicinity of holes MG14-13, 14 and 15. The goal would be to define a shallow potentially open pit gold resource additive to the main intrusive hosted mineralized body to the north. Due to the coarse nuggety nature of the gold mineralization, attention should be paid to ensuring the accuracy of the analytical results particularly in the sample preparation by crushing samples to at least 90% passing 2mm, split to 250 gm and pulverize to 85% passing 75um. There is some question as to the optimum size of analysis (30 vs. 50 gm aliquots) with respect to gold losses and sample representation which should be discussed with the laboratory conducting the analyses prior to program commencement. It is recommended that during the next drill program specific gravity measurements be completed on every tenth sample chosen for analysis. It is recommended that sample weights be recorded on assay certificates for all samples sent in for analysis. 18.1 Proposed Budget Table 18-1 contains the recommended exploration budget for the Miller Property. Table 18-1.Recommended exploration budget. Item Amount Diamond drilling (including mob/demob and all drilling costs) Technical and supervisory support (management, two geologists and technician) Geochemical analyses Stripping and trenching (operator and equipment) Surface sampling and mapping Vehicle(s), travel, accommodation, meals and misc. supplies and costs Total March 29, 2015 Units $ Rate Per Unit $ Cost 8,000 metres 60 metre 480,000 400 5,000 person days samples 500 20 person day sample 200,000 100,000 200 100 hours person days 150 500 hour person day 30,000 50,000 CARACLE CREEK INTERNATIONAL CONSULTING INC. TORONTO – VANCOUVER – SUDBURY–JOHANNESBURG WWW.CARACLECREEK.COM 60,000 920,000 Page | 69 Independent Technical Report: Miller Gold Property Oban Mining Corporation Recommendations for follow-up exploration and development depend upon the results of this program but would likely predominantly entail additional definition drilling. Eventually, selected central drilling area claims on the Property should be applied and taken to Mining Lease. This will require that a legal perimeter boundary survey be completed, required by the Ministry of Northern Development and Mines in order to facilitate the processing of the 15 tonne bulk sample collected to-date from the property as discussed in Section 13.0. Depending upon the size of the bulk sample collected, this work is pending the need to first define a mineral resource and create a closure plan for the Property with the compliance with Ontario Government regulations. March 29, 2015 CARACLE CREEK INTERNATIONAL CONSULTING INC. TORONTO – VANCOUVER – SUDBURY–JOHANNESBURG WWW.CARACLECREEK.COM Page | 70 Independent Technical Report: Miller Gold Property Oban Mining Corporation 19.0 REFERENCES Ayer, J.A., Berger, B.R., Hall, L.A.F., Houle, M.G., Johns, G.W., Josey, S., Madin, Z., Rainsford, D. Trowell, N.F., and Vaillancourt, C., 2005. Geological compilation of the central Abitibi greenstone belt: Kapuskasing Structural Zone to the Quebec border; Ontario Geological Survey, Preliminary Map P. 3565, scale 1:250,000. Bindi, R. (2014): Northstar Gold Final Report A14-04604, prepared by ActlabsGeometallurgy – MLA Dept. for Northstar Gold. Clark, G.R., 2013, Review of Resources and Reserves of Macassa Mine Kirkland, Ontario. Technical Report filed on SEDAR for Kirkland Lake Gold Inc. by Glenn R. Clark & Associates Ltd., June 24, 2013, 82p. French, G.B., 1988, Mining and Geological Report on the 1987 Nortek Exploration Program, Unpublished report for Nortek Minerals Ltd. March 25, 1988, Larder Lake Mining Divsion. Ispolatov, V., Lafrance, B., Dubé, B., Hamilton, M. and Creaser, R. 2005. Geology, structure,and gold mineralization, Kirkland Lake and Larder Lake areas (Gauthier and Teck townships): Discover Abitibi Initiative; Ontario Geological Survey, Open File Report 6159,170p. Jackson, S.L., 1994, The Precambrian Geology of Pacaud and Catharine Townships and Portions of Adjacent Townships, District of Timiskaming, Ontario. Ontario Geological Survey, Open File Report 5884, 86p. Loader, T., 2014, Northstar Gold Corp., Resistivity/Induced Polarization Survey, IPpwer3D configuration & Ground Magnetic Interpretation Miller Gold Project, Catharine &Pacaud Townships, Ontario, Canada. Private Logistics and Advanced Interpretation Report, April, 2014. Massore Mining Syndicate Limited, 1941, Planet Gold Mines Limited properties corporate news release, Toronto, June 1, 1941. Mckenzie, J., 2009, Assessment Work Report for Lakeshore Gold Corp., Field work Program on the Shoebox (Perron) Property within Catharine Township. Larder Lake Mining District, May 21, 2009. March 29, 2015 CARACLE CREEK INTERNATIONAL CONSULTING INC. TORONTO – VANCOUVER – SUDBURY–JOHANNESBURG WWW.CARACLECREEK.COM Page | 71 Independent Technical Report: Miller Gold Property Oban Mining Corporation Seeber, Q.A., 1982, Report of Work for 398737 Ontario Limited on Planet Gold Prospect, Boston Township – Kirkland Lake Area Ontario. Larder Lake Mining Districk, August 18, 1982. Smirle, R., 2013, Northstar Gold Corp. Recovery results and procedure, unpublished report by SMC (Canada) Ltd. requested by George Pollock, Northstar Gold Corp. November 19, 2013, 5p. Steyn, J., 2013, Gravity Recoverable Gold Report (A13-11612), unpublished report by Activation Laboratories Ltd. prepared for George Pollock of North Star Gold Corp., October 11, 2013, 3p. March 29, 2015 CARACLE CREEK INTERNATIONAL CONSULTING INC. TORONTO – VANCOUVER – SUDBURY–JOHANNESBURG WWW.CARACLECREEK.COM Page | 72 Independent Technical Report: Miller Gold Property Oban Mining Corporation Appendix 1 – Certificates of Qualified Persons March 29, 2015 CARACLE CREEK INTERNATIONAL CONSULTING INC. TORONTO – VANCOUVER – SUDBURY–JOHANNESBURG WWW.CARACLECREEK.COM Page | 74

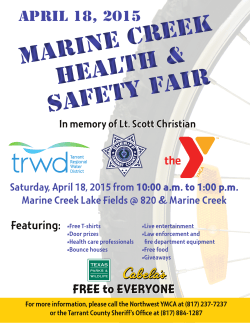


© Copyright 2026