
Introduction to Econometrics - San Francisco State University
Introduction to Econometrics
Michael Bar1
April 30, 2015
1 San
Francisco State University, department of economics.
ii
Contents
1 Preliminaries
1.1 Probability Spaces . . . . . . . . . . . . . . . .
1.2 Random Variables . . . . . . . . . . . . . . . . .
1.3 Random Vectors . . . . . . . . . . . . . . . . .
1.3.1 Marginal pdf . . . . . . . . . . . . . . .
1.3.2 Conditional pdf . . . . . . . . . . . . . .
1.3.3 Independence of random variables . . . .
1.4 Moments . . . . . . . . . . . . . . . . . . . . . .
1.4.1 Expected value . . . . . . . . . . . . . .
1.4.2 Variance and standard deviation . . . . .
1.4.3 Covariance and correlation . . . . . . . .
1.5 Normal Distribution and Its Relatives . . . . . .
1.5.1 Normal distribution . . . . . . . . . . . .
1.5.2 Chi-square distribution . . . . . . . . . .
1.5.3 t-distribution . . . . . . . . . . . . . . .
1.5.4 F-distribution . . . . . . . . . . . . . . .
1.6 Sampling and Estimators . . . . . . . . . . . . .
1.6.1 Unbiased estimators . . . . . . . . . . .
1.6.2 E¢ cient estimators . . . . . . . . . . . .
1.6.3 Con‡icts between bias and low variance .
1.6.4 Consistent estimators . . . . . . . . . . .
1.6.5 Distribution of estimators . . . . . . . .
2 Simple Regression Analysis
2.1 Deriving the OLS Estimators . . . . . . .
2.2 Graphical Illustration of OLS . . . . . . .
2.3 Interpretation of Estimated Regression . .
2.4 Results About the Estimated Model . . . .
2.5 Goodness of Fit: R2 . . . . . . . . . . . .
2.6 Impact of Changes in Units . . . . . . . .
2.6.1 Multiplying the data by constant .
2.6.2 Adding a constant to the data . . .
2.6.3 Multiplying by constant and adding
2.7 Restricted Models . . . . . . . . . . . . . .
2.7.1 Model with no intercept, 1 = 0 . .
iii
.
.
.
.
.
.
.
.
a
.
.
.
.
.
.
.
.
.
.
.
.
.
.
.
.
.
.
.
.
.
.
.
.
.
.
.
.
.
.
.
.
.
.
.
.
.
.
.
.
.
.
.
.
.
.
.
.
.
.
.
.
.
.
.
.
.
.
.
.
.
.
.
.
.
.
.
.
.
.
.
.
.
.
.
.
.
.
.
.
.
.
.
.
.
.
.
.
.
.
.
.
.
.
.
.
.
.
.
.
.
.
.
.
.
.
.
.
.
.
.
.
.
.
.
.
.
.
.
.
.
.
.
.
.
.
.
.
.
.
.
.
.
.
.
.
.
.
.
.
.
.
.
.
.
.
.
.
.
. . . . . . . . .
. . . . . . . . .
. . . . . . . . .
. . . . . . . . .
. . . . . . . . .
. . . . . . . . .
. . . . . . . . .
. . . . . . . . .
constant to the
. . . . . . . . .
. . . . . . . . .
.
.
.
.
.
.
.
.
.
.
.
.
.
.
.
.
.
.
.
.
.
.
.
.
.
.
.
.
.
.
.
.
.
.
.
.
.
.
.
.
.
.
.
.
.
.
.
.
.
.
.
.
.
.
.
.
.
.
.
.
.
.
.
.
.
.
.
.
.
.
.
.
.
.
.
.
.
.
.
.
.
.
.
.
.
.
.
.
.
.
.
.
.
.
.
.
.
.
.
.
.
.
.
.
.
.
.
.
.
.
.
.
.
.
.
.
.
.
.
.
.
.
.
.
.
.
.
.
.
.
.
.
.
.
.
.
.
.
.
.
.
.
.
.
.
.
.
1
1
3
6
7
8
9
10
10
13
18
23
24
28
29
31
31
33
35
36
38
40
. . .
. . .
. . .
. . .
. . .
. . .
. . .
. . .
data
. . .
. . .
.
.
.
.
.
.
.
.
.
.
.
.
.
.
.
.
.
.
.
.
.
.
.
.
.
.
.
.
.
.
.
.
.
.
.
.
.
.
.
.
.
.
.
.
.
.
.
.
.
.
.
.
.
.
.
.
.
.
.
.
.
.
.
.
.
.
41
42
44
45
45
46
47
48
48
48
49
49
.
.
.
.
.
.
.
.
.
.
.
.
.
.
.
.
.
.
.
.
.
.
.
.
.
.
.
.
.
.
.
.
.
.
.
.
.
.
.
.
.
.
iv
CONTENTS
2.7.2
Model with no slope,
2
=0 . . . . . . . . . . . . . . . . . . . . . . .
3 Properties of Regression Coe¢ cients and Hypothesis Testing
3.1 Assumptions . . . . . . . . . . . . . . . . . . . . . . . . . . . . .
3.2 Mean and Variance of OLS Estimators . . . . . . . . . . . . . .
3.2.1 Rewriting The OLS Estimators . . . . . . . . . . . . . .
3.2.2 Unbiasedness of OLS estimators . . . . . . . . . . . . . .
3.2.3 E¢ ciency of OLS estimators . . . . . . . . . . . . . . . .
3.2.4 Consistency of OLS estimators . . . . . . . . . . . . . . .
3.3 General Idea of Statistical Hypothesis Tests . . . . . . . . . . .
3.4 Hypothesis Testing of Regression Coe¢ cients . . . . . . . . . . .
3.4.1 Formulating hypotheses about the regression coe¢ cients
3.4.2 Deriving the t-test for regression coe¢ cients . . . . . . .
3.4.3 Performing the t-test . . . . . . . . . . . . . . . . . . . .
4 Multiple Regression Analysis
4.1 OLS Estimators . . . . . . . . . . . . . . . .
4.1.1 Deriving the OLS estimators . . . . .
4.1.2 Properties of OLS estimators . . . .
4.1.3 Interpretation of regression estimates
4.2 Hypothesis Testing . . . . . . . . . . . . . .
4.2.1 t-tests . . . . . . . . . . . . . . . . .
4.2.2 p-value . . . . . . . . . . . . . . . . .
4.2.3 Con…dence intervals . . . . . . . . .
4.2.4 Goodness of …t: R2 and F-tests . . .
4.3 Multicollinearity . . . . . . . . . . . . . . .
.
.
.
.
.
.
.
.
.
.
.
.
.
.
.
.
.
.
.
.
.
.
.
.
.
.
.
.
.
.
.
.
.
.
.
.
.
.
.
.
.
.
.
.
.
.
.
.
.
.
.
.
.
.
.
.
.
.
.
.
.
.
.
.
.
.
50
.
.
.
.
.
.
.
.
.
.
.
51
51
52
53
54
55
61
61
66
66
67
70
.
.
.
.
.
.
.
.
.
.
.
.
.
.
.
.
.
.
.
.
.
.
.
.
.
.
.
.
.
.
.
.
.
.
.
.
.
.
.
.
.
.
.
.
.
.
.
.
.
.
.
.
.
.
.
.
.
.
.
.
.
.
.
.
.
.
.
.
.
.
.
.
.
.
.
.
.
.
.
.
.
.
.
.
.
.
.
.
.
.
.
.
.
.
.
.
.
.
.
.
.
.
.
.
.
.
.
.
.
.
.
.
.
.
.
.
.
.
.
.
.
.
.
.
.
.
.
.
.
.
.
.
.
.
.
.
.
.
.
.
.
.
.
.
.
.
.
.
.
.
.
.
.
.
.
.
.
.
.
.
73
73
73
75
75
77
77
77
80
81
83
5 Transformations of Variables and Nonlinearities
5.1 Non-linearity in Variables . . . . . . . . . . . . .
5.2 Nonlinearity in Variables and Parameters . . . . .
5.3 Models with Logarithmic Terms . . . . . . . . . .
5.3.1 Log-log model . . . . . . . . . . . . . . . .
5.3.2 Log-lin model . . . . . . . . . . . . . . . .
5.3.3 Lin-log model . . . . . . . . . . . . . . . .
5.3.4 Lin-lin model . . . . . . . . . . . . . . . .
5.3.5 Summary of models with log forms . . . .
5.4 Estimating Elasticity in General Models . . . . .
5.5 Quadratic Form . . . . . . . . . . . . . . . . . . .
.
.
.
.
.
.
.
.
.
.
.
.
.
.
.
.
.
.
.
.
.
.
.
.
.
.
.
.
.
.
.
.
.
.
.
.
.
.
.
.
.
.
.
.
.
.
.
.
.
.
.
.
.
.
.
.
.
.
.
.
.
.
.
.
.
.
.
.
.
.
.
.
.
.
.
.
.
.
.
.
.
.
.
.
.
.
.
.
.
.
.
.
.
.
.
.
.
.
.
.
.
.
.
.
.
.
.
.
.
.
.
.
.
.
.
.
.
.
.
.
.
.
.
.
.
.
.
.
.
.
.
.
.
.
.
.
.
.
.
.
.
.
.
.
.
.
.
.
.
.
89
89
90
91
91
92
93
93
94
94
94
.
.
.
.
.
97
97
98
99
100
101
.
.
.
.
.
.
.
.
.
.
.
.
.
.
.
.
.
.
.
.
6 Dummy Variables
6.1 Using Dummies to Represent Qualitative Variables
6.2 Dummy Variables in Regression Analysis . . . . . .
6.2.1 One dummy variable . . . . . . . . . . . . .
6.2.2 Several dummy variables . . . . . . . . . . .
6.2.3 Interaction between two dummy variables .
.
.
.
.
.
.
.
.
.
.
.
.
.
.
.
.
.
.
.
.
.
.
.
.
.
.
.
.
.
.
.
.
.
.
.
.
.
.
.
.
.
.
.
.
.
.
.
.
.
.
.
.
.
.
.
.
.
.
.
.
.
.
.
.
.
CONTENTS
v
6.2.4
6.2.5
Interaction between a dummy and a quantitative variable . . . . . . . 102
Dummy variables in log-lin model . . . . . . . . . . . . . . . . . . . . 102
7 Speci…cation of Regression Models
7.1 Omitted Variable Bias . . . . . . .
7.1.1 Two variable model . . . . .
7.1.2 General k-variable model . .
7.2 Inclusion of Irrelevant Variable . . .
7.3 Proxy Variables . . . . . . . . . . .
7.4 Steps of Applied Research . . . . .
.
.
.
.
.
.
.
.
.
.
.
.
.
.
.
.
.
.
.
.
.
.
.
.
.
.
.
.
.
.
.
.
.
.
.
.
.
.
.
.
.
.
.
.
.
.
.
.
.
.
.
.
.
.
.
.
.
.
.
.
.
.
.
.
.
.
.
.
.
.
.
.
.
.
.
.
.
.
.
.
.
.
.
.
.
.
.
.
.
.
.
.
.
.
.
.
.
.
.
.
.
.
105
106
106
107
108
109
109
8 Heteroscedasticity
8.1 Illustrating Heteroscedasticity . . . . . . . . . .
8.2 Consequences of Heteroscedasticity . . . . . . .
8.3 Detection of Heteroscedasticity . . . . . . . . .
8.3.1 Eyeballing (plotting the residuals) . . . .
8.3.2 The Goldfeld-Quand test . . . . . . . . .
8.3.3 The White test . . . . . . . . . . . . . .
8.4 Remedies for Heteroscedasticity . . . . . . . . .
8.4.1 Heteroscedasticity-robust standard errors
8.4.2 Weighted least squares (WLS) . . . . . .
.
.
.
.
.
.
.
.
.
.
.
.
.
.
.
.
.
.
.
.
.
.
.
.
.
.
.
.
.
.
.
.
.
.
.
.
.
.
.
.
.
.
.
.
.
.
.
.
.
.
.
.
.
.
.
.
.
.
.
.
.
.
.
.
.
.
.
.
.
.
.
.
.
.
.
.
.
.
.
.
.
.
.
.
.
.
.
.
.
.
.
.
.
.
.
.
.
.
.
.
.
.
.
.
.
.
.
.
.
.
.
.
.
.
.
.
.
.
.
.
.
.
.
.
.
.
.
.
.
.
.
.
.
.
.
.
.
.
.
.
.
.
.
.
111
111
112
112
112
114
115
116
116
116
.
.
.
.
.
.
.
.
.
.
.
.
.
.
.
.
.
.
.
.
.
.
.
.
.
.
.
.
.
.
.
.
.
.
.
.
9 Discrete Choice Models
119
9.1 The Probit . . . . . . . . . . . . . . . . . . . . . . . . . . . . . . . . . . . . . 121
9.2 Logit Model . . . . . . . . . . . . . . . . . . . . . . . . . . . . . . . . . . . . 122
9.3 Estimation of the Probit and Logit Models . . . . . . . . . . . . . . . . . . . 122
10 Time Series
125
10.1 Regression with Time Series Data . . . . . . . . . . . . . . . . . . . . . . . . 126
10.1.1 Autocorrelation (serial correlation) . . . . . . . . . . . . . . . . . . . 127
10.1.2 Trends . . . . . . . . . . . . . . . . . . . . . . . . . . . . . . . . . . . 128
vi
CONTENTS
Chapter 1
Preliminaries
In this chapter we review some basic concepts in probability and statistics. This chapter is
not a substitute for an introductory course in statistics, such as ECON 311. My goal here is
to review some key concepts for those who are already familiar with them, but might need
a speedy refresher.
1.1
Probability Spaces
The most fundamental concept in probability theory is a random experiment.
De…nition 1 A random experiment is an experiment whose outcome cannot be predicted
with certainty, before the experiment is run.
For example, a coin ‡ip, tossing a die, getting married, getting a college degree, investing
in …nancial asset, are all random experiments. Although we cannot predict with certainty the
exact outcome of a coin ‡ip, but we know that it can be either "heads" or "tails". Similarly,
in a toss of a die we know that the outcome is one of the following: f1; 2; 3; 4; 5; 6g.
De…nition 2 A sample space,
random experiment.
, is the set of all possible (and distinct) outcomes of a
Thus, the sample space for the random experiment of a coin ‡ip is = f"heads", "tails"g,
and the sample space of the random experiment of a die toss is = f1; 2; 3; 4; 5; 6g. It is
less clear what is the sample space for the random experiments of getting married or getting
a college degree. In the …rst, one can look at the number of kids as an outcome, or the
duration the marriage will last. In the second, one can look at the types of jobs the person
gets, his wage, etc.
As another example, what is the sample space of ‡ipping two coins? Let heads and tails
be denoted by H and T. Then the sample space is
= fHH, HT, TH, TTg, that is, the
sample space consists of 4 outcomes.
Exercise 1 Write the sample space of ‡ipping 3 coins.
Exercise 2 Write the sample space of tossing two dice.
1
2
CHAPTER 1. PRELIMINARIES
Sometimes we don’t care about all the particular outcomes of an experiment, but only
about groups of outcomes. For example, consider the random experiment of taking a course.
The set of all possible numerical grades is = f0; 1; :::; 100g. However, if a letter grade of
"A" is assigned to all grades of 92 and above, then we might be particularly interested in
the subset of which gives an "A": f92; 93; :::; 100g.
De…nition 3 An event is a subset of the sample space, denoted A
.
In the previous example of a grade in a course, we can de…ne an event A = f92; 93; :::; 100g.
If one of the outcomes in A occurs, we say that event A occurred. Notice that A
, which
reads "A is a subset of ". As another example, suppose that a student fails a course if his
grade is below 60. We can de…ne an event F = f0; 1; :::; 59g. Again, if one of the outcomes
in F occurs, we say that event F occurred.
Exercise 3 Let the random experiment be ‡ipping two coins, and E be the event in which
the two coins have identical outcomes. List the outcomes in E.
Exercise 4 Let the random experiment be a toss of a die, and O be the event in which the
outcome is odd. List the outcomes in O.
Finally, we would like to calculate the probability of an event. Intuitively, probability
of an event is the "chance" that an event will happen. The precise de…nition of probability
is beyond the scope of this course.
De…nition 4 The probability of a random event denotes the relative frequency of occurrence of an experiment’s outcomes in that event, when repeating the experiment many times.
For example, in a toss of a balanced coin, if we repeat the experiment many times, we
expect to get "heads" half of the time, and "tails" half of the time. We then say that "the
probability of heads is 1=2 and the probability of tails is also 1=2". Similarly, in tossing a
balanced die, we expect each of the outcomes to occur with probability 1=6. Let the event
E denote an even outcome in a toss of a die. Thus, E = f2; 4; 6g. What is the probability of
E? Intuitively, the probability of this event is the sum of the probabilities of each outcome,
i.e. P (E) = 61 + 61 + 16 = 12 . In general, the probability of event E is calculated by adding
up the probabilities of the outcomes in E.
It should be obvious that P ( ) = 1 from the de…nition of the sample space. Since the
sample space contains all possible outcomes of a random experiment, the probability that
some outcome will occur is 1. It should also be obvious that probability of any event must
be between 0 and 1, and your instructors will be very alarmed if you calculate negative
probabilities or probabilities that are greater than 1.
In the examples of a coin ‡ip and a toss of a die, each distinct outcome occurs with
equal probability. This need not always be the case. Consider the experiment of picking a person at random and recording his education. The sample space can be for example
f"no school", "less-than-high school", "high school", "college degree", "MA", "Ph.D."g. Obviously P ("high school") is much higher that P ("MA").
1.2. RANDOM VARIABLES
1.2
3
Random Variables
Notice that some random experiments have numerical outcomes (e.g. as a toss of a die) while
others have outcomes that we described verbally (e.g. "heads" and "tails in a ‡ip of a coin,
or education level of a person, "high school", "college degree",...). Calculating probabilities
and performing statistical analysis becomes much simpler if we could describe all outcomes
in terms of numbers.
De…nition 5 A random variable is a function which assigns a real number to each outcome in the sample space. Formally, X : ! R is the notation of a function (named X),
which maps the sample space into the real numbers R.
From the above de…nition, note that if X is a random variable and g ( ) is some real valued
function, then g (X) is another random variable. It is conventional to use capital letters to
denote the random variable’s name, and small case letters to denote particular realizations
of the random variable. For example, we had seen that the sample space of ‡ipping two coins
is = fHH, HT, TH, TTg. One can de…ne a random variable X, which counts the number
of times that "heads" is observed. The possible values of X (called the support of X) are
x 2 f0; 1; 2g. We can then calculate the probabilities P (X = 0), P (X = 1) and P (X = 2),
in other words we can …nd the distribution of the random variable X.
Exercise 5 Calculate the probabilty distribution of the random variable X, which counts the
number of "heads" in a two coin ‡ip. That is, …nd P (X = 0), P (X = 1) and P (X = 2).
As another example, consider the random experiment to be a course with 20 students,
with the relevant outcomes being success or failure. Suppose that I want to calculate the
probability that all students pass the course, or that 1 student fails and 19 pass, or that
2 students fail and 18 pass, etc. I can de…ne a random variable X to be the number of
students who fail the course. Thus, the possible values of X are f0; 1; 2; :::; 20g. If I know
from previous experience that with probability p a student fails my course, we can calculate
the distribution of X. Roughly speaking, we can calculate P (X = 0), P (X = 1),...,
P (X = 20).
De…nition 6 A discrete random variable is one that has a …nite or countable number
of possible values.
De…nition 7 A continuous random variable is one that has a continuum of possible
values.
The distribution of a random variable is usually described by its probability density
function (pdf). The probability density function for a discrete random variable assigns
probabilities to each value of the random variable:1
f (x) = P (X = x)
1
The pdf of a discrete random variable is often called the probability mass function.
4
CHAPTER 1. PRELIMINARIES
Here X is the name of the random variable, and x is one possible realization. Another
popular notation for discrete pdf is
pi = P (X = xi )
where the outcomes of X are indexed by i (i.e., the list of outcomes is x1 ; x2 ; :::; xn , and
generic outcome is xi , i = 1; 2; :::; n).
The probability density function of a continuous random variable can be used to calculate
the probability that the random variable gets values in a given interval [a; b], by integrating
the pdf over that interval:
Z b
f (x) dx = P (a X b)
a
For example, the random variable that counts the number of failing students, among 20
who take the course, is an example of a discrete random variable. It has 21 possible values
(the support is x 2 f0; 1; 2; :::; 20g) and a binomial distribution. We write X Bin (n; p)
to indicate that there are n students, each fails with probability p. If there are 20 students
and p = 5%, we write X Bin (20; 0:05). In case you are curious, the pdf of X is
f (x) = P (X = x) =
n x
p (1
x
p)n
x
where
n
x
=
n!
x! (n x)!
The next …gure illustrates the pdf of Bin (20; 0:05):
Notice that high number of failures is very unlikely, which is a good news.
Exercise 6 Suppose that 20 students enroll in a course, and their instructor knows from
experience that each of them fails with probability 0:05. Calculate the probability that exactly
7 students fail the course.
1.2. RANDOM VARIABLES
5
An example of a continuous random variable is the continuous uniform distribution.
If X U [a; b], we say that X has a uniform distribution on the interval [a; b]. The probability
density function of X is f (x) = b 1 a 8x 2 [a; b], and f (x) = 0 otherwise. Thus, the support
of this random variable is x 2 [a; b]. The next …gure plots the pdf of a continuous uniform
distribution.
Suppose that we have two numbers, g; h, such that a
g
h
b. The probability that
X 2 [g; h] is
Z h
1
h g
P (g X h) =
dx =
a
b a
g b
In other words, the probability that a continuous uniform random variable falls within some
interval [g; h] is equal to the relative length of that interval to the support.
In general, when the pdf of a random variable is given, the support of that random
variable is the set of all the values for which the pdf is positive. Written mathematically,
support (X) = fxjf (x) > 0g
which reads "the support of X is the set of values x such that the pdf is positive". This
is the same as saying that the support of X is the set of all possible values of X, because
values for which the pdf is zero are not possible.
It should be obvious that sum (in discrete case) or integral2 (in continuous case) of all the
values of a probability density function is 1. This has to be true, because a random variable
assigns a number to any outcome in the sample space, and since P ( ) = 1, the probability
of the random variable getting some number is also 1. Formally,
X
X
pi = 1
[X is discrete] :
f (x) = 1, or
[X is continuous] :
Zx 1
i
f (x) dx = 1
1
In fact, any function which integrates (or sums) to 1 and is nonnegative (never attains
negative values) is a probability density function of some random variable.
2
Mathematicians
often don’t even bother using the word sum, because integral is also a sum. The integral
R
symbol, , comes from an elongated letter s, standing for summa (Latin for "sum" or "total").
6
CHAPTER 1. PRELIMINARIES
De…nition 8 The cumulative distribution function (cdf) of a random variable X gives
the probability that the value is less than or equal to some x:
F (x) = P (X
x)
Calculation of the cdf follows from the de…nitions of the pdf:
X
[X is discrete] : F (x) =
f (t)
t x
x
[X is continuous] : F (x) =
Z
f (t) dt
1
The complementary probability is given by the survival function S (x) = 1
is the probability that a random variable X attains a value greater than x.
F (x). This
Exercise 7 Suppose that X is a continuous uniform random variable, with support [0; 1].
Find the probability F (0:12) = P (X 0:12).
Exercise 8 Suppose that X is a continuous uniform random variable, with support [0; 1].
Find the probability S (0:97) = P (X > 0:97).
Exercise 9 Suppose that X is a continuous uniform random variable, with support [a; b].
Find the critical value h such that P (X h) = 0:05.
Exercise 10 Suppose that X is a continuous uniform random variable, with support [a; b].
Find the critical value g such that P (X g) = 0:05.
Exercise 11 Suppose that X has exponential distribution, denoted X
i.e. the pdf is:
e x x 0
f (x) =
0
x<0
EXP ( ),
> 0,
(a). Prove that the above function is indeed a probability density function.
(b). Calculate the critical value x such that P (X x ) = 0:05.
1.3
Random Vectors
Often in economics, we want to explore several random variables at the same time, i.e.
jointly. For example, suppose that we choose people at random and look at how their
education and wages are distributed together. Letting X denote the years of education
and Y denote hourly wage, we can describe the joint distribution of X and Y with a joint
probability density function (joint pdf). If X and Y are discrete, their joint pdf is
f (x; y) = P (X = x; Y = y)
If X and Y are continuous, the probability that X 2 [a; b] and Y 2 [c; d] is
Z dZ b
P (a X b; c Y
d) =
f (x; y) dxdy
c
a
1.3. RANDOM VECTORS
7
Obviously this discussion can be generalized to any number of random variables, say X1 ; :::; Xn ,
with joint pdf f (x1 ; :::; xn ). For example, when the unit of observation is a randomly chosen household, we might be interested in the joint distribution of number of people in the
household, their genders, their incomes, their education levels, their work experience, their
age, their race, health, etc.
The joint pdfs must also integrate (or sum) to 1, just as in the single random variable,
because we know with certainty that X and Y will attain some values. Formally,
XX
[X and Y are discrete] :
f (x; y) = 1
y
[X and Y are continuous] :
Z
x
1
1
Z
1
f (x; y) dxdy = 1
1
Again, the above can be generalized to joint pdf of any number of random variables.
1.3.1
Marginal pdf
In relation to the joint pdf f (x; y), the functions f (x) and f (y) are called marginal or
(individual) probability density functions. The marginal pdfs are obtained by
[X and Y are discrete] :
[X and Y are continuous] :
P
f (x) = y f (x; y)
P
f (y) = x f (x; y)
R1
f (x) = R 1 f (x; y) dy
1
f (y) = 1 f (x; y) dx
(1.1)
(1.2)
Intuitively, X can attain a given value of x when Y attains the value y1 or y2 or any other
possible value. Thus, to get P (X = x) we need to sum (integrate) over all these cases of Y
getting any of its possible values.
A point of caution is needed here. The marginal densities of X and Y do not need to be
the same functions. Some texts are using the notations fX (x) and fY (y) to make it clear in
equations (1.1) and (1.2) that the marginal pdfs are in general not the same function; X has
pdf fX and Y has pdf fY . These notes follow other texts, which give up some mathematical
precision in favor of ease of notation3 .
For example, suppose that I am looking at the joint distribution of gender, X, attaining
the value of 1 for female and 0 for male, and GPA, Y , attaining values fy1 ; :::; yn g, of students
in this course. Suppose I want to obtain the marginal distribution of the gender X. Then,
using equation (1.1), we have the probability of female and male:
f (1) = P (X = 1) = f (1; y1 ) + ::: + f (1; yn ) =
X
f (1; y)
y
f (0) = P (X = 0) = f (0; y1 ) + ::: + f (0; yn ) =
X
f (0; y)
y
3
The reason why I bother you with detailed discussion of joint densities will become clear when we talk
about independence of random variables - a key concept in sampling theory and regression analysis.
8
CHAPTER 1. PRELIMINARIES
Written in another way, a female or a male student can have any of the GPA values
fy1 ; :::; yn g, and therefore
P (female) = P (female and GP A = y1 ) + ::: + P (female and GP A = yn )
P (male) = P (male and GP A = y1 ) + ::: + P (male and GP A = yn )
Exercise 12 Consider the function:
2
f (x; y) =
(a) Prove that
Z
1
1
x
0
Z
y
1
0
x
1; 0 y
otherwise
1
f (x; y) dxdy = 1
1
In other words, prove that f (x; y) is a probability density function.
(b) Find the marginal pdfs f (x) and f (y).
1.3.2
Conditional pdf
In econometrics, we are often interested in the behavior of one variable, conditional on
given values of another variable. For example, I might want to study how well female
students are doing in statistics courses, compared with male students. This is the study
of grades pdf, given that the student is female, and grades pdf, given that the student is
male. As another example, one might want to study the distribution of wages, given that
the level of education is "college" v.s. the distribution of wages given that the education
level is "MBA". Again, this is the study of the pdf of wages, conditional on education level.
De…nition 9 Conditional probability density function of Y given X is given by
f (yjx) =
f (x; y)
f (x)
(1.3)
In cases when f (x) = 0, we de…ne f (yjx) = 0.
The left hand side of equation (1.3) is sometimes written as f (yjX = x), to emphasize
that this is the conditional density of Y given that X is …xed at a given value of x. The
vertical bar with x following it, jx, means that we are conditioning on x (or it is given that
X = x). For example, the conditional pdf of wages (Y ), given that education is at level 3,
(X = 3), is written
f (x; y)
f (yjX = 3) =
P (X = 3)
or in short
f (yj3) =
f (x; y)
fX (3)
One can think of whatever is written after the bar as information. If two variables, X
and Y are related, then the information on one of them should restrict the possible values
1.3. RANDOM VECTORS
9
of other. For example, consider the random experiment of tossing a die, and let Y be the
result to a toss. Thus, the possible values of Y (the support of Y ) are f1; 2; 3; 4; 5; 6g. The
pdf of Y is f (y) = 1=6 for y = 1; :::; 6. Now suppose that we provide an information that the
result of a toss is an even number. We can provide this information by de…ning a random
variable X = 1 if y is even and X = 0 if y is odd. What is the conditional pdf of Y
given that X = 1? We know that conditional on X = 1, Y can only attain values f2; 4; 6g.
Intuitively, these values can be attained with equal probabilities, so P (Y = 2jX = 1) =
P (Y = 4jX = 1) = P (Y = 6jX = 1) = 1=3. This pdf can be obtained using the de…nition
of conditional density in equation (1.3), and the fact that even numbers in a toss of a die
occur with probability 1=2:
f (2jX = 1) =
f (1; 2)
=
P (X = 1)
f (4jX = 1) =
f (1; 4)
=
P (X = 1)
f (6jX = 1) =
f (1; 6)
=
P (X = 1)
1
6
1
2
1
6
1
2
1
6
1
2
=
1
3
=
1
3
=
1
3
Exercise 13 Let Y be the result of a die toss, and X an indicator of even toss: X = 1 if y is
even and X = 0 if y is odd. Calculate the conditional probabilities f (1jX = 1), f (3jX = 1),
f (5jX = 1).
1.3.3
Independence of random variables
What if we are given an information which is not useful? Intuitively, the distribution of a
random variable with no information at all should be the same as the conditional distribution
given some useless information. For example, suppose that I toss a die, and let Y be the
random variable which is equal to the result. Suppose that at the same time, my friend ‡ips
a coin, and let X = 1 if heads and X = 0 if tails. What is the conditional pdf of Y given that
X = 1? The information about the result of the coin ‡ip does not reveal anything about
the likely outcomes of the die toss. In this case we say that Y and X are independent.
Intuitively, when information is useless, we expect that f (yjx) = f (y). Thus, from the
de…nition (1.3) it follows that when X and Y are independent, we have:
f (x; y)
= f (y)
f (x)
) f (x; y) = f (x) f (y)
f (yjx) =
De…nition 10 Two random variables are statistically independent if and only if
f (x; y) = f (x) f (y)
that is, the joint pdf can be written as the product of marginal pdfs.
10
CHAPTER 1. PRELIMINARIES
In general though, if X and Y are dependent, the de…nition in (1.3) says that the joint
pdf can be factored out in two ways:
f (x; y)
) f (x; y) = f (x) f (yjx)
f (x)
f (x; y)
f (xjy) =
) f (x; y) = f (y) f (xjy)
f (y)
f (yjx) =
In other words, the joint pdf is the product of a conditional and marginal pdfs. Comparing
the two gives the relationship between the two conditional densities, known as the Bayes
rule for pdfs:
f (y) f (xjy)
f (yjx) =
f (x)
The concept of independence is crucial in econometrics. For starters, a random sample
must be such that the units of observation are independent of each other.
Exercise 14 Consider the pdf
f (x; y) =
2
x
0
y
0
x
1; 0 y
otherwise
1
Check whether X are Y are statistically independent.
1.4
Moments
Often the distribution of a random variable can be summarized in terms of a few of its
characteristics, known as the moments of the distribution. The most widely used moments
are mean (or expected value or expectation) and variance. While the distribution of all
your grades on your transcript give a complete picture of your academic progress, the GPA is
a single number, which is easy to process and which reveals important (although incomplete)
information. In characterizing a random vector, in addition to mean and variance, we also
look at covariance and correlation.
1.4.1
Expected value
Intuitively, expected value or the mean of a random variable, is some average of all the values
that the random variable can attain. In particular, the values of the random variable should
be weighted by their probabilities.
De…nition 11 The expected value (or mean) of a random variable X is
X
[If X is discrete] : E (X) = X =
xf (x)
[If X is continuous] : E (X) =
X
=
Zx 1
1
xf (x) dx
1.4. MOMENTS
11
In the discrete case, the sum is over all the possible values of X, and each x is weighted
by the discrete pdf. No di¤erently, in the continuous case, the integral is over all the possible
values of X weighted by the continuous pdf.
For example of discrete case, consider X to be the result of a die toss, with pdf f (x) = 1=6
for all x 2 f1; 2; 3; 4; 5; 6g. This is called the discrete uniform distribution. The expected
value of X is:
X
1
E (X) =
xf (x) = (1 + 2 + 3 + 4 + 5 + 6) = 3:5
6
x
For example of a continuous case, consider X
U [a; b] with pdf f (x) = b 1 a (f (x) = 0
outside of the interval [a; b]). This is the continuous uniform distribution. The expected
value of X is:
Z b
Z 1
b
1
1
x2
x
xf (x) dx =
E (X) =
dx =
b a
b a 2 a
a
1
2
2
b
a
1 (b a) (b + a)
1
=
=
b a
2
b a
2
b+a
=
2
This result is not surprising, when you look at the graph of the continuous uniform density
and notice that the mean is simply the middle of the support [a; b].
Recall that any function of a random variable, is also a random variable, and we often
need to calculate the expected value of some function g ( ) of X.
De…nition 12 The expected value of a function g (X) of a random variable X is
X
[If X is discrete] : E [g (X)] =
g (x) f (x)
[If X is continuous] : E [g (X)] =
Zx 1
g (x) f (x) dx
1
For example of discrete case, consider X to be the result of a die toss, with pdf f (x) = 1=6
for all x 2 f1; 2; 3; 4; 5; 6g. The expected value of X 2 is:
E [g (X)] =
X
x
g (x) f (x) =
1
1 2
1 + 22 + 32 + 42 + 52 + 62 = 15
6
6
Similarly, we can de…ne the expected value of a function of two or more random variables.
De…nition 13 Let X and Y be random variables, and let g (X; Y ) be some function of these
random variables. The expected value of a function g (X; Y ) is
XX
[If X is discrete] : E [g (X; Y )] =
g (x; y) f (x; y)
y
[If X is continuous] : E [g (X; Y )] =
Z
x
1
1
Z
1
1
g (x; y) f (x; y) dxdy
12
CHAPTER 1. PRELIMINARIES
Any function of 3 random variables will involve joint 3-variable pdfs, and triple integrals
(in continuous case) or tripple sums (in discrete case).
It is important to realize that expectation of a random variable is always a number.
While the toss of a die is a random variable which attains 6 di¤erent values, its expectation
(mean) is a single number 3:5. Next, we list some general properties of expected values, i.e.
properties that apply to discrete and continuous random variables.
Rules of Expected Values
1. Expected value of a constant is the constant itself. Thus, if b is a constant, then
E (b) = b
2. Constants factor out. If a is a constant number, then
E (aX) = aE (X)
3. Expected value of a sum is the sum of expected values. That is, for any random variable
X and Y
E (X + Y ) = E (X) + E (Y )
Together with rule 2, this generalizes to any linear combination of random variables.
Let X1 ; :::; Xn be random variables, and let a1 ; :::; an be numbers. Then,
E (a1 X1 + ::: + an Xn ) = a1 E (X1 ) + ::: + an E (Xn )
4. If X and Y are independent, then
E (XY ) = E (X) E (Y )
Proof. (Rule 1). The …rst rule does not really need a proof. But nevertheless, E (b) =
b f (b) = b 1 = b. For example, the number 5 cannot be any number other than 5, so it is
5 with probability 1.
(Rule 2). We prove the second rule for continuous random variable X.
E (aX) =
Z
1
1
axf (x) dx = a
Z
1
xf (x) dx = aE (X)
1
The proof for discrete random variable is the same, with summation instead of integration.
1.4. MOMENTS
13
(Rule 3). We prove the third rule for continuous random variables X and Y .
Z 1Z 1
(x + y) f (x; y) dxdy
E (X + Y ) =
1
1
Z 1Z 1
=
[xf (x; y) + yf (x; y)] dxdy
1
1
Z 1Z 1
Z 1Z 1
yf (x; y) dxdy
xf (x; y) dxdy +
=
1
1
1
1
Z 1
Z 1
Z 1
Z 1
x
f (x; y) dy dx +
y
f (x; y) dx dy
=
1
1
1
1
Z 1
Z 1
yf (y) dy (from de…nition of marginal pdf)
xf (x) dx +
=
1
1
= E (X) + E (Y )
(Rule 4). The product XY is another random variable, since any function of random
variables is another random variable. Thus, if X and Y are continuous, the expected value
of the product is
Z Z
E (XY ) =
1
1
1
1
xyf (x; y) dxdy
By de…nition 10
E (XY ) =
Z
1
Z
1
xyf (x) f (y) dxdy
Z
Z 1
=
yf (y)
xf (x) dx dy
1
1
|
{z
}
1
1
= E (X)
1
Z
E(X)
1
yf (y) dy
1
= E (X) E (Y )
The proof is exactly the same for discrete X and Y with summation instead of integration.
Exercise 15 (Proof of rules 2 and 3 of expected values). Let X and Y be a random variables
and a; b are numbers.
(a) Prove that E (aX) = aE (X) when X is discrete.
(b) Prove that E (X + Y ) = E (X) + E (Y ) when X and Y are discrete.
(c) Prove that E (XY ) = E (X) E (Y ) when X and Y are independent discrete random
variables.
1.4.2
Variance and standard deviation
While the expected value tells us about some average of a distribution, the variance and
standard deviation measure the dispersion of the values around the mean. Imagine one
14
CHAPTER 1. PRELIMINARIES
uniform random variable with values f9; 10; 11g and another with f0; 10; 20g. They both
have the same mean of 10, but in the …rst the values are concentrated closer to the mean
(smaller variance).
De…nition 14 Let X be a random variable with mean E (X) = . The variance of X is
var (X) =
2
X
)2
= E (X
De…nition 15 The positive square root of variance, s:d: (X) =
standard deviation of X.
=
X
p
var (X), is the
Thus, the variance is the expected value of the squared deviation of the random variable
from its mean. We already know the de…nitions of expected value of discrete and continuous
random variables, and therefore we can write the de…nition of variance as follows:
2
X
[If X is discrete] : var (X) =
2
X
[If X is continuous] : var (X) =
=
=
X
)2 f (x)
(x
Zx 1
)2 f (x) dx
(x
1
As example of a discrete case, lets compute the variance of a toss of a die, X, with pdf
f (x) = 1=6 for all x 2 f1; 2; 3; 4; 5; 6g. We already computed the mean = 3:5. Thus, the
variance is:
var (X) =
(1 3:5)2 + (2 3:5)2 + (3 3:5)2
+ (4 3:5)2 + (5 3:5)2 + (6 3:5)2
1
6
= 2:9167
For example of a continuous case, consider X
U [a; b] with pdf f (x) = b 1 a (f (x) = 0
outside of the interval [a; b]). This is the continuous uniform distribution. We already found
that the mean is = a+b
, and therefore the variance of X is:
2
var (X) =
Z
b
x
a
=
=
=
a+b
2
1
b
a
Z
a
1
b
a
1
b
a
dx
b
x
2
"
x3
3
(a + b) x +
b
x2
(a + b)
+
2
3
a
3
3
(a + b)
b
2
a+b
2
a
1
b
2
a+b
2
2
a
2
2
+
!
dx
b
2
x
a
a+b
2
2
(b
#
a)
1.4. MOMENTS
Using the rule, b3
15
a3 = (b
a) (b2 + ab + a2 ), we get
"
b2 + ab + a2 (a + b)2
var (X) =
+
3
2
#
"
b2 + ab + a2 (a + b)2
=
3
4
4 (b2 + ab + a2 )
=
b2
=
a+b
2
2
#
3 (a2 + 2ab + b2 )
12
2ab + a2
(b a)2
=
12
12
The derivation was pretty messy, but the result makes intuitive sense. Notice that the
variance of X U [a; b] depends positively on the length of the interval b a.
Exercise 16 Consider the continuous uniform random variable X U [a; b].
(a) If a = 0 and b = 1, …nd the pdf of X, its expected value and variance.
(b) If a = 0 and b = 2, …nd the pdf of X, its expected value and variance.
For computational convenience, the de…nition of variance can be manipulated to create
an equivalent, but easier to use formula.
var (X) =
=
=
=
=
E
E
E
E
E
(X
X2
X2
X2
X2
)2
2 X+ 2
2 E (X) +
2 2+ 2
2
2
Thus, you will often use the formula:
var (X) = E X 2
E (X)2
(1.4)
Having found the expected value, the last term is just its square. So we only need to compute
the mean of X 2 . For example of discrete case, consider again a toss of a die, X, with pdf
f (x) = 1=6 for all x 2 f1; 2; 3; 4; 5; 6g. We found that E (X) = 3:5, so E (X)2 = 3:52 = 12:25.
The …rst term is
X
E X2 =
x2 f (x)
x
=
1 2
1 + 22 + 32 + 42 + 52 + 62 = 15:1667
6
Thus,
var (X) = E X 2
= 15:167
E (X)2
12:25 = 2:9167
16
CHAPTER 1. PRELIMINARIES
For example of a continuous case, consider X
U [a; b] with pdf f (x) =
outside of the interval [a; b]). We already found that E (X) =
(b+a)2
.
4
b+a
,
2
1
b a
2
(f (x) = 0
so E (X) =
b+a 2
2
=
The …rst term is:
E X
2
=
Z
b
x2
a
=
=
1
b
a
1
1
b
a
x3
3
b3
dx
b
a
a3
b a
3
2
b + ab + a2
=
3
Thus, the variance is
var (X) = E X 2
E (X)2
b2 + ab + a2 (b + a)2
=
3
4
(b a)2
=
12
Notice that expressions become less messy with the de…nition of variance in (1.4).
Rules of Variance
1. Variance of constant is zero. Thus, if b is a constant, then
var (b) = 0
2. If a is a constant number, then
var (aX) = a2 var (X)
Thus, for example, if you multiply a random variable by 2, its variance increases by a
factor of 4.
3. Adding a constant to a random variable, does not change its variance. Thus, if b is a
constant number, then
var (X + b) = var (X)
Adding a constant to a random variable, just shifts all the values and the mean by
that number, but does not change their dispersion around the mean.
4. Variance of the sum (di¤erence) is NOT the sum (di¤erence) of the variances. For
random variables X and Y , we have
var (X + Y ) = var (X) + var (Y ) + 2cov (X; Y )
var (X Y ) = var (X) + var (Y ) 2cov (X; Y )
where cov (X; Y ) is the covariance between X and Y , to be de…ned in the next section.
1.4. MOMENTS
17
The …rst 3 rules can be easily proved directly from the de…nition of variance var (X) =
E (X
)2 . We’ll get back to the 4th rule in the next section, after we discuss covariance.
Proof. (Rules 1,2,3 of variance).
(1) If X = b, then from the rules of expected values E (b) = b. Thus
var (b) = E (b
b)2 = 0
(2) From the rules of expected values, E (aX) = aE (X). Thus,
var (aX) = E (aX
E (aX))2
= E (aX
aE (X))2
= E a2 (X
)2
= a2 E (X
= a2 var (X)
)2
(3) From rules of expected values, E (X + b) = E (X) + b =
( + b))2
var (X + b) = E (X + b
= E (X
= var (X)
+ b. Thus,
)2
Rules of Standard Deviation
Usually, textbooks do not even bother presenting the rules of standard deviations, because
they follow directly from rules of variances. For example, taking square roots of the …rst 3
rules of variances, gives the following rules of standard deviations:
p
p
[1] :
var (b) = 0 ) s:d: (b) = 0
p
p
[2] :
var (aX) = a2 var (X) ) s:d: (aX) = jaj s:d: (X)
p
p
[3] :
var (X + b) = var (X) ) s:d (X + b) = s:d: (X)
Notice that rule 2 implies that if we double a random variable, we also double its standard
deviation.
Besides the importance of variance and standard deviation is statistics (we will be using
them everywhere in this course), they are extremely important in …nance. Any …nancial
asset (or a portfolio of assets) is a random variable, which has expected return (mean return) and risk (standard deviation of returns). A great deal of modern portfolio theory
deals with …nding portfolios which maximize expected return for any given level of risk, or
alternatively, minimizing the level of risk for any given expected return. These are called
e¢ cient portfolios. If you take Finance 350 course (which is highly recommended), these
notes will be useful as well.
18
CHAPTER 1. PRELIMINARIES
Exercise 17 Let X be random variable with mean
following transformation of X:
X
X
Y =
X
2
X.
and variance
Let Y be the
X
Thus Y is obtained by subtracting the mean and dividing by standard deviation (this operation
called standardization). Show that Y has mean zero and standard deviation 1 (i.e. Y = 0,
and Y = 1). Such random variable is called standard.
Exercise 18 Can the variance of any random variable be negative?
Exercise 19 Can the standard deviation of any random variable be negative?
Exercise 20 Let X be random variable with mean
dard deviation of Y = 2X?
X
and variance
2
X.
What is the stan-
Exercise 21 Let X be random variable with mean
dard deviation of Y = 2X?
X
and variance
2
X.
What is the stan-
1.4.3
Covariance and correlation
When analyzing the joint behavior of two random variables, we often start by asking if they
are correlated. For example, we would like to know if education level and wages are positively
correlated (otherwise, what are we doing here?). As another example, in macroeconomics we
often want to know if some variable is correlated with real GDP or not (say unemployment).
What this means in plane language, is that we want to investigate whether two variables are
moving around the mean in the same direction, opposite direction or there is no connection
between their movements.
De…nition 16 Let X and Y be two random variables with means
The covariance between X and Y is
cov (X; Y ) = E [(X
X ) (Y
X
and
Y
respectively.
Y )]
Notice that if X and Y are mostly moving together around their mean, then when X is
above X , Y also tends to be above Y , and when X is below X , Y also tends to be below
Y . In this case the terms (X
X ) and (Y
Y ) are either both positive or both negative,
and cov (X; Y ) > 0. We then say that X and Y are positively correlated. On the other hand,
suppose that X and Y are for the most part moving in opposite directions. Then when X
is above X , Y tends to be below Y , and when X is below X , Y tends to be above Y .
In such case the terms (X
X ) and (Y
Y ) will have opposite signs and cov (X; Y ) < 0.
We then say that X and Y are negatively correlated. We will see later, that when X and Y
are independent, then cov (X; Y ) = 0, and we say that X and Y are uncorrelated.
Notice that just as the de…nition of variance, the de…nition of covariance involves computing expected value. In order to compute these expected values, we once again have two
1.4. MOMENTS
19
formulas for discrete and for continuous random variables.
X
[If X and Y are discrete] : cov (X; Y ) =
(x
X ) (y
[If X and Y are continuous] : cov (X; Y ) =
Zx 1 Z
1
1
(x
Y)f
(x; y)
X ) (y
Y)f
(x; y) dxdy
1
Also as we did with variance, we can manipulate the de…nition of covariance to derive a more
convenient formula for computation.
cov (X; Y ) =
=
=
=
=
E [(X
E [XY
E (XY )
E (XY )
E (XY )
X ) (Y
Y )]
YX
XY
YE
(X)
Y
X
X
Y
+
X
XE
X
Y
+
Y]
(Y ) +
X
X
Y
Y
Thus, you will often use the formula
cov (X; Y ) = E (XY )
E (X) E (Y )
(1.5)
Rules of Covariance
1. Covariance of a random variable X with itself is the variance of X:
cov (X; X) = var (X)
Notice that we could have discussed covariance before variance, and then de…ne variance as the covariance of a variable with itself. In fact, this way we can prove the rules
of variances in a more elegant and easy way. These notes follow the order of coverage
in most textbooks, i.e. mean ! variance ! covariance.
2. Covariance between a random variable and a constant is zero. Thus, if X is a random
variable, and b is a constant, then
cov (X; b) = 0
3. Constants factor out as product. Let X and Y be random variables and a and b be
constant numbers. Then,
cov (aX; bY ) = ab cov (X; Y )
4. Distributive property. Let X, Y and Z be random variables. Then,
cov (X; Y + Z) = cov (X; Y ) + cov (X; Z)
5. Adding constants to random variables, does not change the covariance between them.
Let X and Y be random variables and c and d be constant numbers. Then,
cov (X + c; Y + d) = cov (X; Y )
20
CHAPTER 1. PRELIMINARIES
6. Covariance between two independent variables is 0. That is, suppose that random
variables X and Y are independent. Then,
cov (X; Y ) = 0
or
E (XY ) = E (X) E (Y )
Recall that variables with zero covariance are called uncorrelated. This rule says
that independence implies lack of correlation.
Proof. For all the proofs of the covariance rules it is easier to use the de…nition in equation
(1.5), that is, cov (X; Y ) = E (XY ) E (X) E (Y ).
(Rule 1). This just follows from comparing the de…nition of covariance (1.5), when
X = Y , with the de…nition of variance (1.4).
(Rule 2). It should be intuitive, that covariance of any random variable with a constant
is zero, because covariance measures the comovement of the two around their means, and a
constant simply does not move. Formally,
cov (X; b) = E (Xb)
= bE (X)
= 0
E (X) E (b)
bE (X)
(Rule 3). Constants factor out because they do so in expected values. Formally,
cov (aX; bY ) =
=
=
=
E (aX bY ) E (aX) E (bY )
abE (XY ) abE (X) E (Y )
ab [E (XY ) E (X) E (Y )]
ab cov (X; Y )
(Rule 4). Distributive property.
cov (X; Y + Z) =
=
=
=
E (X (Y + Z)) E (X) E (Y + Z)
E (XY + XZ) E (X) [E (Y ) + E (Z)]
E (XY ) + E (XZ) E (X) E (Y ) E (X) E (Z)
[E (XY ) E (X) E (Y )] + [E (XZ) E (X) E (Z)]
{z
} |
{z
}
|
cov(X;Y )
cov(X;Z)
(Rule 5). Adding constants does not a¤ect the covariance.
cov (X + c; Y + d) =
=
=
=
=
E [(X + c) (Y + d)] E (X + c) E (Y + d)
E [XY + Xd + cY + cd] [E (X) + c] [E (Y ) + d]
[E (XY ) + dE (X) + cE (Y ) + cd] [E (X) E (Y ) + dE (X) + cE (Y ) + cd]
E (XY ) E (X) E (Y )
cov (X; Y )
1.4. MOMENTS
21
(Rule 6). Covariance between two independent variables is 0. This is exactly rule 4 of
expected values, which we already proved and will not repeat here.
Now we are in a position to prove rule 4 of variance, which is a formula of variance of
sums:
var (X + Y ) = var (X) + var (Y ) + 2cov (X; Y )
Proof. (Rule 4 of variance). Recall that variance is covariance between the variable and
itself. Therefore,
var (X + Y ) = cov (X + Y; X + Y )
By distributive property of covariance (rule 4), we have
cov (X + Y; X + Y ) = cov (X; X + Y ) + cov (Y; X + Y )
= cov (X; X) + cov (X; Y ) + cov (Y; X) + cov (Y; Y )
| {z }
| {z }
var(X)
var(Y )
= var (X) + var (Y ) + 2cov (X; Y )
Exercise 22 Prove that for any two random variables X and Y , we have
var (X
Y ) = var (X) + var (Y )
2cov (X; Y )
Exercise 23 Prove that for two independent random variables X and Y , the variance of
a sum or di¤erence is the sum of the variances:
var (X + Y ) = var (X) + var (Y )
var (X Y ) = var (X) + var (Y )
Recall that covariance measures the degree of comovement of two random variables
around their means. The main disadvantage of this measure is that it is NOT unit-free.
Suppose researcher A studies the comovement of years of schooling X and annual wages
measured in thousands of dollars, Y . He …nds a positive covariance:
cov (X; Y ) = 7
Researcher B has the same goal and the same data on wages and schooling, but he chooses
to measure wages in dollars (instead of thousands of dollars). Thus, he …nds
cov (X; 1000 Y ) = 1000cov (X; Y ) = 7000
Should researcher B conclude that wages and years of schooling have stronger comovement
than what was previously found by researcher A? NO, if researcher A and B use the same
data, we want them to reach the same conclusion about the degree of comovement between
wages and years of schooling. In order to make the results comparable, researchers report
correlation instead of covariance.
22
CHAPTER 1. PRELIMINARIES
De…nition 17 The correlation between random variables X and Y is
cov (X; Y )
corr (X; Y ) = XY =
X
Y
We de…ne corr (X; Y ) = 0 whenever X = 0, or Y = 0 or both. In other words, whenever
the covariance between two random variables is zero, we de…ne the correlation to be also zero,
and say that the two variables are uncorrelated.
Thus, the correlation is the covariance divided by the product of standard deviations.
How does this resolve the problem of covariance depending on units of the random variables?
Let X and Y be random variables, and let a and b be positive numbers. We know that
cov (aX; bY ) = ab cov (X; Y ), so if a and b represent di¤erent units used by di¤erent
researchers, we will have di¤erent results. Correlation however is unit free, and does not
change when we scale the random variables by positive numbers.
Properties of Correlation
1. For any two random variables X and Y , the sign of the correlation between them is
the same as the sign of the covariance between them.
sign (corr (X; Y )) = sign (cov (X; Y ))
In other words, correlation gives us the same information as covariance about the qualitative nature of the comovement between X and Y around their mean. If cov (X; Y ) >
0, meaning that X and Y tend to be above and below their respective means at the
same time, then we will also have corr (X; Y ) > 0.
2. Correlation is unit free. Let X and Y be random variables, and let a and b be numbers,
both of the same sign. Then,
corr (aX; bY ) = corr (X; Y )
3. Correlation between any two random variables can be only between
and Y be random variables. Then,
1
corr (X; Y )
1 and 1. Let X
1
Proof. (Property 1). Since standard deviation of any random variable is always positive,
dividing by them does not change the sign.
(Property 2). Let X and Y be random variables, and let a and b be numbers with the
same sign.
cov (aX; bY )
sd (aX) sd (bY )
ab cov (X; Y )
=
jaj sd (X) jbj sd (Y )
ab
cov (X; Y )
=
jaj jbj sd (X) sd (Y )
= corr (X; Y )
corr (aX; bY ) =
1.5. NORMAL DISTRIBUTION AND ITS RELATIVES
23
Notice that the last step follows because a and b have the same sign (so ab > 0 and ab =
jaj jbj).
We do not provide the proof of property 3, since it involves knowledge of inner products
and Cauchy–Schwarz inequality. Instead, we discuss this property at intuitive level. The
highest possible correlation that can be achieved between X and Y , is when Y = X. Then
the two random variables X and Y are always guaranteed to be above or below their mean
at the same time. The lowest possible correlation is achieved when Y = X. In this case,
the two variables always deviate from their means in opposite directions. Thus, we will prove
that corr (X; X) = 1 and corr (X; X) = 1, and these will be the maximal and minimal
correlations, so that in general, for any X and Y we have 1 corr (X; Y ) 1.
var (X)
=1
var (X)
X X
cov (X; X)
cov (X; X)
corr (X; X) =
=
=
corr (X; X) =
cov (X; X)
X
X
=
X
1
X
In the last equation we used rule 3 of covariance, that of constants factoring out, with the
constant in this case being 1.
Exercise 24 Prove that if two random variables, X and Y , are independent, then they are
uncorrelated, i.e. corr (X; Y ) = 0.
The opposite statement is not true. Two random variables can be uncorrelated, but not
independent. The next exercise gives such an example.
Exercise 25 Let X be a random variable with pdf f (x) = 1=4 for x 2 f1; 2; 1; 2g. Let
Y = X 2.
(a) Show that X and Y are not correlated, i.e. show that corr (X; Y ) = 0.
(b) Show that X and Y are not independent. (Hint: compare the conditional pdf f (yjx)
with f (y). If X and Y are independent, then we must have f (yjx) = f (y)).
Exercise 26 Let X be a random variables, and a,b be some numbers. Let Y = aX + b.
(a) Prove that if a > 0, then corr (X; Y ) = 1.
(b) Prove that if a < 0, then corr (X; Y ) = 1.
(c) Prove that if a = 0, then corr (X; Y ) = 0.
1.5
Normal Distribution and Its Relatives
In this section we brie‡y discuss the normal distribution, and its cousins, the Chi-square
distribution, the Student’s t-distribution, and the F-distribution. These 4 distributions are
the most important ones for this course.
24
1.5.1
CHAPTER 1. PRELIMINARIES
Normal distribution
De…nition 18 A random variable X has normal distribution with mean
deviation , if its probability density function is
#
"
2
1
1 x
,
1 x 1
f (x) = p exp
2
2
and standard
(1.6)
We then write X N ( ; 2 ) as a short way of saying that X has normal distribution with
mean and standard deviation (variance of 2 ).
The pdf of the normal distribution has a bell shape, which is symmetric around the mean.
The next …gure shows how the particular pdf changes when we change the parameters and
.
The solid line is the pdf of the standard normal distribution, with = 0, and = 1.
The dotted curve plots the pdf of N (2; 1). Notice that the shape of this pdf is the same,
but it is shifted by 2. The dashed curve is the pdf of N (2; 4), i.e. = 2 and = 2. Notice
that it is centered around the mean of 2, but because of the larger variance it is more ‡at
than N (2; 1).
From the above graph, we learn that there are many normal distributions, characterized
by and . Does this mean that to calculate probabilities that a normal random variable is
in some interval [a; b], we need to compute the integrals of di¤erent pdfs? Fortunately, once
you see one normal distribution, you had seen all of them. It is therefore a common practice
to use just one normal distribution - the standard normal.
De…nition 19 Let X
N( ;
2
). The random variable
Z=
X
has standard normal distribution, with mean zero and standard deviation 1. We write
Z N (0; 1). The pdf of the standard normal is
1
(z) = p exp
2
z2
,
2
1
z
1
1.5. NORMAL DISTRIBUTION AND ITS RELATIVES
25
Suppose we want to calculate the probability that X N ( ; 2 ) is between a and b. We
can always express this probability in terms of the standard normal distribution:
P (a
X
b) = P
= P
a
X
a
Z
b
b
Therefore, for all practical purposes, we only need the standard normal distribution. The
next …gure, shows the pdf of Z N (0; 1).
Properties of Normal Distribution
1. All normal distributions contain about 68% of the probability concentrated within one
standard deviation from the mean, about 95% of the probability within 2 of the mean,
and about 99:7% of the probability within 3 from the mean. Formally,
P(
P(
2
P(
3
X
X
X
+ )
+2 )
+3 )
0:68
0:95
0:997
This property is illustrated in the next graph.
In other words, it is highly unlikely to obtain random draws from the normal distribution, which are far from the mean.
2. Linear combination of normal random variables is also normal. For example, suppose
that X and Y are normal random variables. Then their sum is also normal. More
26
CHAPTER 1. PRELIMINARIES
general, let X1 ; :::; Xn be normal random variables with mean 1 ; :::;
deviations 1 ; :::; n , and let a1 ; :::; an be constant numbers. Then,
a1 X1 + ::: + an Xn
where = a1
general.
1
+ ::: + an
n,
N
;
n
and standard
2
and the variance is something complicated to …nd in
There is no proof for the …rst property in the usual sense; one just needs to calculate the
following integrals of the normal pdf in equation (1.6):
Z
+
f (x) dx,
Z
+2
f (x) dx,
2
Z
+3
f (x) dx
3
These integrals cannot be calculated analytically and must be approximated numerically
(using some computer algorithms).
The proof of the second property relies on familiarity with the concept of characteristic
functions, and therefore I skip the proof of the second property. However, you already have
the tools to show that the mean of the linear combination is = a1 1 + ::: + an n , and if
X1 ; :::; Xn are independent, you can also …nd the variance.
Exercise 27 Let X1 ; :::; Xn be normal random variables with mean 1 ; :::; n and standard
deviations 1 ; :::; n , and let a1 ; :::; an be constant numbers.
(a) Show that the expected value of a1 X1 + ::: + an Xn is a1 1 + ::: + an n .
(b) Suppose that in addition X1 ; :::; Xn are independent. Show that the variance of a1 X1 +
::: + an Xn is a21 21 + ::: + a2n 2n . Hint: use the property that for uncorrelated random variables,
the variance of the sum is the sum of the variances.
Central Limit Theorem
The reason why the normal distribution is by far the most popular in statistics, is the
remarkable result - the Central Limit Theorem.
Theorem 1 (CLT). Let X1 ; :::; Xn be n independent random variables, all having some
distribution with mean and variance 2 . Let the simple average of those variables be
1X
Xn =
Xi
n i=1
n
Then as n ! 1, we have
D
Xn ! N
D
2
;
n
The notation ! means "converges in distribution". Please notice the amazing generality of the theorem by paying attention to the words "some distribution". The CLT is one of
1.5. NORMAL DISTRIBUTION AND ITS RELATIVES
27
the most important results in probability theory, and by far the most important result in statistics. The proof of such general result is much too advanced for this course (again requires
knowledge of characteristic functions). But we can visualize the result using simulation.
We had seen the continuous uniform distribution in the section about random variables.
= [a; b]. The pdf of X is a horizontal
Let X U [a; b], with pdf f (x) = b 1 a , f (x) = 0 if x 2
line and does not look anything like the normal distribution. However, the CLT states that
if we draw samples and compute their averages, then the distribution of these averages will
start looking more and more like the pdf of a normal random variable, as we increase the
size of these samples.
The next …gure shows the histograms of simulated sample means based on random draws
from U [0; 5]. The …rst panel shows the sample means, when the sample size is n = 1. This
does not look anything like the normal pdf. The second panel shows the histogram of sample
means, based on samples of size n = 2 from uniform distribution. We are beginning to see
something that looks like a bell shape. The last panel shows the histogram of sample means,
when the sample size is n = 100. This histogram looks like it could have been generated by
random draws from normal distribution.
n = 1, a = 0, b = 5
1500
1000
500
0
0
0.5
1
1.5
2
2.5
3
3.5
4
4.5
5
3
3.5
4
4.5
5
n = 2, a = 0, b = 5
3000
2000
1000
0
0
0.5
1
1.5
2
2.5
n = 100, a = 0, b = 5
4000
3000
2000
1000
0
1.8
2
2.2
2.4
2.6
2.8
3
3.2
Remember that the Central Limit Theorem is a limiting result that requires n ! 1.
The approximation though can be very good even for n not too big. In other words, even
28
CHAPTER 1. PRELIMINARIES
when the sample size is n = 30, the distribution of the sample mean might be very close to
normal.
Exercise 28 Let X1 ; :::; Xn be n independent random variables, all having some distribution with mean and variance 2 . Let the simple average of those variables be
1X
Xi
Xn =
n i=1
n
(a) Show that the mean of Xn is , i.e. E Xn = .
2
(b) Show that the variance of Xn is n , i.e. var Xn =
1.5.2
2
n
.
Chi-square distribution
De…nition 20 Let Z1 ; Z2 ; :::; Zn be independent standard normal random variables, i.e. Zi
N (0; 1) for i = 1; 2; :::; n. Then, the sum of squares of these random variables is called the
chi-square distribution, with n degrees of freedom. This is denoted
X=
n
X
Zi2
2
n
i=1
The only parameter of the chi-square distribution is the number of squared standard
normal random variables that were added to generate it. Recall that any function of a random
variable is another random variable. The chi-square is one of many random variables that
we could have created from the normal distribution. The question you should be asking now
is, what is the purpose of creating this particular distribution? The usefulness of chi-saquare
is in the following result.
Theorem 2 Let X1 ; :::; Xn be independent random variables, all with the same normal distribution: Xi N ( ; 2 ) 8i. We de…ne the sample variance as follows:
[sample variance] :
s2n
=
1
n
1
n
X
Xi
Xn
2
i=1
Then,
s2n (n
1)
2
2
n 1
This result allows us to test hypotheses about the population variance.
Properties of chi-square Distribution
1. Let X
2
n.
Then E (X) = n.
2. Let X
2
n.
Then var (X) = 2n.
3. Let X
2
n
and Y
2
k,
then X + Y
2
n+k .
1.5. NORMAL DISTRIBUTION AND ITS RELATIVES
29
Proof. (Property 1).
n
X
E (X) = E
Zi2
i=1
Recall that Zi
!
=
n
X
E Zi2 = n
i=1
N (0; 1), so E (Zi ) = 0, and var (Zi ) = E (Zi2 )
E (Zi )2 = E (Zi2 ) = 1.
| {z }
0
(Property 2). Omitted. The proof requires knowledge of moment generating functions.
(Property 3). The chi-square is the sum of squared standard normal random variables.
If X is constructed by adding n squared standard normal, and Y is constructed by adding
k, then when we add them all up, we get n + k.
X +Y =
n
X
i=1
Zi2
+
k
X
Zi2
i=1
=
n+k
X
Zi2
2
n+k
i=1
We do not present here the mathematical expression of the pdf of the chi-square, because
it is too messy, but it exists and you can look it up if you want to. The next …gure plots the
pdfs of the chi-square with di¤erent number of degrees of freedom.
1.5.3
t-distribution
De…nition 21 Let Z be a standard normal random variable, Z
N (0; 1), and let Y be a
2
chi-square with n degrees of freedom, Y
n , and Z and Y are statistically independent.
Z
p
Then the random variable
has a t distribution with n degrees of freedom. This is
Y =n
denoted
Z
T =p
Y =n
tn
30
CHAPTER 1. PRELIMINARIES
The pdf of the t distribution looks very similar to the pdf of Z
N (0; 1), and in fact
when n becomes large, T approaches Z. To prove this claim, one needs to show that the
denominator in the above de…nition approaches 1 as n ! 1.
E
var
1
Y
n
1
Y
n
1
1
E (Y ) = n = 1
n
n
1
1
2
=
var (Y ) = 2 2n =
2
n
n
n
=
Notice that var (Y =n) ! 0 as n ! 1. Thus, Y =n ! 1 as n ! 1.
So why do we need a random variable which is so similar to something we already know,
the standard normal? Indeed, for large n is doesn’t matter which distribution you use, the
N (0; 1) or tn , but for n < 30 the two distributions are di¤erent. You probably encountered
the t distribution in statistical tests about the mean of a normal population. We will state
two theorems, which will become useful later, when we formally introduce the concept of
random samples.
Theorem 3 Let X1 ; :::; Xn be independent random variables, all with the same normal distribution: Xi
N ( ; 2 ) 8i. In other words, we have a random sample of size n from a
normal population. We de…ne the sample mean and the sample variance as follows:
1X
Xi
n i=1
n
[sample mean] : Xn =
s2n
[sample variance] :
=
1
n
1
n
X
Xi
Xn
2
i=1
Then,
Xn
(1) : Z = p
(2) : Y =
N (0; 1)
2 =n
s2n (n
1)
2
Xn
= p
Y = (n 1)
s2n =n
(4) : Z and Y are independent
(3) : T = p
Z
2
n 1
tn
1
Note the similarity of T and Z. Wen performing a test about a mean of a normal
population, with known variance, we use the quantity in (1), which is called the zstatistic. However, when we don’t know the population variance 2 , we replace it with its
estimator s2n , and the resulting quantity in (3) is called the t-statistic.
We will only prove part (3) here, assuming that we already proved (2) and (4).
Proof.
s
Xn
p
2
2
=n
Z
Xn
Xn
T =p
=q 2
=p
= p
2
2
sn (n 1)
sn
Y = (n 1)
=n
s2n =n
2
(n 1)
1.6. SAMPLING AND ESTIMATORS
Since Y
2
n 1
31
and since Z and Y are independent, we have by de…nition of t distribution
Xn
p
s2n =n
tn
1
This means, that when we replace the population variance
estimator s2n , the resulting quantity has t distribution with n
1.5.4
2
is the z-statistic, with its
1 degrees of freedom.
F-distribution
2
2
De…nition 22 Let Y1
n2 be two independent chi-square random varin1 and Y2
Y1 =n1
ables. Then the ratio Y2 =n2 has F distribution with n1 numerator degrees of freedom and n2
denominator degrees of freedom. This is denoted
F =
Y1 =n1
Y2 =n2
F (n1 ; n2 )
The usefulness of the F distribution is that it allows us to compare the variability of two
samples around their respective means, when the population is normal. Suppose we have two
random samples from the same normal population: X1 ; :::; Xn1 and Z1 ; :::; Zn2 . The sample
variances of these samples are
s2n1
=
sn22 =
1
n1
1
1
n2
1
Then, letting
Y1 =
Y2 =
s2n1
2
sn22
2
n1
X
i=1
n2
X
Xi
Xn1
Zi
Zn2
2
2
i=1
(n1
1)
2
n1 1
(n2
1)
2
n2 1
If Y1 and Y2 are independent (which they are), we have:
F =
Y1 = (n1
Y2 = (n2
s2
1)
= n1
1)
sn22
F (n1
1; n2
1)
So the ratio of two sample variances, based on a normal population, follows F distribution.
This allows us to test hypotheses related to goodness of …t, which will be discussed later.
1.6
Sampling and Estimators
In the section on random variables, in each example the distribution of a random variable,
or at least its mean and variance were given. In reality though, nothing is given, and we
don’t have for example the joint pdf of wages, schooling, experience, etc. The best we can
hope for is collecting a random sample and learn from it about the population.
32
CHAPTER 1. PRELIMINARIES
De…nition 23 A random sample of size n on a random variable X is a set of independent
random variables X1 ; :::; Xn , each with the distribution of X.
The random variable, from which the sample is collected, is sometimes called population.
It is important to understand that before collecting the sample, each Xi is a random variable,
but after the sample is collected, we observe a particular realization xi of observation i. Also
note that each Xi has the same distribution as X, so if X has mean and variance 2 , so
does each Xi . The process of learning from the sample about the population is the purpose of
the …eld of statistics. In particular, a sample is used in order to estimate some parameters
of the population, for example the mean or variance.
De…nition 24 An estimator is a function of a random sample X1 ; :::; Xn .
For example, a sample average is the most popular estimator of the population mean:
1X
Xi
Xn =
n i=1
n
The notation Xn indicates that the average was calculated over a sample of size n. Popular
estimators of population variance 2 are
1X
Xi
n i=1
n
[variance of the sample] : vn =
[sample variance] :
s2n
=
1
n
1
n
X
Xn
Xi
2
Xn
2
i=1
It is important to understand that an estimator is a random variable. Since every observation in the sample, Xi is a random variable, and any function of random variables is also a
random variable, then any estimator is a random variable which has a mean, variance
and pdf. Each time we calculate an estimator from a given sample, we obtain an estimate,
i.e. a particular realization of the estimator.
The next table shows 5 samples of size 10, obtained from a toss of a die X. We know
that E (X) = 3:5, which is the population mean.
1.6. SAMPLING AND ESTIMATORS
33
Notice however that none of the sample averages is equal to 3.5. Does this mean that
something is wrong with Xn as an estimator of the population mean? In general, we would
like to have some criteria by which to judge how "good" is a particular estimator. We will
introduce 3 such criteria: (i) unbiasedness, (ii) e¢ ciency, and (iii) consistency.
1.6.1
Unbiased estimators
The most important property of all estimators, is that they are all random variables. Thus,
each estimator has a mean and a variance. Intuitively, we would like our estimators to be
"correct" on average, which means that we would like the mean of an estimator to be equal
to the population parameter that we estimate.
De…nition 25 Let ^ be an estimator of some parameter
unbiased estimator of if
E ^ =
of population. We say that ^ is
In words, an estimator of some population parameter is unbiased if its expected value
is equal to the true population parameter. If this is not true, the estimator is said to be
biased, and the bias is
bias = E ^
Note that unbiasedness of estimator does not mean that each time it is used, the estimate
equals the true population parameter. Instead, the unbiasedness property means that on
average the estimator equals the true population parameter. Put di¤erently, if we collect
many
s = 1; :::; N , and for each sample we obtain an estimate ^s , then we will have
PN samples
1
^s ! as N ! 1. It turns out that the sample average is an unbiased estimator
s=1
N
of the population mean.
The next …gure illustrates the distribution of two estimators of the parameter , when
the true value is = 2.
The dotted pdf is centered around the true parameter value, and therefore unbiased. Notice
however, that even when we use the biased estimator (solid line), it is possible to get estimates
34
CHAPTER 1. PRELIMINARIES
close to the true value of = 2. On the other hand, even if we use the unbiased estimator
(dotted line), it is possible to obtain estimates that are far from the true value of = 2.
So the fact that we use an unbiased estimator, does not guarantee that the estimate will be
close to the true value of the population parameter.
Theorem 4 Let X1 ; :::; Xn be a random
Pn sample from some population which has mean ,
1
and let the sample average be Xn = n i=1 Xi . Then, Xn is an unbiased estimator of , i.e.
E Xn =
Proof. The key element in this proof, is the fact that E (Xi ) = 8i. This is the property
of a random sample, that the mean of each observation is equal to the population mean.
!
!
n
n
X
1
1X
Xi = E
Xi
E Xn = E
n i=1
n
i=1
1X
1X
=
E (Xi ) =
n i=1
n i=1
n
=
n
1
n =
n
This means that our method of estimating the population mean is on average correct, but only by coincidence will we ever obtain an estimate which is exactly equal to the
population parameter.
Exercise 29 Let X1 ; X2 ; X3 be a random sample. Consider the following estimators of the
population mean :
(a) ^1 = 31 X1 + 13 X2 + 31 X3
(b) ^2 = 14 X1 + 12 X2 + 41 X3
(c) ^3 = 21 X1 + 12 X2 + 41 X3
Check whether these estimators are biased or not. If an estimator is biased, …nd its bias.
Theorem 5 Let X1 ; :::; Xn be a random sample from some population which has variance
P
2
2
, and vn = n1 ni=1 Xi Xn . Then, vn is a biased estimator of 2 .
Proof. By de…nition of
2
2
2
, we have for all i:
h
2
= E (Xi
) = E Xi
h
2
= E Xi Xn + Xn
Sum over all i and divide both sides by n:
" n
n
1X
1X
2
2
=E
Xi Xn +
Xn
n i=1
n i=1
2
Xn + Xn
2
+ 2 Xi
2
i
Xn
1
+ 2 Xn
n
Xn
n
X
i=1
i
Xi
Xn
#
1.6. SAMPLING AND ESTIMATORS
Notice that
Pn
i=1
Xn = 0, because
Xi
n
X
Xi
Xn =
i=1
and Xn =
1
n
Pn
i=1
35
n
X
n
X
Xi
i=1
Xi . Thus, we have
2
6 n
61 X
= E6
Xi
6n
4 i=1
|
{z
2
2
= E (vn ) +
vn
n
X
1
n
Xn =
i=1
i=1
n
X
Xi
nXn
i=1
3
7
7
7
5
1X
+
Xn
n i=1
n
Xn
E
|
2
= E (vn ) + var Xn
2
= E (vn ) +
h
2
}
Xn
{z
var(Xn )
2
27
i
}
2
n
2
2
E (vn ) =
Thus, the bias of vn is
n
2
n
=
2
n
1
n
, which means that vn underestimates the population variance.
Theorem 6 Let X1 ; :::; Xn be a random sample from some population which has variance
P
2
2
, and let s2n = n 1 1 ni=1 Xi Xn . Then, s2n is an unbiased estimator of 2 .
Proof. Notice that
s2n =
E s2n
=
n
n
1
n
n
1
vn
E (vn ) =
n
n
2
1
n
1
n
=
2
As a result of the last theorem, it is common to refer to s2n as the sample variance or
as the unbiased estimator of population variance.
1.6.2
E¢ cient estimators
The most important property of all estimators, is that they are all random variables. Thus,
each estimator has a mean and a variance. In the last section we stated that it would be nice
if an estimator is "correct" on average, i.e. unbiased. Suppose we have several estimators,
all of which are unbiased, how do we choose between them? Intuitively, if two estimators ^1
and ^2 are both unbiased, and var ^2 < var ^1 , then we would prefer estimator ^2 over
^1 . Smaller variance of an estimator means that the estimator is more accurate or more
precise.
36
CHAPTER 1. PRELIMINARIES
De…nition 26 Suppose ^1 ; :::; ^N are all unbiased estimators of the population parameter
, and suppose that ^i has the smallest variance among all of them. Then we say that ^i
is e¢ cient (or best unbiased or minimum-variance) estimator among the N unbiased
estimators which we compare.
The next …gure illustrates two estimators of the population parameter, whose true value
is = 2. Both of these estimators are centered around the true population parameter = 2,
i.e. both are unbiased.
Notice however, that the dashed line (labeled ine¢ cient) has greater variance than that of
the e¢ cient estimator. Whether we use the e¢ cient or ine¢ cient estimator, there is a chance
of getting an estimate far from the true value = 2. However, when we use the e¢ cient
estimator the chances that we will obtain an estimate way o¤ the true value are smaller than
with ine¢ cient estimator.
1.6.3
Con‡icts between bias and low variance
What if we have two estimators, ^1 unbiased, and ^2 which is biased, and var ^2
<
var ^1 ? Thus, the second estimator is biased, but it is more precise. How do we choose
1.6. SAMPLING AND ESTIMATORS
37
between ^1 and ^2 ? The next …gure illustrates such a dilemma.
The dashed line is the pdf of an unbiased estimator, while the solid line is the pdf of a biased
estimator. However, the biased estimator has lower variance, which is a nice property.
One way to choose between estimators that might be biased, is to construct a loss
function L (variance,bias), and calculate which estimator leads to smaller loss (less bad).
A popular loss function is mean square error:
M SE of estimator = var (estimator) + bias (estimator)2
We square the bias because it can be positive or negative number, both of which are equally
bad. Thus, the loss function is increasing in two things that are bad: variance and bias. We
will choose the estimator which gives the smallest M SE.
For example, consider two estimators ^1 and ^2 :
^1 ^2
variance 1.5 3
bias
-1 0
Which estimator would we choose based on the M SE criterion?
M SE ^1
= 1:5 + ( 1)2 = 2:5
M SE ^2
= 3 + 02 = 3
The estimator ^1 has lower MSE, and therefore we will prefer it to ^2 , despite the fact that
^1 is biased. The smaller variance of ^1 turns out to more than compensate for the bias.
Remark. In this course you will not be required to design estimators. Designing estimators that overcome various statistical problems is a very complicated task, and several
Nobel prizes in economics were awarded for development of new estimators. What you will
do in this course is to analyze whether a given estimator is biased or not, …nding an e¢ cient
estimator among a group of unbiased estimators, and applying the minimum M SE criterion
in cases of tradeo¤ between bias and variance.
38
CHAPTER 1. PRELIMINARIES
Exercise 30 Consider the following estimators of the population mean :
(a) ^1 = 13 X1 + 13 X2 + 31 X3
(b) ^2 = 14 X1 + 12 X2 + 41 X3
(c) ^3 = 81 X1 + 34 X2 + 81 X3
Verify whether these estimators are biased or not, and …nd the e¢ cient estimator (among
the unbiased).
1.6.4
Consistent estimators
Our previous discussion about estimators implicitly assumed that the sample size is …xed.
In reality though it is sometimes possible (although costly) to increase the size of a sample.
Intuitively, we realize that larger sample size is "better" in some sense, but what exactly
happens to an estimator when the sample size goes up? For most estimators that we consider,
the variance of an estimator decreases
Pn as the sample size increases. For example, consider
1
the sample average be Xn = n i=1 Xi as an estimator of the population mean . The
variance of this estimator vanishes, as the samples size goes to in…nity:
!
n
n
2
1X
1 X
1
var Xn = var
Xi = 2
var(Xi ) = 2 n 2 =
n i=1
n i=1
n
n
2
lim var Xn
=0
n
This means that as the sample size becomes very large, the variance of this estimator converges to zero, which means that the estimator becomes a constant number. The next …gure
illustrates what happens to the distribution of Xn as the sample size n increases.
n!1
=
lim
n!1
All the curves in the above …gure illustrate the pdf of the same estimator Xn , but for di¤erent
sample sizes n.
This example is not unique, and in fact many estimators converge to some constant number, as the sample size becomes in…nitely large. However, we would also like the estimator to
converge to the true population parameter which we are trying to estimate. Such estimator
is called consistent.
1.6. SAMPLING AND ESTIMATORS
39
De…nition 27 An estimator ^n , based on the sample X1 ; :::; Xn , of a true population parameter , is consistent if for all " > 0
lim P
n!1
^n
>" =0
The de…nition requires that the probability that an estimator is more than " away from
the true population parameter should become smaller when we increase the sample size. The
limit in the de…nition is called probability limit, or plim in short, so we can write instead of
limn!1 P ^n
> " = 0,
plim ^n =
In practice, we don’t use the de…nition to check whether an estimator is consistent or
not. Instead we have the following test.
Theorem 7 An estimator ^n is consistent if (i) var ^n
bias ^n ! 0 as n ! 1.
! 0 as n ! 1, and (ii)
In other words, both the bias and the variance of an estimator should vanish as the
sample size becomes in…nitely large. From the above theorem, we learn that if an estimator
is unbiased, for it to be consistent we only need to check that its variance goes to zero when
the sample size goes to in…nity.
P
For example, we had seen that the sample mean, Xn = n1 ni=1 Xi , is an unbiased estima2
tor of the population mean. We also showed that limn!1 var Xn = limn!1 n = 0. This
means that Xn is a consistent estimator of the sample mean. We write:
plim Xn =
This is a very general result, called the law of large numbers. In words it means that
the sample mean, regardless of the underlying population, converges (in probability) to the
population mean.
~ n = 1 Pn Xi be an estimator of the population mean based on the
Exercise 31 Let X
i=1
n+1
sample X1 ; :::; Xn .
~ n is biased estimator of the population mean, and derive the bias.
(a) Show that X
~
(b) Show that Xn is consistent estimator of the population mean.
Why would anybody care about consistency of an estimator? After all, in reality there
are no cases where a researcher can use an in…nite sample size, so all samples in practice
are …nite. The …rst reason is that in econometrics, we are often forced to use a biased
estimator. However, when the sample size is big enough, the bias becomes negligible. For
example, see the last exercise. The second reason is that sometimes it is hard or impossible to
check whether an estimator is biased or not in …nite samples. The math is too complicated
sometimes. On the other hand, it is much easier to check whether a given estimator is
consistent. It is better to be able to say that the bias is becoming small when the sample
becomes big, than not being able to say anything about the bias.
40
1.6.5
CHAPTER 1. PRELIMINARIES
Distribution of estimators
So far we focused attention on the mean and variance of estimators. Can we …nd out the
entire distribution of an estimator (i.e. its pdf)? In this section we plot the pdfs of estimators
in order to illustrate concepts such as bias, e¢ ciency, consistency. Indeed, sometimes we can
…gure out the entire distribution of an estimator, if we are willing to make assumptions about
the distribution of population from which the sample is collected. At other times, we are
able to …nd the asymptotic distribution of an estimator, i.e. its limiting distribution as
the sample size becomes large. The advantage of knowing the distribution of estimators, is
that we can conduct statistical tests. The next two results give the distribution of estimators
based on samples from normal population.
Theorem 8 Suppose that X1 ; :::; Xn is a random sample from normal distribution, i.e. Xi s
are independent and each Xi N ( ; 2 ). Then
1X
Xi
Xn =
n i=1
n
2
N
;
n
This means that the sample mean, based on a sample from normal population, is also
normally distributed. Notice that the variance of Xn declines to zero as the sample size gets
large.
Theorem 9 Suppose that X1 ; :::; Xn is a random sample from normal distribution, i.e. Xi s
are independent and each Xi N ( ; 2 ).
s2n (n
1)
2
=
n
X
Xi
Xn
2
2
n 1
i=1
This means that the sample variance, based on a sample from normal population, when
scaled by (n 1) = 2 , has a chi-square distribution, with n 1 degrees of freedom.
Exercise 32 Suppose that X1 ; :::; Xn is a random sample from normal distribution, and let
Y =
s2n (n
1)
2
What is the mean and variance of Y ?
Obviously in reality we never have samples from exactly normal populations. In fact,
most populations that you can imagine are not normal. In such cases, we can still say
something about the limiting distribution of some estimators. This is accomplished with
the help of the Central Limit Theorem, presented above. The CLT says that the sample
mean based on any population converges to a normal distribution when the sample size
gets large:
D
Xn ! N
2
;
n
Using extensions of the above CLT, statisticians often can derive an asymptotic distribution
of their estimators, i.e. an approximate distribution, with the approximation improving as
the sample size gets large.
Chapter 2
Simple Regression Analysis
In section 1.4.3 we introduced covariance and correlation, which measure the degree of comovement between a pair of random variables. Sometimes economic theory suggests that
one variable, usually known as the dependent variable, is determined by other variables,
usually known as explanatory variables, independent variables, or regressors. For
example, economic theory suggests that the quantity demanded of some good X depends on
its price, income of buyers, prices of other related goods:
QD
X = f (PX ; I; Pother )
The purpose of regression analysis is to quantify this relationship. The correlation analysis
might tell us that the price of a good PX and the quantity demanded QD
X are negatively correlated, but regression analysis attempts to estimate the function f itself. Consequently,
regression analysis allows researchers to predict (i) the percentage change in quantity demanded when the price goes up by 1%, (ii) the percentage change in quantity demanded
when the buyers income goes up by 1%, (iii) the percentage change in quantity demanded
when a price of related good goes up by 1%.
The importance of answering such questions is immense. For example, our faculty Sudip
Chattopadhyay, studies the e¤ectiveness of Tobacco Control Programs and the impact of
cigarette taxes on the demand for cigarettes in "State-Level Tobacco Control Programs
and the Demand for Cigarettes: A Retrospective Analysis Using Panel Data" (With David
Pieper). Another area where regression analysis is widely used is in estimation of wage equations. This area attempts to quantify the e¤ect of schooling, experience, gender, race, and
other demographics, on the wages earned by individuals. For example, our faculty Don Mar,
studies whether there is discrimination against Asian American women in "Asian American
Women Professionals: Does Discrimination Exist?".
In general, regression analysis attempts to estimate the relationship between a dependent
variable Y and some regressors (explanatory variables) X1 ; :::; Xk , i.e. Y = f (X1 ; :::; Xk ).
We start with simple regression analysis, where we assume only one explanatory variable
X. We also assume that f ( ) is a linear function, and all other factors that a¤ect Y , whether
they are observed or unobserved, will be summarized by a random variable u, known as the
disturbance term or error term. Thus, the simple regression model is:
Yi =
1
+
41
2 Xi
+ ui
(2.1)
42
CHAPTER 2. SIMPLE REGRESSION ANALYSIS
where Yi is the value of the dependent variable in observation i, Xi is the value of the
explanatory variable in observation i, 1 and 2 are two unknown population parameters
(which we will estimate) and ui is the disturbance term of observation i. We can view the
right hand side of (2.1) as the sum of (i) 1 + 2 Xi , the nonrandom component, and (ii) ui ,
the random component. The next section shows how we can obtain estimates of 1 and 2 ,
given a sample of Y1 ; :::; Yn ; X1 ; :::; Xn .
2.1
Deriving the OLS Estimators
This section derives the Ordinary Least Squares estimators for the unknown parameters
1 and 2 . At this point we assume that we don’t know anything about the distribution of
the disturbance term ui , and we de…nitely don’t know the population parameters 1 and 2 .
All we have is a sample of values for dependent variable Y and regressor X, i.e. we have
2n numbers: Y1 ; :::; Yn ; X1 ; :::; Xn (data). For any estimates b1 and b2 we de…ne the …tted
model (or estimated model).
Y^i = b1 + b2 Xi
where Y^i is the …tted value (or predicted value) of Yi .
The question is, how do we obtain "good" estimates b1 and b2 ? Intuitively, we want the
…tted values Y^i to …t "well" the actual values Yi . We de…ne ei to be the residual associated
with each observation:
ei = Yi Y^i = Yi b1 b2 Xi
These ei s can be thought of as prediction errors. According to the OLS method, the estimates
bOLS
, bOLS
should be chosen so that we minimize the Residual Sum of Squares, RSS:
1
2
n
n
X
X
2
RSS =
ei =
(Yi b1 b2 Xi )2
i=1
i=1
of the true parameters
bOLS
De…nition 28 The OLS estimators
2
values of b1 and b2 which minimize the RSS. Formally,
n
X
OLS OLS
b1 ; b2 = arg min
(Yi b1 b2 Xi )2
,
bOLS
1
b1 ;b2
1,
2
are the
i=1
The OLS estimators can be derived using standard calculus techniques.
n
X
@RSS
=
2 (Yi b1 b2 Xi ) = 0
[b1 ] :
@b1
i=1
@RSS
[b2 ] :
=
@b2
n
X
2 (Yi
b1
b2 Xi ) Xi = 0
i=1
Rearranging the above equations, after canceling 2, gives the so called normal equations:
n
n
X
X
Yi nb1 b2
Xi = 0
(2.2)
i=1
n
X
i=1
Yi Xi
b1
i=1
n
X
i=1
Xi
b2
n
X
i=1
Xi2 = 0
(2.3)
2.1. DERIVING THE OLS ESTIMATORS
43
From (2.2) we have
1X
Yi
n i=1
1X
b2
Xi = b1
n i=1
n
n
b1 = Y
Substituting this into (2.3), gives:
n
X
Yi Xi
Y
i=1
n
X
b2 X n X
n X Y + b2 n X 2
Yi Xi
b2
b2
i=1
n
X
Xi2 = 0
Xi2 = 0
i=1
i=1
Thus,
n
X
b2 X
Pn
nX Y
i=1 Yi Xi
= P
n
2
nX 2
i=1 Xi
This formula can be rewritten in a way which is more intuitive and more useful. We need
two results:
n
n
X
X
[Result 1] :
Xi X Yi Y =
Xi Yi Xi Y XYi + X Y
bOLS
2
i=1
=
=
=
n
X
i=1
n
X
i=1
n
X
i=1
Xi Yi
Y
n
X
Xi
X
i=1
Xi Yi
nX Y
Xi Yi
nX Y
n
X
Yi +
i=1
n
X
XY
i=1
nX Y + nX Y
i=1
[Result 2]
:
n
X
Xi
X
2
=
i=1
=
n
X
=
=
i=1
n
X
Xi2
2Xi X + X 2
i=1
Xi2
i=1
n
X
n
X
2X
n
X
Xi +
i=1
Xi2
2nX 2 + nX 2
Xi2
nX 2
n
X
X2
i=1
i=1
Thus, using result 1 for the numerator of bOLS
and result 2 for the denominator, we have
2
the OLS estimators:
Pn
X Yi Y
i=1 Xi
OLS
(2.4)
b2
=
Pn
2
X
X
i
i=1
bOLS
= Y
1
bOLS
X
2
(2.5)
44
CHAPTER 2. SIMPLE REGRESSION ANALYSIS
Thus, the slope estimator bOLS
can be viewed as the ratio of the sample covariance
2
between X and Y to the variance of X.1
bOLS
=
2
rXY sX sY
sY
sXY
=
= rXY
2
2
sX
sX
sX
will be
Thus, if X and Y are positively correlated in the sample, the slope estimate bOLS
2
positive. The magnitude of the slope depends on the variation of Y around its mean relative
to the variation of X around its mean. From equation (2.5) we see that the estimated
regression line passes through the sample averages point X; Y . So after obtaining an
estimate for the slope b2 , we need two additional numbers to …nd the intercept: sample
mean of X and sample mean of Y .
2.2
Graphical Illustration of OLS
The next …gure illustrates the OLS estimation from the previous section. The diamond dots
represent the true data points (Yi ; Xi ), and the …tted values are given by Y^i = b1 + b2 Xi .
Notice that the …tted line cannot pass through all the data points, unless all the data lies on a
straight line (ui = 0 for all i). The residuals ei = Yi Y^i represent the di¤erence between the
actual values of the dependent variable, Yi , and the …tted values of the dependent variable,
Pn
2
n
n
The variance of the sample fXi gi=1 is s2X = n1 i=1 Xi X and the covariance between fXi gi=1
p
p
P
n
n
and fYi gi=1 is sXY = n1 i=1 Xi X Yi Y . With standard deviations sX = s2X and sY = s2Y ,
the correlation between the two samples is de…ned as rXY = ssXXY
sY .
1
2.3. INTERPRETATION OF ESTIMATED REGRESSION
45
Y^i . The above …gure illustrates the residual for observations 6, e6 = Y6 Y^6 , and the residual
for observation 12, e12 = Y12 Y^12 . Similarly, one can …nd the residuals for all the 16
observations in this sample.
Notice that some of the residuals are negative (when the true Yi is below the …tted Y^i ),
while others are positive (when the true Yi is above the …tted Y^i ). Both types of residuals
represent prediction errors and are equally important. For that reason, we try to pick b1
and b2 to minimize the the Residual Sum of Squares, RSS:
RSS =
n
X
i=1
e2i
=
n
X
(Yi
b1
b2 Xi )2
i=1
The estimators b1 and b2 chosen in such a way are called the OLS estimators.
2.3
Interpretation of Estimated Regression
After estimating the regression model, you get the …tted equation (also called predicted
equation, or estimated equation):
Y^i = b1 + b2 Xi
Always remember that the chances are that the estimates b1 and b2 are not going to be
exactly the same as the true population parameters 1 and 2 , and if by any chance they
are exactly equal, you will never …nd that out. To interpret the slope coe¢ cient, we say that
based on our estimates, we predict that an increase in X by one unit will change Y by b2
units. When interpreting the slope coe¢ cient it is important to know exactly what are the
units of X and Y . Suppose that Y is hourly wage in dollars, and X is schooling in years,
and suppose that b2 = 2:5. Then we say that an increase in schooling by 1 year is predicted
to increase hourly wage by $2:5 per hour.
The estimate of the constant, b1 , usually does not have a sensible interpretation. Mathematically, b1 is the predicted value of the dependent when Xi = 0. Often, this mathematical
interpretation does not make sense. For example, suppose that we regress persons’weight on
their height (i.e. Yi is person’s i weight and Xi person’s i height). In this case, the estimate
b1 is the predicted weight of a person with zero height. Obviously, in reality it is not possible
to have zero height of a person. In addition, the value of b1 can be negative, which means
that the predicted weight of a person is negative - which is impossibility. Therefore, when
regression results are interpreted, we will focus primarily on the slope coe¢ cients.
2.4
Results About the Estimated Model
Theorem 10 Suppose that the true regression model is Yi = 1 + 2 Xi + ui and we …t an
equation Y^i = b1 + b2 Xi using OLS based on the sample Y1 ; :::; Yn ; X1 ; :::; Xn . Then:
(a) e = 0;
(b) P
Y^ = Y ;
(c) ni=1 Xi ei = 0;
P
(d) ni=1 Y^i ei = 0:
46
CHAPTER 2. SIMPLE REGRESSION ANALYSIS
Proof. (a) The average (and the sum) of residuals in the sample is zero: e = 0.
1X
e =
(Yi
n i=1
n
1
nY
n
= Y b1
=
b1
b2 Xi )
nb1
b2 n X
b2 X = 0
The last equality follows from the …rst order condition for optimal b1 , equation (2.2).
(b) The average of the predicted values for the dependent variable in the sample is equal
to the average of the true values of the dependent variable in the sample: Y^ = Y .
1X^
1X
(Yi
Yi =
n i=1
n i=1
n
n
ei )
1X
Yi
=
n i=1
| {z }
1X
ei = Y
n i=1
| {z }
n
n
0
Y
Pn
(c) i=1 Xi ei = 0. This says that the sample covariance between the explanatory variable
and the residual is zero.
n
n
X
X
Xi ei =
Xi (Yi b1 b2 Xi )
i=1
=
i=1
n
X
Xi Yi
b2 Xi2
b1 Xi
i=1
=
n
X
Xi Yi
b1
i=1
n
X
Xi
i=1
b2
n
X
Xi2 = 0
i=1
The lastPequality follows from equation (2.3).
(d) ni=1 Y^i ei = 0. This says that the sample covariance between the predicted values of
dependent variable and the residual is zero.
n
X
i=1
Y^i ei =
n
X
(b1
b2 Xi ) ei
i=1
n
X
= b1
ei
b2
|i=1
{z }
0 from (a)
2.5
Goodness of Fit: R2
We know that for each observation i we have
Yi = Y^i + ei
n
X
Xi ei = 0
|i=1{z }
0 from (c)
2.6. IMPACT OF CHANGES IN UNITS
47
intuitively, "good" …t of the model means that the predicted (or …tted) values Y^i are close
to the true values Yi . Thus,
Yi
Yi
n
X
i=1
n
X
2
Y
Yi
n
X
=
2
Y
2
Y + ei
=
2
Y^i
i=1
n
X
i=1
n
X
Y + ei
Y^i
=
2
Y
Yi
= Y^i
Y
Y + ei
2
Y^i
Y
+ 2 Y^i
Y ei + e2i
i=1
Yi
2
Y
n
X
=
i=1
2
Y^i
Y
+2
i=1
2
Y^i
Y ei = 2
Thus, we obtain the following.
i=1
|
n
X
Y^i ei
Y
i=1
i=1
n
X
Yi
{z
T SS
Y
Y^i
Y ei +
i=1
Notice that from theorem 10 we have
n
X
n
X
2
}
=
n
X
i=1
|
Y^i
n
X
2
{z
ESS
+
}
e2i
i=1
ei
i=1
Y
n
X
n
X
!
e2i
=0
(2.6)
i=1
| {z }
RSS
The term labeled T SS represents the Total Sum of Squares, i.e. the variation of the
dependent variable from its mean. We showed that this variation is a sum of two parts: (i)
ESS, i.e. Explained Sum of Squares and (ii) RSS, i.e. Residual Sum of Squares
(or unexplained). Basically, equation (2.6) tells us that the total variation of the dependent
variable from its sample mean, is in part explained by the …tted model (ESS), and in part
unexplained (RSS).
This gives rise to the measure of goodness of …t:
R2 =
ESS
T SS
The R2 therefore gives the fraction of the total variation of the dependent variable from its
sample mean, which is explained by the …tted model. Notice that 0
R2
1, and the
2
maximal R = 1 is obtained when RSS = 0 (when there is no unexplained part).
2.6
Impact of Changes in Units
Suppose that two researchers are studying the relationship between the same variables, and
even use the same sample, but the units are di¤erent. For example, one researcher uses
inches to measure length, and another uses centimeters, or one researcher uses pounds to
measure weight, while another uses kilograms. The question we study in this section is, what
happens to the OLS estimates when we switch to di¤erent units.
48
2.6.1
CHAPTER 2. SIMPLE REGRESSION ANALYSIS
Multiplying the data by constant
Suppose the sample of one researcher is X = fX1 ; :::; Xn g and Y = fY1 ; :::; Yn g, and another
researcher uses X = aX, and Y = cY , where a and c are some constants. This situation
arises when the …rst researcher uses inches for height and pounds for weight, and the second
uses centimeters and kilograms. Let the estimates of the …rst researcher be b1 , b2 and of the
second be b1 , b2 . Thus,
Pn
Pn
X Yi Y
aX
a
X
cY
c
Y
c
c
i
i
i=1 Xi
i=1
=
= b2
b2 =
Pn
Pn
2
2
a
a
aX
X
i=1 aXi
i=1 Xi
c
b1 = Y
b2 X = c Y
b2 aX = c Y b2 X = cb1
a
To summarize, the OLS estimators based on the transformed data set are related to those
based on the original data set as follows:
c
b2
a
= cb1
b2 =
b1
2.6.2
Adding a constant to the data
Suppose the sample of one researcher is X = fX1 ; :::; Xn g and Y = fY1 ; :::; Yn g, and another
researcher uses X = X + h, and Y = Y + k, where h and k are some constants. Let the
estimates of the …rst researcher be b1 , b2 and of the second be b1 , b2 . Thus,
Pn
Y +k
X +h
Yi + k
i=1 Xi + h
= b2
b2 =
Pn
2
X +h
i=1 Xi + h
b1 = Y
b2 X = Y + k
b2 X + h = Y
b2 X + k
b2 h = b1 + k
b2 h
To summarize, the OLS estimators based on the transformed data set are related to those
based on the original data set as follows:
b2 = b2
b1 = b1 + k
2.6.3
b2 h
Multiplying by constant and adding a constant to the data
Suppose the sample of one researcher is X = fX1 ; :::; Xn g and Y = fY1 ; :::; Yn g, and another
researcher uses X = aX + h, and Y = cY + k, where h and k are some constants. An
example of such case is temperature measured in Fahrenheit v.s. Celsius: F = 95 C + 32. Let
the estimates of the …rst researcher be b1 , b2 and of the second be b1 , b2 . Thus,
Pn
aX + h
cYi + k
cY + k
c
i=1 aXi + h
= b2
b2 =
Pn
2
a
aX + h
i=1 aXi + h
c
c
c
b1 = c Y + k
b 2 aX + h = c Y b 2 X + k
b2 h = cb1 + k
b2 h
a
a
a
2.7. RESTRICTED MODELS
49
To summarize, the OLS estimators based on the transformed data set are related to those
based on the original data set as follows:
c
b2
a
= cb1 + k
b2 =
b1
c
b2 h
a
The purpose of these exercises with transformed data is to increase awareness to the fact
that changes in units do a¤ect the estimated coe¢ cients and their interpretation.
2.7
Restricted Models
Recall that the original model that we estimate in this chapter has both intercept and slope:
Yi =
1
+
2 Xi
+ ui
In this section we consider special cases of this model, (i)
(i) : Yi =
(ii) : Yi =
2.7.1
= 0, and (ii)
2
= 0.
2 Xi
+ ui
1 + ui
1
=0
2 Xi
+ ui
Model with no intercept,
1
The model we wish to estimate is
Yi =
and the …tted equation is
Y^i = b2 Xi
Therefore, the OLS estimator of
2
minimizes the Residual Sum of Squares:
min
b2
n
X
(Yi
b2 Xi )2
i=1
The …rst order condition:
2
n
X
(Yi
b2 Xi ) Xi = 0
i=1
n
X
i=1
Yi Xi
b2
n
X
Xi2 = 0
i=1
b2
Pn
Yi Xi
= Pi=1
n
2
i=1 Xi
There isn’t much we can say about this model. For example, the …tted equation does
not necessarily pass through the sample means point X; Y . In order to prove that a claim
50
CHAPTER 2. SIMPLE REGRESSION ANALYSIS
is false, one only needs just one counter example. So here is a counter example Suppose that
the data consists of two observations on X and Y :
X
0
1
Y
1
2
Notice that X = 0:5, and Y = 1:5. The slope estimate is
0 1+1 2
=2
02 + 12
b2 =
The …tted equation is
Y^i = 2 Xi
When plugging Xi = X, we get
Y^i = 2 X = 2 0:5 = 1 6= Y = 1:5
The general practice in applied research is never to set the intercept to zero. Therefore,
the model Yi = 2 Xi + ui has no practical interest for us, and only serves as an exercise.
2.7.2
Model with no slope,
2
=0
The model we wish to estimate is
Yi =
+ ui
1
and the …tted equation is
Y^i = b1
Therefore, the OLS estimator of
1
minimizes the Residual Sum of Squares:
min
b1
n
X
(Yi
b1 )2
i=1
The …rst order condition:
2
n
X
(Yi
b1 ) = 0
i=1
n
X
Yi
i=1
n
X
b1 = 0
i=1
nY
nb1 = 0
b1 = Y
Intuitively, we are trying to predict (or …t) the dependent variable with just one number.
According to OLS, this number should be the sample average of Y . This model is obviously
useless, because it de…es the purpose of regression analysis - estimating a relationship between
a dependent variable Y and some other explanatory variables. The model Yi = 1 + ui
does not utilize any dependence of Y on any other variable, and is presented here only as an
exercise.
Chapter 3
Properties of Regression Coe¢ cients
and Hypothesis Testing
In the previous chapter we studied how to estimate the simple regression model:
Yi =
1
+
2 Xi
+ ui
The OLS (Ordinary Least Squares) estimators of 1 and 2 are:
Pn
X Yi Y
i=1 Xi
b2 =
Pn
2
X
i=1 Xi
b1 = Y
b2 X
This chapter discusses the properties of these estimators. In order to study the properties
of these estimators, we need to make several assumptions about the simple regression model
being estimated. Then we will show that with these assumptions, the OLS estimators b1 and
b2 are unbiased, e¢ cient, and consistent estimators of 1 and 2 .
3.1
Assumptions
A.0 The regressor X is non-random. In other words, the values of Xi for each observation i were hand-picked. For example, if X is schooling in years, with values
0; 1; 2; :::; Smax , then we include in our sample a certain number of people from each
education level. Relaxing this assumption will not change the results, but the math is
a bit simpler with A:0 assumption.
A.1 The model is linear in parameters and has the following form:
Yi =
1
+
2 Xi
+ ui
An example of a model which is nonlinear in parameters, is Yi = 1 Xi 2 + ui , and such
model cannot be estimated by OLS (Ordinary Least Squares). Nonlinear models can
be estimated using some other technique, for example NLS (Nonlinear Least Squares).
51
52CHAPTER 3. PROPERTIES OF REGRESSION COEFFICIENTS AND HYPOTHESIS TESTING
A.2 There is some variation in the regressor in the sample. For example, if X is
schooling we must make sure that our sample consists of at least two di¤erent values for
X. Imagine if we studied the relationship between schooling and wages, and everybody
in our sample had 16 years of schooling. Intuitively, such sample would not allow us
to estimate the relationship between schooling and wages. Indeed, when you look at
the formula for the slope estimator, you see that when Xi = X 8i, we cannot even
calculate a value of b2 because the formula gives us 00 . If there is no variation in a
regressor in your sample, Stata will drop that regressor from your estimated equation.
A.3 The disturbance (error) term has zero expectation.
E (ui ) = 0 for all i
This assumption must hold from the de…nition of 1 (the intercept), which is the
conditional mean of the dependent variable given that the regressors are zero.
1
= E (Yi jXi = 0) = E (
1
+ ui ) =
1
+ E (ui )
This implies that E (ui ) = 0 for all i.
A.4 The disturbance (error) term is homoscedastic.
var (ui ) =
2
u
for all i
Chapter 8 in these notes discusses what happens when this assumption is violated, and
we call this problem heteroscedasticity.
A.5 The disturbance (error) terms are independent. This means ui and uj are
statistically independent random variables for all i 6= j. Remember that the error
term ui combines all the factors besides Xi that a¤ect the dependent variable Yi . For
example, if Y is wage and X is schooling, then the error term re‡ects all factors
(observed and unobserved) that a¤ect wages, besides schooling. For example, ui might
re‡ect luck, motivation, ambition, work experience, IQ, gender, race, etc. of individual
i. The current assumption says that these factors for individual i are independent of
the same factors possessed by individual j. If this assumption is violated, the resulting
problem is called autocorrelation.
3.2
Mean and Variance of OLS Estimators
We start with deriving a very useful result about any sample.
Theorem
11 Let X1 ; :::; Xn be a sample of numbers, and let the sample average be X =
Pn
1
X
.
i Then
i=1
n
n
X
Xi X = 0
i=1
In words, this theorem says that the sum of deviations of all the observations in a sample,
from the sample mean is always zero (in any sample).
3.2. MEAN AND VARIANCE OF OLS ESTIMATORS
Proof.
n
X
Xi
n
X
X =
i=1
n
X
Xi
i=1
53
X = nX
nX = 0
i=1
This result should not be confused with the sum of squared deviations of observations
from the sample mean. Intuitively, the mean of a sample is such a number that is located in
the "middle" of the sample. So some observations are below the mean and some are above
it. When you add up all the deviations from the mean, the negative deviations and positive
ones cancel each other. This is not the case with sum of squared deviations from the mean,
because all the squared deviations are positive and they don’t cancel out with each other.
P
2
The only time we have ni=1 Xi X = 0 is when all the Xi s are the same, so Xi = X 8i.
Pn
Corollary 1 For any …xed number a, we have
3.2.1
Xi
i=1
X a = 0.
Rewriting The OLS Estimators
We now rewrite the formulas of the OLS estimators, in such a way that would allow us to
calculate their mean and variance, starting with b2 .
b2 =
=
=
=
=
=
Pn
Xi
Pn
Pn
i=1
Xi
i=1
Xi
Pn
i=1
2+
2
+
(
1+
Pn
X
Pn
2 Xi
2 Xi
n
X
n
X
X
Pn
Xi
Xi
i=1
Xi
2
X +
Pn
i=1
Pn
Xi
j=1
X
2X
+
2X
+u
u
X + (ui
X
Pn
Xi
X
X
u)
2
i=1
Xj
1
2
2
X
Xi
2
+ ui )
+ ui
Xi
i=1
i=1
2
X
X
Y
2
i=1
Pn
Pn
Yi
Xi
Xi
i=1
i=1
=
X
i=1
Xi
X
!
2
X (ui
u)
2
ui
ai u i
i=1
Thus, we expressed the slope estimator b2 as the sum of the true slope
average of the error terms, with weights
ai = Pn
Xi
j=1
Xj
X
X
2
2
and a weighted
54CHAPTER 3. PROPERTIES OF REGRESSION COEFFICIENTS AND HYPOTHESIS TESTING
Since the observations on the regressor, X, are non-random (assumption A.0), it follows that
the ai are constant numbers.
Similarly, we now rewrite the intercept estimator b1 .
b1 = Y
=
b2 X
1
+
2X
+u
2
+
n
X
i=1
1X
ui
n i=1
n
=
1+
=
1
=
1
=
1
+
+
+
n
X
1
n
n
X
ai u i X
ai u i
i=1
1
ui
n
i=1
n
X
i=1
n
X
X
!
Xai ui
Xai ui
ci ui
i=1
Thus, we expressed the intercept estimator b1 as the sum of the true intercept
weighted average of the error terms, with weights
ci =
3.2.2
1
n
1
and a
Xai
Unbiasedness of OLS estimators
In the last section we rewrote the OLS estimators as a sum of the true parameter and a
weighted average of the error terms.
b2 =
b1 =
2
1
+
+
n
X
i=1
n
X
ai u i
(3.1)
ci ui
(3.2)
i=1
Remember that since the observations on X are non-random, the weights ai and ci are also
non-random. Taking expectation of b2 :
!
n
X
E (b2 ) = 2 + E
ai u i
i=1
=
2
+
n
X
ai E (ui )
(by assumption A.0, Xi s are …xed)
i=1
=
2
(by assumption A.3, E (ui ) = 0 8i)
This result proves that b2 is an unbiased estimator of
2.
3.2. MEAN AND VARIANCE OF OLS ESTIMATORS
The proof that b1 is an unbiased estimator of
!
n
X
E (b1 ) = 1 + E
c i ui
1
55
is similar:
i=1
=
1
+
n
X
ci E (ui )
i=1
=
1
(because of assumption A.3, E (ui ) = 0 8i)
This proves that due to assumption A.3 (E (ui ) = 0 8i), both b1 and b2 are unbiased estimators of 1 and 2 .
3.2.3
E¢ ciency of OLS estimators
Unbiasedness is one good property of estimators, but even when you use unbiased estimators,
you can obtain estimates that are far away from the true values of the population parameters.
We therefore would like to know how precise or accurate the OLS estimators are. In other
words, we would like the OLS estimators to have the smallest possible variance. We start
with the variance of b2 , using formula (3.1).
!
n
n
X
X
a2i var (ui )
var (b2 ) = var
ai u i =
2+
i=1
i=1
The last step uses assumptions A.5 (ui -s are independent), and therefore ui -s are uncorrelated, and the variance of the sum is the sum of the variances. Next, by assumption A.4
(var (ui ) = 2u for all i), we have
2
u
var (b2 ) =
n
X
a2i
i=1
Substituting the expression of ai , gives:
n
X
i=1
a2i
=
n
X
i=1
Finally, the variance of b2 is:
Xi
Pn
j=1
Xj
2
X
X
2 2
= Pn
j=1
1
Xj
2
u
var (b2 ) = Pn
j=1
Xj
X
2
Similarly, we derive the variance of b1 , using formula (3.2).
!
n
n
X
X
2
var (b1 ) = var
+
c
u
=
c2i
i i
1
u
i=1
i=1
X
2
56CHAPTER 3. PROPERTIES OF REGRESSION COEFFICIENTS AND HYPOTHESIS TESTING
Again, the last step used assumption A.4 and A.5. Now we use the expression of ci :
n
X
c2i
=
i=1
=
n
X
2
1
n
i=1
n
X
Xai
i=1
n
X
1
=
n2
i=1
=
2Xai
+ X 2 a2i
n
1
n2
X
2X X
a2i
ai + X 2
n i=1
i=1
| {z }
0
1
+ Pn
n
X
j=1
Thus,
var (b1 ) =
n
n
2
Xj
X
X2
1
+ Pn
n
2
u
2
j=1
Xj
X
2
!
To summarize, we derived the variance of OLS estimators:
var (b2 ) = Pn
2
u
j=1
var (b1 ) =
2
u
Xj
X
1
+ Pn
n
j=1
(3.3)
2
X2
Xj
X
2
!
(3.4)
First notice that the smaller is the variance of the error term, u , the more precise are
the OLS estimators b1 and b2 . Also notice that that b1 and b2 are more precise (have smaller
variance) when the variation of the regressor in the sample is greater. Recall that assumption
A.2 requires that there would be some variation of regressors in the sample; otherwise we
won’t even be able to obtain the OLS estimates. Now we had shown that more variation of
the regressors in the sample is better. To gain intuition for this result, consider the regression
of earnings (dependent variable) on schooling (regressor). If the sample has only one level
of schooling, say 12, we will not be able to estimate the relationship between earnings and
schooling. In other words, the sample does not contain enough information on schooling,
to be able to determine how earnings vary with schooling, since schooling does not vary in
this sample. Next consider a sample S1 with two values of schooling, say 12 years and 16
years and sample S2 with schooling of 7, 10, 12, 14, 16, 20 years. Intuitively, sample S2
contains more information on schooling, which enables us to more accurately estimate the
relationship between earnings and schooling.
Finally notice that var (b1 ) gets higher when the average values of the regressor are farther
from zero, i.e. X 2 . This means that it is harder to obtain a precise value of the intercept
when the data is far away from zero. For example, recall that in the earnings regression
\
EARN
IN GSi = b1 + b2 Si , we obtained a negative value of b1 , which is supposed to be
the estimated wage of workers with zero schooling. The reason it happened is that in the
sample we had individuals with at least 7 years of schooling. Now, after seeing equation
3.2. MEAN AND VARIANCE OF OLS ESTIMATORS
57
(3.4), this makes sense. If our sample of workers included enough individuals with zero years
of schooling, then we would have estimated b1 > 0.
The Gauss-Markov Theorem
We have shown that OLS estimators are unbiased, and we derived their variance (equations
(3.3) and (3.4)). Next we ask whether the OLS estimators are e¢ cient, i.e. do they have the
smallest possible variance among unbiased estimators? The Gauss-Markov Theorem states
that the OLS estimators are BLUE, i.e. Best among all Linear Unbiased Estimators. So
we don’t compare the OLS estimators to all the possible estimators in the world, but only
to other linear estimators. We call an estimator linear if it can be expressed as a linear
function of the Yi s (the observations on the dependent variable). Indeed, the OLS estimators
are linear functions of Yi s:
Pn
Pn
n
X
X
X Yi Y
i=1 Xi
i=1 Xi
=
Y
=
ai Y i
b2 =
Pn
Pn
2
2 i
X
X
X
X
i
i
i=1
i=1
i=1
n
n
n
X
X
X
1
Yi
Xai Yi =
c i Yi
b1 = Y b2 X =
n
i=1
i=1
i=1
Therefore, the OLS estimators are a linear combinations of the Yi s.
Furthermore, we proved that OLS estimators are unbiased. Thus, the Gauss-Markov
theorem states that in the class of linear and unbiased estimators, the OLS estimators have
the smallest variance, so they are e¢ cient. This is the meaning of the word Best, i.e.
smallest variance.
Before we prove the Gauss-Markov theorem we prove two properties of ai -s, which will
be used in the proof.
Lemma 12 The OLS weights
ai = Pn
Xi
j=1
satisfy the following properties:
[1] :
n
X
X
Xj
X
2
ai = 0
i=1
[2] :
n
X
ai Xi = 1
i=1
Proof. Property 1.
n
X
i=1
ai =
n
X
i=1
Pn
Xi
j=1
Xj
X
X
2
Pn
= Pni=1
j=1
Xi
X
Xj
X
2
=0
58CHAPTER 3. PROPERTIES OF REGRESSION COEFFICIENTS AND HYPOTHESIS TESTING
Property 2.
n
X
ai Xi =
i=1
=
n
X
Xi
i=1
Pn
i=1
Pn
j=1
Xi
X Xi
Xj
X
X Xi
Pn
j=1 Xj
ai Xi =
i=1
=
Pn
i=1
Pn
Pn
Xj
Xi
X
Xj
X
= Pni=1
j=1
= Pi=1
n
X
Xi
X Xi
Xj
X
2
X X
2
X = 0. Thus
Xi
Xi
X
Xi
X
Xi
j=1
X
Xi X Xi
Pn
j=1 Xj
j=1
Pn
i=1
i=1
Xi
Pn
i=1
Pn
Pn
The term added in the numerator is zero since
n
X
2
!
X X
2
X
2
2
2
=1
Now we are ready to prove the Gauss-Markov theorem.
Theorem 13 Gauss-Markov. Consider a class of estimators for 1 and 2 , which are
both (i) linear, and (ii) unbiased. The OLS estimators are the best in that class, i.e. b1 and
b2 have the smallest variance among linear and unbiased estimators.
Proof. We will prove that the variance of b2 is the smallest among all other linear and
unbiased estimators of 2 . Let ~b2 be another linear and unbiased estimator of 2 :
~b2 =
n
X
(ai + hi ) Yi
i=1
where ai is the weight on Yi in OLS:
Xi
ai = Pn
j=1
We need to prove that var ~b2
~b2 =
n
X
(ai + hi ) Yi =
1
n
X
i=1
Xj
X
2
var (b2 ). First, we rewrite ~b2 as follows:
i=1
=
X
n
X
(ai + hi ) (
1
+
2 Xi
+ ui )
i=1
(ai + hi ) +
2
n
X
i=1
(ai + hi ) Xi +
n
X
i=1
(ai + hi ) ui
3.2. MEAN AND VARIANCE OF OLS ESTIMATORS
59
The mean of ~b is
E ~b2
= E
1
n
X
(ai + hi ) +
2
i=1
=
=
1
1
n
X
i=1
n
X
=
1
(ai + hi ) Xi +
i=1
(ai + hi ) +
n
X
2
(ai + hi ) +
i=1
n
X
2
i=1
n
X
n
X
(ai + hi ) Xi + E
(ai + hi ) +
2
i=1
n
X
(ai + hi ) ui
(ai + hi ) ui
i=1
(ai + hi ) Xi +
i=1
n
X
n
X
n
X
!
!
(ai + hi ) Eui
i=1
(ai + hi ) Xi
i=1
i=1
In the last step we used assumption A.3 that E (ui ) = 0 for all i. The variance of ~b2 is
var ~b2
= var
1
n
X
(ai + hi ) +
i=1
n
X
= var
(ai + hi ) ui
i=1
=
=
n
X
i=1
n
X
2
n
X
(ai + hi ) Xi +
i=1
!
n
X
(ai + hi ) ui
i=1
!
(constants don’t a¤ect the variance)
(ui -s are independent, A.5)
var ((ai + hi ) ui )
(ai + hi )2 var (ui )
i=1
=
2
u
n
X
(ai + hi )2
i=1
=
2
u
n
X
a2i +
i=1
n
X
2
u
(var (ui ) =
h2i + 2
i=1
n
X
ai hi
i=1
!
8i, A.4)
To summarize, the mean and variance of ~b2 are:
E ~b2
=
1
n
X
(ai + hi ) +
i=1
var ~b2
2
u
=
n
X
2
n
X
(ai + hi ) Xi
i=1
a2i +
i=1
n
X
h2i + 2
i=1
n
X
i=1
ai hi
!
(3.6)
The unbiasedness of ~b2 implies certain restrictions on the hi -s:
E ~b2 =
1
n
X
i=1
(ai + hi ) +
2
n
X
i=1
(ai + hi ) Xi =
(3.5)
2
60CHAPTER 3. PROPERTIES OF REGRESSION COEFFICIENTS AND HYPOTHESIS TESTING
For this equation to hold for all possible values of the parameters
n
X
n
X
(ai + hi ) = 0,
i=1
(ai + hi ) Xi = 1
1
and
2,
we must have
(3.7)
i=1
Together with lemma 12
n
X
ai = 0,
i=1
the restrictions in (3.7) imply
n
X
n
X
ai Xi = 1,
i=1
hi = 0,
i=1
n
X
(3.8)
hi Xi = 0
i=1
Using the restriction on the hi -s, we can prove that the last term in the brackets of (3.6) is
zero:
n
X
ai hi =
i=1
=
n
X
Pn
Xi
X
i=1
j=1 Xj
Pn
X
i=1 hi Xi
Pn
j=1 Xj
X
Pn
X
2 hi
i=1
2
hi
=0
The last step is a direct result of the restrictions on hi -s in (3.8), implied by the unbiasedness
of ~b2 . Thus, the variance of ~b2 in (3.6), becomes:
!
n
n
X
X
var ~b2 = 2
a2 +
h2
u
i
i=1
=
2
u
n
X
a2i +
i=1
= var (b2 ) +
i
i=1
n
X
2
h2i
u
i=1
n
X
2
h2i
u
i=1
Notice that because the second term includes squared terms, there is no way for var ~b2 to
be smaller than var (b2 ). The only way the two can be equal, is when hi = 0 for all i, and
in such case ~b2 = b2 . Thus, var ~b2
var (b2 ).
The above proof contains many details. Lets brie‡y summarize the logic of it. We wanted
to prove that the OLS estimator b2 has the smallest variance among all linear and unbiased
estimators of 2 . We examined a generic estimator ~b2 , which is linear and also unbiased
estimator of 2 . We then showed that the unbiasedness of this generic estimator ~b2 imposed
some restrictions on its formula, and these restrictions in turn implied that the variance of
~b2 can only be at least as large as that of the OLS estimator b2 . Thus, we proved that the
OLS estimator b2 has the smallest variance among linear and unbiased estimators of 2 .
3.3. GENERAL IDEA OF STATISTICAL HYPOTHESIS TESTS
3.2.4
61
Consistency of OLS estimators
We have proved that OLS coe¢ cients are unbiased. Therefore, in order to prove consistency,
we only need to show that their variance converges to zero as the sample size becomes very
large. The variances of OLS estimators in (3.3) and (3.4) can be rewritten as follows:
var (b2 ) =
var (b1 ) =
1
n
Pn
2
u =n
j=1
2
u
n
Xj
1+
1
n
X
Pn
2
X2
j=1
Xj
X
2
!
P
2
The term vn = n1 ni=1 Xi Xn was introduced in section 1.6 as the variance of the
sample. It turns out from the Laws of Large Numbers theorems, that vn ! var (X) as
n ! 1 and also, X 2 ! 2X . In other words, the sample moments converge to the true
population moments, as the sample size grows in…nitely large. Thus,
lim var (b2 ) =
limn!1
n!1
lim var (b1 ) =
n!1
lim
n!1
2
X
2
u
n
2
u =n
1+
=0
2
X
2
X
=0
To summarize, with assumption A.0 - A.5, the OLS estimators b1 and b2 are:
1. Unbiased estimators of
1
and
2,
2. E¢ cient (have smallest variance) among unbiased and linear estimators of
3. Consistent estimators of
3.3
1
and
1
and
2,
2.
General Idea of Statistical Hypothesis Tests
In the next section we demonstrate how to perform statistical tests about the unknown true
regression coe¢ cients 1 and 2 . But …rst, lets try to develop some understanding about
statistical tests in general, not only tests related to regression analysis.
Suppose that you wish to learn about some unknown population parameter . You collect
a random sample X1 ; :::; Xn , and use an estimator ^, which then gives you some estimate
^ (X1 ; :::; Xn ) - a particular number. It is almost impossible that your estimate is equal to
the true population parameter , and even if it is equal, there is no way for you to know that
because the true parameter is unknown. For example, if your estimate of the population
mean is 5, this does not mean that the true population mean is also 5. Maybe the true
population parameter is 4 or 6? As far as we know, an estimator is a random variable, and
di¤erent samples will give us a di¤erent estimate. So what do you learn from the value of
your estimate? Not much, really. However, your intuition tells you that if a sample gave
you an estimate of 5, it is very unlikely that the true population parameter is 0, or 10,
or any other value which is "very far" from 5. This intuition lead to the development of
62CHAPTER 3. PROPERTIES OF REGRESSION COEFFICIENTS AND HYPOTHESIS TESTING
statistical hypothesis tests - a procedure that uses a random sample to learn about the
true population parameter.
A statistical hypothesis test about the unknown population parameter , consists of
5 steps:
1. Forming a null hypothesis, H0 , which assigns one particular value to the unknown
population parameter. For example, the null hypothesis can be H0 :
= 0 , or
H0 : = 5 or H0 : 2 = 0. It will become clear (hopefully) later, why the null
hypothesis in a statistical test must assign only one value to the unknown population
parameter.
2. Forming an alternative hypothesis, H1 , which is the logical conclusion that we
will accept if the null hypothesis is not true. For example, if the null hypothesis is
H0 : = 5, then we can have 3 possible alternatives:
i. H1 :
6= 5, if we reject H0 , we conclude that
can be any value other than 5.
ii. H1 :
> 5, if we reject H0 , we conclude that
can be any value greater than 5.
iii. H1 : < 5, if we reject H0 , we conclude that can be any value smaller than 5.
In general, if the null hypothesis is H0 : = 0 , then the only 3 alternative
hypotheses (from which the researcher can choose one) are: (i) H1 : 6= 0 or (ii)
H1 : > 0 or (iii) H1 : < 0 . It will become clear (hopefully) later, why the
alternative hypothesis must be only one of the 3 types listed here, and why we
cannot have for example H0 : = 5 and H1 : = 4.
3. Specifying the test statistic, which is a function of the random sample (just like an
estimator), but in addition, (i) the distribution of T must depend on the hypothesized
value in the null hypothesis, 0 , and (ii) the distribution of T should not depend on
any other unknown parameters. For example, suppose that we test hypotheses about
the mean of some normally distributed population X
N ( ; 2 ), and we do not
2
know neither nor . ThePrandom sample is X1 ; :::; Xn and our estimator of is the
population average X = n1 ni=1 Xi . Suppose that the null hypothesis is H0 : = 0 .
The following is NOT a test statistic:
X
Z=p
0
2 =n
The above quantity does depend on the null value 0 , and if indeed H0 is true (i.e.
= 0 ), then this test statistic would have standard normal distribution: Z N (0; 1).
However, Z also depends on the unknown parameter 2 , and therefore we are unable to
calculate the value of Z based on the sample and the hypothesized value 0 .1 However,
1
If somehow we had knowledge about the population variance 2 , then Z would be a test statistic.
However, in reality, we do not know any of the population parameters. Furthermore, it seems unreasonable
not to know the population mean, but nevertheless know its variance.
3.3. GENERAL IDEA OF STATISTICAL HYPOTHESIS TESTS
63
if we replace the unknown parameter 2 with its estimator (sample variance) sn =
Pn
2
1
X , then we get a valid test statistic:
i=1 Xi
n 1
T =p
X
sn =(n
0
1)
Notice that the value of T depends on the null value 0 , and on the sample, but it does
not depend on any other unknown population parameter (such as 2 ). Therefore, T is
a valid test statistic, and it has t-distribution with n 1 degrees of freedom.
Typically, a test statistic is designed to measure the distance between the hypothesized
value of the unknown parameter, and the evidence. In the above example, notice that
T measures the distance between the hypothesized value 0 and the estimator of (i.e.
X). The distance is measured in units of standard errors of the estimator.
4. Determine the rejection region - the range of values of the test statistic, that lead
to the rejection of the null hypothesis. These are supposed to be unlikely values (have
low probability) of T , when the null hypothesis is true, so that if T attains one of these
values, we reject the null hypothesis. If the test statistic does not attain a value in the
rejection region, then we do not reject the null hypothesis. There is no scienti…c way
to determine what "unlikely or "low probability" means. In practice, we choose this
probability to be = 5% or = 1% and call it the signi…cance level of the test.
The rejection region also depends on which of the 3 types of the alternative hypothesis
is chosen. If the alternative is H1 : 6= 0 , then the rejection region will contain
"unusually high" and "unusually low" values of the test statistic. If the alternative is
H1 : > 0 , then the rejection region will contain only "unusually high" values of the
test statistic. Finally, if the alternative is H1 : < 0 , then the rejection region will
contain only "unusually low" values of the test statistic.
5. Write the conclusion of the hypothesis test and put it in the context of your economic
(or other) theory, which motivated the hypothesis test. For example, the conclusion
is usually either "we reject the null hypothesis at signi…cance level of " or "we fail
to reject the null hypothesis at signi…cance level of ". Putting the conclusion in
the context of our theory means that we add a statement such as "we conclude that
schooling level has a positive e¤ect on earnings of individuals" if 2 is the regression
coe¢ cient on schooling and we rejected H0 : 2 = 0, against the alternative H1 : 2 > 0.
In the next example, we illustrate the 5 steps of hypothesis testing. Suppose that you
want to conduct tests about some unknown population parameter . Let the test statistic
be T ( 0 ). which depends on the sample and the hypothesized value of under the null
hypothesis. It might help if for the sake of this example, we pretend that the test statistic
is an unbiased estimator ^ of the true population parameter , i.e. T ( 0 ) = ^.2 If the null
hypothesis is H0 : = 0 is true, then the pdf of the test statistic will be centered around 0,
2
In practice, most test statistics are indeed constructed based on unbiased or consistent estimators.
64CHAPTER 3. PROPERTIES OF REGRESSION COEFFICIENTS AND HYPOTHESIS TESTING
as shown in the next …gure by the solid curve.
However, if H0 : = 2 is true, then the pdf of the test statistic will be centered around 2, as
shown in the above …gure by the dashed curve.
Suppose that we want to test the null hypothesis H0 : = 0 against one of the three
possible alternatives. If the realized value of the test statistic T ( 0 = 0) is "close" to 0,
then this means that the sample supports the null hypothesis. But what if the realized test
statistic, under the null hypothesis H0 : = 0, is T ( 0 = 0) = 3? Is this value "unlikely"
under the null hypothesis, in which case we should reject it? How do we measure what is
"unlikely"? This depends on what do we want to "accept" in case that we reject the null
hypothesis, or what is the alternative hypothesis, denoted by H1 . If we reject H0 : = 0,
the alternatives could be:
(1) : H1 :
(2) : H1 :
(3) : H1 :
6 0
=
>0
<0
Usually, the theory should determine the alternative hypothesis. The …rst one is called a
two-sided alternative, and the other two are one-sided alternatives. Thus, if the alternative
is two-sided, H1 : 6= 0, we reject the null hypothesis when the test statistic is either far
enough to the right, or far enough to the left of its pdf under the null hypothesis. If the
alternative hypothesis is H1 : > 0, then we reject the null when the realized test statistic
is far enough to the right of its pdf under the null hypothesis. Finally, if the alternative is
H1 : < 0, we reject the null when the test statistic is far enough to the left of its pdf under
the null hypothesis.
Suppose that under the null hypothesis H0 :
= 0, the test statistic has standard normal
3.3. GENERAL IDEA OF STATISTICAL HYPOTHESIS TESTS
distribution, T ( 0 )
65
N (0; 1), as depicted in the following …gure.
The shaded areas indicate rejection regions, and they illustrate what is considered "far
enough" in practice. The common practice is for rejection areas to be 0:05 (or 5%).
In the case of a two-sided alternative (left panel) if the sample results in the value of the
test statistic which falls into either of the two shaded areas, the null hypothesis is rejected.
In this case, when the test statistic has standard normal distribution, the rejection region
consists of all values greater than 1:96 or smaller than 1:96. Under the null hypothesis,
the probability of obtaining a test statistic is either greater than 1:96 or smaller than 1:96,
is 0:05. The numbers 1:96 and 1:96 are called critical values for the test, which separate
the acceptance and rejection regions.
In the case of a one-sided positive alternative H1 : > 0, the null hypothesis is rejected
only if the realized value of the test statistic is far enough to the right (middle panel). If
the test statistic has standard normal distribution, this means rejecting the null hypothesis
when the realized value of the test statistic is greater than 1:65. Again, if the null hypothesis
was true, the chances of getting an estimate greater than 1:65 is 0:05, and in practice we say
that this chance is too small and therefore we reject the null hypothesis.
Finally, the right panel shows the rejection area for the case of a one-sided negative
alternative hypothesis H1 : < 0. In this case we reject the null hypothesis when the
realized value of the test statistic is "far enough" to the left (or small enough). If the
estimator has a standard normal distribution, this means that we reject the null hypothesis
whenever the realized value of the test statistic is less than 1:65. If the null hypothesis is
true, the chances that a particular sample gives an estimate which is less than 1:65 is 0:05,
and in practice this is considered too small and therefore we reject the null hypothesis.
In general, the size of the rejection area is denoted by , and is called the signi…cance
level of the statistical test. Thus, is the probability of rejecting the null hypothesis when
it is true, a Type I error. In our example, the signi…cance level was chosen to be = 0:05.
This means that in a random sample, there is a 5% chance of rejecting the null hypothesis
even when it is true. This chance is due to the fact that random samples are random,
and each sample gives a di¤erent estimate. Thus, even if the true parameter value is = 0,
it is possible to have a random sample which will produce an estimate very far from the true
vale, say ^ = 3. This kind of risk is unavoidable in statistics, but we want it to be as small
as possible. Therefore, sometimes we choose the signi…cance level = 0:01, which means
that there is only 1% chance of falsely rejecting a true null hypothesis (or only one out 100
samples will lead to the false rejection of a true null hypothesis).
In terms of language, if we choose signi…cance level , and the estimate falls into a rejection region (far enough), we say that "we reject the null hypothesis at 100 % signi…cance
66CHAPTER 3. PROPERTIES OF REGRESSION COEFFICIENTS AND HYPOTHESIS TESTING
level". We do not say that the null hypothesis is false, because there is always a chance that
we rejected a true null hypothesis. If the estimate does not fall into the shaded areas (rejection regions), then we say that "we cannot reject the null hypothesis at 100 % signi…cance
level".
3.4
Hypothesis Testing of Regression Coe¢ cients
So far we assumed that the true model (data generating process) is:
Yi =
1
+
2 Xi
+ ui
Here Yi is the dependent variable, for example earnings, and Xi is an independent variable,
for example schooling. The parameters 1 and 2 are unknown, and we learned how to
estimate them using OLS (ordinary least squares). Application of OLS procedure to a given
sample provides us with the estimates b1 and b2 , i.e. two numbers. In this section we add
an important ingredient to statistical research - theory (economic or any other).
Our theory could for example suggest that earnings and schooling are related, or 2 6= 0.
If our theory is wrong, then 2 = 0. Since we don’t know 1 and 2 , we can never …nd
out with certainty whether our theory is correct or not. Instead, we can use the sample and
estimation procedure to reach conclusion such as "our theory is very likely to be correct",
or "there is not enough evidence to accept our theory as correct".
3.4.1
Formulating hypotheses about the regression coe¢ cients
Suppose that our theory suggests that earnings and schooling are related, i.e. 2 6= 0.
Statistical testing procedure starts with the assumption that our theory is wrong, i.e. 2 =
0, usually called the null hypothesis. A researcher who believes that the theory is correct
puts the null hypothesis to a test with the hope of rejecting it. The null hypothesis is
paired with an alternative hypothesis, which usually means that the theory is correct.
The null and the alternative hypotheses are then written as follows:
H0 :
H1 :
2
2
=0
6= 0
The statistical test related to the above hypotheses is called the two-sided test. Sometimes
the theory tells us not only that there should be a relationship between Y and X, but also
the sign of the relationship. For example, our theory might tell us that earnings (Y ) should
depend positively on schooling (X), i.e. 2 > 0. Then the null and alternative hypotheses
are:
H0 :
H1 :
2
2
=0
>0
and the statistical test related to these hypotheses is called one-sided upper-tail test.
Similarly, If the tehory claims that the e¤ect of X on Y is negative, the corresplonding null
3.4. HYPOTHESIS TESTING OF REGRESSION COEFFICIENTS
67
and alternative hypotheses are:
H0 :
H1 :
2
2
=0
<0
and the statistical test related to these hypotheses is called one-sided lower-tail test.
Since the alternative hypothesis usually represents some theory, it is clear that H1 is
di¤erent depending on the theory being tested. It is less intuitive however, that the H0 is
the same in all the above tests. In particular, it is very tempting in the one-sided upper-tail
test to write H0 : 2 0. As we will see below, the null hypothesis always equates the true
parameter to one particular value. Then, if the null hypothesis is true, the researcher
obtains a particular distribution of the estimator and is able to carry out the test. If the
null hypothesis was stated as H0 : 2
0, then it consists of many hypotheses such as
H0 : 2 = 3, H0 : 2 = 11:7, H0 : 2 = 100, etc. Obviously, it is not feasible to test
them all, but fortunately for us if we reject H0 : 2 = 0, then we also would reject all the
hypotheses of the form H0 : 2 = negative number. Intuitively, we would reject H0 : 2 = 0
if b2 in our sample is large enough (or far enough from zero). Obviously, if b2 is far enough
from zero, it is even farther away from 3 and 11:7 and de…nitely far enough from 100.
Exercise 33 Suppose that in a simple regression model, Yi = 1 + 2 Xi + ui , the dependent
variable Y is gas mileage of a car and the independent variable X is the cars weight.
(a) Suppose that theory (of physics) claims that the car weight and gas mileage are related.
Write the null and alternative hypothesis for testing this theory.
(b) Suppose that theory claims that car weight has negative impact on gas mileage. Write
the null and alternative hypothesis for testing this theory.
3.4.2
Deriving the t-test for regression coe¢ cients
In order to perform tests about 1 , 2 , we need to know the distribution of their estimators
b1 and b2 . We therefore add another assumption about the regression model.
A.6 The disturbance (error) terms are normally distributed. Together with assumptions A.3 and A.4, this implies that for all i,
ui
N 0;
2
u
Assumption A.6 implies that the estimators b1 and b2 have normal distribution. This
follows from the property that linear combination of normal random variables is also normal
(see section 1.5, properties of the normal distribution). Recall that we were able to rewrite
the OLS estimators as linear combinations of the error terms (equations (3.1)-(3.2)):
b2 =
b1 =
2
1
+
+
n
X
i=1
n
X
i=1
ai u i
ci ui
68CHAPTER 3. PROPERTIES OF REGRESSION COEFFICIENTS AND HYPOTHESIS TESTING
where ai -s and ci -s are some weights. Thus, assumption A.6 implies that:
b2
b1
N
N
2
b2
2
b1
2;
1;
Recall that we proved in section 3.2.2 that OLS estimators are unbiased, so the means of b1
and b2 are 1 and 2 respectively. Also recall that in section 3.2.3 we derived the variance
of b1 and b2 :
2
u
var (b2 ) = Pn
Xj
j=1
2
X2
1
+ Pn
n
2
u
var (b1 ) =
X
j=1
Xj
X
2
!
If we knew 2u , then we could have used the z-test to test hypotheses about
In that case, we would have
b2
2
s:d: (b2 )
b1
1
s:d: (b1 )
v
u
u
s:d: (b1 ) = t
Pn
2.
N (0; 1)
2
u
j=1
2
u
and
N (0; 1)
where the standard deviations of b2 and b1 are:
s
s:d: (b2 ) =
1
Xj
X
1
+ Pn
n
j=1
(3.9)
2
X2
Xj
X
2
!
(3.10)
The reality is however that we don’t know 2u , and must estimate it, just as we estimate the
unknown intercept and slope coe¢ cients 1 and 2 .
Theorem 14 Let
s2u
Then, s2u is an unbiased estimator of
=
1
n
2
n
X
e2i
i=1
2
u.
In other words, in order to estimate the variance of the disturbance term, we use something similar to the sample variance of the residuals.
Recall that
P
P 2e = 0 by theorem 10.
2
1
1
The variance of the residuals in the sample is n (ei e) = n ei , but this turns out to
be a biased estimator of 2u . However, division by n 2 instead of by n gives an unbiased
3.4. HYPOTHESIS TESTING OF REGRESSION COEFFICIENTS
estimator of 2u . We then replace the unknown
the standard errors of the estimators
s
s:e: (b2 ) =
Pn
v
u
u
s:e: (b1 ) = ts2u
j=1
2
u
69
by its estimator s2u in (3.9)-(3.10), to get
s2u
Xj
(3.11)
2
X
X2
1
+ Pn
n
j=1
Xj
X
2
!
(3.12)
It is important to compare (3.9)-(3.10) with (3.11)-(3.12) and notice the replacement of
by its estimator s2u .
2
u
Theorem 15
b2
2
s:e: (b2 )
b1
1
s:e: (b1 )
tn
2
tn
2
We will not present the details of the proof, but it is related to theorem 3. We have seen
that
b2
2
Z=
N (0; 1)
s:d: (b2 )
The standard deviation of b2 needs to be replaced somehow by its standard error (estimator
of standard deviation). First, one needs to prove two properties.
s:e: (b2 )2 (n 2)
2
(1) : Y =
n
s:d: (b2 )2
(2) : Z and Y are independent
2
Suppose we proved these two properties. We know that t-distribution is constructed by
dividing standard normal by an independent chi-square, i.e.
Z
T =p
Y = (n
2)
tn
2
where n 2 is the number of degrees of freedom of the chi-square. Thus, plugging Z and Y
into T gives:
T =p
Z
Y = (n
2)
=q
b2
2
s:d:(b2 )
2
s:e:(b2 ) (n 2)
= (n
s:d:(b2 )2
=
2)
b2
2
s:e: (b2 )
tn
2
70CHAPTER 3. PROPERTIES OF REGRESSION COEFFICIENTS AND HYPOTHESIS TESTING
3.4.3
Performing the t-test
Having found the distribution of the estimators, b1 and b2 , (or more precisely we found that
b2
2
tn 2 ) we are able to identify the rejection regions using our "far enough" intuition.
s:e:(b2 )
The rejection regions are determined by critical values of the appropriate t-distribution, and
will depend on the hypothesized value of 2 , signi…cance level and the number of degrees
of freedom (df). For example, when we perform a two-sided test of the null hypothesis
H0 : 2 = 0, with = 0:05 and df = 300, we know that the test statistic is:
b2 0
s:e: (b2 )
t300
The critical values of the test statistic are:
tcrit = t300;0:025 = 1:968, and
The area to the right of 1:968 and to the left of
tcrit =
1:968
1:968 is 5%, as shown in the next …gure.
b2 0
b2 0
If in our sample, if we get s:e:(b
> 1:968 or s:e:(b
< 1:968, we reject the null hypothesis
2)
2)
H0 : 2 = 0 at 5% signi…cance level.
In general, the number of degrees of freedom for the t-test is equal to the number of
observations, minus the number of estimated regression coe¢ cients k. In the simple regression model we estimate two regression coe¢ cients, ( 1 and 2 ) so df = n 2. In general,
df = n k. The next table summarizes the t-test for general multiple regression with sample
size n, with k regression coe¢ cients (including the intercept), and signi…cance level .
3.4. HYPOTHESIS TESTING OF REGRESSION COEFFICIENTS
Type of test
two-sided
one-sided, upper tail
one-sided, lower tail
Hypothesis
H0 : = 0
H1 : 6= 0
H0 : = 0
H1 : > 0
H0 : = 0
H1 : < 0
71
Reject H0 at sig. level
b 0
s:e:(b)
> tn
or
k; 2
b 0
s:e:(b)
b 0
s:e:(b)
b 0
s:e:(b)
> tn
<
tn
<
if
tn
k; 2
k;
k;
The object tn k; 2 denotes the critical value of the t-distribution, with n k degrees of
freedom, to the right of which the tail probability is =2. Formally, if Tn k is a random
variable having t-distribution with n k degrees of freedom, then P Tn k tn k; 2 = =2.
By symmetry of the t-distribution, P Tn k
tn k; 2 = =2. Similarly, tn k; is the
critical value of the t-distribution with n k degrees of freedom, to the right of which
the tail probability is . These critical values can be found in a statistical table for the
t-distribution, which appears in any statistics textbook. Simply look up the tail probability
in the column of the table, and …nd the degrees of freedom in the rows of the table.
In order to calculate the critical values in Stata, we use the commands display invttail(df,p),
which gives the right-tail critical value of a t-distribution with df degrees of freedom, and
the probability in the right tail is p. The display function tells Stata to display the result
in the command window. The function invttail (abbreviation of inverse t-tail) calculates
the critical value of the t-distribution, to the right of which the tail probability is p. For example, display invttail(300,0.025) returns 1.967903, which is the critical value of the
t-distribution with 300 degrees of freedom, to the right of which which the tail probability
is 0:025.
In order to calculate the critical values in R, we use the command qt(p,df), which gives
the left-tail critical value of a t-distribution with df degrees of freedom, and the probability
in the left tail is p. For example, qt(0.025,300) returns -1.967903, which is the critical
value of the t-distribution with 300 degrees of freedom, to the left of which which the tail
probability is 0:025. Obviously, the right-tail critical value is the same as the left one,
but with a sign change. If we want to calculate the right-tail critical value in R, we use
qt(0.025,300, lower.tail=FALSE), and this command returns 1.967903.
To summarize, the procedure of t-testst about individual regression coe¢ cients is simple.
We calculate the critical values, which determine the rejection regions. If the realized value
of test statistic in the sample falls into a rejection region, then we reject the null hypothesis
at signi…cance level . If the test statistic does not fall into a rejection region, then we do
not reject the null hypothesis at signi…cance level .
72CHAPTER 3. PROPERTIES OF REGRESSION COEFFICIENTS AND HYPOTHESIS TESTING
Chapter 4
Multiple Regression Analysis
The simple regression analysis studies the relationship between the dependent variable (say
hourly earnings) and one regressor (say years of schooling). In reality, any dependent variable
we study, is usually a¤ected by several independent variables. For example, earnings might
depend on years of schooling, work experience, gender, etc. Multiple regression analysis
studies the relationship between a dependent variable, and several regressors. We assume
that the true model (data generating process) is:
Yi =
1
+
2 X2;i
+
3 X3;i
+ ::: +
k Xk;i
+ ui
The dependent variable in observation i is Yi . The X2 ; X3 ; :::; Xk are regressors (independent
variables), and 1 ; 2 ; :::; k are unknown coe¢ cients, which we want to estimate. Finally,
the disturbance term combines all the in‡uences on Y , observed or unobserved, other than
the Xs.
4.1
4.1.1
OLS Estimators
Deriving the OLS estimators
As in the simple regression model, we de…ne the …tted equation:
Y^i = b1 + b2 X2;i + b3 X3;i + ::: + bk Xk;i
(4.1)
and residual (or prediction error) for observation i:
ei = Yi
Y^i = Yi
b1
b2 X2;i
b3 X3;i
:::
bk Xk;i
The OLS estimators are de…ned as the b1 ; b2 ; :::; bk which minimize the residuals sum of
squares:
n
X
RSS =
(Yi b1 b2 X2;i b3 X3;i ::: bk Xk;i )2
i=1
Deriving the OLS estimators of the multiple regression model, without the use of linear
algebra, is almost impossible. It is possible, but very messy, if we only have 2 regressors
73
74
CHAPTER 4. MULTIPLE REGRESSION ANALYSIS
(k = 3), but for the general case we need to use linear algebra. I will only present an outline
of how this is done, without much details. First, all the data on regressors can be written as
an n by k matrix:
2
3
1 X2;1 X3;1
Xk;1
6 1 X2;2 X3;2
Xk;2 7
6
7
X = 6 ..
..
..
.. 7
..
4 .
.
.
.
. 5
1 X2;n X3;n
Xk;n n k
There are n observations (rows), and k regressors (columns), where the …rst regressor X1 is
just a vector of 1s. The data on the dependent variable is just an n by 1 vector, as well as
the disturbance term:
2
3
2
3
Y1
u1
6 Y2 7
6 u2 7
6
7
6
7
Y = 6 .. 7
, u = 6 .. 7
4 . 5
4 . 5
Yn n 1
un n 1
Finally, the s, and their OLS estimators are k by 1 vectors:
2
3
2
3
b
1
1
6 b2 7
6
7
6
7
6 2 7
= 6 .. 7 , b = 6 .. 7
4 . 5
4 . 5
bk k
k
k 1
1
This notation allows us to write the multiple regression model in (4.1) in a compact way:
Y =X +u
The …tted model is
Y^ = Xb
The next few steps are for those of you who took linear algebra. The residual sum of
squares:
RSS = (Y Xb)0 (Y Xb)
= Y 0 Y Y 0 Xb b0 X 0 Y + b0 X 0 Xb
= Y 0 Y 2Y 0 Xb + b0 X 0 Xb
The …rst step uses the fact that transpose of a product is product of transposes in reverse
order. The second step might not be so obvious. Note that Y 0 Xb is a scalar, and b0 X 0 Y
is the same scalar transposed, and transpose of a scalar is the scalar itself. The …rst order
condition:
@RSS
= 2X 0 Y + 2X 0 Xb = 0
@b
Solving this system (of k equations and k unknowns)
2X 0 Y + 2X 0 Xb = 0
X 0 Xb = X 0 Y
4.1. OLS ESTIMATORS
75
The vector of OLS estimators is:
b = (X 0 X)
1
X 0Y
(4.2)
The above derivation is not important for this course. It is enough that you know that to
obtain OLS coe¢ cients in a multiple regression, a statistical package uses the formula (4.2).
4.1.2
Properties of OLS estimators
We retain the assumptions we made about the simple regression model A0 - A6, and in
addition we have
A.7 There does not exists an exact linear relationship among the regressors in the sample.
For example, suppose that X2 and X3 are two regressors. Assumption A.7 does not
allow for example, that X3 = 1 + 2 X2 , where 1 ; 2 are some constants.
If there is a linear relationship between two or more regressors in a model, the problem
is called multicollinearity, and will be discussed later in this chapter. In the case of exact
linear relationship, the regression coe¢ cients cannot be estimated at all.
Given that all the assumptions are satis…ed, just as in the case of simple regression
model, the OLS coe¢ cients are unbiased, and have the minimum variance among all unbiased
estimators that are linear functions of Yi s. In other words, the Gauss-Markov Theorem
holds for the OLS estimators of the multiple regression model. Assumption A.6, that ui
N (0; 2u ), implies that the OLS estimators will also have normal distribution. The bottom
line is that the properties that we proved for the simple regression model, extend to the
multiple regression model, but in order to prove these properties in general, one needs to use
linear algebra.
4.1.3
Interpretation of regression estimates
Suppose that we study the factors which a¤ect the gas mileage of a car. To get the data in
Stata, type:
use http://www.stata-press.com/data/r12/auto.dta, replace
Next we generate a new variable, which is the car’s weight measured in hundreds of
pounds:
generate weight100 = weight/100
Then we regress the gas mileage on weight100 and repair record (higher record means
less repairs, more reliable car). In other words, we estimate the model
mpg =
1
+
2
weight100 +
3
rep78 + u
In Stata, type:
regress mpg weight100 rep78
The estimation results are presented in the next table.
76
CHAPTER 4. MULTIPLE REGRESSION ANALYSIS
The …tted equation is
md
pg = b1 + b2
36:588
0:568
weight100 + b3
rep78
0:564
The interpretation of these results is as follows. The value of b2 = 0:568 means that an
increase in car’s weight by 100 pounds, holding all else constant, reduces the gas mileage by
0:568 miles per gallon. The value of b3 = 0:564 means that an improvement in repair record
by 1 point, holding all else constant, increases the gas mileage by 0:564 miles per gallon.
The constant b1 = 36:588 means that a car with weigh 0 and repair record of 0, is predicted
to have gas mileage of 36:588 miles per gallon. As usual, the intercept rarely makes any real
sense, because there are no cars with weight zero.
To perform the same tasks in R, we use the following commands:
library(foreign) #Needed to read data not in R format
auto <- read.dta("http://www.stata-press.com/data/r12/auto.dta")
auto$weight100 <- auto$weight/100 #Weight in 100s pounds
model1 <- lm(mpg ~weight100 + rep78, data = auto)
summary(model1) #Basic regression output table
The resulting table in R is
4.2. HYPOTHESIS TESTING
4.2
4.2.1
77
Hypothesis Testing
t-tests
Recall that in the simple regression analysis the test statistic had n 2 degrees of freedom,
because in order to estimate the unknown variance of the disturbance term, 2u , we used the
2 estimated regression coe¢ cients, b1 and b2 . In the multiple regression model, an unbiased
estimator of 2u is:
n
1 X 2
s2u =
e
n k i=1 i
It therefore follows that the test statistic in a multiple regression model has tn
i.e. t-distribution with n k degrees of freedom:
T =
b
s:e: (b)
tn
k
distribution,
k
There are n k degrees of freedom because in order to estimate the unknown variance of
the disturbance term, 2u , we used k estimated regression coe¢ cients, b1 ; b2 ; :::; bk .
We repeat the table which summarizes the t-tests of an individual regression coe¢ cient
, whose estimate is b:
Type of test
two-sided
one-sided, upper tail
one-sided, lower tail
Hypothesis
H0 : = 0
H1 : 6= 0
H0 : = 0
H1 : > 0
H0 : = 0
H1 : < 0
Reject H0 at sig. level
b 0
s:e:(b)
> tn
or
k; 2
b 0
s:e:(b)
b 0
s:e:(b)
b 0
s:e:(b)
> tn
<
tn
<
if
tn
k; 2
k;
k;
Recall that the object tn k; 2 denotes the critical value of the t-distribution, with n k
degrees of freedom, to the right of which the tail probability is =2. Once again, the test
statistic measures the distance between the estimated value b and the hypothesized value of
(i.e. 0 ) in units of standard errors. If this distance is "large enough", then we reject the
null hypothesis. In other words, we reject the null hypothesis if the estimated value is "far
enough" away from the hypothesized value in the null hypothesis. In each test, far enough
means beyond some critical value of the t-distribution (denoted tn k; 2 for 2-sided test, and
tn k; for one-sided tests), which depends on degrees of freedom and the signi…cance level .
In one-sided tests, not only distance from 0 matters, but also the direction. In the upper
tail test the estimate b must be "far enough" above the hypothesized value 0 , and in the
lower tail test the estimate b must be "far enough" below the hypothesized value 0 .
4.2.2
p-value
The …fth column in the Stata (labeled P>jtj) and R (labeled Pr(>jtj)) regression output,
gives the p-value for each coe¢ cient. This is the probability of obtaining a t-statistic
78
CHAPTER 4. MULTIPLE REGRESSION ANALYSIS
at least as large in absolute value as what we obtained, given that H0 :
= 0 is true.
Put another way, the reported p-values in any statistical package, by default usually give the
smallest signi…cance level at which we can reject H0 : = 0 against the two-sided alternative
H1 : 6= 0. Recall that under this null hypothesis, we have:
T =
b 0
s:e: (b)
tn
That is, the t-statistic has t-distribution with n
de…ned mathematically as follows:
p-value = P (tn
k
k degrees of freedom. The p-value is
k
> jT j)
For example, consider the p-value of the coe¢ cient on rep78, which equals 0:231. Suppose
that the null hypothesis is H0 : 3 = 0. The realized test statistic for this sample is then
t=
b3 0
0:564 0
=
= 1:21
s:e: (b3 )
0:466
This t-statistic is reported in column 4, labeled t. Regression outputs of Stata and R report
the realized value of the test statistic for the null hypothesis H0 : = 0. In general, the test
statistic is a random variable, and its value will be di¤erent in di¤erent samples. The p-value
reported in Stata and R is the probability that in repeated samples we obtain T > 1:21 or
T < 1:21, given that H0 is true. To calculate this probability, we need to …nd the degrees
of freedom df = n k = 69 3 = 66. Then,
p-value = P (t66 > 1:21 or t66 <
This probability is illustrated in the next …gure
1:21) = 2 P (t66 > 1:21)
4.2. HYPOTHESIS TESTING
79
The shaded area is 0:2306, which is the p-value reported in the regression output of Stata
or R.
The advantage of the p-value, is that it gives us the smallest signi…cance level at which we
can reject the null hypothesis H0 : = 0, with the two-sided alternative: H1 : 6= 0. In the
case of H0 : 3 = 0, and H1 : 3 6= 0, we can only reject the null hypothesis at signi…cance
level of = 0:2306. We cannot reject the null hypothesis at = 0:05 for example or at any
signi…cance level smaller than 0:2306. For the coe¢ cient on weight, we got p-value = 0:000.
This means that the p-value for 2 is smaller than 0:001 or 0:1% (one tenth of a percent).
Thus, in the standard two-sided test
H0 :
H1 :
2
2
=0
6= 0
we would reject the null hypothesis at signi…cance level of = 5%, and at signi…cance level
of = 1%, and at 0:1%. Since Stata rounds the p-value to 3 decimal places, we cannot see
from the table what is the minimal signi…cance level at which we reject the null hypothesis in
this case. Thus, reporting p-values gives an immediate test of signi…cance for the regression
coe¢ cients.
To summarize, for the standard two-sided test
H0 :
H1 :
=0
6= 0
the next table summarizes the interpretation of the p-value reported in Stata.
p-value
Conclusion
p-value < 0:001
reject H0 at 0:1% signi…cance level
0:001 < p-value < 0:01 reject H0 at 1% signi…cance level (but not at 0:1%)
0:01 < p-value < 0:05
reject H0 at 5% signi…cance level (but not at 1%)
0:05 < p-value
fail to reject H0 at 5% signi…cance level
R presents the p-value in scienti…c format, so we simply conclude that the reported pvalue is the smallest signi…cance level at which we can reject the null hypothesis in the
standard two-sided test.
Once again it should be emphasized that the reported p-values in Stata or R are only
for the two sided test with the null hypothesis being that the coe¢ cient is zero, H0 : = 0,
and the alternative hypothesis is that its not zero, H1 : 6= 0. If the test is one-sided, with
H0 : = 0 and the alternative is either H1 : > 0 or H1 : < 0, the p-value is just 1=2
of the p-value reported in Stata for the two-sided test, since the t-distribution is symmetric,
and both tails are the same. If you need the p-value for a di¤erent hypothesis, you need
to calculate it yourself. The next table shows how to calculate p-values in Stata and R for
general tests, where the t-statistic in all cases is
T =
b
0
s:e: (b)
and the realized value of T for a given sample is denoted by t. Recall that Stata, by default,
calculates the upper tail probabilty, while R, by default, calculates the lower tail probability.
80
CHAPTER 4. MULTIPLE REGRESSION ANALYSIS
H0
H1
H0
H1
H0
H1
Test
: =
: 6=
: =
: >
: =
: <
p-value de…ned
0
2 P (tn
P (tn
k
> t)
ttail(n-k,t)
pt(-t,n-k)
P (tn
k
< t)
ttail(n-k,-t)
pt(t,n-k)
0
0
0
The null hypothesis is rejected at signi…cance level
4.2.3
p-value in R
> jtj) 2*ttail(n-k,abs(t)) 2*pt(-abs(t),n-k)
k
0
0
p-value in Stata
if p-value
.
Con…dence intervals
So far we started a statistical test with stating the null and alternative hypotheses. Now we
ask, what is the set of all null hypotheses which are consistent with the data at hand, i.e.
the hypotheses that will not be rejected. We do not reject the null hypothesis (H0 : = 0 )
against a two-sided alternative (H1 : 6= 0 ) when
tc; 2
b
0
s:e: (b)
tc; 2
The critical values are determined by the signi…cance level and degrees of freedom n k.
We can solve the above inequality to locate all the hypothesized values of that will not be
rejected based on our sample.
b+ 0
tc; 2
s:e: (b)
b+ 0
s:e: (b) tc; 2
b s:e: (b) tc; 2
0
tc; 2
s:e: (b)
b + s:e: (b)
tc; 2
tc; 2
The solution is:
b
s:e: (b)
tc; 2
0
b + s:e: (b)
tc; 2
Thus, all the hypothesized values of 2 b s:e: (b) tc; 2 ; b + s:e: (b) tc; 2 will not be
rejected at signi…cance level . This interval is called the 100 (1
) % con…dence interval
for .
For example, construct a 95% con…dence interval for 2 , the coe¢ cient on wieght100. The
positive critical value is 1:9965644, based on 66 degrees of freedom and = 0:05. They are
obtained in Stata by: disp invttail(e(df_r),0.05/2). Thus the 95% con…dence interval
for 2 is:
[ 0:568 0:058 1:996;
[ 0:684154; 0:4515354]
0:568 + 0:058 1:996]
This means that any null hypothesis H0 : 2 2 [ 0:684154; 0:4515354], will not be rejected
at = 5% con…dence level, while any null hypothesis H0 : 2 2
= [ 0:684154; 0:4515354]
will be rejected in favor of the two sided alternative.
4.2. HYPOTHESIS TESTING
81
The last two columns of the Stata regression output, labeled [95% Conf. Interval],
report the 95% con…dence intervals for the estimated coe¢ cients. The default is 95% con…dence intervals, and the user can change this default to any other percentage. For example,
in the regression used in this section, we can write:
regress mpg weight100 rep78, level(99)
This results is the same regression output as above, but with 99% con…dence intervals.
The regression output of R does not automatically report con…dence intervals, and in
order to obtain them, we need to use to command:
confint(model1,level=0.99)
Without the part level=0.99, the con…dence level is assumed to be 95%.
4.2.4
Goodness of …t: R2 and F-tests
As in the simple regression model, we can decompose the Total Sum of Squares, T SS, into
two parts: (i) Explained Sum of Squares, ESS, and (ii) residual Sum of Squares, RSS. See
equation (2.6) which is repeated here for convenience.
n
X
|i=1
Yi
Y
{z
2
}
T SS
=
n
X
|i=1
Y^i
{z
ESS
2
Y
+
}
n
X
e2i
{z }
|i=1
RSS
The de…nition of R2 is also unchanged from the simple regression analysis:
R2 =
ESS
=1
T SS
RSS
;
T SS
measures the proportion of the variation in the dependent variable Y , "explained" by the
…tted model1 . Intuitively, higher R2 means that the model …ts the data better. Experience
tells us that in some situations a value of R2 of 0:5 is considered "high" while in other
situations an R2 of 0:7 might be considered "low" and indicate "poor" …t. It would be nice
if we could test somehow whether our model has a poor …t overall.
Such a test exists, and is called the F -test of overall …t of the model. The null and
alternative hypotheses are:
H0 :
H1 :
= 3 = ::: = k = 0
at leas one of the s is not 0
2
In other words, the null hypothesis is that none of the regressors included in the model help
predict the dependent variable, and the alternative is that at least one of them does. The
F -test is based on the following theorem.
Theorem 16 Suppose that the sample size is n and the model has k parameters ( 1 ;
If the null hypothesis is true ( 2 = 3 = ::: = k = 0), then:
ESS= (k
RSS= (n
1
Recall that 0
R2
1.
1)
k)
F (k
1; n
k)
2 ; :::;
k ).
82
CHAPTER 4. MULTIPLE REGRESSION ANALYSIS
In other words, the ratio of ESS to RSS, each divided by their respective degrees of freedom,
has an F -distribution with k 1 numerator degrees of freedom and n k denominator degrees
of freedom.
Recall from section 1.5 that the F -distribution is constructed as ratio of two independent chi-square random variables. Thus, to prove this theorem, one needs to show that
(1) : V1 =
(2) : V2 =
ESS
2
k 1
2
u
RSS
2
n k
2
u
(3) : V1 and V2 are independent
We will not prove these results here and will only apply the theorem. The next …gure plots
a typical shape of pdf of F (k 1; n k).
0
.2
F
.4
.6
.8
pdf of F(3,536)
0
2
4
6
x
Intuitively, the larger ESS relative to RSS, the better is the …t of the model. Note that if
the model cannot explain any of the variation of the dependent variable, i.e. ESS = 0, then
the F -statistic will be zero, and we will not reject the null hypothesis. Therefore, we will
reject the null hypothesis when the F -statistic, F (k 1; n k), is "large enough". Usually,
large enough means that the probability of obtaining such large F -statistic is less than 0:05
or less than 0:01. Stata and R report the F -statistic, as well as the probability of obtaining
such large F -statistic when the null hypothesis is true. This is the p-value for the F -test of
overall model …t, and it is labeled in Stata regression output as Prob > F, in the top-right
4.3. MULTICOLLINEARITY
83
corner. If Prob > F is smaller than 0:05, we reject the null hypothesis at signi…cance level of
0:05. If Prob > F is smaller than 0:01, we reject the null hypothesis at signi…cance level of
0:01. When the value of Prob > F is 0:0000, it means that we can reject the null hypothesis
at signi…cance level of 0:0001.
It can be shown that the F -test of overall …t of the model is in fact testing how large is
the R2 . Recall that
RSS
ESS
=1
R2 =
T SS
T SS
Then, dividing the numerator and denominator of the F -statistic by T SS gives:
ESS
T SS
RSS
T SS
= (k
= (n
1)
R2 = (k 1)
=
(1 R2 ) = (n k)
k)
The F -statistic is therefore increasing in R2 , as shown in the next graph:
Therefore, when we are performing the F -test of overall …t, we are actually testing whether
R2 is equal to zero or not.
4.3
Multicollinearity
Recall that assumption A.7 about the multiple regression model, states that there does not
exists an exact linear relationship among the regressors in the sample. We mentioned that
if such linear relationship exists, then we have a "problem" called Multicollinearity. In this
section we de…ne the concept of multicollinearity, discuss under what conditions it is indeed
a "problem", and suggest some remedial steps to combat it.
De…nition 29 Suppose that we are trying to estimate the general multivariate regression
model:
Y = 1 + 2 X2 + 3 X3 + ::: + k Xk + u
84
CHAPTER 4. MULTIPLE REGRESSION ANALYSIS
We say that this model has perfect multicollinearity if the following equation holds for
some numbers 1 ; 2 ; :::; k , not all of them zero:
+
1
2 X2
+
3 X3
+ ::: +
k Xk
=0
We say that this model has imperfect multicollinearity if
1
+
2 X2
+
3 X3
+ ::: +
k Xk
+v =0
where v is some random variable with mean zero and variance
2
v.
The following models are examples of perfect multicollinearity:
[1] : Y =
[2] : Y =
[3] : Y =
+
1+
1+
1
2 X2
+
2 X2 +
2 X2 +
3 X3
+ 4 X4 + u, X4 = X2 + X3
0:8X3 + 7
3 X3 + 4 X4 + u, X4 = 2X2
5
3 X3 + u, X3 = 3X2
Assumption A.7. does not allow perfect multicollinearity, and the reason is that it is
impossible to obtain OLS estimates in the presence of perfect multicollinearity. Consider
for example a model, where the dependent variable Y is family’s consumption, X2 is labor
income, X3 is non-labor income (dividends, interest) and X4 = X2 + X3 is total income.
Y =
1
+
2 X2
+
3 X3
+
4 X4
+u
In this model, 2 represents the e¤ect on consumption of a $1 increase in X2 , holding X3
and X4 …xed. But if we increase X2 by $1, we will necessarily also increase X4 by $1, and
the measured e¤ect will be 2 + 4 . Similarly, suppose we increase X3 by $1. Instead of
the e¤ect on Y being 3 , it is going to be 3 + 4 . In other words, instead of estimating
2 , 3 and 4 , it is only possible to estimate 2 + 4 and 3 + 4 . Substituting the linear
relationship X4 = X2 + X3 into the original model, we get:
Y
Y
Y
=
=
=
+ 2 X2 + 3 X3 + 4 (X2 + X3 ) + u
1 + ( 2 + 4 ) X2 + ( 3 + 4 ) X3 + u
~
~
1 + 2 X2 + 3 X3 + u
1
It should be emphasized that non-linear relationships among regressors do not constitute
perfect multicollinearity. For example, consider the model:
Y =
1
+
2X
+
3X
2
+
4
ln X + u
All the regressors are functions of X, but they are not linear functions of X, and this model
therefore does not violate assumption A.7. The above form is questionable in the sense that
it is hard to interpret the estimated coe¢ cients, but OLS estimates can be at least obtained.
The bottom line is that with perfect multicollinearity, OLS estimates cannot be obtained.
Stata automatically drops one of a group of variables which have exact linear relationship.
Mathematically, obtaining OLS estimates in the presence of perfect multicollinearity, is the
same as trying to solve for k unknowns from a system k 1 linear equations. Perfect
4.3. MULTICOLLINEARITY
85
multicollinearity always arises when the econometrician makes a mistake, and does not notice
that he included a variable, which is a linear combination of some other variables. For
example, the econometrician included labor and non-labor incomes as regressors, and in
addition also included the total income. Perfect multicollinearity is readily noticed when you
estimate the model, and Stata reports that it dropped one of the regressors. You conclude
that the dropped regressor can be obtained as a linear combination of one or more of other
regressors. The solution is to reexamine your model, and avoid perfect multicollinearity by
excluding one of the collinear variables.
In practice, unless the econometrician makes a mistake, one rarely encounters perfect
multicollinearity. Instead, it is common to have a high correlation between two variables,
or between a variable and a combination of other variables. For example, we consider a
hypothetical data on consumption c, income i, and wealth w. Economic theory suggests that
both current income and wealth are important determinants of consumption. We estimate
3 models; in the …rst we regress consumption on income only, in the second we regress
consumption on wealth only, and in the third we include both income and wealth. The R
commands and output:
multi <- read.csv("http://online.sfsu.edu/mbar/ECON312_files/multicollinearity.csv")
model1 <- lm(c ~ i, data = multi)
model2 <- lm(c ~ w, data = multi)
model3 <- lm(c ~ i + w, data = multi)
86
CHAPTER 4. MULTIPLE REGRESSION ANALYSIS
In order to produce the above table in R, we need to …rst install the stargazer package,
install.packages("stargazer"), (you need to install it only once. Then use use the
commands:
library(stargazer)
stargazer(model1, model2, model3, type="text",
dep.var.labels="Consumption",
covariate.labels=c("Income","Wealth"),
out="models_multi.htm")
The out="models_multi.htm" saves the table in htm format, and it can be can be read
by MS Word.
Notice that when we regressed consumption only on income (model1) or wealth (model2),
these regressors where highly signi…cant. Once we included both income and wealth however
(model3), they both became insigni…cant, and the sign on Wealth changed from positive to
negative. Nevertheless, model3 has the highest R2 and the F-statistic is very high as well.
This outcome is a typical result of strong, but not perfect, multicollinearity.
The problem is that in our hypothetical data set, income and wealth are very similar.
Stata command correlate generates a table of pairwise correlations:
Notice that the correlation between income and wealth is 0.9990, which is close to 1. In
addition, one can regress wealth on income, and plot the …tted equation with the actual
data points, we see that there is almost exact linear relationship between wealth and income.
Stata commands and graph are as follows:
regress w i
predict w_hat
4.3. MULTICOLLINEARITY
87
twoway (scatter w i) (line w_hat i, sort title(Wealth v.s.
Income))
1000
1500
2000
2500
3000
Wealth v.s. Income
100
150
200
250
Income, in $
Wealth, in $
Fitted values
This is the reason why when both income and wealth are included, OLS procedure (or any
other estimation procedure for that matter) has a hard time measuring the separate e¤ect
of income on consumption from that of wealth on consumption.
The above steps can be easily performed with R. Suppose the data frame containing
the variables c, i, w is multi. Then cor(multi$i,multi$w) calculates the correlation
between wealth and income in the sample. We can regress wealth on income, and plot the
…tted equation with the actual data points, to produce similar graph with R:
model <- lm(w ~i, data=multi) #Regressing wealth on income, checking R-squared
plot(w ~i, data=multi, main="Wealth vs Income", col="blue")
abline(coef(model4),col="red")
legend("topleft", legend = c("data","fitted equation"), col=c("blue","red"),
pch=c("o","_"))
The easiest thing to do with this sample is drop either income or wealth from the model,
and regress consumption on one remaining variable. But what if the entire purpose of
this research is to measure the separate e¤ect of income and wealth on consumption? The
next best thing to do is to try and increase the sample size. Recall that OLS estimators are
consistent, which means that their variance tends to zero as the sample size becomes in…nitely
large. Some authors make a point that a non-perfect multicollinearity problem is exactly
identical to the problem of small data set (micronumerosity: micro - small, numerosity number).
88
CHAPTER 4. MULTIPLE REGRESSION ANALYSIS
Chapter 5
Transformations of Variables and
Nonlinearities
So far we learned how to estimate the linear multiple regression model:
Y =
1
+
2 X2
+
3 X3
+ ::: +
k Xk
+ ui
This model is linear in parameters ( 1 ; :::; k ) and in variables (Y; X2 ; :::; Xk ). We can
look at the right hand side of the regression model as a function of the ’s, and notice that
it is a weighted average of the ’s, with weights being the X’s, and therefore linear in ’s.
This means that the model is linear in parameters. On the other hand, we can look at the
right hand side as a function of the X’s and notice that it is a weighted sum of the X’s,
with weights being the ’s, and therefore linear in X’s. The left hand side contains a linear
function of Y , and so we conclude that the model is linear in variables Y and the X’s. In
practice however, we often will encounter nonlinear models. In this chapter we demonstrate
that if the model is not linear in variables, it can be easily made linear by transforming the
variables. On the other hand, if the model is not linear in variables and parameters, we can
sometimes make the model linear, but in some cases this is impossible. If the model is not
linear in parameters, and cannot be transformed into a linear model in parameters, we are
forced to estimate it using methods other than OLS (for example maximum likelihood, or
non-linear least squares).
5.1
Non-linearity in Variables
The following is an example of a model that is nonlinear in variables, but it is linear in
parameters.
p
100
= 1 + 2 X2 + 3 X32 + 4 ln (X4 ) + u
100 Y
Notice that this model is clearly not linear in variables (Y; X2 ; X3 ; X4 ) but it is linear in
parameters because the right hand side is a weighted average of the ’s. In order to estimate
the unknown parameters with OLS, we need to transform the nonlinear variables as follows:
Ynew =
p
100
, Z2 = X2 , Z3 = X32 , Z4 = ln (X4 )
100 Y
89
90
CHAPTER 5. TRANSFORMATIONS OF VARIABLES AND NONLINEARITIES
and estimate the linear model:
Ynew =
1
+
2 Z2
+
3 Z3
+
4 Z4
+u
In Stata, use the command generate to create the transformed variables. The conclusion is
that nonlinearities in variables can be easily resolved by a straight forward transformation.
In R, we can create new variable X_new <- f(X), where f is some function. For example,
ln_X <- log(X) creates a new variable, with values equal to natural logs of X. A nice thing
about R is that it is possible to use functions of variables, without creating new variables. For
example, lm(log(Y) ~ log(X), data=mydata) estimates the linear model with dependent
variable ln (Y ) and regression ln(X).
5.2
Nonlinearity in Variables and Parameters
The following model is nonlinear in both variables and parameters:
Y =
1 X2
2
X3 3 X4 4 eu
This model is nonlinear in X’s and ’s, but in this case it is easy to transform the model
into a linear one by taking logarithms1 .
ln (Y ) = ln
1
+
2
ln (X2 ) +
3
ln (X3 ) +
4
ln (X4 ) + u
This is a linear model in parameters. It is nonlinear in variables, but we have already seen in
the last section that this nonlinearity is resolved by transforming the variables: Ynew = ln (Y ),
Z2 = ln (X2 ), Z3 = ln (X3 ), Z4 = ln (X4 ).
This was one example in which nonlinearity in parameters can be eliminated. In many
cases, there is no way to eliminate the nonlinearities. For example, consider the model:
Y =
1
2
+
3
+X
+u
There is no mathematical transformation that can be applied to the right hand side of this
model, that would create a linear function in ’s. In this case, we typically apply non linear
least squares, which works exactly as OLS, but the formulas of estimators are not linear
functions of the Y ’s and cannot be obtained analytically. Just as in OLS, we de…ne the
…tted (predicted) model:
b2
Y^i = b1 +
b3 + Xi
and residuals (prediction errors) for observation i:
ei = Yi
1
b1
b2
b3 + Xi
Recall the rules of logarithms:
log (XY ) = log (X) + log (Y )
log (X a ) = a log (X)
5.3. MODELS WITH LOGARITHMIC TERMS
91
The nonlinear least square estimators minimize the Residual Sum of Squares:
RSS =
n
X
Yi
b2
b3 + Xi
b1
i=1
2
In Stata you can …nd these estimates using the command nl (see example nonlinear.do on
the course web page).
5.3
Models with Logarithmic Terms
Transformations of original variables changes the way we interpret the estimated coe¢ cients.
In this section we discuss how the interpretation of the estimated coe¢ cients changes when
we apply logarithmic transformation to a variable.
5.3.1
Log-log model
Suppose that both the dependent variable and the independent variables are logs of some
original variables as follows:
ln (Y ) =
1
+
2
ln (X) + u
We see that the slope coe¢ cient
2
=
@ ln (Y )
=
@ ln (X)
1
@Y
Y
1
@X
X
=
@Y X
@X Y
This expression is the familiar point elasticity formula for the elasticity of Y with respect
to X.
Recall that the de…nition of elasticity is percentage change in Y divided by the percentage
change in X:
% Y
;
Y;X =
% X
which is the percentage change in Y resulting from a 1% increase in X. Recall from rules of
derivatives that
@ ln (Y )
1
=
@Y
Y
which implies that
@Y
@ ln (Y ) =
Y
@Y
The term Y is the rate of change in Y , expressed as a fraction. Thus, the term 100 @Y
is
Y
@X
roughly the percentage change in Y . Similarly, the term 100 X is the percentage change
in X. For example, suppose that X changed from 50 to 54.
4
8
=
= 0:08
50
50
100
% change = (100 0:08)% = 8%
rate of change =
54
50
=
92
CHAPTER 5. TRANSFORMATIONS OF VARIABLES AND NONLINEARITIES
You can also see now why the point elasticity formula is consistent with the de…nition of
elasticity:
%
100 @Y
% Y
@Y X
Y
=
=
=
Y;X
@X
@X Y
% X
100 X %
Equipped with the above results and understanding the meaning of elasticity, we can
interpret the slope coe¢ cient 2 , or more precisely, its estimated value. Estimating the
log-log model gives the …tted equation:
\
ln
(Y ) = b1 + b2 ln (X)
Thus, b2 , is the estimated elasticity of Y with respect to X, or the estimated percentage
change in Y resulting from a 1% increase in X. The advantage of the log-log model is exactly
in the interpretation of the slope coe¢ cients, which is easy and does not require knowledge of
the exact units in which X and Y are measured. For example, if X is height and Y is weight,
whether they are measured in inches and pounds, or kilograms and meters (or centimeters),
the estimated slope coe¢ cient will always be the same, and will be interpreted in the same
way.
5.3.2
Log-lin model
Suppose that the dependent variable is log-transformed, but not the regressor:
ln (Y ) =
1
+
2X
+u
Here
2
=
@Y
@Y 1
@ ln Y
= Y =
@X
@X
@X Y
Multiplying by 100 transforms the rate of change into units of percentages:
100
2
=
%
100 @Y
% Y
Y
=
@X
X
which is the percentage change in Y as X changes by one unit. Thus, to interpret b2 we say
that 100 b2 is the percentage change in Y resulting from a one unit increase in X.
The coe¢ cient 2 is not the same as the elasticity of Y with respect to X. The elasticity
of Y with respect to X is:
@Y X
= 2 X
Y;X =
@X Y
and its estimate is:
d
Y;X = b2 X
Thus, this is a model of a non-constant elasticity of Y with respect to X, and the elasticity
depends on the values of X.
5.3. MODELS WITH LOGARITHMIC TERMS
5.3.3
93
Lin-log model
Suppose that the regressor is log-transformed, but not the dependent variable:
Y =
Here
2
=
1
+
2
ln (X) + u
@Y
@Y
@Y
= @X =
X
@ ln (X)
@X
X
Dividing by 100 transforms the rate of change into units percentages:
2
100
=
@Y
Y
=
@X
% X
100 X %
which is the change in Y resulting from a 1% increase in X. Thus, to interpret the estimated
coe¢ cient b2 we say that b2 =100 is the change in Y resulting from a 1% increase in X.
The coe¢ cient 2 is not the elasticity of Y with respect to X. The elasticity of Y with
respect to X is:
@Y X
= 2
Y;X =
@X Y
Y
and its estimate is:
b2
d
Y;X =
Y
Thus, this is a model of a non-constant elasticity of Y with respect to X, and the elasticity
depends on the values of Y .
5.3.4
Lin-lin model
For completeness, consider the linear model in variables - our original model, which is called
lin-lin (both the dependent variable and the regressor are not in logarithmic form).
Y =
1
+
Here
2X
+u
@Y
@X
which is the change in Y resulting from a one unit change in X. The elasticity of Y with
respect to X is:
@Y X
X
= 2
Y;X =
@X Y
Y
and its estimate is:
X
d
Y;X = b2
Y
Thus, in the lin-lin model, the point elasticity of Y with respect to X depends on the values
of X and Y .
2
=
94
5.3.5
CHAPTER 5. TRANSFORMATIONS OF VARIABLES AND NONLINEARITIES
Summary of models with log forms
The next table summarizes the interpretation of the estimated slope coe¢ cient in the models
discussed in this section, as well as the estimated elasticity of Y with respect to X in these
models.
5.4
Model
Interpretation of slope
ln (Y ) = 1 + 2 ln (X) + u
ln (Y ) = 1 + 2 X + u
Y = 1 + 2 ln (X) + u
Y = 1 + 2X + u
% Y^
= d
b2 = %
Y;X
X
% Y^
100b2 = X
^
b2 =100 = % YX
Y^
b2 = X
2
Estimating
d
Y;X
d
Y;X
d
Y;X
d
Y;X
Y;X
= b2
= b2 X
= b2 =Y
= b2 X
Y
Estimating Elasticity in General Models
In general suppose you have a model when both the dependent and an independent variables
appear transformed with some functions:
f (Y ) =
We see that
2
=
1
+
2g
(X) + u
f 0 (Y ) @Y
@f (Y )
= 0
@g (X)
g (x) @X
In order to calculate the elasticity of Y with respect to X you need:
Y;X
=
Xg 0 (X)
2
Y f 0 (Y )
Thus, the estimated elasticity is
5.5
Quadratic Form
d
Y;X = b2
Xg 0 (X)
Y f 0 (Y )
In the previous examples we considered models where the regressor has a monotone e¤ect
on the dependent variable. That is, we considered models where a regressor X can have
either positive or negative e¤ect on Y . For example, we postulated that schooling should always have a positive e¤ect on earnings, and cars weight should always have a negative e¤ect
on the car’s fuel consumption. Indeed, our estimates were consistent with these presumptions. However, sometimes we expect a non-monotone e¤ect of a regressor on the dependent
variable.
For example, experience may have a positive e¤ect on earnings in the beginning of a
career, but after certain number of years the worker’s productivity can decline due to health.
For example, the relationship between earnings (y) and experience (x) could be like in the
5.5. QUADRATIC FORM
95
next …gure.
y 40
30
20
10
0
10
20
30
40
50
x
In the above …gure we see that experience has positive e¤ect on earnings up to 25 years,
and after that each additional year of experience actually lowers earnings. In order to
estimate such relationship, we can use a model such as:
Y =
1
+
2S
+
3 EXP
+
4 EXP
2
+u
Here Y is hourly earnings in dollars, S is years of schooling, and EXP is years experience.
If our presumption is correct, and indeed the e¤ect of experience on earnings is as depicted
in the …gure above, then we expect that 3 > 0 and 4 < 0. The e¤ect of experience on
earnings is:
@Y
= 3 + 2 4 EXP
@EXP
Notice that with 3 > 0, when the worker has little to no experience, the e¤ect of experience
on earnings is positive. However, if 4 < 0, as experiences reaches certain level, the e¤ect of
experience on earnings become negative.
We can calculate the threshold level of experience above which the e¤ect of experience
on earnings switches from positive to negative:
@Y
@EXP
=
EXP
=
3
+2
4 EXP
=0
3
2
4
With the assumptions 3 > 0 and 4 < 0, the threshold level of experience we …nd, EXP ,
must be positive. For example, suppose that we estimated b3 = 0:27 and b4 = :005. The
threshold level of experience, beyond which experience has negative e¤ect on earnings is:
\ =
EXP
b3
=
2b4
0:27
= 27
2 ( 0:005)
96
CHAPTER 5. TRANSFORMATIONS OF VARIABLES AND NONLINEARITIES
This means, that experience has positive e¤ect on earnings, up to 27 years of experience,
but each additional year of experience after 27 years, is reduces the hourly earnings. We can
conjecture that this happens because of age, fatigue and lack of modern skills.
Non-monotone e¤ects of one variable on another is abundant in economics. In the Solow
growth model the e¤ect of saving rate on consumption per worker is non-monotone; positive
up to certain level of saving rate (the golden rule saving rate), and negative above this level.
In business, we realize that spending on advertising can boost pro…t, but too much spending
on advertising must decrease pro…t (consider the extreme case where the …rm spends all its
revenue on advertising, which results in a negative pro…t). Finally, macroeconomists study
whether more government is good for the economy or not. We may argue that certain level
of government is essential, because public goods cannot be provided e¢ ciently (or at all) by
competitive markets, and some regulation is necessary. However, governments that are too
big create ine¢ ciencies due to corruption and overregulation. In this section we developed a
tool that allows estimating the optimal size of the government, by including the square term
of government size in a regression with real GDP or its growth rate as dependent variable.
Chapter 6
Dummy Variables
In many practical applications, the data is presented in the form of qualitative variables
(words), as opposed to quantitative variables (numbers). Variables such as weight, height,
earnings, are all quantitative because they assume numerical values. Other important variables, such as sex = {female, male}, race = {white, black, Asian, Other}, occupation = {services, manufacturing, education, farming,...}, religion = {Christianity, Islam, Buddhism,...},
political regime = {Democracy, Communism, Dictatorship,...}. Each word in the curly
brackets is called a category, as opposed to value in the case of a quantitative variable.
As you can see, many important variables in the real world are qualitative and do not have
natural numerical values.
It should be mentioned that statistical agencies assign arbitrary numbers to categories
of qualitative variables, for convenience. These are called codes. For example, the category
male can be coded as 1, and the category female by 2. These codes however, do not represent
numerical values in the usual sense, such that higher number represents greater value. For
example, an income of $50k is greater than income of $40k, but we cannot same that "female
is greater than male" in the usual mathematical sense. We need to be careful, and realize
that just because a qualitative variable is coded with some numbers by a statistical agency,
this does not mean that the variable is numerical, and we must remember that these codes
do not represent any meaningful values.
6.1
Using Dummies to Represent Qualitative Variables
Qualitative variables cannot be used directly in statistical analysis, because estimation requires numerical values. However, each category of a qualitative variable can be represented
by a dummy variable (also known as indicator variable), which attains the value of "1" if
the observation belongs to that category, and "0" if it doesn’t. For example, consider the
qualitative variable sex = {female, male}, which has two categories. We can create two
dummy variables, one for each category:
1 if female
0 otherwise
[1] : female =
[2] : male =
1 if male
0 otherwise
97
98
CHAPTER 6. DUMMY VARIABLES
These variables are referred to as "female dummy" and "male dummy". Notice that the
sum female + male = 1 for every observation in the sample, indicating that a person can be
either female or male.
As another example, consider the qualitative variable race = {white, black, Asian, Hispanic, Other}. In this example it has 5 categories of race, so we can create 5 dummy
variables, one for each category:
[1] : white =
1 if white
0 otherwise
[2] : black =
1 if black
0 otherwise
[3] : Asian =
1 if Asian
0 otherwise
[4] : Other =
1 if not white, black, Asian or Hispanic
0 otherwise
These 5 dummy variables are referred to as "white dummy", "black dummy", "Asian
dummy", "Hispanic dummy" and "other dummy". Notice once again that the sum of all
the dummies for each category is always 1. This is because we created dummy variable for
all categories, and the categories are mutually exclusive. Therefore, each observation unit
(each person here) can only be either white or black or Asian or Hispanic or other.
Exercise 34 Consider the variable state = {Alabama, Alaska, Arizona,..., Wisconsin, Wyoming},
i.e. the list of all the states in the united states.
(a) Is state a quantitative or a qualitative variable?
(b) Demonstrate how you can represent the state of California with a dummy variable.
6.2
Dummy Variables in Regression Analysis
Dummy variables can be used in regression analysis in the same way as other quantitative
variables, and we can perform statistical hypothesis testing about the unknown coe¢ cients,
just like with regular quantitative variables. One has to keep in mind two important properties about using dummy variables. First, since all the dummy variables for any qualitative
variable add up to 1, you must exclude one variable from the list of regressors. In the
case of sex = {female, male}, we created two dummy variables, one for female and the other
for male. You cannot include both of them in any regression, because female + male =
1, so there is an exact linear relationship between them and that creates perfect multicollinearity. If you include both dummies, Stata will drop one of them. Similarly, in the
case of the qualitative variable race, we created 5 dummies for 5 race categories. Again,
you cannot include all 5 and must exclude one dummy. The excluded category is called
reference category, or omitted category, or excluded category.
The second issue with dummy variables, is that the interpretation of the coe¢ cients is
di¤erent from regular numerical variables. Suppose that S is years of schooling, which is a
regular quantitative variable. The estimated coe¢ cient on S shows the predicted impact of
6.2. DUMMY VARIABLES IN REGRESSION ANALYSIS
99
one year increase in the schooling level on the dependent variable (say earnings). If instead
we look at the coe¢ cient on female dummy, what is the meaning of "one unit increase
in female"? Since the female dummy attains the value of "0" for males, then, roughly
speaking, the change from 0 to 1 captures the di¤erence between male and female. The
remaining subsections of this chapter are dedicated to the interpretation of the estimated
coe¢ cients on dummy variables, and interactions between them and other (dummy or
numerical) variables.
6.2.1
One dummy variable
Suppose that we would like to measure how earnings (in dollars per hour) depend on schooling, work experience, and also on sex = {female, male}. The sex (gender) variable is qualitative variable with two categories, so we can create two dummy variables:
F =
1 if female
, M=
0 otherwise
1 if male
0 otherwise
We choose the "male" to be the reference category, so we do not include the male dummy
in the regression. Therefore, we only include the female dummy and the model is:
EARN IN GS =
Next, we estimate the coe¢ cients
1;
1
+
2;
3
2S
+
3 EXP
+
4F
+u
as usual, and obtain the …tted equation:
\
EARN
IN GS = b1 + b2 S + b3 EXP + b4 F
(6.1)
We have see that b2 is the estimated e¤ect on earnings resulting from 1 unit increase in
schooling, holding all other things the same. In other words, additional year of schooling
increases earnings by b2 dollars per hour. Similarly, additional year of experience increases
earnings by b3 dollars per hour. The interpretation of b4 is similar. The dummy variable
female increases by one unit as we switch from observation on male to an observation on
female. Thus, b4 is the additional earnings of female over male, holding other things constant
(schooling and experience). To see this more vividly, notice that equation (6.1) can be broken
into two …tted earnings equations, one for females and the other is for males.
\
EARN
IN GS F = b1 + b2 S + b3 EXP + b4
\
EARN IN GS M = b1 + b2 S + b3 EXP
Subtracting the male earnings from female earnings, holding S and EXP the same for both,
we get:
\
\
EARN
IN GS F EARN
IN GS M = b4
Notice that we subtracted the reference category’s earnings from female’s earnings, which
means that women earn b4 dollars per hour more than men. If the estimate b4 is negative,
we conclude that women earn less than men by jb4 j dollars per hour.
The reason why male was chosen to be the reference category, is that we usually suspect
that women are discriminated against, and we want to measure women’s earnings relative to
100
CHAPTER 6. DUMMY VARIABLES
male. It would not make a di¤erence if we had chosen female to be the reference category,
and …tted:
\
EARN
IN GS = b1 + b2 S + b3 EXP + ~b4 M
This time ~b4 would give us the excess earnings of male over female:
\
EARN
IN GS M
\
EARN
IN GS F = ~b4
The two estimates are related as follows:
~b4 =
6.2.2
b4
Several dummy variables
Suppose that in addition to gender, we are interested in the impact of race on earnings.
Suppose that race = {white, black, other}, so for simplicity we only have 3 race categories1 .
We create race dummies as follows:
W=
1 if white
,B=
0 otherwise
1 if black
,O=
0 otherwise
1 if not white or black
0 otherwise
We choose the reference category for race to be white, so the estimated model is:
EARN IN GS =
1
+
2S
+
3 EXP
+
4F
+
5B
+
6O
+u
and the …tted equation is:
\
EARN
IN GS = b1 + b2 S + b3 EXP + b4 F + b5 B + b6 O
(6.2)
The reference category is therefore white male.
Equation (6.2) allows us to compare earnings not only by gender, but also by race. It
can be broken into six equations (earnings of white males, black male, other males, and the
same for females):
\
EARN
IN GS M;W = b1 + b2 S + b3 EXP
\
EARN
IN GS M;B = b1 + b2 S + b3 EXP + b5
\
EARN
IN GS M;O = b1 + b2 S + b3 EXP + b6
\
EARN
IN GS F;W = b1 + b2 S + b3 EXP + b4
\
EARN
IN GS F;B = b1 + b2 S + b3 EXP + b4 + b5
\
EARN
IN GS F;O = b1 + b2 S + b3 EXP + b4 + b6
The estimates b5 and b6 capture the race e¤ects on earnings. For example, the estimated
di¤erence between black males and white males earnings, holding everything else the same,
is:
\
\
EARN
IN GS M;B EARN
IN GS M;W = b5
1
In Census, there are many more categories of race, including Asian, Native American, and mixes between
them. Hispanic is a separate variable, which has many sub categories.
6.2. DUMMY VARIABLES IN REGRESSION ANALYSIS
101
A negative b5 is evidence of discrimination against black men relative to white men.
Similarly, we can compare black women with white women:
\
EARN
IN GS F;B
\
EARN
IN GS F;W = b5
This is the same as the di¤erence between black men and white men. Thus, this model
assumes that there is no di¤erence between race e¤ect among male and female. In other
words, b5 is the di¤erence between earnings of black and earnings of white, holding all other
characteristics …xed (schooling, experience, gender).
The interpretation of b6 is similar:
\
EARN
IN GS W = b6
\
EARN
IN GS O
That is, b6 is the di¤erence between earnings of other race and earnings of white, holding all
other characteristics …xed (schooling, experience, gender).
It is possible however, that black women experience di¤erent degree of discrimination
from black men. In order to test this hypothesis, we need to introduce interaction terms
between the sex dummy and gender dummy.
6.2.3
Interaction between two dummy variables
Suppose that we want to test whether race e¤ect is di¤erent for the two genders. We estimate
a model with interaction e¤ects as follows:
EARN IN GS =
1
+
2S
+
3 EXP
+
4F
+
5B
+
6O
+
7F
B+
8F
O+u
The …tted equation is:
\
EARN
IN GS = b1 + b2 S + b3 EXP + b4 F + b5 B + b6 O + b7 F B + b8 F O
The di¤erence between black male and white male is:
\
EARN
IN GS M;B
\
EARN
IN GS M;W = b5
However, the di¤erence between black women and white women is:
\
EARN
IN GS F;B
\
EARN
IN GS F;W = b5 + b7
So b7 represents the di¤erence between the black women discrimination and black men discrimination, both relative to white (the reference race category). If we test
H0 :
H1 :
7
7
=0
6= 0
and do not reject the null hypothesis, this would mean that we did not …nd enough evidence
that the discrimination against black women in the labor market is any di¤erent from the
discrimination of black men (both relative to their white counterparts).
102
6.2.4
CHAPTER 6. DUMMY VARIABLES
Interaction between a dummy and a quantitative variable
So far we assumed that the contribution of each year of schooling and experience is the
same for both genders, and for all races. Suppose that we want to test whether each year of
schooling increases the earnings of female by the same amount as for male. We introduce an
interaction term between female dummy and schooling variable, which is continuous. The
model we estimate is:
EARN IN GS =
1
+
2S
+
3 EXP
+
4F
+
5S
F +u
The …tted model is
\
EARN
IN GS = b1 + b2 S + b3 EXP + b4 F + b5 S F
Again, it is helpful to break this equation into earnings for male and female:
\
EARN
IN GS M = b1 + b2 S + b3 EXP
\
EARN IN GS F = b1 + (b2 + b5 ) S + b3 EXP + b4
Notice that for male, each year of schooling increases earnings by b2 dollars, and for female
by b2 + b5 dollars. Thus, b5 is the extra e¤ect of additional year of schooling on females’
earnings, compared with males’earnings. If the coe¢ cient 5 turns out to be insigni…cant,
then we conclude that additional year of schooling has the same e¤ect on female as on
male. In similar fashion, one can interact female with experience to test whether each year
of experience adds the same amount to female earnings as to male earnings. Also, one can
interact race dummies with schooling and experience to test whether the gains from schooling
and experience are the same for di¤erent races.
6.2.5
Dummy variables in log-lin model
Suppose that our model is
ln (Y ) =
1
+
2S
+
3F
+u
where Y is earnings, S is schooling, and F is a dummy variable for female. The …tted
equation is
\
ln
(Y ) = b1 + b2 S + b3 F
Thus, b3 is the estimated di¤erence between log of earnings of female and male, holding all
other things the same:
\
ln
(YF ) = b1 + b2 S + b3 F
ln\
(YM ) = b1 + b2 S
\
) ln
(YF ) ln\
(YM ) = b3
6.2. DUMMY VARIABLES IN REGRESSION ANALYSIS
103
We can show that 100 b3 is approximately the % di¤erence between female and male earnings.
Notice that we can write:
!
^
YF
\
ln
(YF ) ln\
(YM ) = ln
Y^M
!
^
^
^
Y M + Y F YM
= ln
Y^M
= ln 1 +
Y^M
= ln (1 + g)
where
= Y^F Y^M is the predicted gap between female and male earnings, and g is the
relative gap between female and male earnings, expressed as a fraction of males earnings. One
can prove that if the relative gap g is small, then ln (1 + g) g, and we have approximately
g = b3 or 100g = 100b3 . If the relative gap g is large, say more that 0:1, this approximation is
not very good and we can calculate the exact % di¤erence between female and male earnings
as follows:
ln (1 + g) = b3
g = exp (b3 )
1
Thus, the exact % di¤erence between female and male earnings is:
100g = 100 [exp (b3 )
1]
104
CHAPTER 6. DUMMY VARIABLES
Chapter 7
Speci…cation of Regression Models
In our previous homework assignments and class exercises, the regression model was always
given and you were asked to estimate it, interpret the coe¢ cients and conduct statistical
tests. In reality econometricians must decide for themselves what model they want to estimate. The decision about what should be the dependent variable, the regressors, and the
functional form is called the model speci…cation. In principle, economic theory (or other
theory) and common sense should provide guidance about what regressors need to be included in the estimated model. For example, economic theory and common sense suggest
that schooling and work experience are important determinants of earnings. More schooling
might indicate higher ability of workers, and therefore employees are willing to pay more to
workers with more advanced degrees. Work experience increases the specialized skills of the
worker through learning-by-doing. When you decide what variables should be included in
any empirical model, you must justify each variable by reference to economic theory, other
theory or common sense.
It is common that researchers make speci…cation errors. For example, a researcher
might not be familiar enough with economic theory, and failed to include a relevant regressor
in the model. It could also be the case that an important variable is missing because the
researcher was unable to …nd data on that variable. For example, in the earnings equation,
we included years of schooling and experience, but common sense also suggests that "quality
of schooling" should matter. It is not obvious how to obtain data on the variable that
represents quality of schooling, and we will get back to this issue in the section on proxy
variables. In any case, the …rst speci…cation error that we will discuss is omitted variable
bias. Similarly, a researcher might include a variable that is not supposed to be in the
model. For example, the number of squirrels in your state is probably of no consequence
for your income. We will see that the consequences of omitting a relevant variable are far
more severe than of including an irrelevant variable. In fact, the biggest problem in applied
econometrics, is by far the omitted variable bias.
105
106
CHAPTER 7. SPECIFICATION OF REGRESSION MODELS
7.1
7.1.1
Omitted Variable Bias
Two variable model
Suppose that the true model is:
[true model] : Y =
1
+
2 X2
+
3 X3
+u
+
2 X2
+ u~
but the researcher thinks that the model is:
[misspeci…ed model] : Y =
1
In other words, the researcher omits a relevant variable X3 and …ts Y^ = b1 + b2 X2 . Notice
that the error term in the misspeci…ed model is u~ = u
3 X3 . We will show that the OLS
estimators b2 and b1 are biased and inconsistent. The estimated standard errors are biased
as well, so we are unable to test any hypotheses with the regression results.
Recall that the OLS estimator of 2 in the misspeci…ed model is:
Pn
X2;i X2 Yi Y
b2 = i=1Pn
2
X2
i=1 X2;i
Substituting the true Yi s:
Pn
X2 (
i=1 X2;i
b2 =
=
=
=
=
where
Pn
i=1
Pn
i=1
2
2
X2;i
X2
X2;i
X2
+
2 X2;i +
Pn
i=1
3 X3;i
2 X2;i + 3 X3;i + ui
Pn
2
X2
i=1 X2;i
2
X2;i
Pn
i=1
X2;i
Pn
i=1
3
X2
X2;i
Pn
i=1
2
X2 +
X2;i
Pn
+
3
X2
i=1
X3;i
X2
X2;i
X2
X2;i
Pn
1
2 X2
+
+
3 X3
2 X2
X3;i
u
X3 + (ui
u)
X2
+
X3;i
X2;i
n
X
X2
X3 +
2
Pn
i=1
ai u i
i=1
X2;i
i=1
X2
X2;i
X2
X2;i
Pn
X2
2
The expected value of b2 is therefore:
E (b2 ) =
2
Pn
i=1
+
3
|
+u
2
i=1
ai = Pn
3 X3
2
X2
3
X3
2
+ ui )
X2;i
i=1
Pn
+
1
i=1
X2;i
{z
X3;i
X2
Bias
P
Recall that in section 3.2.2 we showed that E ( ni=1 ai ui ) = 0.
X3
2
}
X2;i
X2 (ui
u)
7.1. OMITTED VARIABLE BIAS
107
The bias term is the product of 3 (the true slope coe¢ cient on the omitted variable X3 )
and d2 , the OLS estimator of 2 in the regression
X3 =
1
+
2 X2
+v
In other words, the term d2 has the same sign as the sample correlation between X2 and
X3 . Therefore, the estimator b2 is a biased estimator of 2 whenever d2 6= 0. Notice that
in the case of only one omitted variable, and where the misspeci…ed model is the simple
regression model, we can …gure out the direction of bias. Since bias = 3 d2 , the bias is
positive (b2 overestimates the true parameter 2 ) if 3 and d2 are both negative or both
positive. The bias is negative when 3 and d2 have di¤erent signs. In general, in a multiple
regression model, the direction of omitted variable bias depends on the correlations between
the omitted variable and all the included variables.
Exercise 35 Consider two models of earnings, with regressors S - years of schooling, and
EXP - experience.
[true model] : EARN IN GSi =
[mispeci…ed model] : EARN IN GSi =
+
1+
1
2 Si
+ 3 EXPi + ui
2 Si + v i
Suppose that a researcher estimates the misspeci…ed model, and obtains and estimate b2 of
2.
(a) Is b2 likely to overestimate or underestimate the true parameter 2 ?
(b) Provide intuition for the result in part (a).
To summarize, omitted variable bias is by far the most severe problem in applied econometrics. In general, omitted variables lead to biased and inconsistent estimators of coe¢ cients on the included variables. Recall that biased estimators are not necessarily bad, if they
are consistent and we have a large sample, in which case the bias vanishes. But inconsistency
means that no matter how big our sample is, we can never get rid of the bias. Moreover,
omitted variable bias also results in biased standard errors of estimators, which makes all
statistical tests invalid.
7.1.2
General k-variable model
Suppose that the true model is:
[true model] : Y =
1
+
2 X2
+
3 X3
+ ::: +
k 1 Xk 1
2 X2
+
3 X3
+ ::: +
k d3 ) X3
+ ::: +
+
k Xk
+u
k 1 Xk 1
+ u~
but the researcher thinks that the model is:
[misspeci…ed model] : Y =
1
+
The OLS …tted equation of the misspeci…ed model is:
Y
= b1 + b2 X2 + ::: + bk 1 Xk 1
= ( 1 + k d1 ) + ( 2 + k d2 ) X2 + (
3
+
k 1
+
k dk 1
Xk
1
108
CHAPTER 7. SPECIFICATION OF REGRESSION MODELS
Where d1 ; d2 ; :::; dk 1 are OLS estimates of the coe¢ cients
of the omitted variable on all the included variables:
Xk =
1
+
2 X2
+ ::: +
1 ; 2 ; :::; k 1 ,
k 1 Xk 1
from the regression
+v
Thus, the bias of say b2 is k d2 , i.e. the coe¢ cient on the omitted variable in the true model,
times the estimated coe¢ cient on X2 in the regression of the omitted variable on all the
included variables.
7.2
Inclusion of Irrelevant Variable
Suppose that the true model is:
[true model] : Y =
1
+
2 X2
+ u;
1
+
2 X2
+
but the researcher thinks that the model is:
[mispeci…ed model] : Y =
3 X3
+u
In other words, the true coe¢ cient on X3 is 3 = 0, but the researcher, not realizing this,
…ts the equation:
Y^ = b1 + b2 X2 + b3 X3
Including irrelevant variable does not introduce a bias of regression coe¢ cients. The reason
is that the assumptions which guarantee that OLS estimators are unbiased, are not violated.
In particular, assumption A.3 (E (ui ) = 0 for all i) was used to prove that OLS coe¢ cients
are unbiased, still holds. In contrast, when we excluded a variable which was relevant (part
of the true model), the error term in the mispeci…ed model included the omitted variable,
and as a result the mean of the error was not the same for all observations.
The only adverse consequence of including an irrelevant variable is that the OLS coe¢ cients are no longer e¢ cient, i.e. do not have the smallest possible variance. To be speci…c,
the variance of b1 ; b2 when …tting Y^ = b1 + b2 X2 + b3 X3 is higher than the variance of the
same estimators when …tting the correct equation Y^ = b1 + b2 X2 . Intuitively, this happens
because in the true model we have 3 = 0, which is a piece of information that the researcher ignores when …tting Y^ = b1 + b2 X2 + b3 X3 . As usual, more information (which is
relevant of course) improves the precision of the estimators. For example, larger sample size
increases the precision of estimators (lowers their variance). Including irrelevant variable is
equivalent to not using some relevant information (that the coe¢ cient on that variable is
zero), and therefore the result is higher variance of the estimators. A larger variance means
a less precise estimator, and this translates into larger con…dence intervals and less accurate
hypothesis tests.
That being said, the consequences of including irrelevant variables are not as severe as
those of omitting relevant variable. Nevertheless, it is not a good practice to include arbitrary
variables in your regression model. To avoid inclusion of irrelevant variables, get the habit
of justifying each and every variable in the regression model with economic or other theory.
You must have a good reason behind inclusion of any variable in the model.
7.3. PROXY VARIABLES
7.3
109
Proxy Variables
As we have seen in the last two sections, omitting a relevant variable has far more severe
consequences than including an irrelevant variable into your regression model. What should
we do if we realize that based on economic theory a given variable should be in the regression,
but the data on such variable does not exist? Sometimes it is possible to …nd a proxy
variable, which is highly correlated with the omitted variable and therefore can substitute
for it.
For example, when you might realize that quality of schools in a district is an important
determinant of housing prices, and ideally you would include schools quality in a housing
price equation. The problem is that there is no data on "quality of schools". One solution
is to include proxy variable(s) in your regression model, such as teacher/student ratio, average spending per student, etc. Similarly, a researcher realizes that besides schooling and
experience in the wage regression, one should also include "ability" variable, which perhaps
captures innate ability, motivation, wisdom of the worker. The problem again is that there is
no data on "ability". Instead, researchers sometimes use IQ tests, or other similar tests which
hopefully measure various aspects of "ability". As another example, consider "health" level
of population, which might be relevant in various studies related to economic performance
of a country. Again, there is no such variable as "health", so researchers use life expectancy,
mortality rates and prevalence of diseases as proxies for "health".
Researchers show great ingenuity in collecting data on proxy variables. As our last
example, imagine that you would like to include a variable "honesty" in a model of economic
development, with the idea that societies with higher degree of honesty tend to prosper
more. Obviously, there is no data anywhere on the variable "honesty". In order to proxy for
honesty in di¤erent countries, researchers "lost" a bunch of wallets in di¤erent cities (New
York, Beijing, London, etc.). Each wallet had equivalent amount of money, adjusted for the
purchasing power in that location. In addition, each wallet contained an address, so that the
…nder of the wallet could return it to the owner. This way, the researchers collected data on
the fraction of wallets returned to their owner in each location, and that was their proxy for
"honesty".
7.4
Steps of Applied Research
In this section I provide very brief guidelines for conducting empirical research.
1. Research (Topic) Question. The starting point of applied research project is a research
topic/question. I advise to phrase title as a question, and be very speci…c. A bad
research title is "Labor Markets", because it is too general. A good research title
"Does Higher Minimum Wage Increase Unemployment of Unskilled Workers?".
2. Literature Review. The starting point can be a textbook, which cites seminal papers
on a particular topic. Try to identify the famous researchers who published in‡uential
article on your topic, and look at their webpages for further references. Read the
introduction and conclusions of articles that are too technical.
110
CHAPTER 7. SPECIFICATION OF REGRESSION MODELS
3. Economic (or other) Theory. Find out the relevant economic theory for the topic or
the question at hand. For example, if the topic is Minimum Wage, then it is part of the
…eld of Labor Economics, and the relevant theories are the labor markets, e¢ ciency
wage theory, search model of labor markets, etc.
4. Data Collection and Inspection. The economic theory should dictate what kind of data
is needed for the project. Before performing any type of statistical analysis, you must
summarize and visualize the data (summary statistics). You must document the data
sources, and the units of the data.
5. Econometric (Statistical) Model. The economic theory should dictate the econometric
model. Each variable included in your model, must be justi…ed on the basis of theory.
For example, to justify the inclusion of schooling in the earnings model, one can refer
to the human capital theory (whereby schooling helps accumulate skills, which enhance
to earning ability), as well as signalling theory (whereby schooling serves as a signal to
employers about the ability and potential of the candidate).
6. Statistical Analysis. Typically regression analysis, binary choice models, etc.
7. Conclusions. You must summarize and interpret the results of your statistical analysis.
For example "we found strong evidence that higher minimum wage increases unemployment among low-skilled workers, especially teenagers".
Chapter 8
Heteroscedasticity
Recall assumption A.4 about the regression model, in section 3.1, which states that the
disturbance (error) term is homoscedastic1 .
var (ui ) =
2
u
for all i
In other words, we assumed that the variance of the error term is the same for all observations.
In this chapter we discuss what happens when this assumption is violated. The resulting
problem is called heteroscedasticity2 . Mathematically, heteroscedasticity can be de…ned
as var (ui ) 6= var (uj ) for some i 6= j.
8.1
Illustrating Heteroscedasticity
The next …gure illustrates a simple regression model with homoscedastic disturbance term:
Yi = 1 + 2 X + ui . The bell shaped curves are plots of the pdf of Yi , which have a mean
of 1 + 2 X. You can see from these graphs that all ui have mean of zero and the same
variance.
The next …gure illustrates a simple regression model with heteroscedastic disturbance
term, such that var (ui ) is increasing with the value of the regressor X. The pdfs of the ui
1
2
Homo means same in Greek.
Héteros means di¤ erent in Greek.
111
112
CHAPTER 8. HETEROSCEDASTICITY
are still centered around zero, but they get more dispersed (or less precise) as the values of
X increase.
8.2
Consequences of Heteroscedasticity
In the presence of heteroscedasticity, the OLS estimators are still unbiased and consistent.
However, with heteroscedasticity we have two adverse consequences: (i) OLS estimators are
ine¢ cient, i.e. no longer have the lowest variance among all unbiased linear estimators, and
(ii) the estimated standard errors of the regression coe¢ cients, s:e:(b), are biased and as a
result the t-tests and the F -test are invalid.
8.3
Detection of Heteroscedasticity
There are several formal tests that detect heteroscedasticity in a regression model. Some are
based on particular assumptions about the form of heteroscedasticity, while others are more
general and do not depend on the particular form of heteroscedasticity.
8.3.1
Eyeballing (plotting the residuals)
We present …rst an informal method of detecting heteroscedasticity, which is based on
simply observing the residuals. The following example uses arti…cial data available at
http://online.sfsu.edu/mbar/ECON312_…les/hetero.csv. The …le contains data on one regressor X, and two dependent variables, Yhomo and Yhetero . The …rst one, Yhomo , was generated with errors drawn from the same distribution ui
N (0; 2u ), while the second one,
Yhetero , was generated with error terms with standard deviation increasing in the values of
the regressor X. Formally, the two models are as follows:
Yhomo;i =
Yhetero;i =
+
1+
1
+ ui , with s:d:(ui ) = u 8i
2 Xi + vi , with s:d:(vi ) = 0:05Xi
2 Xi
u
Estimation of the homoscedastic model results in the following …tted equation: Y[
homo =
[
b1 + b2 X. Using the command predict in Stata we generate the …tted values Yhomo , and
8.3. DETECTION OF HETEROSCEDASTICITY
113
plot them together with the actual values Yhomo on the same diagram3 :
0
10
20
30
40
50
Homoscedastic Errors
0
20
40
60
80
100
X
Y_homo
Fitted values
Notice that the actual values are spread evenly around the …tted line, which is expected
when the error terms are homoscedastic. The di¤erence between the actual and …tted values
are the residuals (ei = Yi Y^i ). The next …gure plots the residuals against the regressor X,
and we see that the residuals are evenly spread around the zero (their mean).
-10
-5
Residuals
0
5
10
Residuals Homoscedastic
0
20
40
60
80
100
X
Next we estimate the heteroscedastic model, and plot the actual and …tted values in the
3
See all the Stata commands in the associated DO-…le.
114
CHAPTER 8. HETEROSCEDASTICITY
next diagram.
0
20
40
60
80
Heteroscedastic Errors
0
20
40
60
80
100
X
Y_hetero
Fitted values
Notice that as the values of the regressor X increase, the actual values are more dispersed
around the …tted equation. This is an informal graphical evidence of the presence of heteroscedasticity. The next …gure plots the residuals from the …tted model, and again notice
how the residuals appear more spread as the values of the regressor X increase.
-20
-10
Residuals
0
10
20
30
Residuals Heteroscedastic
0
20
40
60
80
100
X
The message from this section is that one informal way to detect heteroscedasticity is to
plot the scatter of the residuals against regressors, and see if the variability looks constant,
or changing in a systematic way with one of the regressors.
8.3.2
The Goldfeld-Quand test
The …gures in the previous section motivated the Goldfeld-Quand test, which we will describe
now. The test is designed to detect one particular type of heteroscedasticity, the kind in
which the standard deviations of the error terms are proportional to the values of a regressor
X (increasing or decreasing). In other words, this is not a general test for detecting any kind
of heteroscedasticity. The test starts with sorting the values of a regressor X in accending
order. Next we run the same regression as the original
on the …rst m observations
Pm model
2
and compute the residuals sum of squares (RSS1 = i=1 ei ). Recall that RSS measures the
8.3. DETECTION OF HETEROSCEDASTICITY
115
variability of residuals in the sample, in this case in the sub sample containing the smallest m
values of the regressor X. Next we run the same regression using the last m observations (i.e.
using the largest values of the regressor X). The residual sum of squares in this regression
are RSS2 . It turns out that both RSS1 and RSS2 have a chi-square distribution, with m k
degrees of freedom and they are independent. Then the ratios have an F -distribution:
RSS2
RSS1
RSS1
RSS2
F (m
k; m
k)
F (m
k; m
k)
Lets assume, without loss of generality, that we are testing for heteroscedasticity where
the variance of the error terms is increasing in the values of the regressor X. Thus, the
residuals sum of squares in the regression on the last m observations should be greater than
that from the …rst m observations. We therefore would like to perform the test:
H0 : homoscedasticity
H1 : heteroscedasticity, var (ui ) increasing in Xi
In this case we reject the null hypothesis at signi…cance level , if the probability of F (m k; m
RSS2
is smaller than 5%. In other words, we reject the null hypothesis of homoscedasticity if
RSS1
2
the F-statistic RSS
is large enough. In Stata, the above probability is calculated as follows:
RSS1
Ftail(m-k,m-k,RSS2/RSS1).
If instead we we want to test for heteroscedasticity where the variance of the error terms
is decreasing in the values of the regressor X, then the test is
H0 : homoscedasticity
H1 : heteroscedasticity, var (ui ) decreasing in Xi
We reject the null hypothesis at signi…cance level if the probability of F (m k; m k) >
RSS1
is smaller than .
RSS2
The number of observations used in the two regression of the Goldfeld-Quand test, is
usually set to be m = 38 n, i.e. 3=8 of the total number of observations. This means that 1/4
of the observations from the middle are dropped, to increase the contrast between the …rst
and last m observations. This number is recommended by Goldfeld and Quand based on
their simulations.
8.3.3
The White test
The Goldfeld-Quandt test is designed to test for a particular type of heteroscedasticity - the
kind in which the standard deviation of the error terms is proportional to the values of one
of the regressors. Now we present a test (variation of a test developed by White 1980), which
is aimed at detecting any unknown type of heteroscedasticity. Suppose that you estimate
the model:
Yi = 1 + 2 X2;i + 3 X3;i + ::: + k Xk;i + ui
k) >
116
CHAPTER 8. HETEROSCEDASTICITY
The …tted equation is
Y^i = b1 + b2 X2;i + b3 X3;i + ::: + bk Xk;i
and the associated residuals are:
ei = Yi
Y^i
The test requires estimating the following equation:
e2i =
1
+
^ +
2 Yi
^2
3 Yi
+ vi
(8.1)
The dependent variable in equation (8.1), e2i , is an estimate of var (ui ). The idea is that
if this variance does not depend on the regressors, then we should have H0 : 2 = 3 = 0
(homoscedasticity). Thus, the F -test of overall …t of the model (8.1) allows us to test for
Heteroscedasiticity of unknown kind. In particular, we reject H0 at signi…cance level if
Prob > F after estimating (8.1) is smaller than . In this case, we conclude that the original
model su¤ers from heteroscedasticity of unknown kind.
8.4
Remedies for Heteroscedasticity
Recall that there are two adverse consequences of heteroscedasticity: (i) OLS estimators are
ine¢ cient, i.e. no longer have the lowest variance among all unbiased linear estimators, and
(ii) the estimated standard errors of the regression coe¢ cients, s:e:(b), are biased and as a
result the t-tests and the F -test are invalid.
8.4.1
Heteroscedasticity-robust standard errors
The …rst solution we propose, corrects the estimated standard errors, which enables us
to perform statistical tests based on the estimated model. Regardless of what form of
heteroscedasticity we have, it is possible to obtain estimates of standard errors of estimates
which are consistent. We will not discuss the details of this procedure, since it is beyond
the scope of this course. We simply point that if testing hypothesis is very important, one
simply needs to specify the option robust in the regress command, and Stata will compute
robust standard errors which are imuned to any form of heteroscedasiticity.
For example: regress wage edu, robust regresses the dependent variable wage on the
regressor education, and the option robust following the comma indicates that you wish to
obtain standard error of estimators which are robust to any heteroscedasticity.
This solution is very simple, and it always …xes the estimated standard errors of the OLS
estimators. However, the estimated coe¢ cients themselves are still ine¢ cient, although they
are unbiased and consistent. Most applied researchers however are not concerned too much
with the fact that OLS estimators in the presence of heteroscedasticity are not e¢ cient,
especially if they have a large sample. This is why most researchers today use the robust
option and only correct the standard errors (but not the estimators) for heteroscedasticity.
8.4.2
Weighted least squares (WLS)
The robust option is by far the most popular remedy for heteroscedasticity today. However, if
we are able to …gure out the form of heteroscedasticity, one can correct not only the standard
8.4. REMEDIES FOR HETEROSCEDASTICITY
117
errors of the coe¢ cients, but also obtain e¢ cient estimators for the regression coe¢ cients
themselves. The idea is to weight the observations in inverse proportion to the variance of
the disturbance term. This way, we assign more weight to observations with smaller variance
of the disturbance term, which is why this estimation is called weighted least squares (as
opposed to ordinary least squares, which treats all observations the same).
Suppose that you estimate the model:
Yi =
1
+
2 X2;i
+ ::: +
k Xk;i
+ vi
(8.2)
where var (vi ) = 2u Zi2 . This is a special case of heteroscedasticity, where the variance of the
error term is proportional to some variable Zi2 (equivalently, the standard deviation of the
error term is proportional to Zi ). Now, transform the original variables and the error term
by dividing them by Zi :
Yi
=
Zi
1
1
+
Zi
2
X2;i
+ ::: +
Zi
k
Xk;i
vi
+
Zi
Zi
(8.3)
Notice that the variance of the transformed error term is homoscedastic:
var
vi
Zi
=
1
var (vi ) =
Zi2
2
u
Thus, estimating the model in (8.3) using OLS, gives not only unbiased estimators, but also
e¢ cient. The estimated standard errors of the coe¢ cients are also unbiased, and all the tests
are valid. In other words, we …xed all the problems of heteroscedasticity, but remember
that we were able to do so only if we knew the particular form of the heteroscedasticity.
In practice, one way to estimate the model in (8.3), is to manually generating the transformed variables:
1
X2;i
Xk;i
Yi
,..., Xk;i =
Yi = , X1;i = , X2;i =
Zi
Zi
Zi
Zi
and …tting the model:
Y^i = b1 X1;i + b2 X2;i + ::: + bk Xk;i
(8.4)
Notice that this equation does not have an intercept term, unless Z is one of the regressors in the original model. Also, you must interpret the estimated coe¢ cients based on the
original model only (8.2) and not based on the transformed model (8.4). In other words,
in order to interpret the estimated coe¢ cients b1 ; b2 ; :::; bk , you must use the …tted equation
corresponding to the original model (8.2):
Y^i = b1 + b2 X2;i + ::: + bk Xk;i
A more convenient way of estimating the model in (8.3) in Stata, is using analytic
weights, for example, suppose that the variance in the wage equation is proportional to
education squared. Then, one can correct for heteroscedasticity by:
generate edu2 = edu^2
regress wage edu [aw=1/edu2]
Analytic weights, are weights that are inversely proportional to the variance of an observation. Stata automatically creates the transformed variable, by multiplying the original
model by the root of the analytic weights. One has to be careful to avoid dividing by zeros,
so the variable Zi must be strictly positive for all i.
118
CHAPTER 8. HETEROSCEDASTICITY
Chapter 9
Discrete Choice Models
Some of the most important choices we make in our lives are "either-or". For example, after
graduating with a B.A. in economics, you decide wether to look for a job, or continue to
a graduate or professional school. Other examples include getting married or not, buying
a house or renting, voting for proposition #N or not. Such choices are modeled with a
binary (dummy) dependent variable. More formally, in such models the observed dependent
variable that we want to analyze takes on two values, as in the next examples1 :
[Marriage choice] : Yi =
1
0
individual i marries
individual i stays single
[Voting for a proposition] : Yi =
1
0
individual i votes "YES
individual i votes "NO"
[Home ownership] : Yi =
1
0
individual i owns a house
individual i rents
[Transportation mode] : Yi =
1
0
individual i drives to work/school
individual i uses public transportation
[Smoking] : Yi =
1
0
individual i smokes
individual i does not smoke
[Labor force participation] : Yi =
1
0
individual i is in the labor force
individual i is not in the labor force
[Union membership] : Yi =
1
0
individual i is a union member
individual i is not a union member
[Migration] : Yi =
1
0
individual i decides to migrate
individual i does not migrate
In some cases, the word "choice" is replaced by response or outcome when the result is not
literally a cognitive choice. For example, a …rm going out of business or staying in business
1
Discrete choice models in general include choices between several alternatives, e.g. high school diploma,
college degree, advanced degree contains 3 educational choices. In these notes we restrict attention to binary
choice models - containing two alternatives only.
119
120
CHAPTER 9. DISCRETE CHOICE MODELS
is a binary response. Examples of binary responses:
[Loan application] : Yi =
1
0
loan for individual i approved
loan for individual i denied
[Bankruptcy] : Yi =
1
0
…rm i goes bankrupt
…rm i stays in business
[Recession] : Yit =
1
0
economy i is in recession at time t
economy i is not in recession at time t
Suppose that the theory tells us that the response Yi depends on some characteristics
X2 ; :::; Xk . Our …rst instinct is to use the linear probability model
Yi =
1
+
2 X2;i
+ ::: +
k Xk;i
(9.1)
+ ui
How would one interpret the coe¢ cients in the linear probability model, in (9.1)? Remember
that the data on the left hand side is a sequence of 0’s and 1’s, so the values of Y do not change
gradually. The standard interpretation of k is the e¤ect of a one unit increase in Xk on the
probability that Y = 1. In other words, we pretend that the model predicts P (Yi = 1).
One problem with this interpretation is that the right hand side cannot be restricted to the
[0; 1] interval, and the predictions of this model can give negative probabilities or probabilities
of more than 1. Therefore, although the linear probability model is easy to estimate using
OLS, the inconsistency of the left hand side and the right hand side are the reason why it is
no longer used in modern research.
One way out of this problem is to construct a model that is explicitly designed to predict
probabilities. Such models involve the so called latent variable (unobserved variable) Yi ,
which can attain all values in [ 1; 1], and represents the tendency or propensity of a
positive response of Yi . For example, Yi could be the indicator of a bank failure (which is
observed), and Yi is the tendency of a bank to fail, which is unobserved and depends on all
kinds of observed characteristics, such as delinquency rate, leverage (risk), and fraction of
real estate loans. Thus, we can postulate that
Yi =
1
+
2 X2;i
+ ::: +
k Xk;i
+ ui
So the tendency of the bank to fail depends on some observed characteristics X-s, parameters -s and some unobserved characteristics represented by the error term ui . We cannot
estimate this model with Yi as dependent variable, because Yi is not observed, and we only
observe the binary outcome Yi . The solution is to postulate that we observe Yi = 1 if Yi
0
and Yi = 0 if Yi < 0. The threshold of 0 is not restrictive because the constant term will
adjust to any threshold we would choose. Thus, the probability model we will try to estimate
is:
P (Yi = 1) = P (Yi
0)
= P ( 1 + 2 X2;i + ::: +
k Xk;i
+ ui
0)
In other words, we will try to predict the probability of Yi = 1 (say bank failure), which
is the probability that the tendency (of a bank to fail) Yi is "high enough" or bigger than
some threshold.
9.1. THE PROBIT
9.1
121
The Probit
A common assumption about the error term is that for all i,
ui
N (0; 1)
With this assumption, we have:
P (Yi = 1) =
=
=
=
P
P
P
P
0)
(Yi
( 1 + 2 X2;i + ::: + k Xk;i + ui 0)
(ui
( 1 + 2 X2;i + ::: + k Xk;i ))
(ui
1 + 2 X2;i + ::: + k Xk;i )
The last step follows from the fact that the distribution of ui is symmetric around zero.
Thus, we can write:
P (Yi = 1) = ( 1 + 2 X2;i + ::: + k Xk;i )
(9.2)
where
as:
is the cumulative distribution function of the standard normal distribution, de…ned
Z x
z2
1
p exp
(x) P (X x) =
dz
2
2
1
The model in (9.2) is called the Probit model. The integrand is the standard normal p.d.f.:
1
(z) = p exp
2
z2
2
We postpone the discussion about how to estimate the unknown coe¢ cients
in the probit model, and suppose that we have obtained the …tted equation:
\
P (Y
i = 1) =
1;
2 ; :::;
k
(b1 + b2 X2;i + ::: + bk Xk;i )
Notice that the right hand side is restricted to be in [0; 1], since is cumulative distribution
function which by de…nition returns values that are probabilities.
The purpose of the model is to estimate the e¤ects of the regressors on the probability
of Yi = 1. Therefore, with regular (non-dummy) variables, we are interested in:
\
@ P (Y
i = 1)
=
@Xk;i
(b1 + b2 X2;i + ::: + bk Xk;i ) bk
which is the e¤ect of a one unit increase in Xk;i on the probability of Yi = 1. This is called
the marginal e¤ect of regressor k, and notice that it depends on the values of all the
regressors. Thus, the marginal e¤ect of say one year of schooling on the probability of home
ownership, will depend on the level of schooling, as well as on the levels of other regressors
such as income, family size, etc. In Stata marginal e¤ects are computed using mfx compute,
after estimating the probit model. The marginal e¤ects are, by default, evaluated at the
means of all the regressors. Instead of the default, the marginal e¤ects can be computed at
any point using the mfx at() command. For regressor Xk that is a dummy variable, the
marginal e¤ect is the change in predicted probability as Xk changes from 0 to 1, i.e. the
\
\
marginal e¤ect is P (Yi =
1jXk = 1) P (Yi =
1jXk = 0).
122
9.2
CHAPTER 9. DISCRETE CHOICE MODELS
Logit Model
An alternative to the probit model, assumes that the error terms have some other distribution
- the so called extreme value distribution. This leads to a very similar model to the one in
(9.2):
P (Yi = 1) = ( 1 + 2 X2;i + ::: + k Xk;i )
(9.3)
where
is the cumulative distribution function of the logistic distribution, de…ned as:
(x) =
exp (x)
1 + exp (x)
with p.d.f.:
(x) =
exp ( x)
[1 + exp ( x)]2
One might wonder why do we need another model, which is very similar to probit? The
main advantage of the logit is that the estimation is easier in terms of the computation
required. Notice that ( 1 + 2 X2;i + ::: + k Xk;i ) is given explicitly, while in order to
compute ( 1 + 2 X2;i + ::: + k Xk;i ), one needs to solve an integral. Stata has very e¢ cient
algorithms, so this advantage of logit over probit will matter only if you use huge samples.
For most practical purposes, you won’t care which model to use, and researchers often report
both results just to show that they are very similar.
As with probit, after estimation we obtain the …tted equation:
\
P (Y
i = 1) =
(b1 + b2 X2;i + ::: + bk Xk;i )
The marginal e¤ects are similar to the probit case:
\
@ P (Y
i = 1)
=
@Xk;i
(b1 + b2 X2;i + ::: + bk Xk;i ) bk
which is the e¤ect of a one unit increase in Xk;i on the probability of Yi = 1. In Stata,
marginal e¤ects are computed using the command mfx compute after estimating the logit
model.
9.3
Estimation of the Probit and Logit Models
The probit an logit models can be written as
P (Yi = 1) = F (
1
+
2 X2;i
+ ::: +
k Xk;i )
where F = in the probit model and F = in the logit model. The unknown parameters
cannot be estimated using OLS, and usually estimated using the maximum likelihood
approach. Remember that we do not have data on the probability that Yi = 1, but instead
the dependent variable is binary (a bunch of zeros and ones. The model however de…nes the
probability that for given observation i we have Yi = 1. The probability (or the likelihood)
9.3. ESTIMATION OF THE PROBIT AND LOGIT MODELS
123
that our sample was generated from our binary choice model is therefore (remembering that
observations are independent):
Y
Y
L=
F (b1 + b2 X2;i + ::: + bk Xk;i )
(1 F (b1 + b2 X2;i + ::: + bk Xk;i ))
Yi =1
Yi =0
The maximum likelihood estimation technique tries to …nd parameters b1 ; b2 ; :::; bk that
maximize the likelihood of obtaining the observed sample on the dependent variable from
our model. Maximizing the likelihood is mathematically the same as maximizing the loglikelihood, l = ln L, but the latter is computationally more stable. Thus, in practice, the
function being maximized is:
X
X
l=
ln F (b1 + b2 X2;i + ::: + bk Xk;i ) +
ln (1 F (b1 + b2 X2;i + ::: + bk Xk;i ))
Yi =1
Yi =0
It is understood that the …rst summation is over the observations with Yi = 1 and the second
summation is over the observations with Yi = 0.
In Stata, one uses the command probit or logit just the way you would use regress
to estimate a regression model. After these commands, you need to specify the dependent
variable, which must be binary (dummy), followed by a list of regressors. For example, see
the DO-…le posted on the course web page.
124
CHAPTER 9. DISCRETE CHOICE MODELS
Chapter 10
Time Series
All the data that you will ever encounter in econometrics or statistics can be classi…ed into
3 types: (i) cross-sectional data refers to data collected by observing many subjects (such
as individuals, …rms or countries/regions) at the same point of time, or without regard to
di¤erences in time, (ii) time-series data follows one subject’s changes over the course of
time, and (iii) panel data combines both cross-section and time series and looks at multiple
subjects and how they change over the course of time.
An example of cross-sectional data would be Census, which contains income, schooling,
age, sex, and many other characteristics of many individuals in a given year (say 2000). The
next sheet displays a part of a cross-sectional data set. Each row corresponds to a particular
individual, indexed by id number (1st column).
So far in this course we focused on cross-sectional data, since the econometric theory for its
analysis is the most basic.
An example of a time series would be NIPA (National Income and Product Accounts)
for the U.S. So the subject is just one country, the U.S., and the sample contains data on
GDP, Investment, Consumption, Government Spending, etc., for di¤erent years. The next
sheet displays a part of a time-series data on the U.S. Notice that each row is a year in this
125
126
CHAPTER 10. TIME SERIES
case, but it could be a quarter or a month.
Time series analysis accounts for the fact that data points taken over time may have an
internal structure (such as autocorrelation, trend or seasonal variation) that should be accounted for. This chapter presents a brief discussion of speci…c econometric problems arising
in time-series models.
An example of a panel data would be PSID, http://psidonline.isr.umich.edu (Panel Study
of Income Dynamics), which has information on more than 70,000 individuals spanning as
many as 4 decades of their lives. It is important to understand that combining several census
data, say for 1990, 2000 and 2010, does not constitute a panel. The census dose not keep
track of the same individuals over time, and an individual who had id number 9723 in
1990, might have a totally di¤erent id number in 2000 census and yet another number in 2010
census. A panel must track the same individuals over several time periods. For example,
Rita Morgan in 1990 panel had age = 15, income = 0, schooling = 9, and the same Rita
in the 2000 panel had age = 25, income = $35,000, and schooling = 16. Since panel data
analysis contains methods from cross-section and time series, and also methods speci…c to
panel data analysis, this topic is not covered in a one-semester intro to econometrics course.
10.1
Regression with Time Series Data
The linear model we used so far in analysis of cross sectional data is the multiple regression
models:
Yi = 1 + 2 X2;i + 3 X3;i + ::: + k Xk;i + ui
The index i refers to subject, say i = 25 is a particular individual with income Y25 , schooling
level X2;25 , experience X3;25 , and disturbance term (capturing all other in‡uences on income)
u25 . To distinguish the regression for cross-sectional data from regression using time series
data, the index becomes t instead of i:
Yt =
1
+
2 X2;t
+
3 X3;t
+ ::: +
k Xk;t
+ ut
10.1. REGRESSION WITH TIME SERIES DATA
127
For example, suppose that we have data on average consumption, income and wealth of
individuals in Japan, for the years t = 1960; :::; 2000. We might want to estimate the model:
Ct =
1
+
2 It
+
3 Wt
+ ut , t = 1960; :::; 2000
If the only di¤erence between time series and cross-section was the index t instead of i,
then we would not need to study time series analysis as a separate subject. There are
however several important di¤erences between estimating the above consumption function
and estimating the cross-sectional relationship
Ci =
1
+
2 Ii
+
3 Wi
+ ui
where i = 1; :::; 40 are all individuals from the same year (say 2000). We will brie‡y discuss two issues that arise primarily in time series analysis: (i) autocorrelation, and (ii)
nonstationarity.
10.1.1
Autocorrelation (serial correlation)
Assumption A.5 in section 3.1 states that the disturbance (error) terms for di¤erent observations are independent of each other. This means ui and uj are statistically independent
random variables for all i 6= j, and since independence implies no correlation, this assumption
implied also that cov (ui ; uj ) = 0 for all i 6= j. The analog of A.5 for time series would be that
ut and ut0 are statistically independent, and therefore cov (ut ; ut0 ) = 0 for all t 6= t0 . When
assumption A.5 is violated, we say that the error terms are subject to autocorrelation, or
serial correlation.
Remember that the error term captures all the e¤ects on the dependent variable, other
than the e¤ects of the included regressors. In cross sectional data it is reasonable to assume
that A.5 holds, since we sample individuals independently and unobserved factors a¤ecting
my earnings (motivation, ambition,...) should not be correlated with those of another individual who is also included in the sample. In time series data however, the error terms
represent the unobserved (or excluded) e¤ects on the same object over di¤erent time periods.
For example, factors a¤ecting in‡ation rate, unemployment rate, interest rate, GDP, etc. in
2010, are likely to still be present in 2011. Therefore, it is often assumed that autocorrelation (or serial correlation) is a potential problem only in time series data (not in
cross-sectional data).
The consequences of serial correlation are similar to those of heteroscedasticity: (i) the
OLS estimators are still unbiased, but they are ine¢ cient (do not have the smallest possible
variance in the class of unbiased linear estimators), and (ii) the estimated standard errors
of the OLS estimators are biased, which makes statistical hypothesis tests invalid. As in
the case of heteroscedasticity, if we know exactly the form of the autocorrelation, we can
perform some transformation of the original model and eliminate the problem.
The detection of serial correlation is based on residuals, just as heteroscedasticity. For
example, consider quarterly data on in‡ation and unemployment:
use http://online.sfsu.edu/mbar/ECON312/phillips.dta, clear
regress Inf Unemp //Estimating linear Phillips curve
predict resid, residual //Generating the residuals
128
CHAPTER 10. TIME SERIES
-0.50
Autocorrelations of resid
0.00
0.50
1.00
ac resid //Plotting (estimated) Autocorrelation function based on residuals
0
10
20
Lag
30
40
Bartlett's formula for MA(q) 95% confidence bands
The above graph plots the estimated autocorrelation function based on the residuals, i.e. the
estimated k = corr (ut ; ut+k ) for k = 1; :::; 40. Let ^k be an estimate of k , so the vertical
bars are values of ^k for k = 1; :::; 40. The grey area is a 95% con…dence interval constructed
for the null hypothesis (with two-sided alternative):
H0 :
H1 :
k
k
=0
6= 0
If ^k is outside the 95% con…dence interval, then we reject the null hypothesis
that k.
Other tests for serial correlation, that can be performed in Stata:
estat bgodfrey, lags(6) //Breusch-Godfrey (1988) test
estat durbinalt, lags(6) //Durbin (1970)
wntestq resid //white noise test
The null and alternative hypothesis in all the above tests is:
k
= 0 for
H0 : no serial correlation
H1 : there is serial correlation
The Breuch-Godfrey and Durbin tests allow specifying the maximum number of lags (k) for
which to test for serial correlation. All the tests are based on chi-square statistic, and report
the p-value of the test as: Prob > chi2. In all the cases we reject the null hypothesis (H0 :
no serial correlation) at signi…cance level , if Prob > chi2 is smaller than .
As with heteroscedasticity, it is possible to eliminate the problem of serial correlation if
we know its exact form.
10.1.2
Trends
Many economic time series exhibit a trend, due to some unobserved factors or omitted
factors. For example, consumption per capita, investment per capita, income per capita
10.1. REGRESSION WITH TIME SERIES DATA
129
or taxes per capita in a country, could all grow because of some underlying technological
progress which makes everybody richer on average. Theory of trends is an enormous …eld in
engineering, called …ltering or signal processing. In these notes we only consider linear
trends. If a time series grows at constant rate, then it is easy to show that its natural
logarithm has a linear trend (is a linear function of time). For example, the Gross National
Product in the U.S.A. is plotted in the next graph.
Real GNP per capita (USA)
40
35
30
25
20
15
10
5
0
1900 1910 1920 1930 1940 1950 1960 1970 1980 1990 2000 2010 2020
Year
The natural logarithm of the above series looks like ‡uctuations around a linear trend (linear
function of time).
ln(Real GNP per capita)
4
3.5
3
2.5
2
1.5
1
1900
1920
1940
1960
1980
2000
2020
Year
When using regression analysis, it is very important to be aware that the dependent variable (Yt ) and the regressors, might exhibit trends. If unobserved factors (e.g. technological
advances) are responsible for the trend in the dependent variable, then ignoring these factors
can cause an omitted variable bias (see section 7.1 for review of omitted variable bias). The
simplest solution is to include the variable "time" as one of the regressors.
130
CHAPTER 10. TIME SERIES
The following example uses time series on investment in housing and housing prices. The
idea is to estimate the demand for housing investment as a function of housing prices. The
dependent variable linvpc is ln of housing investment per capita, and the regressor lprice
is the ln of housing price index.
use http://online.sfsu.edu/mbar/ECON312/HSEINV.dta, clear
regress linvpc lprice //Ignoring time trend
The resulting Stata output is:
-1
-.8
-.6
-.4
-.2
0
Notice that the estimated price elasticity of demand for housing investment is positive,
suggesting that a 1% increase in housing prices increases the demand for housing investment
by 1.24%. This result does not make sense, as we expect to have a negative relationship
between price and quantity demanded.
A closer look at both variables, suggests that they might contain a (linear ?) time trend:
0
10
20
30
40
t
linvpc
lprice
We can see that the positive relationship, previously estimated, does not represent a causal
link from prices to demand, but instead both prices and demand are driven by the growth in
income. The previous regression, which ignores the trends, is often called spurious regression
(meaning false or fake), because it does not measure the causal e¤ect of prices on demand.
Now we include a linear time trend in the above regression:
regress linvpc lprice year //Including time trend
10.1. REGRESSION WITH TIME SERIES DATA
131
The resulting Stata output is:
Notice that after accounting for the linear trend, the regression results completely changed.
The price elasticity of demand is now negative, as economic theory suggests.
Technical note
Consider the simple regression model, with both the dependent variable and regressor exhibiting constant growth rate. In particular, Yt is growing at constant rate of gy and Xt is
growing at another rate gx . This implies that the natural logarithms of both variables will
‡uctuate around linear functions of time. Suppose that the relationship between the two
variables is such that the deviations from linear trend of ln (Yt ) are a¤ected by the deviations
from linear trend of ln (Xt ) as follows:
ln Yt
ln Y0
t ln (1 + gy ) =
1
+
2
[ln Xt
ln X0
t ln (1 + gx )] + ut
Rearranging the above:
ln Yt = ( 1 + ln Y0
2 ln X0 ) +
~
ln Yt = 1 + 2 ln Xt + ~ 3 t + ut
2
ln Xt + [ln (1 + gy )
2
ln (1 + gx )] t + ut
First, the above shows that a model without t as one of the regressors ln Yt = ~ 1 + 2 ln Xt + ut
will su¤er from omitted variable bias. The estimate of 2 will be biased upward if Xt is positively correlated with t and downward if Xt is negatively correlated with t. However, notice
that despite the fact that Yt and Xt exhibit di¤erent growth rates along their trends, including time as regressor allows estimating, without bias, the true e¤ect of Xt on Yt - i.e. 2 .
In conclusion, when you suspect that the dependent variable and/or some of the regressors
contain a time trend, the easiest remedy is to include time as a regressor.
Other informal remedies include (i) detrending, and (ii) normalizing. Detrending means
that you remove the time trend from the variables, and use detrended variables only. For
example, suppose the original variable xt contains a time trend xt . We create a new variable
xt = xt xt , which is called detrended xt . All variables that contain trends are transformed
in this way, and replaced by detrended variables in regression analysis. Another approach,
similar to detrending is normalizing. Suppose a bunch of macroeconomic variables exhibit
132
CHAPTER 10. TIME SERIES
the same trend as GDP. Examples include consumption, investment, saving, government
spending, tax revenues, de…cit, national debt, etc. All such variables, can be divided by
GDP, and therefore called normalized. For example, if Ct is aggregate consumption, then
ct = Ct =GDPt is the ratio of consumption to GDP or normalized consumption. If your
analysis includes macroeconomic variables such as the ones mentioned above, and which
are likely to exhibit growth trend similar to that of GDP, normalizing these variables will
eliminate the trend.


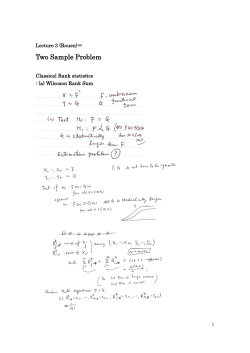

© Copyright 2026