
BTS Group Holdings (BTS TB) Leading Provider Of
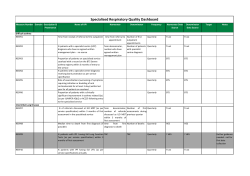
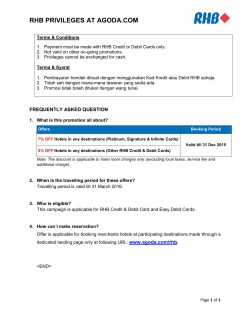
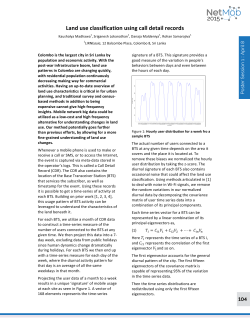
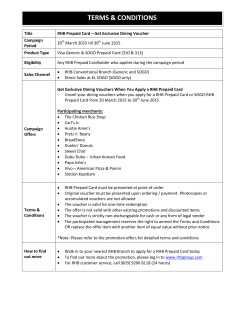
Reinitiating Coverage, 27 March 2015 BTS Group Holdings (BTS TB) Buy (from Trading Buy) Transport - Transportation Market Cap: USD3,370m Target Price: Price: THB11.60 THB9.30 Macro Risks Leading Provider Of Mass Transit Solutions Growth Value BTS Group Holdings (BTS TB) Price Close Relative to Stock Exchange of Thailand Index (RHS) 10.8 112 10.3 108 9.8 104 9.3 100 8.8 95 8.3 91 7.8 300 87 200 Jan-15 Nov-14 Sep-14 Jul-14 May-14 50 Mar-14 Vol m 100 Source: Bloomberg Avg Turnover (THB/USD) Cons. Upside (%) Upside (%) 52-wk Price low/high (THB) Free float (%) Share outstanding (m) Shareholders (%) 327m/10.00m 23.7 24.7 8.05 - 10.5 58 11,823 Keeree Kanjanapas Thai NVDR 32.6 6.5 Share Performance (%) YTD 1m 3m 6m Absolute (3.6) (5.6) (5.1) (3.1) 9.4 Relative (5.8) (1.0) (6.1) 0.4 (3.0) The only private mass transit operator in Thailand. BTS Group Holdings (BTS) operates the Green Line, Bangkok’s most important mass transit line. It is undoubtedly a prime beneficiary of the city’s fastgrowing mass transit system. The company expects: i) Bangkok’s mass transit coverage to grow 4x to 155km in 2018 (2013: 36km), and ii) its mass transit operations & maintenance (O&M) revenue to increase 6x to THB10bn in 2018 (2013: THB1.5bn). We expect total mass transit rail length to increase to 515km in 2029 from 100km in 2013. New joint-ventures (JVs) to enhance business value. BTS’ hidden asset lies in its landbank of 1,350 rai (2.15m sq m) worth THB11bn in book value. It owns several hotels and used to develop some property projects. However, since it is not an expert in this field, BTS is doing a share swap deal with Natural Park Public Co Ltd (NPARK TB, NR), partially to monetise its assets – Eastin Hotel Sathorn and two plots of land in prime Bangkok areas – in exchange for a 35% stake in Natural Park. Through the latter, BTS will develop commercial projects. Also, it is jointly developing residential projects with Sansiri (SIRI TB, BUY, TP: THB2.60), a well-known property developer. Its most recent JV is with AEON Thana Sinsap (Thailand) (AEON) (AEONTS TB, NR), which looks to add value to its Rabbit card e-money business. The card is a common ticketing method for Bangkok’s mass transit network. Strong synergy in other businesses. BTS, via 65%-owned subsidiary VGI Global Media (VGI) (VGI TB, SELL, TP: THB5.05), is a leader in out-of-home media. VGI’s business was weak in FY15 (Mar) amid soft advertising expenditure (adex), but we expect a modest recovery in FY16. Inorganic growth will be derived from the acquisition of other below-the-line media companies, which are generally run by small- and medium-sized enterprises (SMEs). 12m Shariah compliant Forecasts and Valuations Mar-12 Mar-13 Mar-14 Mar-15F Mar-16F Total turnover (THBm) 7,976 5,585 8,115 6,662 7,119 Reported net profit (THBm) 2,106 1,719 12,645 2,808 2,481 Recurring net profit (THBm) 1,035 1,693 1,810 2,325 2,481 63.6 6.9 28.5 6.7 Recurring net profit growth (%) na Recurring EPS (THB) 0.11 0.16 0.16 0.20 0.21 DPS (THB) 0.30 0.54 0.60 0.65 0.72 Recurring P/E (x) 86.9 57.3 59.4 47.7 44.7 P/B (x) 2.55 2.18 1.95 2.12 2.37 Naruedom Mujjalinkool P/CF (x) 51.2 20.8 33.4 28.1 22.2 Research Associate Dividend Yield (%) 3.2 5.8 6.5 7.0 7.7 24.3 28.8 15.1 19.3 13.9 Wanida Geisler +66 2862 9748 [email protected] EV/EBITDA (x) Return on average equity (%) Net debt to equity (%) Our vs consensus EPS (adjusted) (%) See important disclosures at the end of this report 3 . 1 0 . 2 0 0 . 3 0 0 BTS is a prime beneficiary of Bangkok’s fast-growing mass transit . 0 system. We resume coverage with a BUY and new SOP-based THB11.60 0 TP (26% upside). Its recent business restructuring and expansion in 0 property and services should help drive long-term prospects. In our view, it deserves to trade at a high P/E as it is Thailand’s only private fully-integrated mass transit operator and offers high 6-8% dividend yields. 250 150 Source: Company data, RHB 6.0 4.1 66.9 14.8 24.2 net cash 5.1 5.0 net cash net cash (7.1) (5.4) Powered by EFATM Platform 1 BTS Group Holdings (BTS TB) 27 March 2015 Table Of Contents See important disclosures at the end of this report Valuation And Recommendation 3 Risks 4 Company Profile 6 Results Review 17 Outlook 18 2 BTS Group Holdings (BTS TB) 27 March 2015 Valuation And Recommendation Resuming coverage on BTS with BUY and THB11.60 TP. Over the past two years, BTS has made meaningful progress in restructuring and expanding its businesses, which we believe will help drive its future growth. Major developments include: i) a high possibility of BTS getting the O&M contracts for the mass transit system’s extension lines, ii) VGI’s new business areas (eg advertising (ad) media screens at Victory Monument area, Empire Tower and Chamchuri Square as well as ad media space in FamilyMart convenient stores), iii) its new JV with Sansiri to develop residential projects on BTS’ landbank and a share swap to hold a 35% stake in Natural Park to develop commercial properties, iv) BTS new special purpose vehicle (SPV) with AEON to add value to its Rabbit card, and v) BTS’ expansion of its food business, ChefMan, by another 13 branches. Due to the above reasons, we expect the company’s revenue and core net profit to grow 7% in 2016. BTS also commits at least THB8bn of annual dividend payment, reflecting an attractive dividend yield of about 6-8% per year. Using SOP to derive a new TP. We value BTS’ core business (O&M and services) at THB24.12bn using the DCF methodology, assuming 9.4% WACC and 2.5% terminal growth. We value its equity holding in VGI at THB27.65bn, based on a 65% stake at the current price. We also value its 33.33% stake in the BTS Rail Mass Transit Growth Infrastructure Fund (BTSGIF) at THB44.42bn using the DDM method, assuming 2.5% terminal growth. We assume P/BV of 2x to appraise its landbank. We note that BTS continues to trade at a high P/E multiple (Figure 2) and against its peers (Figure 3), given that it is the only private mass transit operator in Thailand. Figure 1: BTS’ valuation table THBm Remarks VGI 27,646 65% stake in VGI (based on price of THB6.20 on 18 Mar) BTSGIF 44,415 33.33% stake in BTSGIF (DDM on 2.5% terminal growth) O&M 24,117 DCF on 2.5% terminal growth and 9.4% WACC Landbank 22,200 2x P/BV Net cash - net debt 19,480 Total Share base (m) TP per share (THB) 137,858 11,919 11.60 Source: RHB Figure 2: BTS’ historical P/E Source: RHB See important disclosures at the end of this report 3 BTS Group Holdings (BTS TB) 27 March 2015 Figure 3: Peer comparison Mass transit company Ticker Company BTS GROUP HOLDINGS TB* BANGKOK METRO TB KEIKYU JP KEIO CORP JP Average Average (excluding BTS Group) Market Cap USDbn BTS TB BMCL TB 9006 JP 9008 JP 3.37 1.19 4.63 5.46 P/E 15F 46.46 n.a. 47.02 34.04 29.69 28.57 16F 42.59 n.a. 44.65 31.22 25.29 24.13 P/BV 15F 16F 1.96 2.11 5.34 5.56 2.39 n.a. 2.00 1.89 4.14 4.08 4.21 4.12 EV/EBITDA 15F 16F 30.24 27.79 73.51 43.69 n.a. n.a. 12.86 12.65 18.21 14.59 13.41 11.57 Div yield (%) 15F 16F 6.59 7.40 0.00 0.00 0.60 0.60 0.80 0.87 2.06 2.41 1.90 2.24 Source: Bloomberg, RHB Price close as of 25 Mar * RHB estimates Risks Extension line may be delayed. Although BTS expects the operations of most of its extension lines to start within 2018-2019, there may be the risk of delays in the following processes: i) fiscal study and EIA approval, ii) bidding and negotiations, and iii) construction. This could slow down the future sources of BTS’ income, which are expected to begin operations as soon as possible. Note, however, that the company has always sought other sources of revenue beside its mass transit business. This is to ensure its growth potential and to drive good returns to shareholders. Holding 35% of Natural Park may reflect losses in the short term. Although the switching of its land plot into a 35% stake in Natural Park was deemed a good move for BTS to unlock its assets and improve its future ROA, the company may have to face the share of losses from its associate. Natural Park – in the past – recognised losses for three consecutive years (Figure 4). However, this year may not be the same as it was in the past. This is because Natural Park will recognise the revenue from the Eastin Grand Hotel Sathorn of about THB500m per year, which ought to help its bottomline to improve from last year’s numbers. In addition, BTS will appoint some of its management team as Natural Park directors. This should help improve operational efficiency and steer the company towards a better direction going forward. Natural Park is in a strong financial position, with net cash of about THB2.8bn (cash: THB4.9bn, debt: THB2.1bn). Figure 4: Natural Park’s sales, and gross, operating and core profits Source: RHB See important disclosures at the end of this report 4 BTS Group Holdings (BTS TB) 27 March 2015 Adex may recover slower than expectations. Although we expect total adex to pick up this year by about 7-9%, it is still a risk that it may recover slower than our expectations. The factors that may hamper recovery are: i) GDP not reaching the BOT’s 3-4% target, and ii) domestic consumption remaining continuously weak. However, VGI, which acts as an out-of-home media business, should experience less effect from the slow recovery in total adex. This is because the out-of-home media segment – comprising outdoor, transit and in-store media – has performed better than total adex, declining only 5.2% YoY in 2014 vis-à-vis total adex’s decline of 9.5% (Figure 5). Figure 5: Out of home media vs total adex Source: Nielsen See important disclosures at the end of this report 5 BTS Group Holdings (BTS TB) 27 March 2015 Company Profile Currently, BTS is Thailand’s leading passenger services provider, which focuses on mass transit solutions in Bangkok. It is also the country’s largest out-of-home media company through its subsidiary VGI. BTS is also engaged in commercial and residential property development along the mass transit routes. Moreover, its services business provides strategic support for the rest of the BTS Group. This division operates the Rabbit card e-money system – a common ticketing system across Bangkok’s mass transit network and ChefMan restaurants. Figure 6: BTS’ 9MFY15 (Mar)’s revenue breakdown Source: Company data Mass Transit Business O&M business BTS Skytrain. In 2009, BTS subsidiary Bangkok Mass Transit System (BTSC) was awarded a 30-year O&M contract by Krungthep Thanakom Co Ltd, a wholly-owned subsidiary of the Bangkok Metropolitan Administration (BMA), to operate and maintain two extensions of the BTS Skytrain network. This is the 7.5km (six stations) extension of the Light Green Line from Saphan Taksin-Bang Wa and the 5.3km (five stations) extension of the Dark Green Line, totalling 12.8km (11 stations). This landmark agreement will enable BTS to build up its recurring income sources and reduce its dependence on fare-box income. The company will also get the operation fee from the BMA at a fixed rate. About THB1,700m will be paid to BTS this year, with a 3.8% contractual increase every year. Figure 7: BTS’ O&M business Source: Company data See important disclosures at the end of this report 6 BTS Group Holdings (BTS TB) 27 March 2015 Bangkok Rapid Transit (BRT). The BMA outsourced the management of the BRT to BTSC via bus operations and station management agreements. Under the agreements, the BMA receives all the revenue from fares while the BTSC receives pre-agreed annual fees. In return, BTSC bears the operating and maintenance expenses as well as the investment in the buses. The BRT Line comprises 12 stations, with buses running along a 15km-long dedicated bus lane. There is direct connectivity (via SkyBridge link) between BRT Sathorn and BTS Chong Nonsi stations (Figure 8). Figure 8: BRT’s route Figure 9: BRT’s bus Source: Company Source: Company Invests in BTSGIF BTSGIF is an infrastructure fund. The initial assets invested by the fund are net farebox revenues to be generated from the operation of core Skytrain Green Lines covering 23.5km, consisting of two lines (Mo Chit-On Nut and Taksin Bridge-National Stadium). The concession in respect of core Skytrain will expire in approximately 17 years (4 Dec 2029). The investment cost totals THB61,399m. BTS is the largest stakeholder in revenues of the core network via a holding of one-third of all units of BTSGIF held via BTS Group. Figure 10: BTSGIF structure Source: Company See important disclosures at the end of this report 7 BTS Group Holdings (BTS TB) 27 March 2015 Figure 11: Number of registered vehicles in Bangkok Figure 12: Historical BTS ridership Source: Department of Land Transport Source: Company data Traffic congestion continues to spur rail mass transit demand. Bangkok has experienced a rise in demand for cars over the years, which has resulted in severe traffic congestion problems. The number of total registered cars in Bangkok ballooned 92.4% between 2000 and 2014, representing a CAGR of 5% during this period (Figure 11). In 2011-2014 alone, the total number of registered cars in Bangkok grew by 5-10% YoY;. This was driven by the first car tax incentive programme in 2012, which made the total number of cars in the capital jump 10% YoY in 2013. Presently, the total registered number of cars in Bangkok has hit 8.65m units, and this figure is continuously growing. The greater number of cars, coupled with the city’s ongoing urbanisation, has not been matched by a corresponding increase in road capacity. Consequently, Bangkok faces one of the most severe traffic congestion problems in the world. Strong ridership growth. With regards to the city’s traffic woes, BTS is the prime beneficiary, given that the issue gives rise to an increasing need for speedy, reliable and accessible modes of transportation. This, in turn, has led to a growing demand for rail transportation systems in Bangkok. The record-breaking years (2000-2014) saw ridership numbers of BTS’ Skytrain system increasing every year by 10% on average (Figure 12). It increased 5% YoY to 219m passengers in 2014 from 2013’s 209m, or an average of around 600,000 daily. We believe this momentum will continue to grow by about 3-4% this year and we wait for the other new mass transit lines, which should start operations in the next 2-3 years, to boost ridership growth sharply. Growing with an expanding mass transit system. BTS wants to expand its mass transit business by becoming the operator of both extension lines and new lines. There are currently about six such projects in the pipeline. Extension lines. BTS expects to continue its mass transit operations by becoming the operator of all the extension lines, consisting of the Dark Green Line (north and south) and Light Green Line, by 2018-2019. Figure 13: Green Lines’ extension line timeline Source: Company See important disclosures at the end of this report 8 BTS Group Holdings (BTS TB) 27 March 2015 Dark Green Line south from Bearing-Samut Prakan (12.8km). Currently, the Government has assigned the Mass Rapid Transit Authority of Thailand (MRTA) to discuss the transfer of the project to the BMA. BTS expects to get the O&M contract from BMA by 4Q15 and go fully operational in 2018. Currently, the progress of the civil works is about 48.78%, faster than the projected ~46%. Figure 14: Cumulative progress of the Dark Green Line south project Source: MRTA Dark Green Line north from Mo Chit-Saphan Mai-Khu Khot (18.4km). BTS expects that the civil works contract will be signed with project bidders by around mid-2015. The company expects to be awarded the O&M contract in the beginning of 2016. After that, the target for this line to go fully operational is the start of 2019. Light Green Line from Bang Wa-Borommaratchachonnani (7km). BTS expects the bidding for civil works and electrical & mechanical (E&M) projects to happen at the beginning of 2017 and for the line to be ready for operations in 2019. High opportunity to get contracts from extension lines. We strongly believe that BTS will get the contract to operate the extension lines of the Dark Green Line north, Dark Green Line south and Light Green Line. This is because they are the extension lines from the ones that BTS now operates. Currently, it is a good sign that the Ministry of Transport expects to negotiate with BTSC to become an operator for both the Dark Green Line and Light Green Line extension lines. This is because such a move would be to the benefit of the public, given that passengers would not need to change trains at the extension line if both lines are under a single operator. BTS expects to get the extension lines contracts, with the structure expected to be the same as the existing O&M contracts for the Light Green and Dark Green lines. Figure 15: Other extension lines’ timelines Source: Company See important disclosures at the end of this report 9 BTS Group Holdings (BTS TB) 27 March 2015 Light rail transit (LRT) line from Bang Na-Suvarnabhumi Airport (18.3km). The company expects the bidding to be in 2015 and for the line to be fully operational in 2018. Grey Line from Watcharaphol-Rama 9 Bridge (26km). The bidding for Phase 1 is expected to start in early 2016, with operations slated for 2019. Pink Line from Khae Rai-Min Buri (36km). This is targeted to be fully operational by around 2020-2021. Figure 16: Update on the six prospects Source: Company Media Business Media business via VGI. VGI provided services to three advertising media segments in FY14: i) Skytrain, ii) leading modern trade like Tesco Lotus and BIG C Supercenter (Big C) (BIGC TB, BUY, TP: THB256.00), and ii) Bangkok office buildings. It also acquired 24.89% in Master Ad (MACO TB, NR). Figure 17: Mass transit media’s customers coverage Figure 18: BTS Skytrain system’s route map Source: Company Source: Company See important disclosures at the end of this report 10 BTS Group Holdings (BTS TB) 27 March 2015 BTS-related media. VGI operates and manages the advertising and merchandising space on all areas of the Skytrain stations and platforms as well as the interior and exterior of all train carriages. The company has various advertising platforms to serve its varied customer demand. These include train body wraps, digital screens inside a train, posters and static media, platform truss LED screens, platform screen doors, and e-posters (Figure 17). We can safely say that VGI has got an advertising platform at almost every point of view around the Skytrain system. More advertising stations. At the end of 2014, the contact agreement regarding the right to advertise in seven more stations, ie Bang Chak-Bearing and Krung ThonburiWongwian Yai (Figure 18) was signed. VGI expects to start advertising operations at these stations from the beginning of FY16. It will also start recognising about THB50m-70m per year from these stations, starting from FY16, says BTS. Solid growth with 15% CAGR. Despite the economic slowdown and political problems in 2014, which resulted in total adex dropping 9.5% YoY, transit adex continued to grow 5% YoY. In our opinion, this is because it is a more effective choice for clients seeking to get recognition from audiences vis-à-vis TV or magazines. Figure 19: Mass transit media adex vs total adex Source: Nielsen Modern trade business. VGI was granted the exclusive rights to manage all advertising space in Big C and non-sales floors in Tesco Lotus, the top two market leaders in Thailand’s hypermarket industry. Currently, VGI is the advertising operator for both companies, whose store assets put together number more than 2,250 stores. These include 248 large, 255 medium and 1,782 small stores. New rights to manage advertising at FamilyMart branches. VGI just signed a contract to manage FamilyMart’s advertising spaces (static and audio media) at over 1,000 existing and upcoming branches. It expects the contract to begin generating revenue from FY16. We expect the FamilyMart deal to generate around THB80m per year in revenue. Figure 20: Modern trade media platforms Figure 21: In-store media adex vs total adex Source: Company Source: Nielsen See important disclosures at the end of this report 11 BTS Group Holdings (BTS TB) 27 March 2015 In-store adex remains weak. Most of VGI’s advertising customers in modern trade media are involved in consumer products. Hence, the company’s growth ought to be in line with GDP growth, purchasing power and consumer confidence. Therefore, with the economic slowdown pulling purchasing power and consumer confidence down, this directly affects in-store adex, which saw a 26.4% YoY drop in 2014 (Figure 21). Other media. At present, VGI owns the rights to operate advertising media in 103 office buildings in Bangkok on 926 screens. This network consists of digital screens that are installed inside office elevators or other waiting areas within such buildings. Aside from office building media, VGI also has the rights to be the sole selling agent for four mega outdoor LED screens located around Bangkok. Expansion into digital media networks. VGI announced that it had inked contracts with three new networks: i. It is the sole selling agent for four new mega LED screens – with a total space of 972 sq m – around Victory Monument with a 1-year contract length. The company has already started selling for this. ii. VGI has the exclusive rights to operate media spaces both inside and outside Empire tower – comprising two big LED screens – with a 5-year contract length. The company has already started selling this. iii. VGI has the exclusive rights to operate media spaces at Chamchuri Square with a total space of 270,000 sq m. The contract length is three years and it expects to start selling dates in May. Figure 22: New media business platforms Figure 23: Office building advertising platforms Source: Company Source: Company Aggressive expansion into other media. Last year, VGI expanded its advertising platforms through every type of media business. These included the new contracts with FamilyMart and Chamchuri Square, and the LED screens along the Victory Monument and Empire tower. We expect these new expansions to increase VGI’s revenue by about THB250m-300m per year from FY16. However, these contributions will not match the advertising contract with Tesco Lotus, which contributed THB500m per year. This contract has already expired. Nevertheless, we expect the GPMs of the new expansions to be higher at 40-50% vis-à-vis that for Tesco Lotus, which stood at 20%. This higher GPM is due to the fact that for this new media, VGI does not have to pay a high percentage for revenue sharing contracts. See important disclosures at the end of this report 12 BTS Group Holdings (BTS TB) 27 March 2015 Property Business Current property business structure. Currently, BTS operates only commercial property, consisting of hotel businesses and a golf course, as the company has already completed revenue booking for its latest residential project, the Abstracts Phahonyothin Park condominium. Hotel business. Currently, BTS’ hotel brands are U Hotels & Resorts and Eastin comprising U Chiang Mai Hotel, U Inchantree Kanchanaburi, Eastin Grand Hotel Sathorn Bangkok and U Sathorn Bangkok. Golf course and sports club. Through a subsidiary, the company operates a golf course and sports club business – Thana City Golf & Sports Club – which is located at Bangna-Trad Highway KM14. Exclusive JV with Sansiri to develop residential projects. On Oct 2014, BTS entered into a strategic alliance agreement with Sansiri to exclusively and jointly develop residential projects for sale. The 50:50 JV will focus on residential developments valued at over THB3bn and located within a 500m radius from mass rapid transit routes. We see the partnership as a win-win situation for both BTS and Sansiri. This is because BTS has a strong balance sheet and large landbank but less experience in the property business, which is bolstered by Sansiri’s solid brand and experience. First 50:50 JV condominium project will be launched during Apr-Jun 2015. This THB5.8bn project, which spans 8,000 sq m and has 873 units within 43 floors, will be located near the Mo Chit Skytrain station and is slated for completion in 2018. It has already obtained an environmental impact assessment (EIA) license. The selling prices are in the THB160,000-170,000 per sq m range, and is targeted at the midrange to high-end segment. The company expects to generate an internal rate of return (IRR) of about 17% and 12% NPAT margins. Figure 24: Sansiri project’s expected timeline Source: Company Figure 25: Land details and location Source: Company See important disclosures at the end of this report 13 BTS Group Holdings (BTS TB) 27 March 2015 A share swap deal with Natural Park. At the end of 2014, BTS announced that it was disposing of all shares in its two subsidiaries, which are engaged in the property business, to Natural Park – with the total value not exceeding THB9.41bn. These units are BTS Assets Co Ltd (BTSA) – which owns the Eastin Grand Hotel Sathorn and land plots located along Phaholyothin Road near the BTS Mo Chit Station – and Kamkoong Properties Co Ltd (Kamkoong), the owner of land plots located on Phayathai Road. This is next to the BTS Phayathai Station. BTS will receive up to 200.19m newly-issued ordinary shares of Natural Park – at an offer price of THB0.047 per share (not exceeding 35.66% of total shares) – and warrants to purchase shares at a ratio of two newly-issued shares to the company for one warrant at no cost. Note that each warrant entitles the holder to purchase one ordinary share at the exercise price of THB0.047 per share. Company overview of Natural Park. Natural Park engages in real estate development business including: i) Real estate development for rent, service and hotels. The company focuses on generating income from rent and service fees. Its main income in 2013 and 2014 was derived from: The Natural Park Apartment Centara Hotel & Convention Centre Khon Kaen, which officially began full operations in Dec 2013 Anantara Chiang Mai Resort & Spa, for which the investment was made in Sep 2014 In addition, during 2013 to 2014, Natural Park invested in 19.81% of Prospect Development Co Ltd, which engages in the business of renting warehouses and factory space. ii) Real estate development for sale. Natural Park has two projects for sale, both developed in 2013 and launched before the end of that year. The two projects that have been developed and are now for sale are: Figure 26: Land details and location Park Ramindra – an 8-storey and 206-unit horizontal condominium project Park Aran – comprising: o Park Aran Condo, an 8-storey, 512-unit horizontal condominium project o Park Aran Boulevard, a 3.5-storey, 62-unit commercial shop house development Figure 27: BTS assets’ book value and selling prices Subsidiaries Assets BTSA Eastin Grand Hotel Sathorn Book value (THBm) Selling price (THBm) 2,986 6,778 591 1,838-2,631 3,577 8,616-9,409 Land located on Phaholyothin Road Kamkoong Total Land plot located on Phayathai Road Source: Company data Source: Company After this transaction is completed, BTS will become a major shareholder of Natural Park. The company expects to benefit from this share swap deal, given that it will become a strategic investor in Natural Park, which will focus on generating recurring income from real estate assets including – but not limited to – hotels, serviced apartments and office buildings. BTS believes that this sector is likely to contribute stable long-term revenue and profit growth. Additionally, the company’s strategy in real estate expansion becomes clearer with the growth in its commercial property business being conducted via Natural Park. BTS can also leverage on the latter’s existing expertise in operating and developing commercial real estate. See important disclosures at the end of this report 14 BTS Group Holdings (BTS TB) 27 March 2015 Win-win for both Natural Park and BTS. We like this transaction as it will help BTS to unlock its land assets which it has held for a long time but could not generate recurring income. This transaction will let Natural Park – which has the ability and skills to develop the land plots – to manage the Mo Chit and Phayathai plots. Natural Park will develop these plots for mixed use as commercial property and manage recurring income from the real estate developments. We expect this transaction to be completed by 4QFY15 and operations to start within 2HFY16. Services Business Services business. BTS’ services business division provides strategic support for the rest of the group and is a potential source of future revenue growth. In addition to the development and operation of the Rabbit card ticketing system, this division is engaged in construction services, hotel management services and the running of BTS’ ChefMan restaurants. Figure 28: BTS’ 3QFY15 services revenue breakdown Figure 29: BTS’ quarterly services revenue breakdown Source: Company Data Source: Company Data Rabbit card. The company’s e-money services business (under Bangkok Smartcard System Company Ltd or BSS) has developed an e-money service system with a common ticketing system for Bangkok’s major mass transit network. It is used as a common ticket to travel on transit systems, like the BTS Skytrain and BRT Bus, and is also a means of payment at more than 40 retail partner stores. Currently, the number of Rabbit cards issued has increased significantly to more than 3m units, about a 47.62% rise when compared to the 2.1m units issued at end-2013. Figure 30: BTS’ rabbit cards Figure 31: Total number of card holders Source: Company Source: Company Data New type of Rabbit card. At the start of 2015, BTS signed a long-term business cooperation contract with AEON under the co-branded Rabbit programme and securitisation project. BTS and Aeon will jointly develop the co-branded Rabbit card. The first product to be launched under this programme is the AEON Rabbit member card. The cardholders can use this card to: i) obtain consumer loans from AEON, ii) travel on the BTS Skytrain system, and iii) purchase products or services at partner retail stores. Cardholders can also enjoy special promotions and privileges offered by the business partners at such stores. See important disclosures at the end of this report 15 BTS Group Holdings (BTS TB) 27 March 2015 Setting up the SPV. BTS (through BSS) and AEON will set up the SPV for the securitisation and issuance of this new Rabbit card. Under the securitisation project, the SPV will raise funds by issuing debentures of up to THB4,500m, whereby these debentures will be fully subscribed by the company. BSS and AEON, the SPV’s shareholders, will also provide the venture with subordinated loans in equal amounts of up to a total of THB500m. This SPV will benefit BTS in three ways: i) it will receive interest on the senior and subordinate loans, ii) it will get dividends from the SPV, and iii) it will get the loyalty fee on each card issued under this SPV (BTS expects to issue 700,000 cards this year). The company expects yields for this JV of 8% per year, guaranteed on return of principal in the case where bad debts exceed 15%, with AEON buying back the senior loans at par. Figure 32: AEON Rabbit member card Figure 33: Securitisation structure Source: Company Source: Company ChefMan. ChefMan is a premium Chinese restaurant chain managed by Man Kitchen Co Ltd, which offers distinctly original Cantonese cuisine. It has four branches: three dine-ins and one takeaway. The company aims to add 13 more branches by 2016. These new branches would consist of nine express restaurants, two buffets, and one each of fine dining and private dining. BTS estimates capex of THB270m, with approximately 25% IRR. Figure 34: ChefMan projects Source: Company See important disclosures at the end of this report 16 BTS Group Holdings (BTS TB) 27 March 2015 Results Review Figure 35: BTS’ 9MFY15 results review FYE Mar (THBm) 3QFY14 2QFY15 3QFY15 QoQ (%) YoY (%) 9MFY14 9MFY15 YoY (%) 2,008 1,756 1,684 (4) (16) 6,305 5,076 (19) EBITDA EBITDA Margin (%) 722 36 604 34 553 33 (9) (23) 2,041 32 1,723 34 (16) Depreciation 94 124 106 (14) 14 284 342 21 EBIT 628 480 446 (7) (29) 1,757 1,380 (21) EBIT Margin (%) 31 27 26 28 27 Interest expense Interest income Associates EI/Others (134) 361 158 16 (112) 286 223 65 (78) 248 200 549 (30) (10) - (41) 27 - (500) 1,027 460 13,943 (324) 868 592 766 (35) 29 (95) Pretax profit 1,030 943 1,366 45 33 16,687 3,283 (80) 51 54 81 265 65 (436) (42) (191) (20) (264) (19) 38 (39) (3,685) (22) (668) (20) (82) Minority Interest 157 118 120 2 (23) 809 350 (57) Net Profit Core Profit 437 437 633 616 981 587 55 (5) 124 34 12,193 1,091 2,265 1,786 (81) 64 Net Margin (%) 22 35 35 17 35 Revenue Pretax Margin (%) Tax Effective tax rate (%) Comments Gain of THB420m recognised from sale of Mo Chit land and MACO-W1 in 3QFY15 Source: Company data Figure 36: BTS’ quarterly revenue breakdown Figure 37: BTS’ quarterly results breakdown Source: Company data *includes share of revenue from BTSGIF Source: Company data Revenue softened in 3QFY15. BTS’ 3QFY15 revenue dropped 4% QoQ and 16% YoY to THB1.68bn. This was due to: i) the slowdown in its media business (despite the quarter being the high season) as the near expiration of its Tesco Lotus contract hurt sales, and ii) lower residential property transferred. Gross profit also fell 5.9% QoQ and 18.7% YoY to THB873m, which was reflected in the slight drop in GPM to 52% from 3QFY14’s and 2QFY15’s 53%. However, net profit still grew 55% QoQ and 124% YoY to THB981m because BTS recognised a gain of about THB420m from the sale of the Mo Chit land and MACO-W1 warrants. See important disclosures at the end of this report 17 BTS Group Holdings (BTS TB) 27 March 2015 Outlook FY15F total revenue expected to drop 18%. We expect BTS’ FY15 revenue to drop 18% YoY to THB6.66bn (from THB8.12bn) because of several reasons: i) lower residential units transferred this year (FY14 residential property revenue was THB2.06bn with 131 units transferred vs the THB420m with 21 units transferred in FY15), and ii) the slowdown in the advertising industry that impacted the media business, so much so that segment income likely dropped by about 2-3% this year. GPM should pick up to 51% (from 50% previously), as BTS has a lessened portion of property revenue, which has a lower GPM historically (about 30-35%). Other income should record about THB1.93bn from: i) interest income, ii) dividend income, and iii) assets divestment from the sale of the Mo Chit land and MACO-W1 warrants totalling about THB420m. However, if BTS can finish the transaction with Natural Park in May, the company may recognise the profit gain of about THB5bn this year in FY16. We expect BTS to record net profit and recurring net profit at THB2.81bn and THB2.33bn respectively. We expect recurring net profit to grow about 29% this year as it books the full-year share of profit from the BTSGIF fund and lower finance costs of about THB200m. This is because the company’s debt repayment was more than THB4bn after it received the cash from selling the BTSGIF. We forecast for FY16F’s revenue to grow 7%. Despite the transfer of revenue from Eastin Grand Hotel Sathorn to Natural Park, which contributes revenue of about THB500m per year, and the expiry of the sales floor advertising contracts with Tesco Lotus (about THB500m per year), FY16 ought to be a better year for BTS. We expect the company’s media business – which contributes about 40-45% to total revenue – to grow by about 10% next year. This is because VGI will recognise its new sources of revenue from: i) mass transit media – it will start operations of new media at 11 new BTS Skytrain stations, ii) modern trade media that has new advertising space with FamilyMart, and iii) the new mega LED screens with ad space at Victory Monument, Empire tower and Chamchuri Square. Total adex should start to pick up by about 7-9% this year. This is in line with Thailand’s GDP, which the Bank of Thailand (BOT) has forecasted to grow by about 3-4%. Moreover, BTS plans to have 13 more branches of ChefMan restaurants within the FY16. Furthermore, the JV with AEON ought to push services revenue sharply up next year, while the mass transit division should grow in line with the O&M contracts that are expected to grow about 4% every year. BTS’ property business may see a slowdown, given that it loses revenue contribution from the Eastin Grand Hotel Sathorn and the fact that there are no residential properties for sale next year. GPM expected to increase to 55%. With regards to the increased contribution from media and service business, we expect this ought to drive BTS’ GPM in FY16 to rise to 55% from 51% previously. Selling, general & administrative (SG&A) to sales should stand at 25%. While the company does not expect to incur any more marketing expenses for residential property, it still has to face the initial start-up costs of its new projects with Sansiri and Natural Park next year. Other income, eg interest income, etc, may also drop as BTS uses its cash to pay a high dividend to shareholders. In addition, share income from associates (mainly from its 33.33% stake in BTSGIF) should increase, as it has continuous growth in ridership, which will increase fare-box revenue. FY16 recurring net profit forecast to increase 7%. As a result, we expect BTS’ recurring net profit in FY16 grow to THB2.48bn (+7% YoY), reflecting EPS at THB0.21. Our forecasts still do not include the share of its 35% stake in Natural Park, as we are waiting for more clarity on future projects from the latter. Figure 38: BTS’ forecast core revenue, gross profit and recurring net profit Source: Company data, RHB See important disclosures at the end of this report 18 BTS Group Holdings (BTS TB) 27 March 2015 Financial Exhibits Profit & Loss (THBm) Mar-12 Mar-13 Mar-14 Mar-15F Total turnover 7,976 5,585 8,115 6,662 7,119 Cost of sales (4,020) (2,882) (4,089) (3,269) (3,195) Gross profit Gen & admin expenses Selling expenses Other operating costs Operating profit Operating EBITDA Depreciation of fixed assets Amortisation of intangible assets Operating EBIT 3,956 2,702 4,026 3,393 3,924 (1,212) (1,078) (1,497) (1,452) (1,568) (177) (223) (342) (180) (214) - - - 2,567 1,401 2,187 1,729 2,109 2,715 2,287 2,964 4,552 3,498 (1,763) (511) (482) (334) (17) 2,567 (2) Other recurring income Interest expense (31) (1,503) Net income from investments Interest income Mar-16F 40 (558) (33) (855) - - 1,401 2,187 1,729 2,109 840 924 3 619 1,895 30 59 1,213 (631) 1,116 (435) 982 (1,432) (1,248) Other non-recurring income 1,236 1,065 13,972 809 126 Pre-tax profit 2,408 3,175 17,391 4,060 3,714 Taxation (173) (1,248) (3,806) (812) Minority interests (130) (209) (940) (440) (427) (743) (490) Profit after tax & minorities 2,106 1,719 12,645 2,808 2,481 Reported net profit 2,106 1,719 12,645 2,808 2,481 Recurring net profit 1,035 1,693 1,810 2,325 2,481 Source: Company data, RHB Cash flow (THBm) Mar-12 Mar-13 Mar-14 Mar-15F Mar-16F Operating profit 2,567 1,401 2,187 1,729 2,109 Depreciation & amortisation 1,985 2,097 528 558 855 Change in working capital (1,321) 775 574 136 1,162 Other operating cash flow (2,245) 1,746 1,230 2,765 2,032 6,019 4,519 5,188 6,159 (1,213) - Operating cash flow 986 Interest received (40) Interest paid 983 Dividends received Tax paid Cash flow from operations 51 (1,064) 559 (0) (2) (6) (174) (345) (640) (435) (812) (427) (743) 1,755 4,659 3,218 3,942 (1,925) (1,270) (2,644) (2,360) (395) 5,367 14,824 Cash flow from investing activities (2,320) 4,098 12,180 (1,913) (1,083) Dividends paid (2,647) (3,159) (7,112) (7,748) (8,582) - 1,302 2,238 - - 3,022 (5,465) (5,322) 1,385 5,461 Capex Other investing cash flow Proceeds from issue of shares Increase in debt Other financing cash flow Cash flow from financing activities Cash at beginning of period Total cash generated Forex effects Implied cash at end of period (304) 71 1,825 (494) 733 447 4,989 (715) (368) (852) (406) (430) (6,589) (11,048) (6,769) (3,552) 1,333 3,513 7,863 3,123 2,168 4,350 (4,740) 1 12 1,333 3,513 (1) 7,862 355 - - 3,123 3,478 Source: Company data, RHB See important disclosures at the end of this report 19 BTS Group Holdings (BTS TB) 27 March 2015 Financial Exhibits Balance Sheet (THBm) Mar-12 Mar-13 Mar-14 Mar-15F Mar-16F Total cash and equivalents 1,333 4,507 32,165 23,628 17,831 Accounts receivable 1,107 946 1,074 980 1,047 Other current assets 5,428 46,766 3,987 3,967 4,032 Total current assets 7,868 52,218 37,227 28,575 22,910 Total investments 3,173 3,566 24,127 24,014 24,565 Tangible fixed assets 9,090 9,613 11,840 13,355 13,071 Intangible assets 45,340 210 2,562 2,515 2,476 Total other assets 1,419 1,683 1,001 791 782 Total non-current assets 59,021 15,073 39,530 40,676 40,894 Total assets 66,889 67,291 76,757 69,251 63,804 Short-term debt 5,021 5,163 3,618 1,711 1,659 Accounts payable 1,452 1,948 2,222 1,816 2,791 Other current liabilities 1,865 1,911 2,790 2,424 2,441 Total current liabilities 8,338 9,022 8,630 5,951 6,890 12,378 6,798 3,037 2,532 1,893 9,241 970 5,327 5,945 6,298 Total non-current liabilities 21,619 7,767 8,365 8,477 8,191 Total liabilities 29,957 16,789 16,995 14,428 15,081 Share capital 36,600 44,427 47,657 47,657 47,657 Retained earnings reserve (2,033) (1,715) 3,793 722 5,150 5,374 5,374 5,374 35,290 47,861 56,824 52,324 46,714 1,642 1,906 1,862 1,422 932 735 1,076 1,076 1,076 Total long-term debt Other liabilities Other reserves Shareholders' equity Minority interests (707) (6,317) Other equity - Total equity 36,932 50,502 59,762 54,823 48,722 Total liabilities & equity 66,889 67,291 76,757 69,251 63,804 Mar-12 Mar-13 Mar-14 Mar-15F Mar-16F 35.4 (30.0) 45.3 (17.9) 6.9 Operating profit growth (%) 137.6 (45.4) 56.1 (20.9) 21.9 Net profit growth (%) 734.8 (18.4) 635.8 (77.8) (11.6) EPS growth (%) 734.8 (24.4) 564.1 (78.5) (11.6) 1.5 17.1 11.6 (7.9) (10.7) Operating margin (%) 32.2 25.1 27.0 26.0 29.6 Net profit margin (%) 26.4 30.8 155.8 42.1 34.9 Return on average assets (%) 3.2 2.6 17.6 3.8 3.7 Return on average equity (%) 6.0 4.1 24.2 5.1 5.0 Net debt to equity (%) 66.9 14.8 (42.7) (35.4) (29.3) DPS 0.30 0.54 0.60 0.65 0.72 Recurrent cash flow per share 0.18 0.45 0.28 0.33 0.42 Source: Company data, RHB Key Ratios (THB) Revenue growth (%) Bv per share growth (%) Source: Company data, RHB See important disclosures at the end of this report 20 BTS Group Holdings (BTS TB) 27 March 2015 SWOT Analysis Solid track record Rising competition in its media business Competitive advantage against other players Regulatory risks relating to its concession business Participating in future mass transit expansion Expansion in the media business through VGI Less direct exposure to the mass transit business after the establishment of the BTS Rail Mass Transit Growth Infrastructure Fund (BTSGIF) P/E (x) vs EPS growth P/BV (x) vs ROAE 2.0 20% 30 300% 1.5 15% 20 133% 1.0 10% 10 -33% 0.5 5% 0 -200% 0.0 0% P/E (x) (lhs) EPS growth (rhs) Source: Company data, RHB P/B (x) (lhs) Jan-16 467% Jan-15 40 Jan-14 25% Jan-13 2.5 Jan-12 633% Jan-16 50 Jan-15 30% Jan-14 3.0 Jan-13 800% Jan-12 60 Return on average equity (rhs) Source: Company data, RHB Company Profile BTS Group Holdings (BTS) has four core businesses, namely: i) mass transit (BTS SkyTrain and Bus Rapid Transit), ii) media, iii) property, and iv) services. See important disclosures at the end of this report 21 BTS Group Holdings (BTS TB) 27 March 2015 Recommendation Chart Price Close 9.3 10.2 Recommendations & Target Price 7.5 10 na 11 9 8 7 6 5 4 Buy 3 Mar-10 Neutral Sell Jul-11 Trading Buy Oct-12 Take Profit Not Rated Jan-14 Source: RHB, Bloomberg Date Recommendation Target Price 2013-07-09 Trading Buy 10.2 Price 7.9 2013-05-30 Trading Buy 10.2 8.4 2013-05-28 Trading Buy 10.2 8.5 2013-04-29 Trading Buy 10.2 9.1 2013-02-14 Buy 9.3 8.2 2012-11-13 Buy 7.5 6.3 Source: RHB, Bloomberg See important disclosures at the end of this report 22 RHB Guide to Investment Ratings Buy: Share price may exceed 10% over the next 12 months Trading Buy: Share price may exceed 15% over the next 3 months, however longer-term outlook remains uncertain Neutral: Share price may fall within the range of +/- 10% over the next 12 months Take Profit: Target price has been attained. Look to accumulate at lower levels Sell: Share price may fall by more than 10% over the next 12 months Not Rated: Stock is not within regular research coverage Investment Research Disclaimers RHB has issued this report for information purposes only. This report is intended for circulation amongst RHB and its affiliates’ clients generally or such persons as may be deemed eligible by RHB to receive this report and does not have regard to the specific investment objectives, financial situation and the particular needs of any specific person who may receive this report. This report is not intended, and should not under any circumstances be construed as, an offer or a solicitation of an offer to buy or sell the securities referred to herein or any related financial instruments. This report may further consist of, whether in whole or in part, summaries, research, compilations, extracts or analysis that has been prepared by RHB’s strategic, joint venture and/or business partners. No representation or warranty (express or implied) is given as to the accuracy or completeness of such information and accordingly investors should make their own informed decisions before relying on the same. This report is not directed to, or intended for distribution to or use by, any person or entity who is a citizen or resident of or located in any locality, state, country or other jurisdiction where such distribution, publication, availability or use would be contrary to the applicable laws or regulations. By accepting this report, the recipient hereof (i) represents and warrants that it is lawfully able to receive this document under the laws and regulations of the jurisdiction in which it is located or other applicable laws and (ii) acknowledges and agrees to be bound by the limitations contained herein. Any failure to comply with these limitations may constitute a violation of applicable laws. All the information contained herein is based upon publicly available information and has been obtained from sources that RHB believes to be reliable and correct at the time of issue of this report. However, such sources have not been independently verified by RHB and/or its affiliates and this report does not purport to contain all information that a prospective investor may require. The opinions expressed herein are RHB’s present opinions only and are subject to change without prior notice. RHB is not under any obligation to update or keep current the information and opinions expressed herein or to provide the recipient with access to any additional information. Consequently, RHB does not guarantee, represent or warrant, expressly or impliedly, as to the adequacy, accuracy, reliability, fairness or completeness of the information and opinion contained in this report. Neither RHB (including its officers, directors, associates, connected parties, and/or employees) nor does any of its agents accept any liability for any direct, indirect or consequential losses, loss of profits and/or damages that may arise from the use or reliance of this research report and/or further communications given in relation to this report. Any such responsibility or liability is hereby expressly disclaimed. Whilst every effort is made to ensure that statement of facts made in this report are accurate, all estimates, projections, forecasts, expressions of opinion and other subjective judgments contained in this report are based on assumptions considered to be reasonable and must not be construed as a representation that the matters referred to therein will occur. Different assumptions by RHB or any other source may yield substantially different results and recommendations contained on one type of research product may differ from recommendations contained in other types of research. The performance of currencies may affect the value of, or income from, the securities or any other financial instruments referenced in this report. Holders of depositary receipts backed by the securities discussed in this report assume currency risk. Past performance is not a guide to future performance. Income from investments may fluctuate. The price or value of the investments to which this report relates, either directly or indirectly, may fall or rise against the interest of investors. This report does not purport to be comprehensive or to contain all the information that a prospective investor may need in order to make an investment decision. The recipient of this report is making its own independent assessment and decisions regarding any securities or financial instruments referenced herein. Any investment discussed or recommended in this report may be unsuitable for an investor depending on the investor’s specific investment objectives and financial position. The material in this report is general information intended for recipients who understand the risks of investing in financial instruments. This report does not take into account whether an investment or course of action and any associated risks are suitable for the recipient. Any recommendations contained in this report must therefore not be relied upon as investment advice based on the recipient's personal circumstances. Investors should make their own independent evaluation of the information contained herein, consider their own investment objective, financial situation and particular needs and seek their own financial, business, legal, tax and other advice regarding the appropriateness of investing in any securities or the investment strategies discussed or recommended in this report. This report may contain forward-looking statements which are often but not always identified by the use of words such as “believe”, “estimate”, “intend” and “expect” and statements that an event or result “may”, “will” or “might” occur or be achieved and other similar expressions. Such forward-looking statements are based on assumptions made and information currently available to RHB and are subject to known and unknown risks, uncertainties and other factors which may cause the actual results, performance or achievement to be materially different from any future results, performance or achievement, expressed or implied by such forward-looking statements. Caution should be taken with respect to such statements and recipients of this report should not place undue reliance on any such forward-looking statements. RHB expressly disclaims any obligation to update or revise any forwardlooking statements, whether as a result of new information, future events or circumstances after the date of this publication or to reflect the occurrence of unanticipated events. 23 The use of any website to access this report electronically is done at the recipient’s own risk, and it is the recipient’s sole responsibility to take precautions to ensure that it is free from viruses or other items of a destructive nature. This report may also provide the addresses of, or contain hyperlinks to, websites. RHB takes no responsibility for the content contained therein. Such addresses or hyperlinks (including addresses or hyperlinks to RHB own website material) are provided solely for the recipient’s convenience. The information and the content of the linked site do not in any way form part of this report. Accessing such website or following such link through the report or RHB website shall be at the recipient’s own risk. This report may contain information obtained from third parties. Third party content providers do not guarantee the accuracy, completeness, timeliness or availability of any information and are not responsible for any errors or omissions (negligent or otherwise), regardless of the cause, or for the results obtained from the use of such content. Third party content providers give no express or implied warranties, including, but not limited to, any warranties of merchantability or fitness for a particular purpose or use. Third party content providers shall not be liable for any direct, indirect, incidental, exemplary, compensatory, punitive, special or consequential damages, costs, expenses, legal fees, or losses (including lost income or profits and opportunity costs) in connection with any use of their content. The research analysts responsible for the production of this report hereby certifies that the views expressed herein accurately and exclusively reflect his or her personal views and opinions about any and all of the issuers or securities analysed in this report and were prepared independently and autonomously. The research analysts that authored this report are precluded by RHB in all circumstances from trading in the securities or other financial instruments referenced in the report, or from having an interest in the company(ies) that they cover. RHB and/or its affiliates and/or their directors, officers, associates, connected parties and/or employees, may have, or have had, interests in the securities or qualified holdings, in subject company(ies) mentioned in this report or any securities related thereto and may from time to time add to or dispose of, or may be materially interested in, any such securities. Further, RHB and/or its affiliates may have, or have had, business relationships with the subject company(ies) mentioned in this report and may from time to time seek to provide investment banking or other services to the subject company(ies) referred to in this research report. As a result, investors should be aware that a conflict of interest may exist. The contents of this report is strictly confidential and may not be copied, reproduced, published, distributed, transmitted or passed, in whole or in part, to any other person without the prior express written consent of RHB and/or its affiliates. This report has been delivered to RHB and its affiliates’ clients for information purposes only and upon the express understanding that such parties will use it only for the purposes set forth above. By electing to view or accepting a copy of this report, the recipients have agreed that they will not print, copy, videotape, record, hyperlink, download, or otherwise attempt to reproduce or re-transmit (in any form including hard copy or electronic distribution format) the contents of this report. RHB and/or its affiliates accepts no liability whatsoever for the actions of third parties in this respect. The contents of this report are subject to copyright. Please refer to Restrictions on Distribution below for information regarding the distributors of this report. Recipients must not reproduce or disseminate any content or findings of this report without the express permission of RHB and the distributors. The securities mentioned in this publication may not be eligible for sale in some states or countries or certain categories of investors. The recipient of this report should have regard to the laws of the recipient’s place of domicile when contemplating transactions in the securities or other financial instruments referred to herein. The securities discussed in this report may not have been registered in such jurisdiction. Without prejudice to the foregoing, the recipient is to note that additional disclaimers, warnings or qualifications may apply based on geographical location of the person or entity receiving this report. RESTRICTIONS ON DISTRIBUTION Malaysia This report is issued and distributed in Malaysia by RHB Research Institute Sdn Bhd. The views and opinions in this report are our own as of the date hereof and is subject to change. If the Financial Services and Markets Act of the United Kingdom or the rules of the Financial Conduct Authority apply to a recipient, our obligations owed to such recipient therein are unaffected. RHB Research Institute Sdn Bhd has no obligation to update its opinion or the information in this report. Thailand This report is issued and distributed in the Kingdom of Thailand by RHB OSK Securities (Thailand) PCL, a licensed securities company that is authorised by the Ministry of Finance, regulated by the Securities and Exchange Commission of Thailand and is a member of the Stock Exchange of Thailand. The Thai Institute of Directors Association has disclosed the Corporate Governance Report of Thai Listed Companies made pursuant to the policy of the Securities and Exchange Commission of Thailand. RHB OSK Securities (Thailand) PCL does not endorse, confirm nor certify the result of the Corporate Governance Report of Thai Listed Companies. Indonesia This report is issued and distributed in Indonesia by PT RHB OSK Securities Indonesia. This research does not constitute an offering document and it should not be construed as an offer of securities in Indonesia. Any securities offered or sold, directly or indirectly, in Indonesia or to any Indonesian citizen or corporation (wherever located) or to any Indonesian resident in a manner which constitutes a public offering under Indonesian laws and regulations must comply with the prevailing Indonesian laws and regulations. 24 Singapore This report is issued and distributed in Singapore by RHB Research Institute Singapore Pte Ltd and it may only be distributed in Singapore to accredited investors, expert investors and institutional investors as defined in the Financial Advisers Regulations and the Securities and Futures Act (Chapter 289), as amended from time to time. By virtue of distribution to these categories of investors, RHB Research Institute Singapore Pte Ltd and its representatives are not required to comply with Section 36 of the Financial Advisers Act (Chapter 110) (Section 36 relates to disclosure of RHB Research Institute Singapore Pte Ltd ’s interest and/or its representative's interest in securities). Recipients of this report in Singapore may contact RHB Research Institute Singapore Pte Ltd in respect of any matter arising from or in connection with the report. Hong Kong This report is issued and distributed in Hong Kong by RHB OSK Securities Hong Kong Limited (興業僑豐證券有限公司) (CE No.: ADU220) (“RHBSHK”) which is licensed in Hong Kong by the Securities and Futures Commission for Type 1 (dealing in securities) and Type 4 (advising on securities) regulated activities. Any investors wishing to purchase or otherwise deal in the securities covered in this report should contact RHB OSK Securities Hong Kong Limited. United States This report was prepared by RHB and is being distributed solely and directly to “major” U.S. institutional investors as defined under, and pursuant to, the requirements of Rule 15a-6 under the U.S. Securities and Exchange Act of 1934, as amended (the “Exchange Act”). RHB is not registered as a brokerdealer in the United States and does not offer brokerage services to U.S. persons. Any order for the purchase or sale of the securities discussed herein that are listed on Bursa Malaysia Securities Berhad must be placed with and through Auerbach Grayson (“AG”). Any order for the purchase or sale of all other securities discussed herein must be placed with and through such other registered U.S. broker-dealer as appointed by RHB from time to time as required by the Exchange Act Rule 15a-6. This report is confidential and not intended for distribution to, or use by, persons other than the recipient and its employees, agents and advisors, as applicable. Additionally, where research is distributed via Electronic Service Provider, the analysts whose names appear in this report are not registered or qualified as research analysts in the United States and are not associated persons of Auerbach Grayson AG or such other registered U.S. broker-dealer as appointed by RHB from time to time and therefore may not be subject to any applicable restrictions under Financial Industry Regulatory Authority (“FINRA”) rules on communications with a subject company, public appearances and personal trading. Investing in any non-U.S. securities or related financial instruments discussed in this research report may present certain risks. The securities of non-U.S. issuers may not be registered with, or be subject to the regulations of, the U.S. Securities and Exchange Commission. Information on non-U.S. securities or related financial instruments may be limited. Foreign companies may not be subject to audit and reporting standards and regulatory requirements comparable to those in the United States. The financial instruments discussed in this report may not be suitable for all investors. Transactions in foreign markets may be subject to regulations that differ from or offer less protection than those in the United States. OWNERSHIP AND MATERIAL CONFLICTS OF INTEREST Malaysia RHB does not have qualified shareholding (1% or more) in the subject company (ies) covered in this report except for: a) RHB and/or its subsidiaries are not liquidity providers or market makers for the subject company (ies) covered in this report except for: a) RHB and/or its subsidiaries have not participated as a syndicate member in share offerings and/or bond issues in securities covered in this report in the last 12 months except for: a) RHB has not provided investment banking services to the company/companies covered in this report in the last 12 months except for: a) Thailand RHB OSK Securities (Thailand) PCL and/or its directors, officers, associates, connected parties and/or employees, may have, or have had, interests and/or commitments in the securities in subject company(ies) mentioned in this report or any securities related thereto. Further, RHB OSK Securities (Thailand) PCL may have, or have had, business relationships with the subject company(ies) mentioned in this report. As a result, investors should exercise their own judgment carefully before making any investment decisions. 25 Indonesia PT RHB OSK Securities Indonesia is not affiliated with the subject company(ies) covered in this report both directly or indirectly as per the definitions of affiliation above. Pursuant to the Capital Market Law (Law Number 8 Year 1995) and the supporting regulations thereof, what constitutes as affiliated parties are as follows: 1. Familial relationship due to marriage or blood up to the second degree, both horizontally or vertically; 2. Affiliation between parties to the employees, Directors or Commissioners of the parties concerned; 3. Affiliation between 2 companies whereby one or more member of the Board of Directors or the Commissioners are the same; 4. Affiliation between the Company and the parties, both directly or indirectly, controlling or being controlled by the Company; 5. Affiliation between 2 companies which are controlled, directly or indirectly, by the same party; or 6. Affiliation between the Company and the main Shareholders. PT RHB OSK Securities Indonesia is not an insider as defined in the Capital Market Law and the information contained in this report is not considered as insider information prohibited by law. Insider means: a. a commissioner, director or employee of an Issuer or Public Company; b. a substantial shareholder of an Issuer or Public Company; c. an individual, who because of his position or profession, or because of a business relationship with an Issuer or Public Company, has access to inside information; and d. an individual who within the last six months was a Person defined in letters a, b or c, above. Singapore RHB Research Institute Singapore Pte Ltd and/or its subsidiaries and/or associated companies do not make a market in any securities covered in this report, except for: (a) The staff of RHB Research Institute Singapore Pte Ltd and its subsidiaries and/or its associated companies do not serve on any board or trustee positions of any issuer whose securities are covered in this report, except for: (a) RHB Research Institute Singapore Pte Ltd and/or its subsidiaries and/or its associated companies do not have and have not within the last 12 months had any corporate finance advisory relationship with the issuer of the securities covered in this report or any other relationship (including a shareholding of 1% or more in the securities covered in this report) that may create a potential conflict of interest, except for: (a) Hong Kong RHBSHK or any of its group companies may have financial interests in in relation to an issuer or a new listing applicant (as the case may be) the securities in respect of which are reviewed in the report, and such interests aggregate to an amount equal to or more than (a) 1% of the subject company’s market capitalization (in the case of an issuer as defined under paragraph 16 of the Code of Conduct for Persons Licensed by or Registered with the Securities and Futures Commission (the “Code of Conduct”); and/or (b) an amount equal to or more than 1% of the subject company’s issued share capital, or issued units, as applicable (in the case of a new listing applicant as defined in the Code of Conduct). Further, the analysts named in this report or their associates may have financial interests in relation to an issuer or a new listing applicant (as the case may be) in the securities which are reviewed in the report. RHBSHK or any of its group companies may make a market in the securities covered by this report. RHBSHK or any of its group companies may have analysts or their associates, individual(s) employed by or associated with RHBSHK or any of its group companies serving as an officer of the company or any of the companies covered by this report. RHBSHK or any of its group companies may have received compensation or a mandate for investment banking services to the company or any of the companies covered by this report within the past 12 months. Note: The reference to “group companies” above refers to a group company of RHBSHK that carries on a business in Hong Kong in (a) investment banking; (b) proprietary trading or market making; or (c) agency broking, in relation to securities listed or traded on The Stock Exchange of Hong Kong Limited. 26 DMG & Partners Research Guide to Investment Ratings Kuala Lumpur Hong Kong Singapore Tel : +(60) 3 9280 2185 Fax : +(60) 3 9284 8693 Tel : +(852) 2525 1118 Fax : +(852) 2810 0908 Singapore 049315 Tel : +(65) 6533 1818 Fax : +(65) 6532 6211 Shanghai Phnom Penh Buy: Share price may exceed 10% over the next 12 months Trading Buy: Share price may exceed 15% over the next 3 RHB months, however longer-term outlook remains uncertain RHB Research Institute Sdn Bhd OSK Securities Hong Kong Ltd. RHB Research Institute Singapore th Neutral: Share mayOne, fall within the range of +/- 10% over the next 1212months Pte Ltd (formerly known as DMG & Partners Research Level price 11, Tower RHB Centre Floor Take Profit: Target price has been attained. Look to accumulate at lower levels Pte Ltd) Jalan Tun Razak World-Wide House Sell: Share price may fallLumpur by more than 10% over the next 12 months19 Des Voeux Road Kuala 10 Collyer Quay Malaysia Central, Hong Kong #09-08 Ocean Financial Centre Not Rated: Stock is not within regular research coverage DISCLAIMERS Jakarta This research is issued by DMG & Partners Research Pte Ltd and it is for general distribution only. It does not have any regard to the specific investment objectives,PTfinancial situation andIndonesia particular needs of any specific recipient of this research report. You should independently evaluate particular RHB OSK Securities RHB OSK (China) Investment Advisory Co. Ltd. RHB OSK Indochina Securities Limited Wisma Mulia, Floor Suite 4005, Square or entering into any transactionNo. 1-3, Street investments and consult an20th independent financial adviser before making anyCITIC investments in relation to271 any securities or Jl. Jend. Gatot Subroto No. 1168 Nanjing West Road Sangkat Toeuk Thla, Khan Sen Sok investment instruments mentioned in42 this report. Jakarta 12710, Indonesia Tel : +(6221) 2783 0888 Shanghai 20041 China Phnom Penh Cambodia The informationFax contained herein has been obtained from sources Tel we believed to be reliable but we do not make any representation or warranty nor : +(6221) 2783 0777 : +(8621) 6288 9611 Tel: +(855) 23 969 161 accept any responsibility or liability as to its accuracy, completeness or: correctness. Opinions and views expressed in this subject Fax +(8621) 6288 9633 Fax:report +(855)are 23 969 171 to change without notice. Bangkok This report does not constitute or form part of any offer or solicitation of any offer to buy or sell any securities. RHBof OSK Securities (Thailand) PCL Pte Ltd, a joint venture between OSK Investment Bank DMG & Partners Research Pte Ltd is a wholly-owned subsidiary DMG & Partners Securities 10th Floor, Sathorn Square Office Tower Berhad, Malaysia which have since merged into RHB Investment98,Bank Berhad (the merged entity is referred to as “RHBIB” which in turn is a whollyNorth Sathorn Road, Silom owned subsidiary of RHB Capital Berhad) and Deutsche Asia Pacific Holdings Pte Ltd (a subsidiary of Deutsche Bank Group). DMG & Partners Securities Bangrak, Bangkok 10500 Pte Ltd is a Member of the Singapore Exchange Securities Trading Limited. Thailand Tel: +(66) 2 862 9999 Fax : +(66) 2 862 9799 DMG & Partners Securities Pte Ltd and their associates, directors, and/or employees may have positions in, and may effect transactions in the securities covered in the report, and may also perform or seek to perform broking and other corporate finance related services for the corporations whose securities are covered in the report. This report is therefore classified as a non-independent report. As of Error! Bookmark not defined., DMG & Partners Securities Pte Ltd and its subsidiaries, including DMG & Partners Research Pte Ltd, do not have proprietary positions in the subject companies, except for: a) Error! Bookmark not defined. As of Error! Bookmark not defined., none of the analysts who covered the stock in this report has an interest in the subject companies covered in this report, except for: a) Error! Bookmark not defined. DMG & Partners Research Pte. Ltd. (Reg. No. 200808705N) 27 Thai Institute of Directors Association (IOD) – Corporate Governance Report Rating 2014 Excellent BAFS BCP BTS CPN EGCO GRAMMY HANA INTUCH IRPC IVL KBANK KKP KTB MINT PSL PTT PTTEP PTTGC SAMART SAMTEL SAT SC SCB SE-ED SIM SPALI TISCO TMB TOP Very Good AAV ACAP ADVANC ANAN AOT ASIMAR ASK ASP BANPU BAY BBL BECL BIGC BKI BLA BMCL BROOK CENTEL CFRESH CIMBT CK CNT CPF CSL DELTA DRT DTAC DTC EASTW EE ERW GBX GC GFPT GUNKUL HEMRAJ HMPRO ICC KCE KSL LANNA LH LHBANK LOXLEY LPN MACO MC MCOT NBC NCH NINE NKI NMG NSI OCC OFM PAP PE PG PHOL PJW PM PPS PR PRANDA PS PT QH RATCH ROBINS RS S&J SAMCO SCC SINGER SIS SITHAI SNC SNP SPI SSF SSI SSSC STA SVI TCAP TF THAI THANI THCOM TIP TIPCO TK TKT TNITY TNL TOG TRC TRUE TSTE TSTH TTA TTW TVO UAC VGI VNT WACOAL Good 2S AF AH AHC AIT AJ AKP AKR AMANAH AMARIN AMATA AP APCO APCS AQUA ARIP AS ASIA AYUD BEAUTY BEC BFIT BH BJC BJCHI BOL BTNC BWG CCET CGD CGS CHOW CI CKP CM CMR CSC CSP CSS DCC DEMCO DNA EA ESSO FE FORTH FPI GENCO GL GLOBAL GLOW GOLD HOTPOT HTC HTECH HYDRO IFS IHL INET IRC IRCP ITD KBS KGI KKC KTC L&E LRH LST MAJOR MAKRO MATCH MBK MBKET MEGA MFC MFEC MJD MODERN MONO MOONG MPG MTI NC NTV NUSA NWR NYT OGC OISHI PACE PATO PB PDI PICO PPM PPP PREB PRG PRIN PTG QLT QTC RCL SABINA SALEE SCBLIF SCCC SCG SEAFCO SEAOIL SFP SIAM SIRI SKR SMG SMK SMPC SMT SOLAR SPC SPCG SPPT SST STANLY STEC STPI SUC SWC SYMC SYNEX SYNTEC TASCO TBSP TEAM TFD TFI THANA THIP THREL TIC TICON TIW TKS TLUXE TMI TMT TNDT TPC TPCORP TRT TRU TSC TTCL TUF TVD TWFP UMI UP UPF UPOIC UT UV UWC VIH WAVE WHA WIN WINNER YUASA ZMICO IOD (IOD Disclaimer) การเปิดเผลผลการสารวจของสมาคมส่งเสริมสถาบันกรรมการบริษัทไทย (IOD) ในเรื่องการกากับดูแลกิจการ (Corporate Governance) นี้เป็นการ ดาเนินการตามนโยบายของสานักงานคณะกรรมการกากับหลักทรัพย์และตลาดหลักทรัพย์ โดยการสารวจของ IOD เป็นการสารวจและประเมินจากข้อมูลของบรษัทจด ทะเบียนในตลาดหลักทรัพย์แห่งประเทศไทยและตลาดหลักทรัพย์เอ็มเอไอ ที่มีการเปิดเผยต่อสาธารณะและเป็นข้อมูลที่ผลู้ งทุนทั่วไปสามารถเข้าถึงได้ ดังนั้นผลสารวจ ดังกล่าวจึงเป็นการนาเสนอในมุมมองของบุคคลภายนอกโดยไม่ได้เป็นการประเมินการปฏิบัติและมิได้มีการใช้ข้อมูลภายในในการประเมิน อนึ่ง ผลการสารวจดังกล่าว เป็นผลการสารวจ ณ วันที่ปรากฎในรายงานการกากับดูและกิจการบริษัทจดทะเบียนไทยเท่านั้น ดังนั้นผลการสารวจจึงอาจ เปลี่ยนแปลงได้ภายหลังวันดังกล่าว ทัง้ นี้บริษัทหลักทรัพย์ อาร์เอสบี โอเอส เค จากัด (มหาชน) มิได้ยืนยันหรือรับรองถึงความถูกต้องของผลการสารวจดังกล่าวแต่อย่างใด


© Copyright 2026