
PAF Annual Report 2014 - Poverty Alleviation Fund, Nepal
PAF
Annual Report
2014
Poverty Alleviation Fund
Nepal
Annual Report 2014
Poverty Alleviation Fund (PAF)
Kathmandu
Nepal
FOREWORD
Community organizations (COs) are at the heart of the Poverty Alleviation Fund’s (PAF) functioning. PAF has helped
to form over 25 thousand COs in its 40 programme districts. Over 650 thousand poor households are direct
beneficiaries, of which 76 per cent are women and 65 per cent are ultra-poor—with food sufficiency for less than
3 months a year.
Eleven years on the ground, PAF is now a households name as one out of ten Nepali is directly benefiting from its
programmes. Reaching out to the most vulnerable groups, especially those who are disadvantaged due to gender,
caste, ethnicity or physical isolation, PAF has demonstrated that even a modest amount of resources given to the
community can help poor families get on a sustainable path out of poverty.
PAF is currently working in 40 programme districts and 19 Innovative Window Programme Districts. A multi-year
innovative programme is under implementation in three districts, namely Chitwan, Makwanpur and Kanchanpur,
focusing on the uplift of women, indigenous communities and former bonded labourers, among others. Over 75
per cent of the total budget of PAF reaches directly to the COs of the poor.
Recently, PAF selected 59 partner organizations (POs) for the new set of 15 districts, and the programme shall be
launched in these additional districts by the end of the current fiscal year. The remaining 20 districts will be covered
through the poverty pocket approach later.
Currently, a total of 360 POs are working with PAF to facilitate COs to carry out social mobilization, provide technical
support for need identification, prioritization, preparation and implementation of community sub-projects, among
others.
Some important initiatives that were introduced during the reporting year include an amendment in the
Cooperative Bylaws, allowing PAF COs to form cooperatives. This would pave the way for aspiring COs to form
cooperatives. The new provision, approved by the Department of Cooperatives, allows only PAF CO members to
establish and run cooperatives to serve their financial needs. As part of our emphasis to work with the media—
at both national and local level, we awarded the PAF National Journalism Award 2071 to three journalists who
reported widely on poverty issues.
On the basis of own ground-level experience, feedback and research, we are adjusting our approach in relation to
maximum coverage of hard core poor and pocket-based development approach, among others, to make the COs
self-sustaining in the long run. PAF is working with its exit strategy, focusing on its strategic thrust to enable the
community to go on a sustained path to get out of poverty within a stipulated five-six years of time.
Because PAF targets a specific set of population, these organizations tend to have weak institutional capacity in the
beginning. Regular oversight and technical support from NGOs, coupled with easy access to the revolving fund,
ensure that these COs become self-sustaining over time. Many have now come together to form cooperatives and
federations, and are working beyond just improving the livelihoods of a limited number of people by contributing
to agriculture commercialization and institutional strengthening, for example. PAF is currently developing a CO
“graduation” strategy. Given the government’s recognition of cooperatives as the “third pillar” of the economy, PAF
is in the right direction to ensure sustainability of its interventions.
PAF has forged a strong partnership with the government, at both central and local levels, and non-government
organizations (NGOs) at the grass roots level. Local NGOs are central to the operation of PAF as they link it with
the COs and facilitate day-to-day activities. PAF has been working closely with the line agencies of the Ministry of
Local Development and the Ministry of Agriculture and Cooperatives in the planning and implementation of subprojects, as well as in securing additional resources. PAF lays special emphasis on the capacity building of COs, POs and PAF, while coordination and collaboration is
accorded high priority. PAF is also strengthening the systematic grievance handling process with stakeholders’
views on Performance Management System of COs, POs and the PAF Secretariat.
As always, the annual budget of PAF is limited to meeting the demands and expectations of the stakeholders—be
it the community, POs and PAF secretariat. In some cases, PAF has not been able to allocate budget for many COs
that are already registered with it. Expansion of the PAF programme to additional districts also demands additional
funding. Therefore, provision of adequate funding is considered necessary to make PAF capable of working
effectively to help poor people in programme districts.
Whatever PAF has achieved is the result of the government’s support to it, and it is expected that the government
will provide required support so as to continue the work at the grass roots level.
I look forward to receiving support of all in our crusade against poverty.
Yuba Raj Pandey
Vice Chairperson
January 2015
IV
Annual Report 2014
Acknowledgments
The overriding objective of the development efforts in Nepal is poverty alleviation. Through the Tenth Plan (Poverty
Reduction Strategy Paper 2002–2007), Government of Nepal has shown its strong commitment to achieve this. The
PRSP’s sole objective was to bring sustainable reduction in poverty through reduction in income poverty level and
improving human development indicators. Even after the completion of the Tenth Plan, all the interim periodic
plans have laid their special emphasis on poverty alleviation, inclusive growth and development.
Poverty Alleviation Fund (PAF) was established in 2004 to address the exclusive needs of the poor and marginalized
by putting them in the driving seat of development efforts. PAF is contributing to bringing the level of poverty
down as per the long-term goals of GoN and the Millennium Development Goals.
Poverty is a multi-dimensional phenomenon. We need to understand its complexity and intricacies before chalking
out strategies and work plan to deal with it. Equally important is the fact that no individual organization or programme
would be able carry out its efforts in relation to poverty alleviation alone. Keeping this fact in mind, PAF, from the very
beginning, has adopted a strategy to work together with all development actors—be it an individual or agencies.
PAF would like to express its acknowledgment and gratitude to all the supporters and well-wishers for their
support and guidance. Without them, PAF would not have been able to realize its objectives and goals. It gives us
immense pleasure to inform that PAF has covered over 650 thousand poor households, who are organized in over
25 thousand COs in 40 programme districts.
I would like express my sincere gratitude to all board members, officials from the Office of the Prime Minister and Council
of Ministers, Ministry of Finance, Ministry of Federal Affairs and Local Development, Ministry of Poverty Alleviation and
Cooperatives, National Planning Commission, District Development Committees, Village Development Committees
and different development partners for their incessant guidance, understanding and collaboration with PAF.
The World Bank and the International Fund for Agriculture Development, who have not only provided financial grants
but also their global experience and expertise in relation to targeting the ultra poor, have been key partners of PAF.
Most importantly, I would like to acknowledge and commend the support of our COs, POs, CO networks, CO
federations, national and local media and civil society representatives, among others. We will continue to work
together with these institutions and individuals in the days to come as well.
Last but not the least, I would like to thank PAF Vice-chair and all the members of staff for their support in making
the publication of this annual report a success.
Chabi Raj Pokhrel
Acting Executive Director
February 2015
Annual Report 2014
V
VI
Annual Report 2014
Table of Contents
Foreword..........................................................................................................................................................................................................................................iii
Acknowledgments.....................................................................................................................................................................................................................v
List of Abbreviations and Acronyms...............................................................................................................................................................................xi
Executive Summary................................................................................................................................................................................................................xiii
CHAPTER 1: PAF BRIEF INTRODUCTION..........................................................................................................1
1.1 Introduction............................................................................................................................................................................................................. 1
1.2 The Strategy.............................................................................................................................................................................................................. 1
1.3 The Approach.......................................................................................................................................................................................................... 2
1.4 Institutional Arrangements............................................................................................................................................................................. 2
CHAPTER 2: PAF PROGRESS AND ACHIEVEMENTS....................................................................................... 3
2.1 Annual Achievements against Targets................................................................................................................................................... 3
2.2 Component-wise Progress Status............................................................................................................................................................. 3
2.2.1 Social Mobilization.......................................................................................................................................................................................... 3
2.2.2 Income Generation and Micro-enterprise....................................................................................................................................... 8
2.2.3 Community Infrastructure.......................................................................................................................................................................11
2.2.4 Capacity Development of COs..............................................................................................................................................................19
2.2.5. Capacity Development of POs..............................................................................................................................................................20
2.2.6. Capacity Development of PAF Secretariat.............................................................................................................................................................21
CHAPTER 3: INFORMATION, MONITORING AND GRIEVANCE HANDLING................................................. 23
3.1 Monitoring and Evaluation.........................................................................................................................................................................24
3.2 Results of Monitoring Data Analysis......................................................................................................................................................24
3.2.1 Social Re-assessment/Beneficiaries’ Assessment......................................................................................................................24
Annual Report 2014
VII
3.2.2 Status of Revolving Fund...........................................................................................................................................................................24
3.3 CO Maturity Assessments.............................................................................................................................................................................25
3.4 Communications, Outreach and Publications.................................................................................................................................25
3.5 Grievance Handling in PAF...........................................................................................................................................................................25
CHAPTER 4: PARTNERSHIP AND COLLABORATION..................................................................................... 22
4.1 Partnership with MoFALD............................................................................................................................................................................27
4.2 Partnership with MoAD.................................................................................................................................................................................27
4.3 Partnership with WFP......................................................................................................................................................................................27
4.4 Partnership with Heifer and LFLP............................................................................................................................................................28
4.5 Partnership with Helvetas............................................................................................................................................................................28
4.6 Partnership with AEPC...................................................................................................................................................................................28
CHAPTER 5: OUTCOMES AND RESULTS........................................................................................................ 29
5.1 Monitoring and Impact Evaluation Results......................................................................................................................................29
5.2 Performance Audit Report (2012)...........................................................................................................................................................31
CHAPTER 6: FINANCIAL MANAGEMENT...................................................................................................... 33
6.1 Financial Planning and Management...................................................................................................................................................33
6.2 Budget Expenditure.........................................................................................................................................................................................34
6.3 Financial progress Status..............................................................................................................................................................................34
6.4 Disbursement to COs......................................................................................................................................................................................35
6.5 Disbursement to Partner Organizations...............................................................................................................................................35
6.6 Additional Funding--Current Status and Future.............................................................................................................................35
CHAPTER 7: LESSONS AND FUTURE DIRECTIONS....................................................................................... 37
7.1 Lessons.....................................................................................................................................................................................................................37
7.2 Challenges..............................................................................................................................................................................................................37
7.3 The Future Strategy...........................................................................................................................................................................................38
FINANCIAL STATEMENTS............................................................................................................................... 39
VIII
Annual Report 2014
List of Tables
Table 1: Annual Achievements against Targets for FY2013/14...................................................................................................................3
Table 2: CO Registration, CO Agreement and Sub-project Agreements..............................................................................................4
Table 3: PAF Investment in Community Sub-projects......................................................................................................................................4
Table 4: Status of POs............................................................................................................................................................................................................5
Table 5: CO Member Beneficiaries................................................................................................................................................................................6
Table 6: Sector-wise Income Generation Activities by Households and PAF Investment..........................................................9
Table 7: PAF Investment in Agriculture Sector by Category......................................................................................................................10
Table 8: Distribution of Infrastructure by Type...................................................................................................................................................12
Table 9: Infrastructure Activities and Benefited Households.....................................................................................................................13
Table 10: PAF Investment in Different Infrastructure Schemes (in million)......................................................................................13
Table 11: Community Contribution in Infrastructure Schemes...............................................................................................................14
Table 12: Contribution from Local Bodies in Different Schemes............................................................................................................14
Table 13: Investment from Different Sources......................................................................................................................................................15
Table 14: Ratio of Investments by Different Agencies in PAF Community Infrastructure (Cumulative).........................15
Table 15: Ratio of Investments by Different Agencies in PAF Community Infrastructure (Reporting Year).................16
Table 16: Per Capita Cost Total Investment and PAF.......................................................................................................................................16
Table 17: Per Household Community Contribution.......................................................................................................................................17
Table 18: Investments by Different Agencies in Rural Access...................................................................................................................17
Table 19: Salient Features and Per Unit Cost.......................................................................................................................................................17
Table 20: Investments by Different Agencies in Buildings..........................................................................................................................18
Table 21: Salient Features and Per Unit Cost.......................................................................................................................................................18
Table 22: Investments by Different Agencies in Rural Energy..................................................................................................................18
Table 23: Salient Features of Investments by Different Agencies in Rural Energy.......................................................................18
Table 24: Investments by Different Agencies in Small Irrigation............................................................................................................18
Table 25: Investments by Different Agencies in Water Supply and Sanitation..............................................................................19
Table 26: Infrastructure (under construction).....................................................................................................................................................19
Table 27: Types of Infrastructure.................................................................................................................................................................................20
Table 28: Communities Contribution for Projects Under Construction.............................................................................................20
Table 29: List of Projects Implemented in Partnership with WFP...........................................................................................................27
Table 30: List of Projects Implemented in Partnership with AEPC.........................................................................................................28
Table 31: Disbursement Expenditure to COs (in Million).......................................................................................................................... 163
Table 32: Disbursement Expenditure to POs.................................................................................................................................................... 164
Annual Report 2014
IX
ANNEXES
Annex 1: Current Board Members (as of January 2015)...........................................................................................................51
Annex 2: CO registration, agreement for sub-project and disbursement status (FY2012/13 only)..............52
Annex 3: CO registration, agreement for sub-project and disbursement status (Cumulative).......................53
Annex 4: POs, COs and Coverage FY2012/13 only).....................................................................................................................55
Annex 5: POs, COs and Coverage (cumulative to date)............................................................................................................57
Annex 6: PAF in Terai Border VDCs..........................................................................................................................................................59
Annex 7: PAF in Karnali..................................................................................................................................................................................59
Annex 8: Community Institutional Development........................................................................................................................61
Annex 9: Status of ongoing innovative sub-projects.................................................................................................................63
Annex 10: Details on Capacity Development of COs...................................................................................................................64
Annex 11: Capacity Development Status of POs.............................................................................................................................68
Annex 12: PAF Result Matrix..........................................................................................................................................................................71
Annex 13: Year-wise Target versus Achievements..........................................................................................................................73
Annex 14: Details of expenditure Up to July 15, 2013 (Cumulative PAF-I and PAF-II)...............................................73
Annex 15(1): Programme Funding Statue of FY2069/70 “FY2012/13 only............................................................................73
Annex 15(2): District-wise Target versus Achievement in FY2069/70 (2012/13 only)....................................................74
Annex 16: Poverty Alleviation Fund Project – II Progress Status............................................................................................76
Annex 17: PAF II CO registration, agreement for sub-project and disbursement status (cumulative)...........77
Annex 18: PAF II Expenditure........................................................................................................................................................................78
Annex 19: Summary Result of Follow-on Impact Survey 2010—by TU and the World Bank..............................79
Annex 20: Partnership with AEPC for Rural Energy Sub-projects..........................................................................................82
X
Annual Report 2014
List of Abbreviations and Acronyms
AEPC
Alternative Energy Promotion Centre
CBS
Central Bureau of Statistics
CEDA
Centre for Economic Development and Administration CO Community Organization
CB Capacity Building
CBOs
Community-based Organ izations
DDC District Development Committee
GOs Governmental Organizations
GON
Government of Nepal
IG
Income Generation
IDA International Development Agency, World Bank
IFAD International Fund for Agriculture Development
IWP
Innovative Window Programme
MDGs Millennium Development Goals
MIS
Management Information System
NEA Nepal Electricity Authority
NGOs
Non Governmental Organizations
NPC National Planning Commission
OAG Office of the Auditor General
O&M
Operation and Maintenance
OPMCM
Office of the Prime Minister and Council of Ministers
PAF Poverty Alleviation Fund
PO Partner Organization
PM Portfolio Manager
RBB Rastriya Banijya Bank
REDP Rural Energy Development Programme
TAC Technical Appraisal Committee
USD United States Dollar
VDC Village Development Committee
WFP
World Food Programme
WB World Bank
Annual Report 2014
XI
XII
Annual Report 2014
Executive Summary
By the end of the reporting period, a total of 25,139
community organizations (COs) of the poor were
registered with the Poverty Alleviation Fund (PAF),
and agreements were signed with 23,924 COs to carry
out different income generation and community
infrastructure-related schemes at community level.
During the reporting year alone, agreements
amounting to Rs.1.45 billion were signed with 2,077 COs
to implement 2,690 sub-projects, which include 2,076
income generation (IG) and 614 infrastructure-related
schemes. In cumulative terms, a total of 23,661 IG and
5,126 infrastructure sub-projects were implemented
through 27,850 agreements signed with COs to the
tune of Rs.14. 56 billion, of which Rs.13.89 billion has
already been disbursed to the COs.
With the demand of the communities, different
activities related to IG and infrastructure sub-projects
are currently being implemented. IG activities are
related to agriculture/cropping, livestock, microenterprises/cottage industries, trade and skill-based
services, while infrastructure sub-projects are related
to micro-irrigation, trails, link roads, culverts, bridges,
ropeways, electricity/micro-hydro, water mills, water
supply, sanitation and community building such as
school, health posts/clinics, storage market centres, etc.
PAF has undertaken various initiatives to strengthen
the capacity of the COs and to promote them to higher
institutions so as to sustain their efforts in the long run.
Revolving fund management and training manuals
have been updated and enforced to strengthen the
revolving fund which is established at the community
level. PAF has started enlisting COs in the record of the
respective VDCs. Also, informal networks of COs have
been formed at VDC level. These networks have helped
to raise the voices of the poor in an organized way. It
has also helped to establish linkages and pool resources
from local government and other development partners
to meet the needs of poor communities. The networks
have helped to spearhead infrastructure-related projects
and establish cooperatives to manage production and
marketing.
The Department of Cooperatives, through an
amendment in its rules, has allowed PAF COs to
form cooperatives with the involvement of only CO
members. A pilot cooperative has been registered and
established in Dhading district. PAF has also awarded
the PAF National Journalism Award 2071 to three
journalists who reported on poverty issues. Prime
Minister and Chairperson of PAF Board Rt. Honorable
Sushil Koirala gave away the award at a function marked
to commemorate the International Day for Eradication
of Poverty on October 17, 2014.
As part of its emphasis on institutional development,
PAF is encouraging COs to consider other models of
institutional development such as cottage industries
and micro-enterprises, among others. A concept note
on activity-based pocket area development has been
prepared to encourage quality production and activities.
A pocket area development guidelines has been prepared
and endorsed by the Board. A CO graduation assessment
manual is being implemented at the local level to assess
the level of maturity of COs.
During the reporting year, PAF has achieved 78 per
cent of the physical targets and 75.87 per cent of
the financial targets of the programme. Community
institutionalization process is also emerging in some
of the districts where community has felt the need to
federate themselves to carry out certain functions.
Reaching out to the Excluded
Poor Community Beneficiaries
and Social Inclusion
Partner organizations (POs) selected by PAF are
facilitating COs of the poor. As such, a total of 360
POs are working with communities. As of the end of
the reporting period, these POs are facilitating the PAF
programme in 1,692 VDCs (355 in Initial 6 Districts, 805
in Additional 19 Districts, 474 in 15 B1 Districts, 58 in
Innovative Window Programme [IWP] Districts). Most
importantly, a total of 701,528 poor households (HHs)
are now being served: 191,867 in Initial 6 Districts,
393,472 in Additional 19 Districts, 96,795 in Additional
15 B1 Districts and 19,394 in IWP Districts.
Annual Report 2014
XIII
Additional 14,227 households have also benefitted
through the NDM-World Bank Programme in 77
additional VDCs. So far, PAF has covered 662,028 poor
households as CO member beneficiaries. Among CO
beneficiary members, 64.8 per cent fall under the hard
core poor category (food sufficiency less than 3 months
among the criteria fixed by the community), 25.6 per cent
fall under the medium poor category (food sufficiency
more than 3 months but less than 6 months), 9 per cent
fall under the poor category (food sufficiency more than
6 months but less than a year) and 0.2 per cent fall under
the marginalized non-poor category.
are Muslim. Gender-wise, 64 per cent of the key position
holders in COs are women.
Fig. : CO Members Beneficiary Category
All five districts of the Karnali zone are covered by the
programme. Till date the programme has reached 134
VDCs, i.e. 100 per cent of 134 VDCs in Karnali, benefitting
59,491 poor households.
Marginalized
Non-poor 0.2%
Poor
9.2%
When percentage beneficiaries of PAF by ethnicity
is compared with district percentage ethnicity
composition of 25 PAF districts, it becomes clear that
PAF is focusing on socially excluded groups such as
Dalits and Janajatis. PAF covered almost 100 per cent
of the Dalits in these initial 25 districts. Overall, PAF
has till now benefited nearly 100 per cent of the poor
households in 25 districts (473,958 poor households out
of CBS data, 412,220 poor households in 25 districts).
Out of the 146 border VDCs of Bara, Bardiya, Chitwan,
Dhanusa, Kanchanpur, Kapilbastu, Mahottari, Parsa,
Rautahat, Saptari, Sarlahi and Siraha districts, PAF
has helped in the formation of 1,195 COs, covering
103 VDCs (i.e. 71% of the VDCs in Terai border VDCs),
benefiting 32,107 CO member households.
Medium
Poor 25.9%
Hardcore Poor 64.8%
Beginning from the current fiscal year, PAF is planning
to introduce income-generating schemes, skill
development and sanitation programmes for the
benefit of the urban poor amid a rise in urban poverty.
40%
30%
20%
10%
0%
District
Dalit, 29%
50%
Janajati, 19%
60%
Others, 46%
70%
Dalit, 12%
Percentage
80%
Janajati, 25%
Others, 70%
Fig. : District Population Ethnicity Composition
Vs PAF Beneficiary in 25 Districts
CO Member Bebeficiaries
Similarly, of the key position holders in the COs such
as President, Treasurer and Secretary, 32 per cent are
Dalit, 30 per cent are Janajati, 28 per cent are Brahmin/
Chettri, 9 per cent from other ethnicity and 3 per cent
Annual Report 2014
PAF is investing 78 per cent (i.e. Rs.14,594 million) of
the total sub-project cost. Community sharing is 16
per cent (6% in cash, i.e. Rs.1,131 and 10% in kind, i.e.
Rs.1,796 million) of the total sub-project cost, whereas
VDC/DDC and other development partners are sharing
6 per cent (i.e. Rs.1,231 million) in the total sub-project
cost. In IG sub-projects, community is sharing 9 per cent
in cash and 2 per cent in kind, whereas in infrastructure
sub-projects, it is 2 per cent in cash and 21 per cent in
kind. Apart from community contribution, DDC/VDCs
Fig. : Contribution in Subprojects
Likewise, among CO member households, 27 per cent
are Dalit, 30 per cent are Janajati, 3 per cent are Muslim,
29 per cent are Brahmin/Chhetri and 11 per cent
belong to other ethnicity. Gender-wise, 76 per cent of
the CO members are women.
XIV
Programme Cost Sharing
DDC/VDC
2%
CO Kind
10%
CO Cash
6%
Others
4%
PO 0%
PAF 78%
Community Capacity Building
Fig. : PAF investment
Income Generation Vs Infrastructure
The ultimate goal of PAF is capacity enhancement
of COs. PAF has been imparting various training/
orientations related to their entrepreneurial capacity
development, skill enhancement and institutional
development-related training, orientation and
exposure to enable them to become independent and
self-managing beyond the PAF programme. PAF has
been conducting various training for the CO members.
INFRA
30%
IG
70%
are sharing 4 per cent and other collaborating partners
are sharing 13 per cent of the cost in infrastructure subprojects.
Among the various types of training provided to the COs,
the major ones are: leadership and group management
training, to enhance skills of the CO members to lead
and manage their organizations; training in accountkeeping, to enhance capacity to keep up-to-date
book-keeping of the organization; training in revolving
fund, to manage the revolving fund effectively; training
in entrepreneurial skill enhancement; and training
Table: Training for CO Members
SN
Component
Output Indicator
Output as of July 15, 2014
1
Animal husbandry
No. of events
139
2
Agriculture
No. of events
9, 743
3
AC and RF management
No. of events
3, 5320
4
Technical training
No. of events
44,717
5
Social mobilization
No. of events
17,490
6
Co-graduation
No. of events
6
7
Skill development
No. of events
29
8
Pocket area development
No. of events
60
9
Star and Improve Your Business (SIYB)
No. of events
9,061
10
Orientation/training to COs
No. of event
Out of the total PAF investments, 70 per cent have been
made in IG sub-projects and 30 per cent in infrastructure
sub-projects. About 87 per cent of the PAF investments
in IG sub-projects have been established as revolving
fund being managed by COs at the community level.
Collaboration in Sub-project
Implementation
Collaborative efforts are going on to supplement and
complement different programmes running in the
district to bring discernible impact in considerably less
time. There are several examples of collaboration with
line agencies, local governments and donor agencies
to implement the programme and sub-projects in the
communities at district level. Several memorandums of
understanding (MoUs) have been signed with different
organizations at central level to facilitate different tasks
as well as to facilitate collaboration in implementation
of sub-projects at the community level.
69
in technical skill enhancement, to transfer skills and
technology to members to carry their business/
activities effectively. Furthermore, leading members
of COs are taken to appropriate sites and venues to
expose them to, and share with them, successful and
innovative approaches adopted by other organizations
and institutions.
PAF has been conducting various training for the CO
members. The following table shows the cumulative
progress under this category.
To cope with and fulfil the demand for technical human
resources, different technical training, including boring
for water, basic furniture-making, electrician, driving,
mason, among others, are being conducted at the
community level.
Among the various types of training provided to the
CO members, the major ones are: leadership and
Annual Report 2014
XV
group management training, to enhance skills of the
CO members to lead and manage their organizations;
account-keeping training, to enhance the capacity to
keep up-to-date book-keeping of the organization;
training in revolving fund, to manage the revolving
fund effectively. Similarly, training in entrepreneurial
skill enhancement and training in technical skill
enhancement to transfer skills and technology to
members to carry out their business/activities more
effectively. Furthermore, the leading members of
COs are taken on exposure visits to share knowledge
and innovative approaches adopted by different
organizations and institutions.
Outcomes and Results
During the reporting period, a social re-assessment of
40,085 households of the sample COs with maturity
period of three years or more was carried out. A
comparative analysis of the social re-assessment
data with the baseline social assessment shows
that household-level assets and school enrolment
of children, food sufficiency duration for individual
households, and construction and use of toilet has
increased.
The household-level gross income (from all sources) of
the re-assessed 4,085 households has increased by 68.5
per cent in real terms. Similarly, the household-level
income of about 68 per cent of the total households
has increased by at least 15 per cent.
The results show that the percentage of households
with food insufficiency of 3 months or less dropped
from 63.9 per cent to 37.2 per cent, with a reduction of
58.3 percentage points, for the CO member households.
This effect is seen stronger for Janajati households.
The proportion of food insecure households among
Janajati decreased from 56.7 per cent to 18.0 per
cent—a reduction of 68.2 percentage points. While
for Dalit households, the percentage decrease of food
insecure households is 85.4 to 35.7, with a reduction of
58.2 percentage points.
The revolving fund assessment carried out during
the reporting period shows that communities have
been managing their revolving fund satisfactorily.
Revolving funds have provided an opportunity to
the poor to access funds—otherwise inaccessible—
through formal financial institutions, to initiate income
generation activities. COs are managing and operating
these funds by themselves and are responsible for
setting interest rates and loan payment conditions.
The revolving fund data of 10,328 COs shows that the
fund provided to the COs by PAF has increased by 19
per cent, which includes the interest charged against
XVI
Annual Report 2014
the loans taken by members, community contribution
and funds collected from other sources. Similarly, 93.0
per cent of the 290,783 CO members have accessed the
fund at least for one time to initiate income-generating
activities. Out of the total members accessing the fund
from the revolving fund, 60 per cent have used the
fund two times or more. The assessment also shows
87.5 per cent of the total fund has been invested as
loan to members, rest of the fund is in banks and cash
in hand in COs.
The assessment further shows that the average rate of
interest on loan is 9.9 per cent. However, the interest
rate is slightly higher in newer COs. Furthermore, the
average rate of loan repayment is 78.4 per cent.
Furthermore, during the reporting period, CO
Institutional Capacity Assessment was carried out. The
assessment assessed the capacity of the COs in terms of
various aspects of institutional development, identified
the areas of strength and weaknesses of COs, and
developed a strategy for CO graduation to make them
able to operate in a sustainable way. The assessment was
done among 12,870 COs against 30 indicators1, which
were graded into four groups by the sum of indicator
scores (each on the scale of 1-4, making the maximum
score of 120). Around 12 per cent of the COs were found
fully mature and able to function without additional
capacity building or supervision support; around 82
per cent required some additional capacity-building
support in managing the organization or needed
further social mobilization efforts. The remaining COs
still needed substantial hand-holding for some time.
Budget Expenditure
The total expenditure in FY060/61 (2003/04), FY2061/62
(2004/05), FY2062/63 (2005/06), FY2063/64 (2006/07),
FY2064/65 (2007/08), FY2065/66 (2008/09), FY2066/67
(2009/10), FY2067/68 (2010/11), FY2068/69 (2011/12),
FY2069/70 (2012/13) and FY2070/71 (2013/14) were
Rs.5.78 million, Rs.247.32 million, Rs.493.50 million,
Rs.1,210.30 million, Rs.1,875.48 million, Rs.1,647.20
million, Rs.2,481.5 million, Rs.2,601.28 million,
Rs.2,998.69 million, Rs.2,342.25 million and Rs.2,322.02
million respectively.
By the end of FY2070/71, out of the total expenditure
of Rs.2,322,022,043.45, a total of Rs.2,158,873,106.86
was spent on programme implementation through
COs and POs (COs: Rs.1,677,254,520.34 and POs;
Rs.481,618,586.52), Rs.64,395,482.93 in Monitoring,
Training, Studies and Workshop, Rs.9,988,657.85 in
capital cost and Rs.88,764,795.81 in PAF operation/
recurrent cost.
1
Each of the following six assessment categories has five indicators: (i) social
situation; (ii) economic situation; (iii) capital and resource mobilization; (iv)
coordination, partnership and communication; and (v) good governance and
institutional development; and (vi) capacity building and sustainability.
Fig.: Ratio of Cumulative Expenditure up to FY2070/71
Capital cost; 0.45%
Monitoring, training/
workshop & programme
supervision cost: 2.19%
Recurrent cost: 3.43%
ID cards related
cost :0.01%
Programme implementation
through COs and POs: 93.92%
(CO: 76.63%, PO:17.29%)
The total expenditure of PAF till FY2070/71 stands at
Rs.18,225 million.
Out of the total PAF expenditure of Rs.18,225 million
till FY2070/71 (2013/14), 93.92 per cent was on
Programme Implementation through COs and POs
(COs: 76.63% and POs: 17.29%), 2.19 per cent on
Monitoring, Training, Studies and Workshops, 0.45 per
cent on capital investment for PAF, 0.01 per cent on
identity card distribution cost and 3.43 per cent on PAF
operation/recurrent cost.
Out of the total PAF expenditure up to FY2070/71
(2012/13), 90.09 per cent is from the International
Development Agency (IDA-the World Bank) grant, 1.54
per cent from the International Fund for Agriculture
Development (IFAD) grant, 4.87 per cent from the
Trust Fund and the remaining 3.50 per cent from the
Government of Nepal (GoN) sources.
Future Plan
Since FY2071/72 (2014/15), the programme has been
expanded to 15 additional districts from the list of
deprived districts categorized by the CBS/NPC based
on 28 poverty-related socioeconomic indicators,
bringing the total number of PAF programme districts
to 55.
For FY2014/15, PAF has earmarked a total budget of
Rs.2,572,721,000 to implement 2,503 income generation
schemes, 767 infrastructure schemes and 236 activities
related to product development, market linkages and
piloting of innovative schemes. PAF has allocated a
budget of Rs.638,354,000 for social mobilization and
capacity building through POs to achieve the targets.
Annual Report 2014
XVII
XVIII
Annual Report 2014
CHAPTER
PAF: BRIEF INTRODUCTION
1.1Introduction
Nearly a quarter of the Nepalese population still live
below poverty line. The majority of the poor live in rural
areas and are engaged in traditional and subsistence
farming on small plots of low quality land, have limited
access to credit, infrastructure, markets and basic social
services, often because of remoteness, and rely heavily
on seasonal migration and remittance.
Poverty Alleviation Fund (PAF) was established in
2004 as a special and targeted programme to bring
the poor and disadvantaged groups and excluded
communities in the mainstream of development by
putting them in the driving seat of development efforts.
PAF is contributing to bringing the level of poverty
down to 10 per cent in twenty years in pursuant with
the long-term goal of the Government of Nepal (GoN)
and reduce poverty by half by the year 2015 as per
the Millennium Development Goals (MDGs). With
the recent addition of 15 districts, the total number
1
of programme districts of PAF has reached 40. The
remaining thirty-five districts will be covered through
the poverty pocket approach.
1.2 The Strategy
PAF has taken the strategy of enabling the poor
through social mobilization and capacity building to
organize themselves and obtain quality basic services
in a cost-effective and sustainable manner with their
direct involvement. It uses partner organizations (POs)
to help poor vulnerable people and their community
groups or organizations to implement the programme
components, and they include local bodies, NGOs/
CBOs and private sector organizations. It also seeks to
build partnership with various organizations working in
its areas of operation at the village, district and national
levels to ensure holistic development interventions in
order to bring discernible impact on poverty reduction
and scaling up the programme in considerably little
time.
Annual Report 2014
1
1.3 The Approach
PAF has followed six guiding principles: namely
(a) Targeted at the poor (Antodaya); (b) Social Inclusion
(Samabesi); (c) Demand-driven approach (Maag
Anusar); (d) Transparency (Pardarsita); (e) Direct funding
of community organizations of the poor (Prataksha
Bhuktani); and (f ) Community Institutional Development
(Samudayako Sansthagat Bikash).
Social mobilization, Income generation, Small
community infrastructure development and Capacity
building are the four major programme components
of PAF. The target beneficiaries of PAF are poor women,
Dalit, Janajatis and vulnerable communities living
below poverty line.
1.4 Institutional Arrangements
Established by an ordinance in 2004, PAF is being
governed by an Act since 2006. Thus, PAF is an
autonomous,
independent
and
professional
organization governed by separate law. The twelve-
2
Annual Report 2014
member governing board, chaired by the Prime
Minister, is responsible for policy guidance and
programme approval.
Vice-chairperson and five members are appointed
by the government from among development
professionals, while five other ex-officio members
include National Planning Commission (NPC) Secretary,
chairperson of the Association of District Development
Committees of Nepal (ADDCN), chairperson of the
Association of Village Development Committees of
Nepal (AVDCN), chairperson of the National Women
Commission (NWC) and chairperson of the National
Dalit Commission (NDC).
The PAF secretariat consists of over six dozen members
of staff, mostly professionals, recruited on competitive
basis. A total of 360 POs work on behalf of the poor
in different districts, including through regular and
innovative programmes.
CHAPTER
PROGRESS AND ACHIEVEMENTS
This chapter gives an overview of the annual achievements
against the targets and overall implementation status of
different programme components during the reporting period
as well as the cumulative achievements.
2.1 Annual Achievements
against Targets
As part of its annual planning, PAF had set targets
in its key components: social mobilization, income
generation, community infrastructure, capacity building
and innovative sub-projects. Table 1 summarizes the
achievements of the reporting year against the annual
targets.
2
2.2Component-wise
progress status
2.2.1 Social Mobilization
The objective of social mobilization is to build the
capacity of the community in preparation, design,
implementation, operation and management of
community sub-projects to enhance their livelihoods.
Demand-driven Community Proposal and
Direct Funding
COs, Sub-projects and Investments
As of the end of the reporting year, a total of 25,139
COs were registered with PAF (5,496 in the Mountain
Table 1: Annual Achievements against Targets (FY2013/14)
Description
Annual Target
Income generation sub-projects
Physical Progress
Progress (in %)
2,317
2,054
89
Infrastructure sub-projects
815
599
73
Innovative sub-projects
195
37
19
3,327
2,690
81
60,000
38,139
64
Rs.3,060,658,640.00
Rs.2,322,022,043.45
75.87
Total sub-projects
Beneficiary HHs (including
infrastructure sub-projects)
Programme funding status for
the reporting year
During the reporting year 2013/14, the achievement
in income generation sub-projects was far above the
target, i.e. 89 per cent, while for infrastructure-related
projects, the achievement was 73 per cent. In the case of
innovative sub-projects, PAF had set an annual output of
195 sub-projects, while the achievement has stood at 37
(19%). Similarly, in case of expenditure, the achievement
was 75.87 per cent out of the project expenditure target
of Rs.3,060,658,640.00.
Region, 10,517 in the Hilly Region and 8,570 in the Terai
Region and 556 in the Innovative Window Programme
[IWP] districts).
Of the total registered COs, PAF has inked agreements
with 23,924 COs (5,320 in Mountain, 9,837 in Hilly and
8,237 in Terai districts and the remaining 530 in the
IWP districts) to carry out different IG and community
infrastructure-related sub-projects.
Annual Report 2014
3
Table 2: CO Registration, CO Agreements and Sub-project Agreements
Categories
FY 2013/14
No. of
regd COs
Cumulative
Agreement
No. of COs
No. of
regd COs
No. of
agreements
Agreement
No. of COs
No. of agreements
Mountain
321
373
538
5,496
5,320
6,778
Hill
805
1,093
1,389
10,517
9,837
11,496
Terai
495
587
726
8,570
8,237
8,907
27
24
37
556
530
669
1,648
2,077
2,690
25,139
23,924
27,850
Innovative
Districts
Grand total
Region-wise, PAF has invested the highest amount in IG
sub-projects in the Hilly Region, followed by the Terai,
Mountain and IWP districts. Similarly, investment trend
is maintained in the infrastructure sub-projects.
In the case of income generation, the activities
most demanded by the communities are related to
agriculture, livestock, cottage industries, trade and skillbased services. Similarly, infrastructure sub-projects are
related to micro-irrigation, link roads, culverts/bridges,
ropeways, electricity/micro-hydro, water mills, water
supply, sanitation, school and health post building,
among others.
In cumulative scenario, average community sharing is
16 per cent (6% in cash and 10% in kind) of the total
sub-project cost, whereas VDCs and DDCs and other
development partners share 6 per cent of the total sub-
Table 3: PAF Investment in Community Sub-projects
Categories
FY2070/71 (Million Rs.)
IG
Infra
Cumulative (Million Rs.)
Total
IG
Infra
Total
Mountain
123.147
243.688
366.835
2,247.006
1,599.275
Hill
369.715
334.113
703.828
4,023.689
1,761.490
5,785.180
Terai
217.606
156.850
374.455
3,780.566
898.577
4,679.143
5.040
17.429
22.469
166.452
116.853
283.305
715.507
752.080
1,467.587
10,217.713
4,376.195
14,593.908
Innovative Districts
Grand Total
Till the end of previous fiscal year 2012/13, agreements
amounting to Rs.13,118.796 million were signed
with 21,847 COs, while, during the reporting year,
agreements amounting to Rs.1,467.587 million were
signed with additional 2,077 COs. In cumulative terms,
agreements amounting to Rs.14,593.908 million were
signed with 23,924 COs till the end of the reporting
year, i.e. FY2013/14.
Programme Cost Sharing (investment—IG versus
Infrastructure, PAF versus Community)
PAF invested Rs.715.507 million in IG activities during
the reporting year against the total cumulative
investment of Rs.10,217.713 million till the end of the
reporting year. In case of infrastructure schemes, PAF
invested Rs.752.080 million during the reporting year,
while cumulative investment stood at Rs.4,376.195
million.
Overall, out of the total PAF investment, 70 per cent has
been made in income-generating sub-projects and 30
per cent in infrastructure-related sub-projects.
4
Annual Report 2014
3,846.280
project cost. In total, PAF has invested 78 per cent of the
community sub-projects cost.
In the case of income-generating sub-projects,
community shared 9 per cent in cash and 2 per cent
in kind, while in the case of infrastructure sub-projects,
it is 2 per cent in cash and 21 per cent in kind. DDC
and VDC contributions are significant with 4 per cent
in the case of infrastructure sub-projects, while other
Fig. 1: PAF investment
4,500.00
4,000.00
3,500.00
3,000.00
2,500.00
2,000.00
1,500.00
1,000.00
500.00
0
IG
IG
IG
Infra
Infra
Infra
IG Infra
Mountain
Hill
Terai
Innovative
Districts
Fig. 2: Contribution in Subprojects (INFRA)
DDC/VDC
4%
Others
13%
Fig. 3: Contribution in Subprojects (Cumulative)
PO
0%
CO Kind
10%
CO Cash
6%
CO kind
21%
DDC/VDC
2%
Others
4%
PO 0%
PAF 78%
CO cash
2%
PAF
60%
organizations contributed 13 per cent of the total cost
in infrastructure sub-projects.
Facilitation of Community through POs
POs are selected by PAF to facilitate COs of the poor.
The facilitation work of POs includes organizing COs,
enhancing COs’ capacity development in planning
activities, carrying out detailed feasibility, survey design
and estimates, proposal writing during preparatory
phase, and providing technical assistance and
monitoring and supervision during implementation
phase.
As such, 354 POs are working with communities in 40
programme districts. Furthermore, six POs are working
for Innovative NDM-World Bank Programme.
Table 4: Status of POs
Description
Regular 40 districts
Innovative Programme
Total
No. of POs
working
No. of VDCs
covered
354
1,634
6
58
360
1,692
Annual Report 2014
5
Till the end of the reporting year, the POs are involved in
facilitation work in 1,692 VDCs (355 in Initial 6 Districts,
805 in Additional 19 Districts, 474 in 15 B1 Districts, 58
in IWP Districts) and COs are working in those VDCs.
Reaching out to the Poor and Social Inclusion
PAF has taken the strategy of the poor community
organizing themselves to prepare, implement and
manage their programmes and sitting in the driving
seat, with decision-making authority.
The participatory social assessment and community wellbeing ranking process identified the poor community
members as primary beneficiaries at the settlement
level. They are organized into COs to plan, implement
and manage their sub-projects. As entry point of PAF
programme at settlement level, social mapping and
participatory social assessment are the primary social
mobilization steps. The settlement-level social assessment
has shown that 69.8 per cent of all households are
identified as poor households and thus included as CO
members in the PAF programme.
in the Hilly Region. When the region-wise breakdown
of the CO members is compared, the Hilly Region holds
the highest share, with 43 per cent, followed by the
Terai and Mountain regions, with 33 and 21 per cent
respectively, while IWP districts have a meagre share of
3 per cent.
CO Members by Poverty Ranking
Among beneficiary members of COs, 64.8 per cent fall
under the hard core poor (Ka) category (food sufficiency
less than 3 months among the criteria fixed by the
community), 25.9 per cent fall under the medium poor
(Kha) category (food sufficiency more than 3 months
but less than 6 months), 9.2 per cent under the poor (Ga)
category (food sufficiency more than 6 months but less
than a year) and a very small percentage of members fall
under the marginalized non-poor (Gha) category.
Fig. 5: CO Members-Beneficiary category
Gha
0.2%
Ga
9.2%
CO Members
During the reporting year, PAF was able to reach out
to 38,685 poor households and organize themselves as
CO members to carry out different activities aimed at
improving their livelihood. Till the end of the reporting
year, a total of 662,088 CO member households
benefited from PAF assistance.
Kha
25.9%
Ka
64.8%
Fig. 4: Region-wise CO Member HHs
3%
Fig. 6: Poverty Ranking-wise CO Members
200,000
Terai
100,000
A
B
B
50,000
C
M
ou
...
0
Table 5: CO Member Beneficiaries
Programme Areas
Mountain
FY2070/71
Hill
19,160
286,310
Terai
11,429
218,778
590
15,632
38,685
662,088
Of the total 662,088 CO members as of the end of the
reporting year, a total of 38,685 were covered during the
reporting year alone. The coverage ratio is the highest
6
Annual Report 2014
D
C D
A B
C D
Cumulative
141,368
Total
D
B
Region
7,506
Innovative Districts
C
no
...
43%
A
150,000
In
g
Hill
Numbers
g
A
ai
33%
Te
r
Mountain
ll
g
Hi
21%
Similarly, in terms of distribution of members by
programme area, the Terai region has the highest
number of hard core poor, with 72 per cent, followed
by the Mountain Region, with 65 per cent, and the Hilly
Region, with 60 per cent.
CO members by Caste and Ethnicity
Out of the total 662,088 CO member households till the
end of the reporting year, 27 per cent are Dalit, 30 per
cent are Janajati, 24 per cent are Chhetri, 5 per cent are
Fig. 9: CO Members by Gender
Fig. 7: CO Members by Ethnicity
Muslim
3%
Others
11%
Male
24%
Dalit
27%
Chhetri
24%
Female
76%
Janajati
30%
Brahmin
5%
Brahmin, 3 per cent are Muslim and 11 per cent belong
to other ethnicity.
Caste and ethnicity-wise distribution of CO members
by region shows that Dalit dominate in the Terai region,
Janajati in the Hilly Region and Chhetri in the Mountain
Region.
regional level, Dalits dominate as key position holders
in the Terai and Chhetris dominate in the Hilly Districts.
Janajati dominate in the Mountain Region and IWP
districts.
Fig. 10: CO Members by Region and Gender
CO Members by Key Position Holders
The president, treasurer and secretary are considered
as key positions in COs. There are a total of 69,975 key
position holders within the COs. Gender-wise and
ethnicity-wise breakdowns of key position holders are
presented in charts. Of the total key position holders in
the PAF-supported COs, 63 per cent are female in line
Fig. 8: Key Position Holders by Gender
Numbers
250,000
CO Members by Gender
Female CO members have the lion’s share, with 76 per
cent. They are highest in the Hilly Region, followed by
the Terai and Mountain Regions.
Female
200,000
Female
150,000
100,000
Male
Female
Male
Male
Female
Male
50,000
0
Mountain
Hill
Terai
Innovative
Region
Fig. 11: Key Position Holders by Caste/Ethnicity
Others
8.0%
Muslim
2.0%
Male
36%
Dalit
33.9%
Female
64%
Brahmin/
Chhetri
28.0%
with PAF’s affirmative approach of the empowerment
of poor women. Caste and ethnic representations in
key positions show that 34 per cent are Dalits, followed
by 28 per cent Janajatis and Brahmin/Chhetris each, 2
per cent Muslim and 8 per cent other ethnicity. At the
Janajati
28.1%
Community Institutional Building
Community institutionalization process is also
emerging in some of the districts where the community
has felt the need for federating themselves for certain
functions. A total of 92 multipurpose cooperatives
Annual Report 2014
7
and 1,013 federations of COs have been formed as per
the felt need of the community. Informal networks of
COs are being formed in each VDC in the process of
institutionalization. Based on ground experience, PAF
is working on formulating strategies for sustainable
institutional development of COs.
During the reporting year, PO evaluation criteria
were revised to make them more simple, based on
experience, and a CO graduation assessment guideline
was approved. Another equally important document is
the draft for pocket area (activity-based) development:
implementation guidelines and concept paper for
cooperative development, among others.
2.2.2 Income Generation and
Micro-enterprise
A wide range of income generation activities are being
supported at the community level, based upon the
potentials and opportunities available. The potentials
include the availability of raw materials and resources,
access to market, skills and traditional occupations, etc.
POs provide information to community members and
facilitate them to identify potential income generation
activities. Nepal being an agricultural country, more
than 80 per cent of its population relies on this sector.
Income generation activities supported by PAF are
related to agriculture and livestock sectors as majority
of the Nepalese are landless or nearly landless but
make their sustenance through the agriculture sector.
IG Activities: Sector, households and investment
By the end of FY2070/71, PAF has signed agreements
with 23,924 COs to implement 27,850 sub-projects.
Out of these sub-projects, 23,661 are related to income
generation activities. The ratio of number of IG subprojects to the total number of sub-projects increased
from 55 per cent in FY2061/62 to 83.64 per cent in
FY2064/6, and it stands at 76 per cent in FY2070/71.
In terms of investment, the share of the IG sector in
the total investment continuously increased to 83.5
per cent in FY2063/64 from 61 per cent in FY2061/62,
then it started to decrease and it stands at 49.7 per cent
in FY2070/71. The trend of PAF investment shows that
investment in the IG sector continuously increased
till FY2063/64 and then started to decrease. Income
generation activities being the first choice of the poor,
IG investment again increased in FY2067/68 due to
increased coverage in 15 new districts and then it
started decreasing.
IG activities investment by sector and region
Income generation activities can be grouped into
different sectors like agriculture, livestock, service,
trading, manufacturing and others. PAF investment by
sectors as well as households involved in each sector is
presented in table and chart. The following data on PAF
Fig. 12: PAF’s Investment in COs
% of total investment
90.00
80.00
70.00
60.00
50.00
40.00
30.00
20.00
10.00
0
8
61/62
62/63
63/64
64/65
65/66
66/67
67/68
68/69
69/70
70/71
IG
60.84
65.15
83.54
74.16
72.04
64.74
75.50
54.3
54.8
49.7
Infra
32.48
26.47
7.61
18.03
20.45
28.78
22.50
44.4
43.7
49.5
3.73
1.30
0.9
0.9
0.5
2.76
0.5
0.5
0.3
CB
4.86
5.91
5.97
4.99
4.41
M&E
1.82
2.46
2.87
2.82
3.10
Annual Report 2014
0.60
Table 6: Sector-wise Income Generation Activities by Households and PAF Investment
FY2070/71
S.N.
Sectors
1
Agriculture
2
Livestock
3
Service
4
Trading
5
Manufacturing
Total
Amt
(in M)
HHs
HHs
(%)
Cumulative achievements till FY2070/71
Investment
(%)
HHs
Amt
(in M)
HHs
(%)
Investment
(%)
2,714
48.27
9.6
7.8
63,525
643.70
10.9
7.0
21,722
477.58
77.2
77.5
402,493
6,614.53
69.3
72.2
704
14.93
2.5
2.4
21,014
324.40
3.6
3.5
2,822
70.79
10.0
11.5
79,544
1,432.54
13.7
15.6
185
4.30
0.7
0.7
14,058
140.55
2.4
1.5
28,147
615.87
100.0
100.0
580,634
9,155.72
100.0
100.0
investment in income-generating sub-projects does
not include the investment related to capacity building
of COs and their institutional management cost.
People living in rural areas have limited access to
basic infrastructures like road, electricity, market and
information, resulting in higher demand for livestock
activities as income generation sub-projects.
The livestock sector shows the largest portfolio of IG
activities by investment as well as households involved.
About 72 per cent of PAF support is disbursed to this
sector and 69 per cent of IG beneficiary households
are engaged, followed by trade-related activities (16%),
agriculture-related activities (7%), service sector (4%),
manufacturing and other activities (approximately 1%).
In terms of investment, out of the total 402,000
households involved in livestock husbandry, about 34
per cent are engaged in milk production through buffalo
and cow raising, 59 per cent in meat production, 5 per
cent in ox/he-buffalo raising for farming/breeding and
the remaining 2 per cent in transportation. Out of the
total investment of Rs.6,614.53 million in the livestock
sector, about 48 per cent is in meat production,
followed by 44 per cent in milk production, 5 per cent
in breeding/farming and 3 per cent in transportation.
The variations in communities’ demand across
geographical regions and accessible and nonaccessible areas show that the communities are smart
in selection of activities based on accessibility, existing
natural resources and potential markets opportunities.
In the Terai region, market for fresh milk is relatively high
and accessible, and products can easily be marketed with
little time and effort for collection and transportation.
Nearly 56 per cent of the households (with 70% of
total investment in the livestock sector in the region)
pursuing livestock as part of their income generation
activity in the Terai region are rearing buffaloes and cows
for milk production, followed 31 per cent (19% of total
investment) for meat production and the remaining 13
per cent (11% of total investment) for farming/breeding
purpose. The trend has not changed over many years.
Similarly, in the Hilly Region, 67 per cent of the
households (61% of the total amount) have been found
engaged in meat production by rearing goat, pig and
poultry, among others. In the same region, 24 per cent
of the households (35% of the total amount) of livestock
raising is done for milk production, followed by 9 per
cent of the households (4% of the total amount) for
farming/breading and transportation purposes. In
the case of the Mountain Region, 75 per cent of the
households (70% of the total amount) are involved in
meat production, followed by 18 per cent (21% of the
Fig. 13: Investment in IGAs by Sector
Livestock
72%
Agriculture
7%
Manufacturing
1%
Trading
16%
Service
4%
Annual Report 2014
9
Fig. 14: Investment in IGAs by Sector
g
g
Fishery
1%
g
Vegetable
farming
59%
Fig. 15: Investment in Business by Type
Bee keeping
4%
g Agro
forestry
13%
Others
4%
Electrical
goods
2%
g Fruit
farming
15%
Garment
4%
Livestock
related
7%
Cereal
crops
1%
Cash crops
7%
g
g
Agri & forest
8%
total amount) in milk production and the remaining 7
per cent in transportation purpose.
In addition to animal husbandry, PAF has provided
support in its associated areas such as animal
treatment fund, establishment of veterinary services
and developing village-level health workers to
supplement the livestock component. In view of the
largest investment portfolio in the livestock sector, due
emphasis has been laid on establishing linkages with
market and services.
Apart from livestock, the communities have demanded
diverse activities in the agriculture sector. The activities
thus demanded are the system of rice intensification (SRI),
vegetable farming in open field to tunnel house, seed
multiplication, cash crop production and fruit farming.
Out of the total 63,308 households, 59 per cent are
engaged in vegetable farming, followed by 15 per cent
in fruit farming, 14 per cent in agro-forestry, 7 per cent
in cash crop farming, about 4 per cent in beekeeping
and the rest in fishery and others.
Retail Shop
75%
Vegetable farming has been found very lucrative and
effective in increasing the income of the poor within
a short interval of time in areas where market is easily
available for fresh vegetables. Under the IWP, PAF has
also supported landless and marginalized people in
Chitwan district to engage in vegetable farming in lease
land. This programme has helped increase income of the
poor, thereby creating full-time employment for them.
In mountain districts like Bajura, green vegetable
farming was outright impossible during winter season
before PAF intervention. But following PAF intervention,
commercial vegetable farming is being practised even
in winter season with the introduction of pit green
house and solar tunnel house. Such vegetable farming
technology/methodology has been successfully
demonstrated, and this proven and tested case has
shown high potential for scaling up in other areas in
the days ahead.
Irrespective of better yield but comparatively longer
gestation period, the demand for fruit farming is low.
Nonetheless, a promotional activity of fruit farming
Table 7: PAF Investment in Agriculture Sector by Category
FY2070/71
Sub-sector
HH
Cumulative till FY2070/71
Percentage
Amount
(in million)
Per cent
HH
Amount
(in
Percentage million) Percentage
Agro-forestry
54
2.0
0.99
2.0
8,444
13
33.1
5
Fruit farming
143
5.3
2.17
4.5
9,370
15
50.0
8
Cereal crops
16
0.6
0.46
0.9
542
1
3.5
1
Cash crops
598
22.0
9.37
19.4
4,361
7
51.3
8
1,779
65.5
33.16
68.7
37,176
59
456.6
71
118
4.3
2.00
4.2
2,727
4
32.8
5
Fishery
5
0.2
0.10
0.2
688
1
10.8
2
Other support
activities
0
0.0
0.03
0.1
5.7
1
2713
100.0
48.27
100.0
643.7
100
Vegetable farming
Beekeeping
Total
10
Annual Report 2014
63,308
100
Fig. 16: Investment in Service sector by Category
Others
5%
Communication
2%
Sewing and cutting
30%
Transportation
28%
Livestock support
2%
Metal work
3%
Repair and
maintenance
9%
Agro-processing
5%
Barber
2%
undertaken by the communities has widened the
scope for scaling up this intervention in coming days.
Trading is the second largest portfolio among IG
activities. Altogether 79,544 households are engaged
in trading businesses, where PAF has invested
Rs.1,432.54 million. Of the total investment, 75 per cent
is in retail shop, followed by 8 per cent in agriculture
and forest-related enterprises, 7 per cent in livestock
and livestock product-related businesses, 4 per cent in
garment business and the rest in other different types
of activities.
Within the trading sector, retail business has the largest
investment in all ecological belts: more than 65 per
cent in the Terai, 85 per cent in mountain districts and
more than 87 per cent in Hilly Districts. Animal business,
wood product business, agricultural inputs, food itemrelated business are other major activities in this sector.
Overall, 23,000 households are engaged in the services
sector, where PAF has invested about Rs.324.4 million.
Out of the total investment, Rs.315 million has been
invested in income-generating social services and the
rest in social services like support for school and health
posts, scholarships, etc. Tailoring business, having 29 per
cent investment, is one of the largest components of
the social sector, followed by transportation (28%), small
hotels/teashops (14%), repair and maintenance (7%), and
the rest is in other activities like livestock support, agrovet services, etc.
A total of 14,058 households are involved in
manufacturing businesses, where PAF investment is
about Rs.140.5 million. Out of the total investment,
about 51 per cent is in non-agro product-related
Hotel/restaurant
14%
manufacturing activities, followed by 43 per cent in
forest product-related, agro-processing-related (4%)
and the rest is in fruit processing.
Diverse IG activities are undertaken by the community
members. Of them, livestock sector is the major activity
as compared to other IG activities. It means, there is
still great challenge to provide informed choices to the
people so that they are able to select suitable IG activities
based on their needs, local resources, knowledge, skills
and market potentials. A lion’s share of investment
in the livestock sector demands development of a
mechanism for providing adequate veterinary services
in rural areas. To sustain the diverse interventions, PAF
should accord high priority to enhance the qualitative
capacity of both POs and COs.
Fig. 17: Investment in Manufacturing
Sector by Category
Other off-farm
related
49%
Fruit processing
1%
Agroprocessing
7%
Forest product
43%
Annual Report 2014
11
Box: PAF Supporting Rural Artisans through JSDF Project
Japan Social Development Fund has provided a grant of US$2,646,777 million to enhance the quality of life
of the poor people who are engaged in artisanship and cultural industries. Signed on February 17, 2012, the
project is now being implemented in nine districts, namely Terahthum, Dhanusha, Lalitpur, Gorkha, Myagdi,
Rupandehi, Kapilbastu, Dailekh and Bajura. Most of these districts are regular programme districts of PAF.
The project will be launched first in Terahthum, Dhanusha, Lalitpur and Gorkha districts and then move to other
districts.
PAF has hired Asian Heritage Foundation, based in New Delhi, as Technical PO in August, 2014 in order to
support artisans in multiple design development and marketing of their products. Similarly, PAF will mobilize
existing local POs for social mobilization and institutional development of artisan communities.
In order to launch the JSDF project in the districts, a district-level visit programme was organized in Dhanusha
and Terahthum districts in December 2014 by a team comprising PAF, AHF and WB personnel. The objective of
the visit was to assess the existing skill set of artisans. During the field visit AHF team (Technical PO) assessed
the skills sets of artisans and decided to intervene with Mithila Art and Sikki Grass Crafts in Lohana VDC and
Janakpur Municipality Ward no. 12, 14, 15 and 16 of Dhanusha district on pilot basis. Similarly, Dhaka products
in Jaljale, Oyakjung and Solma VDCs of Terahthum district were selected.
The World Bank is the administrator and PAF is the implementing agency of the project. The project is entitled
“Making Markets Work for Conflict Affected in Nepal”.
2.2.3 Community Infrastructure
Number of Activities
Till the end of the reporting year, a total of 4,993
infrastructure-related sub-projects were completed
under the PAF programme. During FY2013/14 alone,
634 sub-projects were completed.
Regarding distribution of schemes by type for the reporting
year, drinking water supply and sanitation-related subprojects, numbering 226, stand at the top, followed by 140
small irrigation-related sub-projects and 112 community
building sub-projects. Similarly, a total of 78 sub-projects
were related to Rural access, i.e. transportation, while 71
sub-projects were related to rural energy.
In cumulative scenario, water supply and sanitation
activities stand at the top, with 1,822 activities, followed
by irrigation activities, at 991, community building subprojects, at 623, and Rural access sub-projects, at 470.
Also, a total of 358 rural energy-related sub-projects
were constructed and 729 miscellaneous activities,
including Ghatta (mill), drainage, improved stove, river
training, rice mills, etc, among others.
Table 8: Distribution of Infrastructure by Type
Infrastructure
Activity
Rural access
Total Number of
Sub-projects
FY2070/071
Cumulative
78
470
112
623
71
358
Small irrigation
140
991
Water supply
and sanitation
226
1,822
Miscellaneous
7
729
634
4,993
Community building
Rural energy
Total Sub-projects
Benefited Households
During the reporting year, Rural access has benefited
maximum number of households, while cumulatively,
water supply and sanitation activities have benefited
the most. Maximum demands were made for Rural
access, while overall, demand for Water Supply schemes
is maximum in rural area.
12
Annual Report 2014
Fig. 18: Distribution of Infrastructure
by Type (Cumulative)
g
g
g
Rural access
Rural energy
Water supply and sanitation
15%
g
g
g
Fig. 19: Distribution of Infrastructure by Type
(FY2070/071)
Community building
Small irrigation
Miscellaneous
g
g
g
Rural access
Rural energy
Water supply and sanitation
18%
36%
11%
20%
22%
Table 9: Infrastructure Activities and Benefitted
Households
Sub-project-wise
Beneficiary Households
FY2070/71
Cumulative
1
Rural access
57,044
49,102
2
Community
building
58,194
48,697
3
Rural energy
49,530
38,313
4
Small irrigation
31,081
25,554
5
Water supply
and sanitation
58,999
50,407
6
Miscellaneous
5,131
4,917
42,989.00
259,979.00
Total
g
Community building
Small irrigation
Miscellaneous
7%
37%
Infrastructure
Activity
g
1% 12%
9%
12%
SN
g
PAF Investment in Community Infrastructure
During the reporting year, 112 community building
were completed and Rs.126.35 million (19.7% of PAF
investment in infrastructure) invested in these buildings,
while Rs.203.21 million (28.6% of PAF investment in
infrastructure) has been invested in 226 water supply
and sanitation schemes.
Similarly, in cumulative scenario, a total of Rs.848.39
million (29.59% of PAF investment) were invested in
water supply and sanitation, which is higher than any
other categories of infrastructure. This is mainly due to
the higher number of water suppy-related schemes in
cumulative terms.
Table 10: PAF Investment in Different
Infrastructure Schemes (in million Rs)
SN
Category of
Infrastructure
PAF Investment (in million)
FY2070/71
Cumulative
1
Rural access
147.90
485.43
2
Community
building
126.35
583.46
3
Rural energy
155.50
585.90
4
Small irrigation
130.36
413.99
5
Water supply and
sanitation
203.21
848.39
6
Miscellaneous
4.94
50.72
768.26
2,967.89
Total
Community’s Contribution in
Infrastructure-related Investment
To construct infrastructures, communities are also
contributing to the total investment. They are
contributing in cash as well as in kind. Collection of
local materials and labour is the main job of community
while executing community infrastructures. So, there
is a variation in community contribution between
different types of infrastructure. Rural access schemes
which were completed during the reporting year have
highest contribution from communities. They have
contributed Rs.57.87 million for Rural access schemes,
which is 26.0 per cent of the total cost. It is followed
by the Water supply sub-projects, with 24.6 per cent
contributions, while Community Building has attracted
the least contribution of 20 per cent. On average,
there is 23 per cent community contribution in the
infrastructures completed during the reporting year.
Annual Report 2014
13
Table 11: Community Contribution in Infrastructure Schemes
SN
Investment of Community
FY2070/71
Category of Infrastructures
Cumulative
Amount (million)
Percentage
Amount (million)
Percentage
1
Rural access
57.87
26
194.86
26.1
2
Community building
32.47
20
176.76
22.6
3
Rural energy
88.65
21
347.37
22.4
4
Small irrigation
39.49
23
138.02
22.8
5
Water supply and sanitation
69.58
25
304.57
24.9
6
Miscellaneous
1.40
21
12.31
26.8
289.46
23
1173.89
24.3
Total
Similarly, in cumulative scenario, infrastructures under
miscellaneous category have maximum contribution
(26.8%) from the communities, followed by Rural access
(26.1%). In total, 24.3 per cent contribution has been
made by the community for community infrastructures.
Education Offices (DEOs) have invested in PAF-supported
infrastructure schemes. They have invested Rs.587.73
million in cumulative terms and Rs.148.49 million during
the reporting year alone for infrastructures. Out of the
total investment, 87 per cent is in the rural energy sector
in both cumulative scenario and reporting year.
Contribution from local bodies
DDC and VDC are also contributing in PAF-supported
infrastructure sub-projects. These institutions have
contributed Rs.60.92 million during the reporting year
alone and a total of Rs.220.18 million in cumulative
terms. Their contribution in rural energy is the highest,
followed by Rural access. This shows that local bodies are
more interested in rural energy and Rural access. They
have contributed Rs.170.06 million in cumulative and
46.61 million for rural energy sub-projects during the
reporting year. This shows that coordination between
PAF and local bodies is increasing in recent days. The
DDCs and VDCs have contributed Rs.7.78 million for
Rural access schemes completed during the reporting
year, while Rs.27.85 million has been invested in Rural
access in cumulative scenario. Further analysis shows
that communities are forcing local bodies to contribute
to sub-projects that demand larger investment.
Ratio of investments by different agencies
In cumulative terms, local bodies and other development
agencies are more interested in coordination in rural
energy. They are contributing 9.9 per cent and 31.0
per cent of the total cost of infrastructure respectively.
Contribution from PAF is the highest, with 74.8 per cent
for community building category of sub-projects, which
include health posts, school buildings, rustic stores,
market sheds, cooperative buildings, etc and the lowest
for rural energy, where PAF’s contribution is only 36.70
per cent of the total cost. Percentage of community
contribution is the highest (26.8%) for Miscellaneous
and the least (22.4%) for rural energy-related subprojects. On average, PAF has contributed 65.70 per
cent of the total cost, whereas CO’s contribution is
24.30 per cent, DDC and VDC’s contribution is 2.72 per
cent and other’s contribution is 7.3 per cent.
Investment from other sources
Besides DDC and VDC, other donor and line agencies,
including the Alternative Energy Promotion Centre (AEPC),
rural energy Development Programme (REDP) and District
For infrastructures completed during the reporting year,
PAF, communities, DDCs/VDCs and other line agencies
have contributed 67.04, 22.58, 2.92 and 7.46 per cent of
the total cost of infrastructure respectively. Contribution
Table 12: Contribution of Local Bodies in Different Schemes
SNS.No.
Investment of Local Bodies
FY 2070/71
Category of Infrastructure
Cumulative
Amount (million)
Percentage
Amount (million)
1
Rural access
7.78
3.5%
27.85
3.7 %
2
Community building
2.14
1.3%
6.89
0.9 %
3
Rural energy
46.61
11.1%
170.06
9.9 %
4
Small irrigation
0.31
0.2%
4.83
0.8 %
5
Water supply and sanitation
4.08
1.4%
10.55
0.9 %
6
Miscellaneous
-
-
-
0.1 %
65.11
2.72%
220.18
2.92 %
Total
14
Annual Report 2014
Percentage
Table 13: Investment from Different Sources
SN
Investment from Other Sources
FY2070/71
Category of Infrastructure
Amount (million)
Cumulative
Percentage
Amount (million)
Percentage
1
Rural access
9.58
4.3
16.46
3.5
2
Community building
2.55
1.6
10.58
1.7
3
Rural energy
128.86
30.7
510.13
31.0
4
Small irrigation
1.35
0.8
24.52
4.6
5
Water supply and sanitation
5.79
2.0
25.32
2.2
6
Miscellaneous
0.36
5.4
0.72
0.8
148.49
7.46
587.73
16.3
Total
Fig. 21: Investment from Other Sources
(Cumulative)
Fig. 20: Investment from Other Sources
(FY2070/71)
g
g
g
Rural access
Rural energy
Water supply and sanitation
g
g
g
Community building
Small irrigation
Miscellaneous
Water supply
and sanitation
4%
1% 4% 0% 6% 2%
Rural access
3%
Miscellaneous
0%
Community
building
2%
Small irrigation
4%
Rural energy
87%
87%
from PAF is the highest (77.3%) for Community Building
sub-projects and the lowest for rural energy, where
PAF’s contribution is only 37.1 per cent of the total
cost. Percentage of community contribution is the
highest (25%) for Rural access and the lowest (19.9%)
for Community Building sub-projects.
Per Capita Cost–Total investment and PAF
The PAF rules require the upper ceiling of per capita
investment to be Rs.5,500 for infrastructure-related
sub-projects. But in reality, the per capita cost of PAF
investment is Rs.2,993.09 for the sub-projects completed
during the reporting year, while the cumulative per
capita cost is Rs.1,875.24. For infrastructures completed
during the reporting year, per capita cost is the highest
for Miscellaneous sub-projects, with Rs.3,258.58, and
the lowest for community building, with Rs.2,123.49.
Per capita cost in total is the highest for rural energy-related
infrastructures for both reporting year and in cumulative
terms. Its value is Rs.6,288.61 and Rs.5,575.56 for the
reporting year and cumulative respectively. For Community
Building, it is the lowest, with Rs.2,748.02, in the reporting
year and for Rural access Rs.2,306.79 for cumulative.
Table 14: Ratio of Investments by Different Agencies in PAF Community Infrastructure
(Cumulative—in percentage)
S.N.
Category of Infrastructure
PAF
CO (cash)
CO
(kind)
CO
(total)
DDC/VDC
Others
1
Rural access
66.7
1.0
25.1
26.1
3.7
3.5
2
Community building
74.8
0.2
22.4
22.6
0.9
1.7
3
Rural energy
36.7
4.9
17.5
22.4
9.9
31.0
4
Small irrigation
71.8
.45
22.4
22.8
0.8
4.6
5
Water supply and sanitation
72.0
0.2
24.7
24.9
0.9
2.2
6
Miscellaneous
72.3
6.0
20.8
26.8
0.1
0.8
Total:-
65.7
2.1
22.2
24.3
2.72
7.3
Annual Report 2014
15
Table 15: Ratio of investments by different agencies in PAF community infrastructure
(Reporting year, in percentage)
S.N.
Category of Infrastructure
PAF
CO Cash
Co Kind
CO total
DDC/VDC
Others
1
Rural access
66.3
1.8
24.1
25.9
3.5
4.3
2
Community building
77.3
0.2
19.7
19.9
1.3
1.6
3
Rural energy
37.1
4.7
16.4
21.1
11.1
30.7
4
Small irrigation
76.0
0.2
22.8
23.0
0.2
0.8
5
Water supply and sanitation
71.9
0.1
24.5
24.6
1.4
2.0
6
Miscellaneous
73.7
0.7
20.2
20.9
-
5.4
67.04
1.30
21.28
22.58
2.92
7.46
Total:-
Per Household Community Contribution
For sustainability of infrastructure, PAF enforces
community to take its ownership. Furthermore, they
are also contributing through their labour and work
related to the collection of non-local materials. On
average, community has contributed Rs.19,351.84 and
Rs.13,692.12 for recently completed and cumulative
infrastructures respectively. It is the highest for Water
supply infrastructures among the recently completed
infrastructures and in cumulative terms.
Table 16: Per Capita Cost, Total Investment and PAF
Beneficiaries Population
Category of
Infrastructures
FY2070/71
Cumulative
1
Rural access
47,935.00
327,639.00
3,085.47
1,481.61
4,654.89
2,306.79
2
Community building
59,501.00
339,860.00
2,123.49
1,716.77
2,748.02
2,360.85
3
Rural energy
66,727.00
291,151.00
2,330.39
2,012.36
6,288.61
5,575.56
4
Small irrigation
36,509.00
199,447.00
3,570.63
2,075.69
4,697.75
3,250.92
5
Water supply
and sanitation
56,605.00
367,120.00
3,589.97
2,310.93
4,993.55
3,214.47
1,516.00
30,663.00
3,258.58
1,654.11
4,419.53
3,840.85
268,793.00 1,555,880.00
2,993.09
1,875.24
4,633.72
3,424.91
6
FY2070/71
Per Capita cost with
respect to Total Cost
Per capita cost with PAF
Miscellaneous
Total
Cumulative
FY2070/71
Cumulative
Fig. 22: Per Capita Cost versus Total Cost
7,000.00
6,000.00
5,000.00
4,000.00
3,000.00
2,000.00
1,000.00
g
0.00
isc
M
d
an
ly
pp
su
W
at
er
ell
sa
ni
an
e
ou
s
ta
tio
n
ga
tio
rri
all
i
Ru
ra
le
ld
Bu
i
ity
m
un
Co
m
Annual Report 2014
Sm
in
g
s
es
la
cc
ra
Ru
16
ne
rg
y
n
g
FY070/71
Cumulative
Table 17: Per Household Community
Contribution
SN
Fig. 23: FY2070/71
Per HH community
Contribution
Types of
Infrastructure
FY 2070/71
g
4% 2%
Cumulative
1
Rural access
18,622.77
10,731.34
2
Community
building
13,304.20
12,270.71
3
Rural energy
13,862.89
15,495.90
4
Small irrigation
23,586.03
16,005.80
5
Water supply
and sanitation
23,651.07
17,545.39
6
Miscellaneous
Total
PAF g CO Total g DDC/VDC g Others
23,084.11
10,103.59
19,351.84
13,692.12
26%
68%
Fig. 24: Cumulative
Salient Features of PAF-supported Infrastructure
and Per Unit Cost
g
PAF g CO Total g DDC/VDC g Others
Infrastructure for Rural Access
During the reporting year, 4 bridges (RCC: 2, Suspension:
2, of 113 m length), 14 culverts (73 m length), 68 rural
roads (146 km length) and 4 trail roads (10 km length)
were completed. Cumulatively, 34 bridges (1,454 m
length), 140 culverts (592 m length), 280 rural roads
(509 km length) and 18 trail roads (39 km length) have
been completed.
Here, the per unit cost of bridge in recent fiscal year
is higher than that the cumulative figure because the
recently constructed bridges were shorter than the
earlier ones.
Buildings
Till now, PAF has supported construction of schools,
health posts, community building and agriculture-related
buildings (cellar store, market shed, milk/vegetable
collection centre). In FY2070/71, 57 school buildings
(rooms: 189) were constructed and maintained. Four
health posts (18 rooms), 35 agriculture-related buildings
(266 rooms) and 16 other types of community building
3% 1%
26%
70%
(29 rooms) were constructed, whereas, cumulatively,
the figures are 416 school buildings (1,719 rooms), 15
health posts (15 rooms). During the reporting year, 396
rooms, having 16,898 m2 plinth area, were constructed
and 2,635 rooms, having 95,460 m2 plinth area, were
constructed in cumulative terms. The unit cost of the
recently completed buildings is Rs.227,400/room and
Rs.6,277/m2 area and in cumulative, its value is 345,090/
room and 8,087/m2 plinth area in the reporting year.
Table 18: Investments by Different Agencies in Rural Access
PAF
CO Cash
CO Total
CO Kind
DDC/VDC
Total
Others
Cumulative
66.7
1.0
25.1
26.1
3.7
3.5
100
FY2070/71
66.3
1.8
24.1
25.9
3.5
4.3
100
Table 19: Salient Features and Per Unit Cost
SN
Rural access
Salient Features
Unit
FY2070/71
Per Unit Cost (PAF investment)
Cumulative
FY2070/71
Cumulative
1
Bridges
m
113
1,454
46,449.00
25,239.00
2
Culverts
m
73
592
142,271.00
103,244.00
3
Road and its maintenance
km
146
509
853,393.00
757,714.00
4
Trail road
km
10
39
294,668.00
224,721.00
Annual Report 2014
17
Table 20: Investments by Different Agencies in Community Building
PAF
CO Cash
CO Kind
CO Total
DDC/VDC
Others
Total
Cumulative
74.8
0.2
22.4
22.6
0.9
1.7
100
FY2070/71
77.3
0.2
19.7
19.9
1.3
1.6
100
Table 21: Salient Features and Per Unit Cost
SN
Building
Salient Features
Unit
1
Building
FY2070/71
Room
number and
plinth area
Per unit cost
Cumulative
396/room and
16,898 sq.m.
plinth area
FY2070/71
2,635 rooms and
95,460 sq.m.
plinth area
Cumulative
Rs.345,090/room
and Rs.8,087 per
sq.m.
Rs.227,400/room and
Rs.6,277 per sq.m.
Rural energy
Electric line extension and micro hydropower are
sub-projects under the rural energy category. In the
fiscal year, 10 units of electric line extension (24.73
km extension), 61 micro hydro sub-projects (1,123 kw)
were completed and, in cumulative terms, 57 units of
electric line extension (294.73 km extension), 254 micro
hydro sub-projects (4,796 kw) and 59 solar systems were
completed. Here, the cost per Kw of MHP is Rs.382,818 for
recently completed and Rs.318,850 in cumulative terms.
Small irrigation
PAF is providing different types of schemes such as
deep boring, artisan boring, treadle pump, drip, sprinkle,
water harvest tank, plastic pond, earthen pond, well, lift
and surface to community based on local topography,
available water and command area. In the fiscal year,
140 irrigation sub-projects (1,398 hectare [ha]) were
completed, which included construction of 68 surface
irrigation, one lift irrigation, 3 earthen pond projects.
This has helped to irrigate more than 6198 ha of land.
Water supply and sanitation
Gravity, lift, tubewell, dugwell, rainwater harvesting, waste
pit and toilets were constructed with PAF assistance.
During the reporting year, a total of 212 gravity water
supply schemes (1,587 taps/water points), 6 lift water
supply, 8 sub-projects of tubewell were completed.
In cumulative scenario, 1,125 gravity water supply
schemes (7,778 taps/water points), 25 lift water supply,
3 rainwater harvesting, 1,188 tubewell sub-projects,
46 dugwell sub-projects and 1,962 toilets (2,476 units)
sub-projects were completed.
Table 22: Investments by Different Agencies in Rural Energy (in percentage)
Types of infrastructure
PAF
CO Cash
CO Kind
CO
Total
DDC
VDC
Total
Others
Cumulative
36.7
4.9
17.5
22.4
9.9
31.0
100
FY2069/070
37.1
4.7
16.4
21.1
11.1
30.7
100
Table 23: Salient Feature of Investments by Different Agencies in Rural Energy
SN
Rural energy
Salient Features
Unit
1
Micro Hydro
FY2070/71
kw
Per unit cost
Cumulative
1,123
4,796
FY2070/71
Cumulative
382,818
318,850
Table 24: Investments by Different Agencies in Small Irrigation
Types of Infrastructure
PAF
CO Cash
CO Kind
CO Total
DDC/VDC
Others
Total
Cumulative
71.8%
.45%
22.4%
22.8%
0.8%
4.6%
100%
FY 2067/68
76.0%
0.2%
22.8%
23.0%
0.2%
0.8%
100%
18
Annual Report 2014
Table 25: Investments by Different Agencies in Water Supply and Sanitation (in percentage)
Types of Infrastructure
PAF
CO Cash
CO Kind
CO Total
DDC/VDC
Others
Total
Cumulative
72.0
0.2
24.7
24.9
0.9
2.2
100
FY2067/68
71.9
0.1
24.5
24.6
1.4
2.0
100
Infrastructure (under construction)
There are 836 infrastructures sub-projects under
construction as of July 2014 and most of them are
expected to be completed by the end of the next year.
Among them, water supply and sanitation sub-projects
are at the top position, whereas infrastructure under
Community contributions for projects under
construction
Community has committed to contributing Rs.366.53
million for under-construction infrastructures. Their
commitment is the highest for rural energy (Rs 98.78
million) and the least for Miscellaneous (Rs.1.00 million).
Table 26: Infrastructure (Under Construction)
SN
Benefited
Type of Infrastructures
No. of Sub-projects
Household
Population
1
Rural access
177
18,136
100,714
2
Building
110
9,604
56,269
3
Rural energy
70
10,685
63,511
4
Small irrigation
172
8,071
48,298
5
Water supply and sanitation
295
14,049
83,087
6
Miscellaneous
12
323
2,013
Total
836
60,868
353,892
the Miscellaneous category (Ghatta, river training)
sub-projects are minimum. The maximum number
of households will benefit from Rural access, which
is 18,136 (29.8%). It is followed by Water supply, from
which will benefit 14,049 households (23.08%).
With respect to the total cost, community’s commitment
for contribution is 20.79 per cent on average. This is the
highest for water supply and sanitation (25.27% of total
cost), followed by small irrigation (22.92%) and least for
Rural access (17.84%).
PAF has signed agreements amounting to Rs.1,030.63
million with communities to construct these
infrastructures. It will invest Rs.283.57 million in water
supply and sanitation-related schemes. This is the
highest amount among the under-construction subprojects. PAF’s second highest investment is in Rural
access-related schemes, where PAF has invested
Rs.262.79 million.
2.2.4 Capacity Development of COs
2.2.4.1 Enterprise Development Training for
Income Generation
Enterprise development is essential to generate income
of the rural people at individual level. Entrepreneurship
skill development of CO members is one of the major
objectives of PAF. Hence, CO members are imparted
Fig. 25: No. of Sub-projects
g
g
g
Rural access
Rural energy
Water supply and sanitation
g
g
g
Community building
Small irrigation
Miscellaneous
Fig. 26: Benefited Households
g
g
g
Rural access
Rural energy
Water Supply
g
g
g
Community building
Small irrigation
Miscellaneous
0%
2%
21%
30%
13%
23%
35%
8%
21%
16%
13%
18%
Annual Report 2014
19
Table 27: Types of Infrastructure
Contribution in Million (Rs)
SN
Type of Infrastructure
PAF
Community
Others
DDCVDC
1
Rural access
262.79
75.41
72.81
11.66
2
Community building
144.12
40.96
1.86
1.29
3
Rural energy
166.31
98.78
221.36
43.77
4
Small irrigation
169.34
51.92
4.39
0.84
5
Water supply and sanitation
283.57
98.46
5.38
2.24
6
Miscellaneous
4.5
1.00
0.06
0
1030.63
366.53
305.86
59.8
Total
Table 28: Community Contributions for Projects Under Construction
Cost Contribution (in percentage)
SN
Type of Infrastructures
PAF
Community
Others
DDCVDC
Total
1
Rural access
62.17
17.84
17.23
2.76
100
2
Building
76.57
21.76
0.99
0.69
100
3
Rural energy
31.37
18.63
41.75
8.26
100
4
Small irrigation
74.77
22.92
1.94
0.37
100
5
Water supply and sanitation
72.78
25.27
1.38
0.57
100
6
Miscellaneous
80.94
17.99
1.08
0.00
100
Total
58.46
20.79
17.35
3.39
100
the 'Start and Improve Your Business (SIYB)' and
'Micro-enterprise Creation and Development (MECD)'
training through POs. The training is conducted
before the demand-led proposal preparation of COs.
A total of 1,586 members of COs have been trained in
entrepreneurship skill development and marginalized
group business management. These training themes
help CO members to identify appropriate and
marketable micro-enterprises and income-generating
activities in the local context.
2.2.4.2 Institutional Development and
Institutional Model Development-related
Capacity Development Activities
The ultimate goal of PAF is the institutional development
of COs. PAF has been providing grants to COs to
launch various income-generating and infrastructurebuilding activities. Community Revolving funds are
created from the grant provided for income-generating
activities. Hence, institutional strengthening of COs is
imperative for sustainable management and utilization
of the community revolving fund. Therefore, apart from
income-generating training, PAF has been conducting
institutional development-related training like account,
revolving fund and savings and credit management,
leadership development and group management, public
audit, institutional model development (cooperative
education and creation) to the CO members concerned.
A total of 2,255 CO members were trained in
institutional development-related themes like account,
20
Annual Report 2014
revolving fund and savings and credit management,
leadership development and group management and
public audit.
2.2.4.3 Animal Husbandry, Agriculture-related
Capacity Development Activities
Apart from income-generating and institutional
development-related activities, PAF also imparts
awareness creation and their small IG-related training
and orientation to CO members. A total of 3,984 CO
members received training and orientation related to
animal husbandry.
2.2.5 Capacity Development of POs
Capacity development of COs is interlinked with
the capacity development of POs. Hence, capacity
development of POs is necessary to deliver capacity and
institutional development of COs. Hence, PAF has been
imparting institutional development-related Training
of Trainers (ToT), refresher training and orientation to
POs so that they can impart the same training themes
to COs through POs. They include social mobilization,
leadership development, group management, account,
revolving fund and savings and credit management,
social audit and institutional model development,
i.e. cooperative education, cooperative creation and
cooperative business plan preparation.
A total of 1,152 PO staff members were trained in
institutional development and institutional model
development-related themes, followed by 408 staff
members in enterprise development, i.e. Start and
Improve Your Business (SIYB) and Value Chain, 767
staff members in PAF implementation process, i.e.
revolving fund guidelines, IG, Infrastructure; PAF special
programme for marginalized communities, pocket area
development; nutritional guidelines and improved
agriculture technology; 95 staff members were trained
in participatory planning monitoring and evaluation
and project management and participatory rural
appraisal; 143 in proposal writing, success story and
news writing, group facilitation skills and organizational
development. Similarly, 15 events of coordination and
review meeting were organized with DDCs and lines
agencies in order to coordinate and strengthen the PAF
programme in the district.
Similarly, in order to integrate the safe migration
perspective in the PAF social mobilization process,
one-day training 'Linking Safer Migration to Social
Mobilization' was organized in July 2012. The training
was conducted in collaboration with Free the Slaves
(FTS), an INGO. Altogether 25 participants from
twelve districts, namely Jhapa, Bara, Sindhupalchowk,
Rasuwa, Kathmandu, Ramechhap, Bajura, Jajarkot,
Kailali, Bardiya, Kapilbastu and Pyuthan participated
in the training. The objectives of the training were to
strengthen the training in safer migration; enhance
conceptual understanding of trafficking and slavery and
the consequences of trafficking and unsafe migration/
forced migration; and develop an action plan to link
safer migration to the PAF social mobilization processes.
During the training, the participants got an opportunity
to learn and reflect on the concept of trafficking and
national and international policies on the issue.
2.2.6 Capacity Development of
PAF Secretariat
Capacity development is one of the major factors for
organizational development. Capacity development
of POs and COs is also linked to capacity development
of the PAF secretariat. PAF has internalized this from
the very beginning and has been organizing capacity
development initiatives for PAF staff. The following are
the capacity development activities conducted by for
capacity strengthening of the PAF secretariat.
(a) In-house Workshops and Meetings
In order to review and strengthen the PAF programme
in the districts, a two-day Programme Review Meeting
was organized on February 5–7, 2014 at the PAF
Secretariat. All Portfolio Managers participated and
presented the progress of the districts as well as share
the lessons learned and challenges they faced.
During the reporting year, PAF organized an orientation
programme to welcome and introduce and give
orientation on the PAF Programme for newly appointed
staff. This orientation has built the capacity of the newly
appointed staff to introduce and know the process and
working modalities of PAF. In addition, it organized
dozens of workshops and in-house meetings for PAF
staff members.
Annual Report 2014
21
(b) Participation in seminars and workshops
PAF staff members participated in different meetings
and workshops—both national and international.
PAF Executive Director, Mr Raj Babu Shrestha,
participated in the seventh meeting of the Business
Enterprise and Employment Support, held in Dhaka,
Bangladesh, on April 24-26, 2014.
Similarly, Mr Durga Gandhari and Mr Sandeep
Nath Upreti participated in the training 'Evaluating
the Impact of Development Programme: Turning
promises into evidence', organized by the World Bank
and BRAC, Bangladesh, on March 19-21, 2014. They
also participated in the next event 'The SAR Project
Economic Analysis for TT Workshop', organized by the
World Bank on May 19-21, 2014.
22
Annual Report 2014
Ms Kanchan Tamang, Mr Om Poudel and Mr Sandeep
Nath Upreti participated in a workshop on making
monitoring and evaluation more effective, held on
February 12 -14, 2014, organized by the World Bank.
They also participated in a workshop 'Monitoring and
Evaluation and Knowledge Management', organized in
Kathmandu by IFAD from May 1 to 13, 2014.
Mr Akhilesh Chandra Das and Mr Moti Prasad Sharma
participated in the National Cooperative Congress,
which was organized on March 26–27, 2014 in
Kathmandu.
Mr Moti Prasad Sharma and Ms Meena Nakarmi,
participated a two-day workshop on Indigenous
People, in March 2013.
3
CHAPTER
INFORMATION, MONITORING AND
GRIEVANCE HANDLING
3.1 Monitoring and Evaluation
organization has been encouraging all stakeholders to be
involved in the monitoring process of the project activities.
Monitoring and evaluation (M&E) is an inextricable
part of PAF’s mission, providing an analytical basis for
programmatic decisions, allowing PAF to learn from
its experience, and share the impact and lessons with
different stakeholders.
PAF's M&E Division undertakes or facilitates various
research and studies, surveys with other units of PAF,
enriching the organization’s overall programmes and
strategy.
Its monitoring data is developed on five different
databases, which support the process of working
with POs and COs and monitoring the sub-project
activities (Figure 1). These databases provide a rich
source of information on PAF activities and have been
increasingly analysed to improve planning and address
weaknesses in the project implementation process and
to identify areas of strength that can be scaled up.
PAF’s monitoring focuses on the progress, process,
compliance and the results of project activities. The
As community is at the driving seat of all PAF
programmes, monitoring by the community is
essential for the compliance and results of the
programme. Thus, the monitoring subcommittee of
each CO is responsible to monitor the activities carried
out by the CO concerned. Besides, the social mobilizers
assigned by the POs are responsible for facilitating the
monitoring subcommittee for effective monitoring
and also monitor the activities of COs themselves.
Besides, the programme coordinators, supervisors
and board members of the POs are responsible for
monitoring or tracking the progress and the compliance
made by the COs.
The Portfolio Managers (PMs) and the consultant
assigned by the PMs monitor the activities of the
POs as well as COs. Similarly, on periodic basis, the
representatives of the local bodies (DDCs, VDCs and
other line agencies) carry out monitoring visits in the
PAF working areas of the districts concerned.
Partner
Organization
Selection
Community
Organization
Selection and
registration
Partner
organization
database
Community
Organizations
databaseBeneficiary
assessment
Community:
Selection of
priority activities
Community
agreements
database
Community:
Implementation
of activities
Sub-project
Projects
database
Revolving fund
database
Annual Report 2014
23
The PAF central level also carries out monitoring
visits in the districts on periodic basis. Likewise, PAF
Board Members, representatives from line ministries
and representatives from the World Bank carry out
monitoring visits on periodic basis.
Furthermore, PAF has been reporting its progress
against the set indicators on regular basis. For details
refer to Annex 12.
3.2 Results of Monitoring
Data Analysis
3.2.1 Social Re-assessment/
Beneficiaries’ Assessment
A social re-assessment of 40,085 households of the
sample COs which are in three or more than three years
of maturity period was carried out during 2013/14.
The comparative analysis of the social re-assessment
data with the baseline social assessment shows that
household-level assets increased, school enrolment of
children increased, food sufficiency duration of individual
households improved, and construction and use of toilet
increased.
The household-level gross income (from all sources)
of the re-assessed 4,085 households increased by 68.5
per cent in real term. Similarly, the household income
of about 68 per cent of the total households has shown
an increase by 15 per cent or more.
One of the indicators that PAF uses to identify the
targeted population is the food sufficiency level.
Households are divided into four different groups under
this category: hard core poor (those with less than 3
months of food security either via own production or
via other dependable sources of income), medium
poor (those with 3 to 6 months of food security), poor
(those with 6 to 11 months of food security) and nonpoor (those with 12 or more months of food security).
The other is whether the household is from a Dalit or
Janajati community.
The results show that the percentage of households
with food insufficiency of 3 months or less dropped
from 63.9 per cent to 37.2 per cent, with a reduction of
58.3 percentage point, for the CO member households.
This effect is seen stronger for Janajati households.
The percentage of food insecure households among
Janajati households decreased from 56.7 per cent to
18.0 per cent, a reduction of 68.2 percentage point. For
Dalit households, food insecure households decreased
from 85.4 per cent to 35.7 per cent, with a reduction of
58.2 percentage point.
24
Annual Report 2014
3.2.2 Status of Revolving Fund
A revolving fund assessment was carried out during
2013/14, which shows that the community has been
managing their revolving fund satisfactorily. Revolving
funds have provided an opportunity to the poor to
access funds, otherwise inaccessible, through formal
financial institutions, to initiate income generation
activities. COs are managing and operating these funds
by themselves and are responsible for setting interest
rates and loan payment conditions.
The revolving fund data of 10,328 COs shows that the
fund provided to the COs by PAF has increased by 19.0
per cent, which includes the interest against the loan
taken by its members, community contribution and
funds collected from other sources. Similarly, among
the total CO members (N= 290,783), 93.0 per cent
have accessed the fund at least one time to initiate
income-generating activities. Out of the total members
accessing the fund from the revolving fund, 60 per cent
have used the fund two times or more. The assessment
also shows 87.5 per cent of the total fund has been
invested as loan to its members, and the rest of the
fund is in bank and cash in hand in COs itself.
The assessment also shows that the average rate of
interest on the loan is 9.9 per cent. However, the interest
rate is slightly higher in newer COs. The average rate of
repayment of the loan is 78.4 per cent.
3.3 CO Maturity Assessments
A CO Institutional Capacity Assessment was carried out
during the reporting period. The assessment assessed
the capacity of the COs in terms of various aspects of
institutional development and identified the strengths
and weaknesses of the COs and developed a strategy
for their graduation to enable them to operate in a
sustainable way.
The assessment was done among 12,870 COs against
30 indicators2 and graded into four groups by the sum
of indicator scores (each on a scale of 1–4, making the
maximum total score of 120). Around 12 per cent of
the COs were found fully mature and able to function
without additional capacity building or supervision
support; around 82 per cent of the COs required some
additional capacity building support in managing the
organization or needed further social mobilization
efforts. The remaining COs still needed substantial
handholding for some time.
2
Each of the following six assessment categories has five indicators: (i) social
situation; (ii) economic situation; (iii) capital and resource mobilization; (iv)
coordination, partnership and communication; and (v) good governance and
institutional development; and (vi) capacity building and sustainability.
3.4 Communications, Outreach
and Publications
n Extensive media coverage at the local and
national levels
PAF is giving high emphasis to communications as it is
critical to create demand from beneficiaries to ensure
transparency and foster partnership and learning
across stakeholders.
n Publications of PAF operating guidelines
The PAF communication strategy aims to disseminate
PAF approach, procedure and rules to the
stakeholders, develop the external and internal
communication capacity of PAF, and identify and
develop communication messages for PAF, as well as
disseminate best practices and success stories.
Some of the major activities that were initiated and
continued during the reporting year were:
n Publication of Newsletter 'Jeevika' in both
English and Nepali
n Dynamic web sites constructed and regularly
updated
n Publication of annual reports—both national
and district-based
n Success stories and case collection
n Different interaction meetings and workshops
at the local and national levels
n Orientations programmes and stakeholders
consultations at the local level
n Launching of E-Chautari
n PAF Journalism Award for excellent reporting
on poverty issues
Since PAF work has now increased its coverage
and depth, there is a growing need to generate
greater awareness based on the results. A proactive
communication and outreach strategy will be
highly important in this regard. PAF will work with all
stakeholders to keep them abreast of the important
developments and disseminate information at national
and international forums.
3.5 Grievance Handling in PAF
Since 2013, PAF has been developing a grievance
handling system to record and respond to complaints
on its practices, policies and procedures at the centre
as well as at the grass roots level.
A concept note of PAF grievance handling mechanism
was developed and a subcommittee of the board
members was also formed to oversee and supervise
the grievance handling system. PAF has developed
Annual Report 2014
25
direct e-mails to the Vice Chairperson, Executive
Director and the Programme Chief in its website. It
has already installed a suggestion box at its central
office. All complaints coming from direct e-mail to the
Vice Chairperson, Executive Director, website e-mail,
or telephone, or any other means are recorded and
registered in a complaints register, with the updated
status of the complaint and remedial actions taken.
26
Annual Report 2014
So far, complaints have been made regarding field-level
misuse of PAF fund, activities of PO, exclusion of hard
core poor and selection of POs in the districts, among
others. PAF Programme Division Chief directly oversees
all grievance-related activities.
4
CHAPTER
PARTNERSHIP AND COLLABORATION
PAF gives top priority to partnership and
collaboration
with
different
agencies
(governmental and nongovernmental) at both
central and district level. The different partnership
and collaboration efforts are discussed below.
the understanding, a series of meetings were held
between PAF and District Agriculture Development
Offices and District Livestock Development Offices.
4.1 Partnership with MoFALD
PAF and United Nations World Food Programme (WFP)
signed an MoU on August 30, 2010 for a strategic
alliance to alleviate poverty and food insecurity in the
Mid and Far-Western Hilly and Mountain regions.
The Ministry of Federal Affairs and Local Development
(MoFALD) and PAF, on October 8, 2010, signed an MoU
for a strategic alliance to alleviate poverty through
synergic efforts between the two institutions.
The MoU has helped to increase coordination and
linkages during project planning, implementation,
monitoring, reporting and review while implementing
targeted poverty alleviation and empowerment
initiatives at the local level. As part of the MoU, PAF is
closely involved in coordination with the District Social
Mobilization Committees (DSMCs) at DDCs for social
mobilization and programme monitoring. All subprojects of targeted communities are presented at VDC
Council and later endorsed by the DSMC and District
Council. Based on this agreement, all PAF programme
districts have been working closely with the DDCs
concerned.
During the reporting year, district review meetings were
conducted in all PAF programme districts. As part of the
MoU with the Ministry, COs are enlisted with the VDCs
concerned and CO’s programmes are endorsed by the
ward citizen forum concerned and acknowledged by
the VDC Council meeting.
4.2 Partnership with MoAD
The Ministry of Agriculture Development (MoAD)
and PAF signed an MoU on January 30, 2013 for a
strategic alliance to alleviate poverty through technical
backstopping on agriculture and livestock extension
services. As per the MoU, PAF is providing income
generation and infrastructure support grants to the
COs/groups for continuity of programme, while the
Ministry mobilizes its networks to facilitate them. After
4.3 Partnership with WFP
Following the MoU, some initiatives have been taken
to implement community infrastructure sub-projects,
in which WFP has provided vital food and nutrition
assistance equivalent to community contribution.
Some jointly commissioned projects include smallscale irrigation, water harvest tank, cellar store, cash
crop farming, micro hydro and rural agriculture road
and enhanced farming techniques and poultry
farming and other relevant training. A total of 23 small
infrastructure schemes were implemented in Achham,
Dailekh, Humla, Jumla and Mugu districts. Out of the
total, seven are small irrigation, eight micro hydro, four
drinking water schemes and one each is energy mill,
improved ghatta (mill), water harvest tank and cellar
store.
Table 29: List of Projects Implemented in
Partnership with WFP
District
Achham
Type of Scheme
No.
Micro hydro
4
Energy mill
1
Micro hydro
3
Irrigation
2
Jumla
Pipe irrigation
3
Mugu
Irrigation
2
Improved Ghatta
1
Water harvest tank
1
Cellar store
1
Micro hydro
1
Dailekh
Drinking water scheme
4
Humla
Annual Report 2014
27
4.4 Partnership with
Heifer and LFLP
Practical Action Nepal, Heifer International Nepal,
Forest, Leasehold Forestry and Livestock Programme
(LFLP) and PAF signed an MoU on July 29, 2011 to
establish synergies in poverty alleviation efforts at the
grass roots and ensure increased opportunities for the
poor and disadvantaged people.
Based on the MoU, capacity-building efforts were
made for poor and disadvantaged people by Heifer
International in Rautahat and Sindhuli districts and by
the LFLP in Sindhupalchowk district. Heifer International
has selected one VDC each in Rautahat and Sindhuli to
build the capacity of CO members in its Cornerstones.
PAF provided revolving funds to the COs, whereas
Heifer provided training and mobilization support. In
Sindhuli district, CO members were awarded the best
prize for excellent work under the support of Heifer.
4.5 Partnership with Helvetas
An MoU was concluded between PAF and HelvetasNepal on February 7, 2011 to work together so as to
enhance the livelihood of poor households. Based on
the MoU, activities such as riverbed farming in Bardiya,
Rautahat and Sarlahi districts and micro irrigation and
drinking water scheme in Kalikot and Dailekh districts
were carried out during the reporting year.
A total of 500 CO households in Bardiya, Rautahat
and Sarlahi districts are involved in riverbed farming.
Helvetas Nepal provides technical support to train local
resource persons and follow-up technical support in
the farming period.
Based on this MoU another understanding was also
signed with LILI/Helvetas and WARMP/Helvetas for
construction of micro irrigation and drinking water
schemes in the common programme districts. LILI/
Helvetas and WARMP/Helvetas will provide support in
technical as well as in community contribution part and
PAF would support the cost of external materials. During
the reporting period, four micro irrigation and two
drinking water schemes were implemented in Kalikot.
Another area of partnership with Helvetas is related
to the employment sector. As per the MoU, PAF CO
members can access the training programme from
the Helvetas Employment Fund (EF) programme that
enhances the technical capacity of CO members. After
graduation from training, CO members can start their
own enterprises utilizing the revolving fund at the
CO level or get employment with other employment
providers. Dozens of CO members of Kanchanpur,
Bardiya, Kapilbastu, Pyuthan have benefitted under this
partnership arrangement.
28
Annual Report 2014
Box: Community Challenge Fund (CCF) Project
The project is a pilot designed to investigate the
role of information and incentives in improving the
health of expectant and new mothers and children
in the age group of 0–2 years (target group for future
reference). The focus of the project is the first 1,000
days of a child’s life. The pilot will cover four districts
(Sarlahi, Sindhuli, Ramechhap and Rasuwa) that have
been selected using the criteria agreed to with the
Ministry of Local Development and based on access
to services (water and sanitation) and nutritional
status. The districts cut across the mountain, Hilly and
Tarai areas of the country. Also, the pilot will be run in
the first instance for 12-18 months.
4.6 Partnership with AEPC
Under an agreement with the Alternative Energy
Promotion Centre (AEPC), PAF and AEPC are working
together in 137 micro hydro sub-projects in 21 districts.
The following table shows the district-wise partnership
in micro hydro projects with the AEPC.
Table 30: List of Projects Implemented in
Partnership with AEPC
SN
Name of district
Number of schemes
1
Accham
20
2
Baitadi
11
3
Bajhang
13
4
Bajura
10
5
Baglung
1
6
Darchula
2
7
Doti
5
8
Dailekh
4
9
Dadeldhura
2
10
Dolpa
2
11
Sindhuli
6
12
Jumla
8
13
Humla
5
14
Kalikot
6
15
Mugu
1
6
Pyuthan
1
15
Dhading
2
16
Makawanpur
1
17
Ramechhap
7
18
Rasuwa
3
19
Udayapur
13
20
Khotang
5
21
Taplejung
7
22
Jajarkot
Total
2
137
CHAPTER
OUTCOMES AND RESULTS
This chapter discusses the outcomes of the some
of major studies relating to PAF results on the
ground.
design of the programme. The PAF Impact
Evaluation (IE) shows that the programme impact
on real per capita consumption growth was 31
per cent over a two-year PAF intervention period.
This is impressive in the context of the same
analysis, which indicates that, in the absence of
the PAF programme, the targeted households
would have recorded about negative 2 per cent
growth. Significant and positive PAF impacts are
also seen in terms of other welfare indicators
such as food sufficiency, child schooling, access
to services and women’s empowerment.
During the reporting year, a few outcome studies were
done, including detailed analysis of the report of the
impact evaluation study conducted by the Centre for
Economic Development and Administration, Tribhuvan
University.
An independent PAF impact evaluation conducted in
six sample and three control districts shows that the
programme impact on real per capita consumption
growth was 31 per cent over a two-year intervention
period. This is impressive in the context of the same
analysis, which indicates that, in the absence of the
PAF programme, the targeted households would have
recorded about negative 2 per cent growth.
The estimated net programme impact on per capita
consumption (in real terms adjusted for price inflation)
growth is 15 per cent for PAF IG participant households,
31 per cent for PAF money recipient households and
42 per cent for those beneficiaries who have received
money for at least six months. The net impact on
growth in per capita consumption is even higher for
Dalit and Janajatis and for the poorer segments of the
population, implying programme’s ability to distribute
growth towards the targeted groups.
The evaluation data shows a 10 percentage point decrease
in the incidence of food insufficiency and 6 percentage
point increase in school enrolment rate for children
aged 5–15 years. The programme effect is also seen in
access to services (agriculture centres, community forest
groups, farmers' groups) and women’s empowerment.
For child malnutrition (stunting, underweight) a higher
positive impact is seen for children in the age group of
1–2 years amongst PAF-supported households.
5.1 Monitoring and Impact
Evaluation Results
1.
In addition to the MIS, an independent impact
evaluation has also been integrated into the
5
2.
The IE has been a long-term partnership between
the PAF Secretariat, Tribhuvan University, which
carried out the surveys, and the WB task team,
which provided technical assistance during the
design phase and carried out the analysis. Data
for the PAF IE comes from two rounds of survey of
3,000 households from 200 villages. The baseline
was carried out in late 2007 and the follow-up of
the same households in early 2010. The survey
questionnaire is adapted from the Nepal Living
Standards Survey (NLSS) and includes detailed
information on consumption and income,
socioeconomic and demographic issues, including
education, health and nutrition, housing conditions
and physical assets, migration and remittances,
employment, social environment, community
relationship, voice and participation. For
comparability with the national household surveybased welfare measures, PAF survey includes a very
similar consumption module and follows the same
consumption aggregation method. The IE analysis
uses panel households (2,774 out of 3,000), half of
which are PAF beneficiaries (treatment) and the rest
non-beneficiary (control) households. Outcome
indicators on PAF beneficiary households and
carefully matched non-beneficiary households
are compared for the periods before and after the
initiation of the PAF programme. This method is
known as difference-in-difference combined with
propensity score matching. The estimated net
programme impact on per capita consumption
(in real terms adjusted for price inflation) growth
is 15 per cent for PAF IG participant households,
31 per cent for PAF money recipient households
Annual Report 2014
29
and 42 per cent for those beneficiaries who have
received money for at least six months. The net
impact on the growth in per capita consumption
is even higher for Dalits and Janajatis and for the
poorer segments of the population, implying the
programme’s ability to distribute growth towards
targeted groups.
3.
Both the GoN and the WB agreed that the
findings of the rigorous IE provide important
contribution to results-based decision-making
and an assurance to all stakeholders that the
PAF programme is a very sound investment in
poverty alleviation. These findings have been
discussed with high-level policy-makers from line
ministries, the National Planning Commission
(NPC), the Office of the Prime Minister and Council
of Ministers (OPMCM) and with the Development
Partners (DPs). It has been agreed that the
independent impact evaluation process would
continue on the same sample to observe longterm impact of income-generating programmes
as well as community infrastructure initiatives.
Welfare Effects
5.
IE results show a significant increase in real per
capita consumption of PAF households. Based on
a sample of households drawn from six of the 19
30
Annual Report 2014
PAF districts in Phase II, the results show that the
households who received PAF money for at least
6 months saw their real per capita consumption
increase by more than 42 per cent. The IE results
show an encouraging trend in PAF’s ability to reach
its targeted group as well. While the real per capita
consumption increase for Dalits and Janajatis was
30 per cent, the increase was about 16 per cent
for the three poorest quintiles of households, as
measured by the baseline survey of 2007.
5.
Impact on other welfare indicators is also
positive and significant. The data shows a 10
percentage point decrease in incidence of food
insufficiency and 6 percentage point increase in
school enrolment rate for children aged 5–15.
The programme effect is also seen in access
to services (agriculture centres, community
forest groups, farmers' groups) and women’s
empowerment. For child malnutrition (stunting,
underweight) a higher, positive impact is seen
for children in the age group of 1–2 years
amongst PAF-supported households. There are,
as yet, no significant differences evident between
treatment and control groups on indicators
associated with community/social capital (trust,
respect, relationships between different ethnic
groups, community disputes, etc.), although the
overall trend for both groups is positive.
Targeting
6. The impact results are consistent with the PAF’s
objective of targeting the poorest households
and support monitoring data results as well.
Of the many criteria that PAF uses to classify
the poor, one is the level of food sufficiency.
Households are separated into four different
groups under this category: hard core poor
(those with less than 3 months of food security
either via own production or other dependable
sources of income), medium poor (those with 3 to
6 months of food security), poor (those with 6 to
11 months of food security) and non-poor (those
with 12 or more months of food security). The
results show that the percentage of households
with food insufficiency of 3 months or less
dropped from 13.8 per cent in 2007 to about 5.5
per cent in 2010—a reduction of more than 60
per cent—for the PAF beneficiary households
(defined as those engaged in PAF-supported
income-generating activities). The reduction was
only about 6.8 per cent for non-beneficiaries.
Similarly, the percentage of households with
food insufficiency of 6 months or less decreased
from 40 per cent in 2007 to about 33 per cent
in 2010—a reduction of about 17.5 per cent—
for PAF beneficiary households. There was no
reduction for non-beneficiaries during this
period, and, in fact, there was an increase in food
insufficiency of these households by about 9 per
cent.
Access to and Use of Services
7. With the second phase of PAF II still ongoing,
poor households with access to improved
infrastructure facilities number more than 49,000.
The IE results show that the school enrolment
rate for children from households engaged in
PAF-supported income-generating activities
increased by more than 10.5 percentage points.
The enrolment rate was even higher for children
from Dalit or Janajati households. In contrast, the
number was only about 4.4 percentage points
for the control households (or those not involved
in such activities). While there was no obvious
difference between the PAF beneficiaries and the
Fig. 27: Reduction in Food Insufficiency
70
60.4
60
50
40
30
17.2
20
10
g
6.8
g
Control
Treatment
0
-10
-20
3 months or less
9.1
6 months or less
non-beneficiaries in the use of health services/
facilities, the beneficiary households were found
to be making more use of agricultural centres,
community forest services and farmers' groups.
The increased use of such services supports the
monitoring data findings that PAF beneficiaries
are investing in agriculture-related opportunities
and reaching out to service providers to improve
and develop these investments.
5.2 Performance Audit Report (2012)
The Office of the Auditor General has conducted a
comprehensive Performance Audit in five programme
districts (Sindhuli, Rautahat, Dadeldhura, Pyuthan and
Siraha) covering 125 COs and 300 CO members in 2012.
The study has shown that the PAF programme has
covered mainly poor communities and the programme
was selected and implemented in a participatory way.
Participatory decision-making process at the community
level has increased the feeling of community ownership
and transparency of work. Also, the CO members have
stated that they have raised their income and savings
after the implementation of the PAF programme. The
study shows that the community-based revolving fund
was used in income generation-related activities and
the loan was provided to individual CO members only
for their benefit through collective decisions.
Annual Report 2014
31
32
Annual Report 2014
CHAPTER
FINANCIAL MANAGEMENT
6.1 Financial Planning and
Management
PAF Financial Management System consists of
three pillars, namely Financial Planning, Financial
Management and Financial Reporting. Financial
management is directed by the Applicable Accounting
Standards, which is accepted by both the GoN and
the World Bank. It also fulfills the requirements of POs.
Financial Management System of PAF is governed by its
Financial Management Manual.
PAF accounting system is based on cash basis. It
maintains all books of accounts relating to receipts and
expenditures. PAF maintains its books of account on
computerized accounting software, Fin App. III.
For effective implementation of PAF activities and
monitoring of documents, regular auditing is done by
internal and external auditors. M/S Kuber and Company
was assigned as internal auditor for FY2069/70 and
FY2070/71. Similarly, external audit is carried out by the
Office of the Auditor General.
6
For effective planning and monitoring of funds, PAF has
signed separate MoUs with Rastriya Banijya Bank (RBB)
and Nepal Bank Limited (NBL). PAF has opened main
accounts and, along with main accounts, separate
bank accounts are opened for PAF operating expenses
and for programme expenses. Also, RBB and NBL have
opened an operating bank account for each CO in the
districts concerned.
PAF prepares Implementation Progress Report (IPR) on
a trimester basis for review by internal management
and reporting to the World Bank. The report comprises
different sections, including brief description of
project progress. The IPR is the comprehensive report
that includes various reporting formats, which cover
financial, physical progress, contract expenditure and
procurement information. The report 2A discloses the
information on sources and uses of funds. Likewise, 2B
is for reconciliation statement of designated account
and the projection for the forthcoming trimester.
Review of physical progress section provides all
information on the achievement against plan with
Fig.: PAF Fund Flow Modality
PAF Level
PAF
Main A/C
(Centre)
PAF
PAF
Programme A/C
Operating A/C
CO Level
Community
contribution
(District)
Community
Partner Organization
(PO) provides technical
assistance to Community
Organization (CO)
Operating A/C
Figure 4: PAF Funds Flow Modality
Annual Report 2014
33
Implementation through COs and POs (COs: 76.62%
and POs: 17.29%), 2.19 per cent in Monitoring, Training,
Studies and Workshops, 0.45 per cent in capital
investment for PAF, 0.01 per cent in identity card
distribution cost and 3.43 per cent in PAF operation/
recurrent cost.
regard to major physical indicators set by PAF.
Contract expenditure report has two parts: goods
and consultants. Furthermore, goods and consultancy
are categorized on the basis of prior or post-review
threshold. Similarly, procurement section has two parts:
goods and consultancy. Furthermore, procurement
of consultants has been categorized as individual
consultant and firm consultant. Whether procurement
is prior or post-review depends upon the threshold for
procurement of goods and consultants.
Out of the total PAF expenditure up to FY2070/71 (2013/14),
90.09 per cent is from International Development Agency
(IDA/the World Bank) grant, 1.54 per cent is from the
International Fund for Agriculture Development (IFAD)
grant, 4.87 per cent from the Trust Fund and the remaining
3.50 per cent from the GoN sources.
6.2 Budget Expenditure
The total expenditure in FY060/61 (2003/04), FY2061/62
(2004/05), FY2062/63 (2005/06), FY2063/64 (2006/07),
FY2064/65 (2007/08), FY2065/66 (2008/09), FY2066/67
(2009/10), FY2067/68 (2010/11), FY2068/69 (2011/12),
FY2069/70 (2012/13) and FY2070/71 were Rs.5.78
million, Rs.247.32 million, Rs.493.50 million, Rs.1,210.30
million, NRs1,875.48 million, 1,647.20 million, 2,481.5
million, 2,601.28 million, 2998.69 million, 2,343.03
million and 2322.02 million respectively.
6.3 Financial Progress Status
In FY2013/14 (2070/71), total PAF expenditure has
remained at Rs.2,322,022,043.45 (75.87% of the allocated
budget) as compared to FY2012/13 (2069/70), where
total expenditure has remained at Rs.2,343,029,166.11
which was 76.29 per cent of the allocated budget.
Out of the total PAF expenditure of Rs.18,224.90
million till FY2070/71 (2013/14), 93.92 per cent was
in Programme Implementation through COs and
POs (COs: 76.62% and POs: 17.29%), 2.19 per cent in
Monitoring, Training, Studies and Workshops, 0.45 per
Total expenditure of PAF till FY2070/71 is Rs.18,225 million.
Out of the total PAF expenditure of Rs.18,225 million till
FY2070/71 (2013/14), 93.92 per cent was in Programme
Fig. 28: Ratio of Cumulative
Expenditure up to FY2070/71
Monitoring,
Training/Workshop
& Programme
Supervision Cost,
2.19%
Capital Cost,
0.45%
Fig. 29: Summary of Expenditure of FY2070/71
Monitoring,
Training/Workshop
& Programme
Supervision Cost,
2.77%
Recurrent Cost,
3.43%
ID Cards Related
Cost 0.01%
PAF Capital Cost,
0.43%
PAF Recurrent
Cost, 3.82%
Programme
Implementation
through COs & POs,
92.98%
Programme
Implementation
through CO & PO,
93.92% (CO-76.62%,
PO-17.29%)
Table: Expenditure during the Reporting Fiscal Year
Details
FY2070/71 Expenditure
Total community organizations
Partner organizations
COs/POs
Monitoring, training/workshop and programme
supervision cost
Capital cost
Recurrent cost
Total (A+B+C+D+E)
34
Annual Report 2014
%
1,677,254,520.34
72.24
481,618,586.52
20.74
2,158,873,106.86
92.98
64,395,482.93
2.77
9,988,657.85
0.43
88,764,795.81
3.82
2,322,022,043.45
100.00
6.5 Disbursement to POs
cent in capital investment for PAF, 0.01 per cent in
identity card distribution cost and 3.43 per cent in PAF
operation/recurrent cost.
During the reporting year, altogether 370 POs worked
with PAF to facilitate and provide necessary technical
support to the COs in the PAF districts, for which PAF
disbursed Rs.482 million. On the basis of the expenditure
on PO, the Hilly Region has the highest share with 40.15
per cent, followed by the mountain and terai regions
with 24.54 per cent and 32.14 per cent respectively. The
IWP districts NDM stands with the share of 2.95 per cent
and 0.23 per cent respectively of the total expenditure.
Out of the PAF total expenditure of Rs.2,322,022,043.45
for the reporting year, 92.97 per cent was for programme
implementation through COs and POs, 2.77 per cent
was from monitoring, training and workshops, 0.43 per
cent in capital investment for PAF and 3.82 per cent in
PAF operation/recurrent cost.
In FY2013/14 (070/071), the annual budget was
estimated to be Rs.3,060,658,640.00. Out of which, 3.85
per cent was provisioned under recurrent cost and the
remaining 96.15 per cent was under the programme
and capital cost.
Similarly, during FY2069/70, the total fund disbursement
to POs has remained at Rs.514 million. Similar to the
reporting year, the share of POs from the Hilly Region
has the highest with 40.52 per cent. The Terai region
has the second highest share of expenditures, with
31.45 per cent, followed by the Mountain Region, with
24.62 per cent. The IWP districts stand with the share of
3.41 of the total disbursement to POs.
6.4 Disbursement to COs
Fund disbursement has to be made against contracts
(sub-project agreements) with COs in two or more
trenches, while controlling mechanism based on
agreed upon milestones needs to be maintained.
6.6 Additional Funding:
Current status and future
Based on the community demand, several activities
related to income generation and small infrastructure
sub-projects are being implemented. In FY2013/14
(2070/71), PAF disbursed NRs1,672 million directly to
the community account. The region-wise distribution
of disbursement shows that the Hilly Region has the
highest share, followed by the Terai and Mountain
regions.
The PAF Project II is initially funded by an IDA Grant
of US$100 million and IFAD Grant of US$4 million for
four years till January 2012. IDA disbursement to the
PAF II project till date is 99.46 per cent (as advance),
i.e. equivalent to about US$99.46 million. IFAD
disbursement to PAF till date is US$3.81 million. IDA
further provided additional financing of US$75 million
(out of which US$65 million is from IDA grant and
Table 31: Disbursement Expenditure to COs (in Million)
District
CO Registered w/
PAF (No.)
Agreement
With CO
No.
Total Amount Released (Rs.)
Amount (Rs.)
Hill Total
821
1,106
1,407
716,726,202
758,822,235.54
Mountain
Total
321
373
538
366,834,683
386,521,326.37
Terai Total
Total
506
598
745
384,025,963
526,715,543.43
1,648
2,077
2,690
1,467,586,848
1,672,059,105.34
Table 32: Disbursement Expenditure to POs
S.N.
Districts
Disbursed in
FY2070/71
Disbursed in
FY2069/70
%
%
A
Mountain
118,170,168.07
24.54
126,539,255.77
24.62
B
Hill
193,366,393.79
40.15
208,282,493.31
40.52
C
Terai
154,803,678.95
32.14
161,628,941.06
31.45
D
Innovative
14,185,661.71
2.95
17,521,713.09
3.41
E
NDM
1,092,684.00
0.23
-
-
Grand Total
481,618,586.52
100.00
513,972,403.23
100
Annual Report 2014
35
US$10 million grant is from FPCR Trust fund) for PAF II
project and the project period has been extended till
December 2014. Disbursement of additional financing
by IDA to PAF till date is US$63.34 million (as advance).
Trust Fund disbursement till date is US$10 million (as
advance). Recently, IDA has provided second additional
financing of US$80 million and JSDF provided US$2.65
million for PAF II Project and the project period has
been extended till December 2017. No advance has
36
Annual Report 2014
been received from the second additional financing
from IDA and JSDF disbursement to PAF till date is
US$0.79 million.
IDA grant for PAF Project I of US$40 million (Initial US$15
million and additional US$25 million) has been utilized
by January 2009.
CHAPTER
LESSONS AND FUTURE DIRECTIONS
7.1Lessons
PAF’s current initiative to build the community’s
capacity to manage revolving fund and operate the
sub-projects and raise the awareness of the community
through functional literacy will be further intensified.
Social mobilization will be given high priority for this.
Considerable input will be given to establish COs’
linkages with basic health, education and youth training.
Provisions for innovation and special programmes will
be renewed and emphasis will be given to replicate
and scale up successful innovations. PAF will continue
its efforts to explore alternatives to livestock and
agriculture-based activities for the landless poor.
As PAF is maturing, technical assistance for activities
under high demand needs to be provided regularly
and attention should be paid to the quality of service
providers. This is an important factor in ensuring that
efforts made by communities are sustained and serve to
bring them permanently out of poverty. A new system
of PO performance evaluation with involvement of COs
has been going on for the past two years. This process
will be further improved in the days to come.
Efforts will be given to increase collaboration with
the private sector, governmental agencies, local
governments and donor agencies at all levels to
implement the programme and sub-projects in the
communities to bring marked impact in considerably
less time by complementing and supplementing
each other’s effort. MoUs were signed with different
organizations to facilitate collaboration. PAF’s efforts
will be to materialize them in implementation to
benefit the poor while exploring further collaborative
efforts in the future.
Increased governmental and civil society ownership in the
programme will be achieved by regularizing productive
workshops, reviews and coordination meetings with
stakeholders at central, regional and district levels. In
addition, monitoring and supervision visits by central
level and district governmental agencies, DDCs, VDCs, civil
societies, political representatives and journalists in the PAF
project sites will be organized regularly. Besides, central-
7
level monitoring from PMO, NPC, Ministry of Cooperatives
and Poverty Alleviation and other line Ministries will be
carried out.
Community institutionalization is taking place with the
formation of CO federations, multipurpose or single
purpose cooperatives and VDC-wise informal networks
of COs as per communities’ felt need. PAF will accord top
priority to formalizing (and legalizing) these institutional
development processes while ensuring that poor
communities gain maximum benefits from these
institutions. For sustaining income-generating activities
initiated by communities, important initiatives will be
taken to establish linkages with financial institutions,
market as well availability of insurance safetynet.
Special focus will be put on marginalized castes
while implementing interventions in the district.
Simultaneously, pocket area interventions will be
synchronized in the potential pockets.
PAF is working with its exit strategy focusing on its
strategic thrust to enable the community to go on a
sustained path to get out of poverty within a stipulated
five or six years of time. In this line, PAF will work on
the pocket area development approach by building
on the potential strengths of the area. At the same
time, special support will be provided to poor and
marginalized communities to secure their livelihood.
Moving ahead, PAF will pay increased attention to
research and development, monitoring processes
and outcomes, improving financial management and
capacity building of COs, POs, local bodies and PAF.
7.2Challenges
In view of the wide variety of activities undertaken
within the sub-project, the challenges faced in ensuring
sustainability of sub-projects include the linkage with
market for sustaining income-generating activities
as well as the availability of insurance safetynet,
particularly for livestock. PAF is also to explore an
alternative to livestock-based activities for the landless
poor as the huge demands are mainly livestock-related.
Another important issue before PAF is to build the
community capacity to manage revolving fund and
Annual Report 2014
37
operate sub-projects and raise the awareness of the
community through functional literacy. Also, there
is a need to adopt different approaches for poorest
districts and districts with greater access and livelihood
opportunities and special support to vulnerable poor,
backward ethnic groups such as Mushahar, Dom,
Chamar, Raute, among others.
7.3 The Future Strategy
Based on the lessons learned, PAF is now working on
the expansion of its programme to new VDCs and
38
Annual Report 2014
districts, and important initiatives are being taken
for the institutionalization of COs as cooperative or
other forms of institution as per their decision and
link with financial institutions and markets where the
programme is already in implementation. Also, PAF is
laying special emphasis on the capacity building of
COs, POs and PAF while coordination and collaboration
are being accorded high priority. This year onwards
PAF is strengthening its grievance handling process
with stakeholders’ views on the effective Performance
Management System of COs, POs and the PAF
Secretariat.
FINANCIAL STATEMENTS
Annual Report 2014
39
40
Annual Report 2014
Annual Report 2014
41
42
Annual Report 2014
Annual Report 2014
43
44
Annual Report 2014
Annual Report 2014
45
46
Annual Report 2014
Annual Report 2014
47
48
Annual Report 2014
Annual Report 2014
49
50
Annual Report 2014
Annexes
Annex 1: Current Board Members (as of January 2015)
Chairperson
Rt Hon’ble Prime Minister Sushil Koirala
Vice Chairperson
Mr Yuba Raj Pandey
Member
Mr Sharada Prasad Trital
Member
Mr Rishiraj Lumsali
Member
Ms Mahin Limbu
Member
Ms Chand Tara Kumari
Member
Mr Man Bahadur Nepali
Member
Ms Kamala Rai
Member
Mr Basanta Bahadur Telar
Member
Mr Akhileshwar Lal Das
Member
Ms Durga Neupane Bhattarai
Member
Dr Kal Bahadur Rokaya
Annex 2: CO Registration, Agreement for Sub-project and Disbursement Status (FY2070/71–2013/14)
District
Initial 6 Districts
Darchula
Agreement
CO Registered
w/PAF (No.)
With CO
No.
Total Amount
Released (Rs.)
Amount (Rs.)
9
22
17,144,709
30,904,987.00
Kapilbastu
59
53
60
31,033,746
34,912,732.26
Mugu
14
19
34
22,920,396
19,614,838.80
Pyuthan
13
9
29
30,206,675
30,727,959.00
Ramechhap
21
26
45
33,413,753
37,849,640.20
Siraha
67
70
91
44,741,864
40,283,088.00
174
186
281
179,461,143
194,293,245.26
22
36
66
37,372,535
54,176,358.79
Baitadi
5
73
88
33,446,339
37,028,092.00
Bajhang
37
35
52
46,742,953
40,966,035.00
Bajura
37
21
25
10,396,620
18,512,145.38
Dadeldhura
55
54
66
29,223,541
23,921,867.00
Dailekh
51
51
73
57,179,789
58,167,744.37
Dolpa
25
32,693,044
31,552,166.31
Sub Total
19 Additional Districts
Achham
72
79
89
43,683,330
37,596,550.00
Humla
Doti
31
41,207,921
29,671,327.00
Jajarkot
42
109
129
53,850,519
64,379,051.22
14
34,126,316
32,963,812.42
Jumla
Annual Report 2014
51
CO Registered
w/PAF (No.)
District
Agreement
With CO
No.
Total Amount
Released (Rs.)
Amount (Rs.)
Kalikot
15
27
41
40,668,565
59,558,203.68
Mahottari
21
30
32
19,726,112
14,674,060.45
Rasuwa
1
12
23
20,105,162
15,496,636.00
Rautahat
27
29
17,378,009
119,646,206.92
Rolpa
45
54
67
36,943,570
40,402,685.70
Rukum
47
73
82
39,906,691
46,902,833.14
Sarlahi
67
54
70
50,049,176
54,513,614.90
Sindhuli
81
99
119
59,129,919
55,962,163.59
19 Dist. Tot.
598
834
1,121
703,830,112
836,091,553.87
25 Dist. Total
772
1,020
1,402
883,291,255
1,030,384,799.13
Bara
56
86
102
39,284,671
43,912,614.09
Bardiya
28
57
86
46,206,330
50,275,945.83
Dhading
64
65
80
33,229,819
32,267,711.80
Dhanusha
78
66
87
46,468,950
56,714,032.91
Khotang
34
42
48
29,507,150
30,845,797.90
Okhaldhunga
55
76
90
42,829,347
41,674,625.45
Panchthar
43
49
63
36,647,185
44,285,989.38
15 B1 District
Parsa
51
69
79
34,379,045
40,615,441.87
Salyan
75
92
118
44,188,677
43,734,857.00
Saptari
68
75
90
45,187,589
56,015,511.50
108
128
149
60,757,528
52,316,751.97
Solukhumb
39
48
48
16,784,476
21,186,842.01
Taplejung
70
74
74
23,286,992
33,777,580.80
Terhathum
64
67
90
33,084,623
31,312,456.00
Udayapur
16
39
47
29,984,653
29,855,982.00
Sindhupalchowk
19 Dist. Tot.
40 Dist. Total
849
1,033
1,251
561,827,036
608,792,140.51
1,621
2,053
2,653
1,445,118,291
1,639,176,939.64
Innovative Programme Districts
Arghakhanchi
3,000,004.00
Baglung
Chitawan
11
11
14
4,347,397
Dhading
Kanchanpur
5
5,223,073
10,926,819.70 591,253.00 4,225,475.00 Kavrepalanchowk
Lalitpur
16
13
18
12,898,087
Morang
Nawalparasi
Surkhet
27
24
37
22,468,557
32,882,165.70
1,648
2,077
2,690
1,467,586,848
1,672,059,105.34 Makwanpur
Innovative Tot.
Total =
Note: From FY2066/67 funds are transferred directly to Operating Account of the Community
52
Annual Report 2014
14,138,614.00 Annex 3: CO Registration, Agreement for Sub-project and Disbursement Status (Cumulative)
District
CO Registered
w/PAF (No.)
Total Amount Released
(Rs.)
Agreement
With CO
No.
Amount (Rs.)
Initial 6 Districts
Darchula
885
878
1319
661,642,852
657,317,631.55 1099
1068
1154
670,034,280
644,117,428.28 309
278
440
193,997,185
180,922,668.50 Pyuthan
1164
1119
1340
680,730,252
671,704916.81 Ramechhap
1288
1256
1479
638,160,783
625,704,538.69 Siraha
1728
1697
1779
760,021,061
724,712,387.32 Sub Total
6,473
6,296
7,511
3,604,586,413
3,504,479,571.15
Achham
814
767
897
607,204,656
548,644,301.89
Baitadi
957
741
895
447,385,631
425,441,805.62
Bajhang
587
528
688
396,861,645
354,421,967.14
Bajura
509
486
612
367,059,453
361,614,185.64
Dadeldhura
550
546
625
315,462,895
300,915,667.99
Dailekh
526
526
608
381,507,173
364,769,269.18
Dolpa
208
208
249
179,551,560
171,960,190.97
Doti
674
673
745
339,714,456
318,718,940.47
Humla
329
329
492
286,291,664
272,080,670.44
Jajarkot
505
445
510
356,979,482
337,660,853.55
Jumla
485
483
577
498,066,598
475,324,427.81
Kalikot
731
722
847
498,287,456
471,365,104.35
Mahottari
734
721
764
384,362,291
351,890,993.20
Rasuwa
308
302
336
178,058,492
171,931,856.34
Rautahat
1796
1658
1759
1,125,818,564
1,107,160,919.67
Rolpa
336
332
383
171,783,118
165,420,859.11
Rukum
444
395
429
233,216,023
213,852,287.15
Sarlahi
1185
1162
1263
675,648,485
660,977,846.81
Sindhuli
1069
1036
1274
683,131,280
656,870,904.43
19 Dist. Tot.
12,747
12,060
13,953
8,126,390,924
7,731,023,051.76
25 Dist. Total
19,220
18,356
21,464
11,730,977,337
11,235,502,622.91
Bara
426
410
437
159,598,658
150,053,522.81
Bardiya
439
408
525
180,618,629
168,331,028.03
Dhading
319
316
379
144,900,296
121,052,143.80
Dhanusha
434
419
453
288,861,436
259,839,432.62
Khotang
290
221
237
140,470,749
131,156,786.16
Okhaldhunga
357
338
366
127,867,594
118,793,539.75
Panchthar
316
297
317
113,214,573
103,294,270.58
Parsa
348
343
381
210,003,254
199,096,744.56
Salyan
410
397
477
157,924,590
146,027,731.00
Saptari
381
351
392
224,176,370
186,726,013.50
Sindhupalchowk
464
460
524
229,237,974
207,236,943.40
Kapilbastu
Mugu
19 Additional Districts
15 B1 District
Annual Report 2014
53
CO Registered
w/PAF (No.)
District
Total Amount Released
(Rs.)
Agreement
With CO
No.
Amount (Rs.)
Solukhumb
222
214
223
92,084,611
91,979,047.88
Taplejung
459
432
471
265,140,886
250,781,404.40
Terhathum
276
267
345
121,734,945
114,764,365.00
Udayapur
222
165
190
123,791,178
115,884,742.34
15 Dist. Tot.
5,363
5,038
5,717
2,579,625,744
2,365,017,715.83
40 Dist. Total
24,583
23,394
27,181
14,310,603,081
13,600,520,338.74
1
1
4,000,006
4,000,006.00
Innovative Window Programme Districts
Arghakhanchi
1
Baglung
1
1
1
722,165
722,165.00 Chitawan
74
74
109
27,408,071
26,251,827.00 Dhading
81
81
98
40,283,561
48,550,215.00 142
138
204
81,797,131
81,023086.70 Kavrepalanchowk
5
2
3
5,900,438
5,900,438.00
Lalitpur
2
2
2
6,784,220
6,934,220.00
163
145
165
70,955,470
64,601,494.02
85
84
84
40,886,557
39,269,154.47
Nawalparasi
1
1
1
1,551,248
1,551,248.00
Surkhet
1
1
1
3,015,982
2,020,708.00
556
530
669
283,304,848
280,824,562.19
25,139
23,924
27,850
14,593,907,929
13,881,344,900.93
Kanchanpur
Makwanpur
Morang
Innovative Tot.
Total =
Note: (1) Additionally, agreements were signed with 37 NDM sub-projects through POs that amounts NRs49,189,847 (NRs14,758,416.00 NDM2005, Rs.34,431,431 NDM2008). Out of
this 47,662,976.95 is disbursed till date.
54
Annual Report 2014
Annex 4: POs, COs and Coverage (FY2069/70 – 2012/13)
Sub Proj. No.
District
No. of
Total VDCs +
Working Municipality
POs
in District
PO
Committed
No. of VDCs
CO
Working
VDCs
IG
Beneficiary HHs
CO
Total
Member Beneficiary
HHs
HHs
Infra.
Initial 6 Districts
Darchula
9
41
41
41
10
12
15
78
78
78
28
14
6
24
24
24
3
10
49
49
49
10
7
9
55
55
55
35
26
Siraha
17
108
108
102
118
8
2,703
2,610
6 Dist. Tot
66
355
355
349
204
67
3,755
5,171
Achham
16
75
68
66
74
966
2,404
Baitadi
14
63
63
63
51
11
741
1,653
Bajhang
10
47
47
47
28
19
903
1,103
Bajura
4
27
27
27
17
19
Dadeldhura
8
21
21
21
50
Dailekh
5
56
33
31
24
Dolpa
3
23
23
23
Doti
5
51
51
36
77
19
Humla
5
27
27
27
5
19
Jajarkot
7
30
26
26
6
7
Jumla
7
30
30
30
Kapilbastu
Mugu
Pyuthan
Ramechhap
322
787
685
60
265
323
1,171
19 Additional Districts
Kalikot
14
680
882
655
1,040
7
199
2,727
6
30
30
30
38
20
77
46
46
44
9
Rasuwa
6
18
18
16
3
1
Rautahat
9
97
97
77
88
Rolpa
5
51
22
22
Rukum
10
43
34
Sarlahi
16
100
Sindhuli
10
54
1,835
427
255
15
12
Mahottari
431
1,281
331
377
1,128
221
1,258
1
1,808
2,194
46
16
1,179
1,509
33
6
1
89
157
88
87
33
16
931
1,026
54
50
42
21
973
1,150
19 Dist. Tot
158
920
805
758
632
215
13,160
19,353
25 Dist. Tot
224
1,275
1,160
1,107
836
282
16,915
24,524
13
99
46
45
77
10
1,646
1,517
Bardiya
5
32
18
18
78
31
992
1,879
Dhading
8
50
20
21
56
11
1,391
913
Dhanusha
14
102
51
51
58
12
1,489
1,403
Khotang
7
76
38
32
29
6
608
640
Okhaldhunga
7
56
28
28
54
14
307
830
Panchthar
7
41
21
21
83
5
1,118
1,238
Parsa
11
83
48
48
41
20
1,413
1,482
Salyan
6
47
27
27
46
23
1,005
1,137
Saptari
15
115
49
47
42
2
471
1,242
Sindhupalchowk
11
79
34
33
67
13
1,557
1,440
3
34
14
14
32
879
513
15 Districts (B1)
Bara
Solukhumbu
Annual Report 2014
55
Sub Proj. No.
No. of
Total VDCs +
Working Municipality
POs
in District
District
PO
Committed
No. of VDCs
CO
Working
VDCs
IG
Beneficiary HHs
Infra.
CO
Total
Member Beneficiary
HHs
HHs
Taplejung
9
50
41
40
1
Terhathum
4
32
16
16
28
19
159
700
Udayapur
10
45
23
23
25
4
781
677
15 Dist. Tot
130
941
474
464
716
171
13,816
15,611
40 District Total
354
2,216
1,634
1,571
1,552
453
30,731
40,135
145
144
Innovative Window Programme Districts
Baglung
-
60
-
1
Chitawan
1
38
8
8
Dhading
1
50
6
Kanchanpur
1
20
8
Kathmandu
1
58
2
Kavrepalanchowk
1
90
2
2
Lalitpur
2
42
4
2
Makwanpur
2
44
18
18
8
65
8
2
33
651
23
6
566
394
Morang
3
65
5
3
Nawalparasi
3
74
5
1
Surkhet
-
48
-
1
15
589
58
44
33
39
711
1,254
369
2,805
1,692
1,615
1,585
492
31,442
41,389
Innovative Total
Sub Total
56
Annual Report 2014
Annex 5: POs, COs and Coverage (cumulative to date)
PO
CO
Committed
Working
No. of
VDCs
VDCs
Sub Proj. No.
Beneficiary HHs
No. of
Working
POs
Total VDC +
Municipality
in District
9
41
41
41
863
442
17,886
29,488
15
78
78
78
981
484
27,768
37,968
6
24
24
24
292
130
7,546
12,782
10
49
49
49
1,036
284
31,718
35,306
9
55
55
55
1,212
256
29,575
33,075
Siraha
17
108
108
102
1,610
296
38,462
39,549
6 Dist. Tot
66
355
355
349
5,994
1,892
152,955
188,168
Achham
16
75
68
66
757
74
24,034
26,313
Baitadi
14
63
63
63
660
147
21,106
24,437
Bajhang
10
47
47
47
415
221
12,745
22,495
Bajura
4
27
27
27
469
118
13,711
17,392
Dadeldhura
8
21
21
21
489
70
14,085
14,028
Dailekh
5
56
33
31
475
60
16,626
17,794
Dolpa
3
23
23
23
208
16
6,178
6,537
Doti
5
51
51
36
594
62
19,523
18,568
Humla
5
27
27
27
347
114
7,860
9,789
Jajarkot
7
30
26
26
327
54
11,997
17,493
Jumla
7
30
30
30
492
134
17,249
18,412
District
IG
Infra
CO
Total
Member Beneficiary
HHs
HHs
Initial 6 Districts
Darchula
Kapilbastu
Mugu
Pyuthan
Ramechhap
19 Additional Districts
Kalikot
6
30
30
30
711
95
19,548
21,419
12
77
46
46
706
26
17,773
17,775
Rasuwa
6
18
18
16
293
21
8,685
9,420
Rautahat
9
97
97
77
1,627
266
44,520
52,608
Rolpa
5
51
22
22
277
39
7,731
7,100
Rukum
10
43
34
33
302
45
9,780
10,004
Sarlahi
16
100
88
87
1,108
85
31,833
32,912
Sindhuli
10
54
54
50
939
216
28,576
31,927
19 Dist. Tot
158
920
805
758
11,196
1,863
333,560
376,423
25 Dist. Tot
224
1,275
1,160
1,107
17,190
3,755
486,515
564,591
13
99
46
45
324
11
9,099
6,260
Bardiya
5
32
18
18
365
74
8,685
6,761
Dhading
8
50
20
21
246
53
6,278
4,093
Dhanusha
14
102
51
51
354
12
9,528
8,537
Khotang
7
76
38
32
157
32
4,996
4,355
Okhaldhunga
7
56
28
28
262
14
6,362
3,449
Panchthar
7
41
21
21
248
6
6,551
3,409
Parsa
11
83
48
48
238
64
8,131
7,664
Salyan
6
47
27
27
293
66
8,271
5,524
Saptari
15
115
49
47
274
28
7,891
7,851
Sindhupalchowk
11
79
34
33
332
43
8,769
6,199
3
34
14
14
164
11
4,332
2,853
Annual Report 2014
57
Mahottari
15 Districts (B1)
Bara
Solukhumbu
PO
CO
Committed
Working
No. of
VDCs
VDCs
Sub Proj. No.
Beneficiary HHs
No. of
Working
POs
Total VDC +
Municipality
in District
Taplejung
9
50
41
40
359
38
7,440
6,329
Terhathum
4
32
16
16
194
61
5,276
3,337
Udayapur
10
45
23
23
108
35
3,468
3,120
15 Dist. Tot
130
941
474
464
3,918
548
105,077
79,741
40 District Total
354
2,216
1,634
1,571
21,108
4,303
591,592
644,332
1
13
142
68
33
1,582
2,340
81
17
2,394
2,987
8
140
59
3,255
4,364
1
3
49
163
2
416
516
District
IG
Infra
CO
Total
Member Beneficiary
HHs
HHs
Innovative Window Programme Districts
Baglung
-
60
-
1
Chitawan
1
38
8
8
Dhading
1
50
6
Kanchanpur
1
20
8
Kathmandu
1
58
2
Kavrepalanchowk
1
90
2
2
Lalitpur
2
42
4
2
Makwanpur
2
44
18
18
102
45
3,972
3,735
Morang
3
65
5
3
84
45
3,316
3,212
Nawalparasi
3
74
5
1
1
11
705
Surkhet
-
48
-
1
1
9
655
15
589
58
44
476
207
15,017
18,819
369
2,805
1,692
1,615 21,584
4,510
606,609
663,151
Innovative Total
Sub Total
Note: 22 POs in addition to above were dropped due to poor performance and inability to work.
Additional programme through NDM 2005 and 2008
Innovative Window Programme Districts
NDM-2005
12
NDM-2008
NDM Total
Total =
58
25
25
10
25
52
52
17
8
5,228
37
0
77
77
27
10
0
14,227
406
2,805
1,769
1,692
21,611
4,526
606,609
677,378
Annual Report 2014
2
8,999
Annual Report 2014
59
103
71%
16
15
14
146
100%
Saptari
Sarlahi
Siraha
Total
14
15
7
6
11
5
18
6
18
Kapilbastu
1
Rautahat
8
Kanchanpur
4
7
13
Dhanusha
1
20
4
Chitawan
6
Mahottari
9
Bardiya
15
PAF Coverage
VDC
Parsa
16
Total VDC
Bara
District
Terai Border VDC
Annex 6: PAF in Terai Border VDCs
1,168
149
124
36
166
67
93
217
4
31
6
143
132
CO Regist
ration Nos
1,167
150
132
37
175
68
87
227
4
34
8
125
120
CO Agree
ment Nos
28,684
3,360
3,155
937
4,757
1,885
1,803
5,571
85
824
175
2,826
3,306
CO Member HH
100%
620,534,582
63,914,518
82,866,011
24,413,907
107,018,667
41,989,293
38,468,088
148,843,711
1,226,300
23,794,210
2,498,897
39,223,537
46,277,443
Total PAF
Agreement
Amount (Rs.)
1,054
146
116
32
166
53
85
190
4
31
6
113
112
IG No.
77%
478,399,112
57,675,077
61,079,997
18,329,655
100,537,332
25,605,700
35,280,838
83,688,048
1,226,300
21,152,495
1,746,497
30,957,132
41,120,041
IG Amount
180
5
16
5
10
15
2
102
3
2
12
8
INFRA. No.
23%
142,135,470
6,239,441
21,786,014
6,084,252
6,481,335
16,383,593
3,187,250
65,155,664
-
2,641,715
752,400
8,266,405
5,157,402
INFRA.
Amount
60
Annual Report 2014
7
6
6
27
Jumla
Kalikot
Mugu
Total
24
30
30
27
23
100%
134
24
30
30
27
23
PAF Coverage
VDC
463,940,281
457,618,891
171,076,789
1,485,545,714
Jumla
Kalikot
Mugu
Total
100%
245,083,743
Humla
147,826,009
Total PAF Agreement Amount (Rs.)
100%
134
Total
VDC
Dolpa
District
5
Humla
3
No. of
PO
Dolpa
District
Karnali VDC
Annex 7: PAF in Karnali Region
292
711
492
347
208
2,050
IG No.
2,033
295
716
485
329
208
CO Registration
Nos
100%
55,372
8,259
18,490
15,856
6,951
5,816
Total HH
71%
1,061,073,756
86,373,822
361,124,653
353,365,003
145,808,484
114,401,794
IG Agreement Amount (Rs.)
1,974
259
695
483
329
208
CO Agreement
Nos
Infra. No.
25,363
4,212
10,503
5,454
2,885
2,309
Poor HH
489
130
95
134
114
16
29%
424,471,958
84,702,967
96,494,238
110,575,278
99,275,259
33,424,215
1,485,545,714
171,076,789
457,618,891
463,940,281
245,083,743
147,826,009
Agreement Amount (Rs.)
Infrastructure Agreement Amount (Rs.)
105%
58,381
7,546
19,548
17,249
7,860
6,178
CO Member
Beneficiary HH
Karnali Households (HH)
Annex 8: Community Institutional Development
List of CO Federations in Districts
S.N.
1
District
No. of CO
Federation
Specific Objectives/Activities
Accham
18
Five federations were formed for Pasu Bima Programme, 2 for ICT (Information and
communication technologies) at Bayalpata, 2 for construction of micro hydro subprojects, 5 for school buildings and 4 for solar school systems at various VDCs.
Bajhang
1
Seven COs from Hemantawada and Luyata VDC were federated to run a Seti Saipal
V-SAT centre at Chainpur to promote capacity building, entrepreneurs’ skill and
knowledge at local level.
13 federations were formed for the following activities:
2
Bajura
13
9 federations for School building construction
2 federations for water supply project
2 federations for Micro Hydro project
16 federations were formed for the following activities:
Dadeldhura
16
9 federations for School building construction in 7 VDCs i.e. Jogbudha, Shirsha,
Shirsha, Bhadrapur, Alital, Bhageshwor, Koteli and Manileka.
5 Federations for Drinking Water Supply Scheme in 5 VDCs i.e. Ghankhet, Bhadrapur,
Mastamandu and Nvadurga.
2 Federations for suspended bridge projects in 2 VDCs i.e. Ajaimeru and Navadurga.
2
Darchula
14
11 CO federations were formed to implement micro hydro sub-project and three CO
federations to implement electric line extension schemes at various VDCs.
n federations were formed made for the following activities:
n 4 federations for school building construction in four VDCs, named Pokhari,
Ganjari, Gairagaun, Basudevi
n 3 federations for drinking water supply scheme in three VDCs, namely
Bhumirajmandau, Daud and Toleni
3
Doti
10
n 2 federations for micro hydro projects in two VDCs, namely Daud and Toleni
n 1 federation for constructing a health post building in Ranagaun VDC
n 29 COs were formed for networking in 29 VDCs for practising higher-level
organization
n Established a cooperative in Toleni VDC for running and maintaining a microhydro projects involving three COs
4
Kalikot
2
Two CO federations were formed to implement a micro hydro sub-project at Phoi
mahadev VDC and a pico hydro sub-project at Chilkhaya VDC for rural electrification.
5
Kapilvastu
1
357 buffalo raising farmers of 5 VDCs namely Ganeshpur, Biddhyanagar, Bhagamanpur,
Sirshihawa and Ramnagar were federated and formed Shivam Dugdha Utpadak CO
for collecting milk and operating chilling centre and cattle insurance scheme for
members.
6
Mugu
3
Two federated COs were formed for constructing and operating micro hydro scheme
for rural electrification and one for micro irrigation.
41 CO federations has been formed for implementation of different infrastructure
sub-projects like link road, drinking water, irrigation, micro hydro, school building in
various VDCs.
7
Pyuthan
44
Two CO federations were formed to operate community livestock Insurance
programme in Tusara and Bangesal VDC.
One CO federation has been formed for the establishment of Vegetable Collection
Centre at Lung VDC.
Annual Report 2014
61
S.N.
District
No. of CO
Federation
Specific Objectives/Activities
8
Rautahat
9
9 CO federations were formed in 9 VDCs for livestock management and insurance
policy
9
Sindhuli
12
To implement infrastructure schemes like rural road, irrigation, drinking water,
mechanized bridge etc.
One federated CO for operating a chilling centre at Bishnupurkalti VDC and another
one to run breeding centre at Dhodhana and Bhadaiya VDC
10
Siraha
9
Five CO federations were formed to construct culverts in various VDCs
Two CO federations were formed in Mukshar VDC to construct to construct
Agriculture roads
11
Rukum
5
4 Water Users group and 1 school users group
12
Dailekh
9
One federation for Drinking Water Supply Project and 8 federations for School Building
Project
13
Ramechhap
9
For Micro-Hydro, Irrigation and Community Building projects
List of Cooperatives formed through COs' Initiatives in Districts
S.N.
1
District
Accham
No of
Cooperatives
35
Specific Objectives/Activities
To manage all COs within the VDC.
Six cooperatives were established in 6 VDCs to provide savings and credit
services to CO members
2
Darchula
44
Three cooperatives established to provide electricity extension and
distribution service by leasing agreement with NEA.
3
Kapilvastu
19
A multipurpose cooperative has been established to run agro vet service and
milk collection and marketing centre
Total 19 Cooperatives has been established till date
4
Mugu
1
Rara Bahuudesiya cooperative has been established with the joint efforts of 11
COs of three VDCs namely Pina, Karkiwada and Shreenagar to provide agro-vet
services to its members, to establish hatchery and make available chicks in
district for its members To run dairy at district headquarter collecting milk from
its members.
5
Pyuthan
2
Two cooperatives were established at Arkha and Rajbara VDC to manage
revolving fund and savings and credit fund, provide micro finance services to
its members and for institutional development and sustainability of CO efforts.
6
Rautahat
2
A cooperative has been formed in Bishanpurwar Manpur VDC to establish
and operate milk chilling centre for marketing milk products produced by the
members.
A cooperative has been established at Santapur Dostiya VDC to provide
savings and credit service for agricultural and livestock management
7
Siraha
1
Three COs in Muskar VDC are in process to register cooperative to run savings
and credit and provide technical services to its member
8
Chitwan
1
Eight different COs in Khaireni VDC have teamed up to form a multipurpose
cooperative. 90 per cent of the cooperatives members are women. They are
carrying cooperative farming in lease-land, marketing of vegetable products
and savings and credits, among others.
9
Makwanpur
1
One Cooperative (Basamadi Agriculture Chepang Cooperative Org.) has been
formed with collaborative efforts of 3 COs at Basamadi VDC.
62
Annual Report 2014
Annex 9: Status of Ongoing IWP Sub-projects
S.No.
Name of PO
Sub-project Theme
1
Multi -dimensional Agriculture for Dev. MADE Nepal,
Chitwan
Vegetable Farming on Lease Land for Landless
2
Nepal National Social Welfare Association (NNSWA),
Kanchanpur
Creating and enabling environment to the Dalit
Community--”Mukta Kamayia”
3
Manohari Development Institute Nepal (MDI-Nepal),
Makawanpur
Area Development in 11 VDCs: Integrating livelihood
improvement of tribal communities (Chepang and
Tamang) through agro forestry, plastic water harvesting
construction and link road construction
4
Women, Children And Environment Dev. Centre,
Makawanpur
Bankariya and Praja/Chepang improvement by livestock,
agriculture, education and other income-generating
programme support by locally available resources
5
Multi Purpose Development Management Services,
Nep, Morang
IG activities for poverty reduction--Livestock
development, vegetable farming, etc.
6
Women Professional Agriculture Group, Morang
IG Programme for poverty reduction--Making women
starting business on agriculture trough Organic Farming
Annual Report 2014
63
64
Annual Report 2014
212
1
1
2
14
1
1
2
1
81
2
Account Mgmt
Training
Agriculture Farming
Animal husbandry
Apple Farming
Training
Basic Cooperative
Basic furniture
Bee Training
Biopesticide
preparation training
Boring Operator
Building Electrician
Capacity building
Training
Carpentry
Cash crop production
Climate change and
adaption planning
Co graduation
assessment
CO Management
Community Livestock
Cooperative
Management
DDC Coordination
Meeting
Dhaka Weaving
2
3
4
5
6
7
8
9
10
11
12
13
14
15
16
17
18
19
20
21
2
3
1
4
2
1
1
105
2
1
No. of events
CO graduation
orientation
Activities
1
SN
3
0
30
1208
20
0
32
2
6
20
85
40
6
8
14
70
5
15
484
14
1852
Male
Annex 10: Details on Capacity Development of COs
14
0
1872
2
14
24
12
0
0
133
30
19
17
6
0
4
7
1826
22
3639
35
Female
4
2
0
674
2
0
10
0
0
7
14
0
8
0
2
0
0
0
338
2
1154
Dalit
3
12
4
1639
0
12
12
6
6
0
11
62
5
0
0
70
8
3
1386
24
2407
Janajati
31
0
26
786
20
2
34
8
0
13
193
8
12
25
18
0
1
19
552
10
1691
Other
38 Dolpa
District
Parsa, Okhaldhunga, Bara, Solukhumbu,
Udaypur, Kapilbastu,Bardiya
Bara, Dadeldhura, Humla, Sindhuli, Solukhumbu,
Rukum, Siraha, Taplejung
14 Solukhumbu
30 Sarlahi
3099
22 Baitadi
14 Udayapur
56 Saptari, Terthum
14 Terhthum
6 Khotang
20 Bajang
218 Darchula
70 Solukhumbu
25 Parsa
25 Bajang
20 Baitadi
70 Solukhumbu
9 Solukhumbu
22 Rolpa
2276
36 Solukhumbu
Achham, Baitadi, Dadeldhura, Dolpa, Kalikot,
Khotang, Mahottary, Okhaldhunga, Parsa,
5372
Sarlahi, Terhathum, Udayapur, Doti,Khotang,
Dhanusa, Rukum
Total
Annual Report 2014
65
1
1
13
2
1
10
29
10
ENA Training
Fabric painting
Family
Fine art and Painting
Fruit Farming
Furniture making
Ginger Farming
Goat Raising Training
Gothemal sudhar
Green House
Management
Group Management
Health and Sanitation
Training
House wiring training
Infrastructure
maintenance training
Institutional
Development
Integrated capacity
building
Leadership Training
Livestock Farming
Livestock Insurance
Livestock & Agriculture
26
27
28
29
30
31
32
33
34
35
36
37
38
40
41
42
43
44
45
46
LRP
1
Effective
Communication &
Presentation
25
47
2
DWS and Sanitation
24
6
58
8
50
77
13
1
1
1
2
1
2
6
1
Driving
2
No. of events
23
Activities
Domestic Violence
SN
22
Male
66
537
60
113
401
80
266
94
1
49
37
8
16
138
18
13
11
20
1
0
84
19
20
3
0
54
859
193
1274
1096
604
271
239
0
99
328
15
14
163
13
0
24
6
12
44
22
2
10
0
37
Female
Dalit
20
198
19
826
409
222
72
70
0
32
68
0
0
31
0
5
0
0
0
17
20
0
2
2
25
0
5
42
833
172
155
268
94
284
179
0
10
201
0
18
0
29
0
35
26
13
2
24
4
18
Janajati
2
8
0
0
62
17
10
1
7
58
365
59
401
820
349
181
84
1
106
96
23
12
276
Other
21 Pyuthan
30 Solukhumbu
3 Dailekh
37 Bara
Parsa
Parsa
District
Dolpa, Mahottari, Rolpa, Rukum, Sarlahi,
Kapilbastu, Khotang, Achham, Doti
120 Bardiya, Parsa, Dailekh
1396 Khotang, Terathum
250 Dolpa, Udaypur,
1204 Dailekh, Dhanusa, Udyapur, Bardiya
1497
665 Dhanusa
537 Parsa, Khotang
333 Parsa, Khotang, Bajang
1 Bajang
148 Baitadi, Khotang
365 Bardiya, Dailekh
23 Bajang
30 Udayapur
307 Bajan, Dadeldhura
31 Udayapur
13 Dailekh
35 Udayapur
26 Solukhumbu
106 Sarlahi
Total
66
Annual Report 2014
5
2
2
3
1
6
60
10
3
1
1
1
3
447
13
Micro enterprise
development
Mobile repairing
Monitoring &
Evaluation orientation
Muda making Training
Network Management
Nutrition and Health
Organic fertilizer
Orientation for Local
resource person and
social Mobilization
Orientation VDC Level
Pasupalan Training
Pocket area
development
Poultry
Proposal writing
Pre Construction
Training
Pree Cuntrution on
Peltric set sub project
Public Audit Training
Refreshment Training
on CO graduation
Review Meeting
RF management
training
Saving credit
Mobilization
49
50
51
52
53
54
55
56
57
58
59
60
61
62
63
64
65
66
67
68
3
18
88
4
1
3
No. of events
Masson
Activities
48
SN
30
5
4
26
44
118
1
625
73
97
5
14
170
2
4
2
6
26
68
101
3358
Male
628
6106
0
27
9
21
30
126
24
602
99
65
27
29
758
96
13
12
24
111
12
Female
0
2
4
13
6
50
4
164
47
7
2
3
113
30
3
0
10
29
7
231
1045
Dalit
121
5542
4
4
0
35
68
136
15
742
121
135
4
40
78
31
10
6
6
27
38
Janajati
37
0
8
14
71
35
358
2167
26
26
9
0
0
58
66
261
10
20
26
1
737
Other
District
98 Kapilbastu
13 Udayapur
14 Terhthum
30 Dailekh
93 Parsa, Kapilbastu
80 Bajang, Solukhumbu
710 Khotang, Dhanusa
Bara, Rasuwa, Sarlahi, Sindhupalchowk, Udyapur,
Khotang, Taplejung, Achham, Kapilbastu,
9444
Bardiya, Dadeldhura, Dolpa, Mahottari,
Okhaldhunga
30 Kalikot, Sarlahi
32 Darchula
13 Baitadi
48 Udayapur
74 Udayapur
244 Khotang
85 Parsa
1167 Siraha, Kapilbastu, Achham, Sindhuli
178 Udaypur, Bardiya
162 Rasuwa
32 Darchula
44 Khotang
928 Bara, Rukum
Total
Annual Report 2014
67
1
60
1
68
1
1
Sitake Mushroom
Farming
SIYB
Smokeless improved
rocket stove
construction training
Social Mobilization LRP
SRI training
Tailoring
Vegetable Farming
Vegetable Pocket Area
Development process
orientation
Winter season hot bed
nursery preparation
training
70
71
72
73
74
75
76
77
78
3
1
10
12
Sewing Cutting
69
No. of events
Activities
SN
Male
5
5
107
2
9
12
2
518
7
14
11
13
525
79
7
81
1
1069
3
65
Female
Dalit
0
0
176
41
0
32
0
139
0
21
0
0
77
13
8
27
0
953
10
29
Janajati
0
7
16
18
379
27
8
34
3
494
Other
10 Udayapur
24 Udaypur, Kapilbastu, Khotang, Parsa
District
16 Bajang
18 Bajang
632 Kapilbastu, Bara, Parsa, Khotang, Udaypur
81 Bajang, Dailekh
16 Khotang
93 Bara
3 Bajang
1586 Bara, Parsa, Rolpa, Rukum, Terhthum, Khotang
Total
68
Annual Report 2014
ToT on Revolving Fund
Management
Training in Account management
and Social Mobilization
ToT on Cooperative Account
Management
Refresher Training and Orientation
on Revolving Fund Management
Refresher Training in Social
Mobilization and Revolving Fund
Management
Training in Social Mobilization and
Pocket Area Identification
Training and Orientation on
Cooperative Formation and
Management
Orientation on Cooperative
Business Plan preparation
Training in Social Audit
Orientation and Reorientation
on PAF Implementation Process
(Infrastructure and IG) and Role and
Responsibilities of PAF Staff
1.4.
1.5.
1.6.
1.7.
1.8.
1.9.
1.10.
1.11.
2.
ToT on Account and Revolving Fund
Management
ToT and Orientation on Social
Mobilization and Leadership
Development
1.3.
1.2.
1.1.
Institutional Development and
Institutional Model Development
Related ToTs, Training, Refresher
Training and Orientation
34
1
2
10
2
2
4
1
2
2
15
11
51
126
7
122
9
21
8
7
7
7
40
228
489
9
11
168
32
61
111
27
14
18
260
156
863
278
1
3
67
8
16
19
3
17
1
127
88
348
151
1
0
24
6
13
13
0
10
1
59
30
157
248
1
2
79
1
10
62
5
14
4
141
80
393
23
0
0
0
0
1
0
0
0
0
0
0
1
345
8
10
132
33
53
55
25
7
14
187
134
660
Remarks
Mahottari, Sarlahi, Kapilbastu,
Salyan, Darchula, Baitadi
767
10 Rolpa
14 Darchula,
235
40 Dadeldhura
77 Mahottari
130 Siraha, Mugu
30 Darchula
31 Bardiya, Dadeldhura
19 Darchula, Mugu
Solokhumbu, Taplejung,
Terthathum, Sindhupalchowk,
387 Saptari, Dhanusha, Kapilbastu,
Darchula, Mugu, Baitadi, Doti,
Accham
Saptari, Dhanusha Taplejung,
244 Sindhupalchowk, Bardiya, Salyan,
Jumla,Darchula, Dailekh, Jajarkot
1211
Annex 11: Capacity Development Status of Pos
S.N.
No. of
No. of POs
Gender and Ethnicity-wise No. of Participants
PO Level Capacity Building
Events
Participating
Activities
Male Female Dalit Janajati Muslim Others Total
Annual Report 2014
69
Orientation o PAF Revolving
Fund Mgmt. Guidelines and
Infrastructures
Implementation Guidelines
Orientation on PAF Special
Programme for Marginalized
Communities
Training, Orientation and Workshop
on Pocket Area Development
Orientation on Nutritional
Guidelines Preparation for COs and
Improved Agriculture Technology
Entrepreneurship Skill and
Enterprise Development Related
ToT and Training
ToT and Orientation on SIYB and
Enterprise Development
Training in Value Chain
Training in Resource identification
and Value Chain
2.3
2.4.
2.5.
2.6.
3.
3.1.
3.2.
3.3.
Participatory Project Planning,
Monitoring and Evaluation and
Participatory Rural Appraisal
Training and Orientation on
Participatory Rural Appraisal (PRA)
and Advocacy
5
5.1.
Exposure Visit
Orientation on PAF Infrastructures
Implementation Process
2.2.
4.
Orientation and Reorientation on
PAF Implementation Process and
Roles and Responsibilities of PAF
Staff
PO Level Capacity Building
Activities
2.1.
S.N.
2
7
12
3
1
18
22
3
7
1
1
4
18
6
26
54
8
8
21
37
5
47
0
8
3
63
23
145
90
50
16
227
293
29
66
6
20
32
336
3
21
69
22
1
92
115
41
115
2
14
15
91
3
28
19
11
1
12
9
59
1
6
9
67
6
39
65
0
0
0
7
63
2
21
20
135
0
0
2
0
0
0
0
1
0
0
0
22
17
109
73
61
16
77
54
58
5
7
18
203
Terahthum, Sindhupalchowk,
Rolpa, Jajarkot
Terhathum, Dhanusha, Darchula,
Jajarkot
26 Dailekh, Bajura
166
Saptari, Okhaldhunga,
159 Sindhupalchowk, Bardiya,
Dadeldhura, Darchula, Mugu
72 Kalikot
17 Dadeldhura
319
408
70 Bhajang, Bajura, Mugu
Saptari, Okhaldhunga, Rolpa,
Bardiya, Darchula
8 Darchula
181
Remarks
Siraha, Sindhupalchowk,
Kapilbastu, Rolpa, Doti
34 Kalikot
47
427
No. of
No. of POs
Gender and Ethnicity-wise No. of Participants
Events Participating Male Female Dalit Janajati Muslim Others Total
70
Annual Report 2014
10.
9.
8.
2
Regional level programme review
and technology transfer training
(Jeevatu)
Coordination and Review Meeting
with DDCs and Line Agencies
Orientation on LRPs Media (2 Days)
2
12
1
3
Training in IPM Management
6.
2
Refresher Training for LRPs
Training in Group facilitation Skill
Development
5.4.
1
5
Training in Success Stories and
News Writing
5.3.
5
1
9
5
1
40
4
60
6
9
1
8
114
123
20
9
398
71
60
119
61
26
7
126
20
179
1
121
16
151
8
0
38
16
16
1
37
13
67
0
18
3
56
11
19
22
13
7
2
22
5
36
0
113
1
80
1
11
29
10
22
39
21
82
0
33
0
0
0
1
1
1
0
0
0
0
0
0
21
413
67
29
105
53
13
6
102
7
128
1
91
Sindhupalchowk, Pyuthan, Rukum,
Darchula
25 Bhajang, Bajura
Terahthum, Okhaldhunga, Saptari,
549 Bardiya, Doti, Bhajang, Kalikot
Dadeldhura
79 Kapilbastu
60 Sarlahi
157
77 Bhajang
42 Siraha, Mugu
8 Rukum
163 Sindhupalchowk, Sarlahi
33 Bhajang
246
Remarks
Terahthum, Okhaldhunga, Siraha,
Bara, Pyuthan
1 Dadeldhura
139
No. of
No. of POs
Gender and Ethnicity-wise No. of Participants
Events Participating Male Female Dalit Janajati Muslim Others Total
Training Safe Migration
Training in Proposal, Case Study and
Report Writing
5.2.
7.
Training in Organization
Development
5.1.
Training in Proposal, Report, Success
Stories, Case Studies and News
Writing, Group Facilitation Skill and
Organizational Development
Training in Planning and Project
Management
5.3.
5.
Training in Participatory Planning,
Monitoring and Evaluation
PO Level Capacity Building
Activities
5.2.
S.N.
Annex 12: PAF Results Matrix
NEPAL: POVERTY ALLEVIATION FUND
PAF II PROJECT
RESULTS FRAMEWORK
PDO indicators
July 15, 2014
Indicator
Number of households benefitting
from increased access to community
infrastructure
PAF II
Value: 178,873 HHs
Cumulative
Remarks
Value: 264,224 HHs
The number is beneficiaries of completed
infrastructures only.
Number of households
includes CO and non
CO members.
Percentage of beneficiary households Value: 68.3%
have increased their incomes by at
The value is based on the social re-assessment data
least 15% against base year (2007), by collected during 2013/14.
the EOP
Percentage of key positions in Project Value: 60%
community organization that come
from targeted households
Value: 65%
Number of CO members
*(households)
Value: 484,782
Value: 675,762
Number of non CO members
*(households)
Value: 28,269
Value: 51,733
Percentage of CO members that are
female
Value:78.4%
Value: 75.4%
Target groups: Dalit,
Janjati, Madhesi,
Muslims, and women.
Non CO members
are the beneficiaries
of infrastructure
subprojects.
Intermediate Results Indicators
Indicator
July 15, 2014
PAF II
Cumulative
Remarks
Comp. A: Small Scale Community infrastructure Number of infrastructure subprojects that are completed with
target community participation,
according to agreed design and
quality standards
Value: 2,932
Value: 4,625
This indicator is based
on final financial
disbursement
Percentage infrastructure subprojects Value: 50%
operating with functional O&M
system
The value is based on the technical audit report (of the
completed INFRA subprojects) 2011/12. The collection
of updated data on O&M status is in progress.
Comp. B: Income Generating Activities (IGA) Percentage of IGA community
organization members who belong
to targeted groups.
Value: 57%
Percentage of CO members (from a
sample survey) with IGA investment
Economic Rate of Return (ERR) of at
least 10%
Value: N/A
Value: 60%
ToR and cost estimate is completed and hiring of an
expert is in process.
Target groups: Dalit,
Janjati, Madhesi,
Muslims, and women.
The project will require
third-party assessment
to evaluate economic
benefits of beneficiaries
in a sample basis.
Annual Report 2014
71
Percentage increase in the number
Value: 47.2%
of CO members accessing funds from
the revolving fund more than one
Based on the analysis of RF status of FY 2012/13.
time for IGAs.
It is required that CO
members can only have
one loan at a time.
Percentage of CO members with
improved levels of food availability
Value: 62.5%
Based on the Social Re-assessment of sample COs
during 2011/12. Collection of new data of social reassessment of sample COs is in progress.
Comp. C: Product Development, Market Linkages and Pilots Number of higher level institutions
formed
1 Cooperative has been registered in district
cooperative office in Dhading.
Percentage of higher level
institutions with market linkages,
access to services (such as financial
services) and/or leveraging local
bodies’ funds/services
Activity based pocket area development guideline has
been finalized to support higher level institutions for
production, market linkages etc.
Number of COs in urban/ peri-urban
settings with investment plans
developed
Guideline for PAF investment in urban/peri-urban area
has been finalized.
Comp. D: Capacity Building and Institutional Development
Percentage of DDCs/VDCs
participating in monitoring PAF
activities.
Value: 100%
Total number of visits done: 250
Percentage of VDCs/ COs Network
with at least one Local Resource
Person.
Value: 58.2%
The data is based on the LRPs with different discipline
atleast one per VDC. CO working VDCs= 1,631 and the
Number of LRPs= 950.
LRPs are CO members
with formal training
and certification in one
discipline.
Percentage of POs that have been
evaluated by COs.
Value: 100%
Based on the PO evaluation 2012/13. The data is of
monitoring visits in PAF activities by DDCs during
the fiscal year July 16, 2012- June 16, 2013. ( all 40
DDC representatives done monitoring visits in their
respective district)
Measured by: Total # of
participating VDCs and
VDCs in PAF monitoring
/ Total # of DDCs/VDCs
where PAF is active
Total number of POs evaluated is 349.
Com. E: PAF Administration and Project Management Percentage of CO agreements
endorsed/ approved by TAC within a
month.
Value: 64%
Percentage of POs that submit PO
Progress and monitoring reports and
Audit reports according to Project
standards of timeliness to Project
management
Value: 67%
The data is of the period of Jul 16, 2013-May 30, 2014
PO progress report along with financial audit report.
Percentage of complaints received by Value: 88.2%
PAF recorded, addressed satisfactorily
and the actions documented
Based on the number of complaints received PAF
through complaint handling
secretariat.
mechanism.
72
Annual Report 2014
PAF has installed
a toll free number
and PAF is in process
to develop the
operational guideline
for complaints handling
mechanism along
with the installation of
complaints registration
linked with it MIS. Annex 13: Year-wise Target versus Achievements
Physical Progress
Fiscal Year
Target in
Nos.
FY 2060/61
Achievement
in Nos.
-
Financial Progress
% of
achievement
-
Budget (NRs)
Expenditure (NRs)
%
225,000,000.00
5,781,378.87
2.57
FY 2061/62
-
541
268,000,000.00
247,322,605.53
92.28
FY 2062/63
1,597
1,166
73%
507,925,000.00
493,505,927.29
97.16
FY 2063/64
2,750
3,483
127%
1,254,070,000.00
1,210,296,384.99
96.51
FY 2064/65
3,776
3,117
83%
1,970,723,000.00
1,875,485,349.14
95.17
FY 2065/66
4,048
3,343
83%
2,978,865,000.00
1,647,207,174.93
55.3
FY 2066/67
3,923
3,882
99%
2,723,717,000.00
2,481,049,874.47
91.09
FY 2067/68
2,193
3,146
143%
3,039,166,000.00
2,601,283,022.30
85.59
FY 2068/69
3,880
4,396
113%
3,585,268,350.00
2,998,692,500.25
83.64
FY 2069/70
2,390
2,097
88%
3,071,121,000.00
2,342,256,542.26
76.27
FY 2070/71
3,327
2,690
81%
3,060,658,640.00
2,322,022,043.45
75.87
27,884
27,861
100%
22,684,513,990.00
18,224,902,803.48
Total
Annex 14: Details of Expenditure up to July 16, 2014 (cumulative PAF-I and PAF-II)
Details
Community Organization (IG)
PAF I (40M) Expenditure
PAF II (100M)
Expenditure
Total Expenditure
1,381,890,497.49
7,860,891,875.19
9,242,782,372.68
Community Organization (INFRA)
391,685,432.51
3,479,743,772.18
3,871,429,204.69
Community Organization (Innovative)
654,004,180.22
196,458,498.70
850,462,678.92
2,427,580,110.22
11,537,094,146.07
13,964,674,256.29
373,442,911.49
2,778,066,812.20
3,151,509,723.69
2,801,023,021.71
14,315,160,958.27
17,116,183,979.98
108,181,431.90
291,531,654.05
399,713,085.95
34,438,454.82
48,064,759.96
82,503,214.78
120,946,304.52
503,722,402.17
624,668,706.69
1,833,816.08
1,833,816.08
15,160,313,590.53
18,224,902,803.48
Total Community Organization (I)
Partner Organization (II)
Sub Total (A=I+II)
Monitoring, Training/Workshop (B)
PAF Capital Cost (C)
PAF Recurrent Cost (D)
ID Card Cost (E)
Total (A+B+C+D+E)
3,064,589,212.95
Annex 15(1): Programme Funding Status of FY2070/71 (2013/14 only)
Details
Community Organization (IG)
Budget FY70/71
Expenditure in FY70/71
%
1,191,215,000.00
899,663,844.55
75.52
Community Organization (INFRA)
886,243,000.00
744,708,510.09
84.03
Community Organization (Innovative)
185,006,000.00
32,882,165.70
17.77
2,262,464,000.00
1,677,254,520.34
74.13
Partner Organization
534,739,000.00
481,618,586.52
90.07
Monitoring, Training/Workshop
120,615,000.00
64,395,482.93
53.39
25,123,000.00
9,988,657.85
39.76
117,717,640.00
88,764,795.81
75.40
-
-
798,194,640.00
644,767,523.11
80.78
3,060,658,640.00
2,322,022,043.45
75.87
Total Sub-project Block Grants (A)
PAF Capital Cost
PAF Recurrent Cost
Distribution of Poverty Identity
Cards Programme and Building
Rehabilitation Cost
Sub Total (B)
Grand Total (A+B)
Annual Report 2014
73
74
Annual Report 2014
Udayapur
15
Humla
9
Kalikot
Doti
8
12
Dolpa
7
Jajarkot
Dailekh
6
Jumla
Dadeldhura
5
10
Bajura
4
11
Baitadi
Bajhang
2
3
Achham
1
19 District
15 District B1 Tot
Terhathum
14
Saptari
10
Taplejung
Salyan
9
13
Parsa
8
Sindhupalchowk
Panchthar
7
Solukhumbu
Okhaldhunga
6
11
Khotang
5
12
Dhading
Dhanusha
3
Bardiya
2
District
4
Bara
1
15 District B1
Sn.
T. No
49
6
27
6
65
0
38
47
15
29
51
74
864
48
39
60
58
68
51
54
49
67
58
48
87
54
54
69
P. No
38
6
5
77
24
50
17
28
51
74
716
25
28
32
67
42
46
41
83
54
29
58
56
78
77
60,564,277
7,723,046
28,515,946
3,243,449
28,161,529
439,620
18,548,493
15,142,949
12,425,583
17,141,569
25,363,628
74,290,274
544,120,249
24,277,493
17,397,660
50,997,156
28,383,781
37,291,410
34,057,190
30,029,135
31,593,588
27,357,662
28,488,822
27,941,377
101,658,101
25,567,953
34,348,840
44,730,080
Target Amt.
IG
22,735,564
3,252,000
1,645,840
20,015,416
15,476,749
13,764,370
4,308,940
12,904,660
23,959,050
76,125,998
279,135,315
13,523,039
5,854,320
11,530,328
28,983,337
29,728,936
11,847,380
21,281,240
25,430,151
17,746,973
12,639,021
37,964,172
16,631,860
20,029,234
25,945,324
Progress Amt.
Annex 15 (2): District-wise Target versus Achievement in FY2069/70 (2012/13 only)
8
19
16
10
11
15
16
15
7
17
20
13
14
179
16
15
9
8
10
10
15
15
9
11
12
13
12
16
T. No.
20
15
7
19
19
7
14
19
19
11
171
4
19
1
13
2
23
20
5
14
6
12
11
31
10
P. No.
31,405,459
29,718,855
28,207,821
19,569,658
17,486,545
22,759,234
26,689,395
16,434,573
35,086,939
33,582,994
21,298,921
34,676,801
275,409,064
19,851,419
20,210,619
57,684,627
11,346,891
16,473,614
17,888,213
19,857,178
21,633,584
8,640,000
10,560,000
18,291,304
11,440,000
16,135,779
17,953,217
7,442,620
Target Amt.
INFRA
27,961,224
16,132,765
7,353,385
14,241,519
15,703,683
10,694,165
17,566,988
21,794,332
23,426,783
10,051,771
146,054,290
5,132,594
16,925,617
1,500,000
13,342,659
1,294,379
12,156,132
22,094,070
3,837,455
17,696,654
5,854,699
11,192,001
7,406,678
20,148,652
7,472,700
Progress Amt.
Annual Report 2014
75
65
729
Rolpa
Rukum
Sarlahi
Sindhuli
16
17
18
19
19 District Tot
Makwanpur
Morang
4
5
Current Innovative Tot
73
New Innovative Total
Innovative Programme Total
1,867
30
Challenge Fund
2
Total
10
Innovative_20 projects
20
21
0
1
New Innovative
0
43
Kavrepalanchowk
3
15
Kanchanpur
2
7
Chitawan
1
Current Innovative
Innovative Window Programme
118
1,605
53
20
20
33
23
2
8
204
119
6
10
201
Ramechhap
5
6
3
Siraha
Pyuthan
4
3
28
6 District Tot
Mugu
3
48
10
632
42
33
6
46
88
3
44
35
Kapilbastu
2
6
40
46
30
P. No
19
Darchula
1
6 District
77
Rautahat
15
9
Rasuwa
55
14
T. No
Mahottari
District
13
Sn.
1,275,001,832
47673832
33,650,000
13,650,000
20,000,000
14,023,832
2,872,560
4,777,500
-
3,865,850
2,507,922
131,219,289
65,509,268
14,610,031
3,831,523
5,953,012
34,461,573
6,853,883
551,988,462
32,670,833
36,408,482
29,934,430
20,983,319
89,625,570
5,579,880
45,225,587
Target Amt.
IG
738,955,712
7,981,598
-
7,981,598
5,275,598
732,000
1,974,000
87,996,146
52,129,080
15,300,654
1,814,460
1,335,950
13,348,782
4,067,220
363,842,653
21,560,560
24,882,225
2,850,714
21,694,950
67,542,317
2,221,000
28,902,300
Progress Amt.
523
23
0
23
0
8
0
11
4
62
10
15
9
9
14
5
259
18
16
10
14
6
8
14
T. No.
1
1
9
492
39
0
39
6
33
67
8
26
7
14
12
215
21
16
1
16
P. No.
INFRA
906,916,831
15,771,831
-
15,771,831
-
4,285,263
833,080
8,726,520
1,926,968
144,749,235
27,787,327
19,194,468
20,271,894
17,969,236
37,736,360
21,789,950
470,986,701
35,977,767
26,807,794
26,625,375
19,081,741
19,283,171
9,018,471
17,275,185
Target Amt.
526,641,371
29,545,727
-
29,545,727
8,239,450
21,306,277
85,844,336
9,882,699
24,587,428
13,264,985
15,709,555
22,399,669
265,197,018
32,709,721
35,278,859
2,044,309
12,262,681
2,771,878
1,515,232
13,687,722
Progress Amt.
Annex 16: Poverty Alleviation Fund Project – II Progress Status
Heading
Number
Community Organisations
Registered with PAF
(CO)
CO Federation Registration
PAF Investment in
CO
17,960
1,096
Agreement
19,336
Income Generating (IG)
16,279
7,490,685,006
Community Infrastructure (INFRA)
Total
3,227
3,191,784,320
19,506
10,682,469,326
Partner Organisations (PO)
Districts Covered
Amount (Rs.)
Total
Regular PAF Districts
366
59
40
6
Phase II (19 Districts)
19
Phase III (15 Districts)
15
IWP + NDM
19
additional
districts
Phase I (6 Districts)
VDC Covered
POs Working
COs Programme Activity
1,687
1,634
Percentage
CO Member
Total
House Holds
Poverty
Hardcore Poor (Ka)
(HH)
Ranking
Medium Poor (Kha)
Poor (Ga)
Marginal Non-Poor (Gh
Gender
Male
446,669
446,669
446,669
Female
Ethnicity
Dalit
446,669
285,863
64.00%
117,715
26.35%
42,418
9.50%
673
0.15%
95,957
21.48%
350,712
78.52%
108,482
24.29%
Janajati
131,822
29.51%
Others
206,365
46.20%
476,671
Total Beneficiary
Total
HH including
Ethnicity
Dalit
117,294
Infrastructure
Janajati
129,604
Others
229,773
76
Annual Report 2014
Annex 17: PAF II CO registration, agreement for sub-project and disbursement status
(cumulative PAF-II Only)
District
CO Registered
w/PAF (No.)
Agreement
With CO
No.
Total Amount
Released (Rs.)
Amount (Rs.)
Initial 6 Districts
Darchula
442
601
822
491,658,320
487,619,254.05
Kapilbastu
621
610
676
416,730,593
390,670,066.27
Mugu
162
181
255
128,062,977
117,611,908.00
Pyuthan
915
917
1070
584,242,011
575,569,522.94
Ramechhap
898
941
1067
501,657,841
490,161,717.15
Siraha
1218
1194
1265
558,787,895
525,426,099.68
6 Dist. Total
4,256
4,444
5,155
2,681,139,637
2,587,058,568.09
Achham
573
573
649
512,683,055
454,124,380.89
Baitadi
789
629
704
361,408,487
340,098,084.34
Bajhang
468
420
540
346,152,316
303,712,638.59
Bajura
394
383
472
297,363,215
289,861,958.98
Dadeldhura
416
432
490
267,054,271
252,708,244.00
Dailekh
389
417
471
325,144,096
308,406,192.18
Dolpa
103
111
144
129,813,046
121,403,977.17
Doti
495
515
564
260,522,609
239,527,093.47
Humla
118
180
264
193,161,094
178,409,150.44
Jajarkot
398
345
399
285,386,200
271,499,221.65
Jumla
298
320
379
364,990,207
346,681,698.81
Kalikot
627
642
743
450,706,917
424,732,325.35
Mahottari
461
465
491
286,374,299
263,986,779.80
Rasuwa
142
145
165
112,691,998
106,145,687.04
Rautahat
1538
1424
1501
992,350,522
973,692,877.92
Rolpa
316
316
363
160,247,868
153,885,609.11
Rukum
364
318
349
202,162,219
184,467,079.15
Sarlahi
999
986
1077
610,408,953
596,635,005.61
Sindhuli
775
804
954
543,260,101
518,895,250.90
19 Additional Districts
19 Dist. Total
9,663
9,425
10,719
6,701,881,474
6,328,873,255.40
25 Dist. Total
13,919
13,869
15,874
9,383,021,111
8,915,931,823.49
Bara
426
410
437
159,598,658
150,053,522.81
Bardiya
439
408
525
180,618,629
168,331,028.03
Dhading
319
316
378
144,100,296
121,052,143.80
Dhanusha
434
419
453
288,861,436
259,839,432.62
Khotang
290
221
237
140,470,749
131,156,786.16
Okhaldhunga
357
338
366
127,867,594
118,793,539.75
Panchthar
316
297
317
113,214,573
103,294,270.58
Parsa
348
343
381
210,003,254
199,096,744.56
Salyan
410
397
477
157,924,590
146,027,731.00
Saptari
381
351
392
224,176,370
186,726,013.50
Sindhupalchowk
464
460
524
229,237,974
207,236,943.40
Solukhumbu
222
214
223
92,084,611
91,979,047.88
15 B1 Districts
Annual Report 2014
77
CO Registered
w/PAF (No.)
District
Agreement
With CO
No.
Total Amount
Released (Rs.)
Amount (Rs.)
Taplejung
459
432
471
265,140,886
250,781,404.40
Terhathum
276
267
345
121,734,945
114,764,365.00
Udayapur
222
165
190
123,791,178
115,884,742.34
5,363
5,038
5,716
2,578,825,744
2,365,017,715.83
19,282
18,907
21,590
11,961,846,855
11,280,949,539.32
1
1
1
4,000,006
4,000,006.00
57
72
88
21,617,637
20,524,393.00
15 B1 Districts Total
40 Dist. Total
Innovative Window Programme Districts
Arghakhanchi
Chitawan
Dhading
51
64
68
29,911,566
37,378,220.00
Kanchanpur
66
80
128
57,223,439
56,525,094.70
Kavrepalanchowk
4
1
2
4,165,401
4,165,401.00
Lalitpur
2
2
2
6,784,220
6,934,220.00
122
109
123
56,762,593
51,991,487.00
24
23
23
8,798,802
18,394,532.60
327
352
435
189,263,664
199,913,354.30
19,609
19,259
22,025
12,151,110,519
11,480,862,893.62
Makwanpur
Morang
Innovative Total
Total
Annex 18: PAF II Expenditure (in Rs.)
Details
As of FY2069/70
Community Organization (IG)
Community Organization (INFRA)
Community Organization
(Innovative)
Total Community
Organization (I)
Partner Organization (II)
Sub Total (A=I+II)
Monitoring, Training/
Workshop (B)
PAF Capital Cost (C)
PAF Recurrent Cost (D)
Distribution of Poverty Identity
Cards Programme and Building
Rehabilitation Cost (E)
Total (A+B+C+D+E)
Note: Including KA-1-6 (Beruju) Expenses Amount
78
Annual Report 2014
FY2070/71
Total Expenditure
6,961,228,030.64
899,663,844.55
7,860,891,875.19
2,735,035,262.09
744,708,510.09
3,479,743,772.18
163,576,333.00
32,882,165.70
196,458,498.70
9,859,839,625.73
1,677,254,520.34
11,537,094,146.07
2,296,448,225.68
481,618,586.52
2,778,066,812.20
12,156,287,851.41
2,158,873,106.86
14,315,160,958.27
227,136,171.12
64,395,482.93
291,531,654.05
38,076,102.11
9,988,657.85
48,064,759.96
414,957,606.36
88,764,795.81
503,722,402.17
1,833,816.08
-
1,833,816.08
12,838,291,547.08
2,322,022,043.45
15,160,313,590.53
Annex 19: Summary Results of Follow-on Impact Survey 2010
Poverty Alleviation Fund
Monitoring and Impact Evaluation Results
1.
PAF’s monitoring data is developed on 5 different databases which support the process of working with
partner and COs and monitoring the sub-project activities (figure 1). These databases provide a rich source
of information on PAF activities and have been increasingly analysed to improve planning and address
weaknesses in the project implementation process and to identify areas of strength that can be scaled up.
2.
In addition to the MIS, an independent impact evaluation has also been integrated into the design of the
programme. The IE has been a long-term partnership between the PAF Secretariat, Tribhuvan University
(TU) (that carried out the surveys) and the WB task team (that provided Technical Assistance-TA during
the design phase and carried out the analysis). Data for the PAF Impact Evaluation (IE) come from two
rounds of surveys of 3,000 households from 200 villages. The baseline was carried out in late 2007 and
the follow-up of the same households in early 2010. The survey questionnaire is adapted from the Nepal
Living Standards Survey (NLSS) and includes detailed information on consumption and income, socioeconomic and demographic issues, including education, health and nutrition, housing conditions and
physical assets, migration and remittances, employment, social environment, community relationship, voice
and participation. For comparability with the national household survey based welfare measures, PAF survey
includes a very similar consumption module and follows the same consumption aggregation method. The
IE analysis uses panel households (2774 out of 3,000), half of which are PAF beneficiaries (treatment) the rest
non-beneficiaries (control) households. Outcome indicators on PAF beneficiary households and carefully
matched non-beneficiary households are compared for the periods before and after the initiation of the PAF
programme. This method is known as difference-in-difference combined with propensity score matching.
Consumption Effects
1.
The estimated net programme impact on per capita consumption (in real terms adjusted for price inflation)
growth is 13% for PAF income-generating (IG) participant households, 28% for PAF money recipient
households and 49% for those beneficiaries who have received the money for at least six months. It is not
a surprise that these impact estimates are larger for money recipients but it is interesting to note that this
effect remains strong for those who have had the funds for some time and have invested them in IGAs. The
magnitudes of these estimates are impressive across all three categories of treatments both in terms of per
cent change and absolute change. For example, money recipients for more than 6 months recorded on net a
49 per cent growth and Rupees 6,900 (approximately US$100) absolute change in real per capita consumption
in just over two years of time. These results are all statistically significant and robust across different matching
algorithms. The higher levels of welfare impact over time may suggest that IGA revenue is contributing to the
welfare of these households, a result that would be desirable from a policy and sustainability point of view.
2.
The net impact in the growth in per capita consumption is even higher for Dalit and Janajatis, implying the
program’s ability to distribute growth towards targeted groups. The net effect for money recipients among
this caste/ethnic group was an increase in real per capita consumption of 34 per cent, compared to 28 per
cent for the overall sample of the same treatment category.
Food Security Effects:
1.
Chronic food insecurity is a particularly important concern in Nepal and substantial amount is spent per year
on public works programmes aimed at alleviating hardship for food insecure households. Sustained food
price inflation remains a concern and an estimated 3.7 million people are currently food insecure. The impact
of high prices and food insecurity is most severe on economically, geographically and socially marginalized
communities. Since Nepal’s poorest households spend more than 75% of their income on food, high prices
will continue to affect poverty alleviation efforts. The analysis estimates that the net PAF impact on incidence
of food insecurity (as defined as self-reported food sufficiency for six months or less) is 10 percentage points
Annual Report 2014
79
decline when the treatment group is PAF money recipients, and 14 percentage points decrease among
money recipients at least 6 months prior to second-round survey. These effects are stronger for Dalit and
Janajati households. However, there is no impact for PAF IG households (the base treatment category),
possibly implying that the self-reported food sufficiency indicator (measure of perceived change in
household’s ability to increase their food consumption) is not affected by PAF participation alone when the
household is yet to receive funds and start an IG activity. Once again, these results are quite robust across
different matching alternatives.
School Enrolment Effects
1.
Due to PAF, school enrolment rate among 6-15 year old children increased by a net 7 percentage points
for PAF IG households, by a net 9 percentage points for PAF money recipient households, and a net 12
percentage points for PAF money recipients for more than six months. These are all notable and statistically
significant impacts. While child education is not a direct outcome associated with PAF intervention, one
can think of at least two ways by which a treated household would change its behaviour in relation to this
outcome. First, PAF households are part of the larger PAF community organization (CO) are and likely to
benefit from social-networking and mobilization. Second, actual and perceived positive change in income
(PAF funds) will likely reduce potential constraints to sending a child to school.
Child Underweight Effects
1.
For child malnutrition, measured in terms of underweight, the impacts of PAF are as not strong as they are
for other outcome indicators. Nevertheless, incidence of underweight among children under 5 years of age
is estimated to decrease by 5 to 10 percentage points. The results are however not statistically significant
and also do not hold across different matching techniques and across multiple treatment groups. We take
this as a sign of overall trend in the right direction and could see significant effects in the next couple of
years.
Other Effects
1.
There are, as yet, no significant PAF impact evident on indicators associated with community/social capital
(trust, respect, relationships between different ethnic groups, community disputes, etc.), although the
overall trend for both groups is positive. Similarly, while there is no significant impact of PAF programme on
the use of health services/facilities, the effects are qualitatively positive on the use of agricultural centres,
community forest services, and farmers' groups.
Targeting
1.
The targeting results are consistent with PAF’s objective of targeting the poorest households and support
monitoring data results as well. Of the many categories that PAF uses to classify the disadvantaged, one
is the level of food sufficiency. The other is whether the household is from Dalit or Janajati caste/ethnicity
category. For example, the probability of being selected as PAF money recipient goes up by 25 percentage
points if you are from a Dalit/Janajati household. Similarly, one per cent decrease in per capita consumption
at the baseline is associated with 15 percentage points increase in the probability of being selected for PAF.
2.
The impact results are also consistent with PAF’s targeting the poorest households. Among other categories
that PAF uses to classify the poor, one is the level of food sufficiency. Households are separated into four
different groups under this category: hard core poor (those with less than 3 months of food security either
via own production or other dependable sources of income), medium poor (those with 3 to 6 months of
food security), poor (those with 6 to 11 months of food security), and non-poor (those with 12 or more
months of food security). The results show that the percentage of households with food insufficiency of 3
months or less dropped from 13.8% in 2007 to about 5.5% in 2010, a reduction of more than 60%, for the
PAF beneficiary households (defined as those engaged in PAF-supported income-generating activities).
The reduction was only about 6.8% for non-beneficiaries. Similarly, the percentage of households with food
insufficiency of 6 months or less decreased from 40% in 2007 to about 33% in 2010, a reduction of about
17.5%, for PAF beneficiary households. There was no reduction for non-beneficiaries during this period and
in fact, there was an increase in food insufficiency of these households by about 9%.
80
Annual Report 2014
Access and Use of Services
1.
With the second phase of PAF II still ongoing, the number of poor households with access to improved
infrastructure facilities has reached more than 49,000. The impact evaluation results show that the school
enrolment rate for children from households engaged in PAF-supported income-generating activities
increased by more than 7 percentage points. The enrolment rate was even higher for children from Dalit
or Janajati households. While there was no obvious difference between the PAF beneficiaries and the nonbeneficiaries in the use of health services/facilities, the beneficiary households were found to be making
more use of agricultural centres, community forest services, and farmers' groups. The increased use of such
services supports the monitoring data findings that PAF beneficiaries are investing in agriculture-related
opportunities and reaching out to service providers to improve and develop these investments.
Conclusions
1.
The evaluation results indicate that there is a positive and significant impact on household level welfare due
to the PAF programme relative to any other poverty reducing efforts that may be ongoing at the same time.
The results further indicate that the programme is an effective tool for targeting the population considered
most vulnerable in terms of caste and ethnicity as well as most food insecure. There are many process-related
questions that this impact evaluation does not yet answer. For example, a review of the monitoring data
suggests that women groups are far more diversified in livelihood activities that mixed groups. Impacts on
women only groups would need to be analysed further as should the previously related positive indication
of nutritional impact on children under 5 years of age.
2.
The household-level panel data provide an opportunity for further analysis over time which may help us
understand changes in poverty dynamics and for further counter factual analysis of the outcomes reported
in this paper. As such, a continuation of the survey methodology and of the impact evaluation analysis
would be an important tool for policy makers and for the implementation of the poverty alleviation fund at
the national level.
(Ref. Impact Evaluation of the Nepal Poverty Alleviation Fund, WB/TU, 2010)
Annual Report 2014
81
82
Annual Report 2014
1
9
12
5
2
2
3
1
2
2
3
6
8
4
1
1
1
6
2
1
1
4
11
1
Achham
Baglung
Baitadi
Bajhang
Bajura
Dadeldhura
Dailekh
Darchula
Dhading
Dolpa
Doti
Humla
Jajarkot
Jumla
Kalikot
Khotang
Mugu
Pyuthan
Ramechhap
Rasuwa
Rukum
Salyan
Sindhuli
Taplejung
Terhathum
100
11
District
Total
No. of
VDCs
Micro Hydro
Micro Hydro
Micro Hydro
Micro Hydro
Micro Hydro
Micro Hydro
Micro Hydro
Micro Hydro
Micro Hydro
Micro Hydro
Micro Hydro
Micro Hydro
Micro Hydro
Micro Hydro
Micro Hydro
Micro Hydro
Micro Hydro
Micro Hydro
Micro Hydro
Micro Hydro
Micro Hydro
Micro Hydro
Micro Hydro
Micro Hydro
Micro Hydro
Activity Type
114
1
11
6
1
1
3
6
1
1
1
4
8
8
4
4
2
1
3
2
2
6
12
12
1
13
Total No
of Subprojects
30,577
241
4,790
1,139
82
100
339
1,153
107
112
92
1,648
1,226
2,322
679
1,432
460
92
658
388
288
1,608
3,270
3,639
142
4,570
Total Ben
HH
Annex 20: Partnership with AEPC for Rural Energy Sub-projects
176,862
1,371
24,562
7,595
565
652
2,021
7,056
838
596
580
10,008
7,550
12,310
3,264
8,091
2,437
460
3,873
2,444
1,719
9,358
19,283
22,259
852
27,118
Total Ben
Pop
246,991,980
3,669,957
30,925,566
11,025,964
1,227,000
2,248,700
3,318,781
8,212,768
599,917
2,500,000
975,780
12,333,789
11,645,570
16,149,208
12,449,231
6,804,645
6,637,644
700,000
6,431,200
5,582,750
4,335,009
15,569,028
20,670,164
24,414,045
722,165
37,843,099
PAF
75,027,261
-
20,468,698
3,007,675
-
-
-
5,108,183
-
352,545
-
52,456
1,130,908
2,830,219
632,519
356,965
500,000
277,205
-
-
167,400
-
1,945,759
16,205,073
-
21,991,656
CO Cash
180,329,102
1,084,350
21,715,138
7,579,696
872,052
3,716,741
1,641,163
7,934,608
325,191
281,455
1,148,954
4,630,535
12,177,529
15,051,322
3,823,923
5,377,367
3,997,627
248,059
1,351,764
3,886,757
1,172,778
18,703,276
16,473,833
19,896,419
486,885
26,751,680
CO Kind
Project Cost (in Rs.)
123,812,653
1,735,470
23,101,276
8,276,000
900,000
1,592,953
1,630,854
4,093,103
348,572
1,091,000
-
12,539,398
8,862,716
3,826,614
2,552,394
3,365,965
3,700,000
300,000
587,616
2,028,814
899,674
7,312,761
8,081,409
14,838,906
-
12,147,158
DDC/VDC
538,348,519
4,518,950
81,241,400
11,165,000
1,125,000
2,790,000
4,281,500
14,405,000
850,000
2,325,000
2,646,243
27,325,000
42,143,805
37,849,915
22,610,571
13,439,000
12,405,429
1,325,000
2,565,000
9,431,076
4,825,000
52,094,440
60,301,169
38,425,217
1,338,750
86,921,054
AEPC
Contribution
Language editing, graphic designing/layout and printing
PagePerfect Graphic Designing and Printing
Poverty Alleviation Fund (PAF)
P.O. Box: 9985, Red Cross Marg, Tahachal, Kathmandu, Nepal
Phone: 01-40307000, Fax: 977-1-4030701
Email: [email protected]
Website: www.pafnepal.org.np


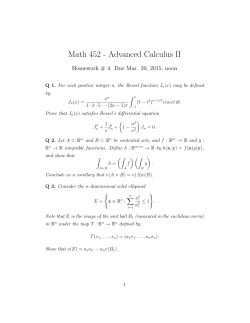
© Copyright 2026