
Document 160468
March 2013 Australia’s bad drug deal Grattan Institute Support Founding members Grattan Institute Report No. 2013-2, March 2013 Program support Higher Education Program Affiliate Partners National Australia Bank Senior Affiliates Wesfarmers Stockland GE Australia and New Zealand Google Affiliates Arup We would like to thank Professor Philip Clarke for highlighting the issue of high cost generic medications, identifying pricing data, and commenting on the report; the many other academic, public policy and clinical experts who provided advice and comments on this report, especially Carol Bennett, Professor Jacqueline Cumming, Professor Jeff Richardson, Dr Sharon Willcox and Professor John Zalcberg; and the state procurement officials who provided confidential pharmaceutical price data. The opinions in this report are those of the authors and do not necessarily represent the views of Grattan Institute’s founding members, affiliates, individual board members or people who commented on the report. Errors or omissions are the responsibility of the authors. Grattan Institute is an independent think-tank focused on Australian public policy. Our work is independent, practical and rigorous. We aim to improve policy outcomes by engaging with both decision-makers and the community. For further information on the Institute’s programs, or to join our mailing list, please go to: http://www.grattan.edu.au/ Lend Lease This report may be cited as: Duckett, S.J. with Breadon, P., Ginnivan, L. and Venkataraman, P., 2013, Australia’s bad drug deal: high pharmaceutical prices, Grattan Institute, Melbourne Origin Foundation ISBN: 978-1-925015-00-3 Sinclair Knight Merz All material published or otherwise created by Grattan Institute is licensed under a Creative Commons Attribution-NonCommercial-ShareAlike 3.0 Unported License Urbis The Scanlon Foundation Ernst & Young Grattan Institute 2013 This report was written by Stephen Duckett, Grattan Institute Health Program Director with Peter Breadon, Leah Ginnivan and Prasanna Venkataraman. 1 Australia’s bad drug deal Overview Australians are paying too much for prescription drugs. The cost of this overpayment is at least $1.3 billion a year, or $3.5 million a day. This equates to 14 per cent of the entire Pharmaceutical Benefits Scheme (PBS) budget. In a time of escalating health costs and other strains on the Commonwealth Budget, spending on pharmaceuticals could be reduced relatively easily, if there is the political will to do so. One drug alone, atorvastatin, has cost the Australian Government and individual patients more than $700 million a year. In its 40 mg form, the PBS paid more than $51 for a box of 30 tablets. New Zealand pays AU $5.80 for a box of 90 tablets. Adopting New Zealand prices for atorvastatin would have saved the PBS more than $1.4 million a day in 2011-12. Patients who paid full copayments would have saved $22 on each box of tablets. Several good examples show the way. In New Zealand, drug prices have plunged dramatically, freeing up money to spend on new drugs and other kinds of care. New Zealand’s secret is simple. The Government has taken the politics out of price-setting and appointed independent experts to make decisions. It has also capped the budget for drugs, which ensures clear priorities and tough negotiations with pharmaceutical companies. This report proposes three changes to get pharmaceutical prices under control. The first is to establish a truly independent expert board. Like New Zealand’s Pharmaceutical Management Agency, it would manage pharmaceutical pricing within a defined budget. For Australia’s PBS, by contrast, decisions on drug pricing are opaque and unconstrained by a budget. Key decisions are made by a committee inside the Department of Health and Ageing that includes among its six members two representatives of drug companies. They have little interest in keeping prices low. In New Zealand, politicians decide how much is spent on drugs in total, then independent experts negotiate prices. In Australia, expert judgements come first but can be overridden by political decisions. No one assesses how much we should spend overall. As a result, our wholesale prices for identical drugs are now more than six times New Zealand’s. In some cases, they are more than 20 times higher. Grattan Institute 2013 The second and vital change is to pay far less for generic drugs, which can be bought for low prices because they are off-patent. In Australia drug companies must cut prices by 16 per cent when a patent expires. Many countries require much bigger cuts. Canada has mandatory cuts of 82 per cent for some drugs. Australia should require a cut of at least 50 per cent, then benchmark prices against the world’s best. This might seem unrealistic. But Australia’s public hospitals already pay low prices. Like New Zealand, one state’s prices are only a sixth of those on the PBS. Down the line, a third reform should encourage people to use cheaper but similar pharmaceuticals, which could save at least $550 million a year more. The pricing agreement between the Government and drug companies expires in the middle of next year. Now is the time to make changes that will end Australia’s bad drug deal. 2 Australia’s bad drug deal Table of contents Overview ............................................................................................ 2 1. Growing costs, high prices........................................................... 4 2. A Kiwi comparison ....................................................................... 7 3. One country, many prices .......................................................... 10 4. How pharmaceutical pricing works now ..................................... 13 5. The solution: a better way to buy ............................................... 19 6. Possible concerns ..................................................................... 27 Conclusion ....................................................................................... 33 Methodological appendix ................................................................. 34 References ...................................................................................... 41 Grattan Institute 2013 3 Australia’s bad drug deal 1. Growing costs, high prices How much do we pay? Access to pharmaceuticals is crucial to good health care. On average, almost nine out of ten visits to a general practice involve a prescription.1 Therapeutic advances mean that drug treatment has improved and extended the lives of many Australians. But it comes at a cost. These costs are rising. In real terms, Government spending on the PBS grew by six per cent a year in the five years to 2010-11.4 The pressure this puts on the budget is seen in Figure 1. Figure 1: Expenditure on the Pharmaceutical Benefits Scheme, 1982-83 to 2011-12 (2011-12 dollars) $ billion Australians spend more than $18 billion a year on medications.2 This report is about drugs that the Government subsidises – drugs that are included on the Pharmaceutical Benefits Scheme (PBS). These drugs cost patients and the Government more than $9 billion a year. 12 For most drugs on the PBS, patients pay up to $36.10 ($5.90 for concession card-holders, who are generally prescribed more drugs than the rest of the population). The Government pays the rest. If someone spends more than a certain amount in one year, their payment (or ‘co-payment’) is reduced.3 As a result, the Government pays more than 80 per cent of the cost of PBS drugs. 6 10 8 4 Patient contribution Other Pensioner/ concession 2 General 0 1982-83 1987-88 1992-93 1997-98 2002-03 2007-08 1 Britt, et al. (2012) 2 Figures are from 2010-11. Australian Institute of Health and Welfare (2012b) 3 This is the Safety Net program. The threshold is $1390.60 ($354 for concession card holders). Co-payments are reduced to the concessional level, and for concession card-holders they are removed altogether. Cost of drugs provided to people covered by the Safety Net is in the ‘Other’ category in Figure 1. Other expenditure in that figure also includes PBS support for highly specialised drugs provided in hospitals. Grattan Institute 2013 Source: Duckett and Willcox (2011) 4 Australian Institute of Health and Welfare (2012b).This figure is for the five years to 2010-11 (inclusive). 4 Australia’s bad drug deal How does Australia compare? Despite the importance of pharmaceutical expenditure, there has been little official focus on how Australia’s prices compare internationally. The exception was a 2001 Productivity Commission report that found Australian prices to be “much lower than those in the United States, Canada, the United Kingdom and Sweden but closer to those in France, Spain and New Zealand.”5 When the Productivity Commission report was published, Australian prices were indeed substantially lower than those in the USA. But even then, they were not the world’s best. Spain and France paid marginally less for innovative products. Spain and New Zealand paid marginally less for drugs that were no longer covered by patents. A 2005 study reached a similar conclusion to the Productivity Commission.6 Since then, Australia’s relative pricing has deteriorated sharply. While other countries have contained growth in prices – and in some cases cut prices dramatically – Australia has not. A recent report from the London-based Office of Health Economics showed that we used to rank among the countries with the lowest prices, but our prices are now among the highest (see Figure 2). Recent OECD data also show that Australia pays more than most countries for pharmaceuticals.7 Relative to other countries, Australia’s prices are particularly high for generic drugs, or drugs that are no longer under patent (see Box 1 for definitions), with significant cumulative costs.8 Ideally, competition between suppliers should cause generic drug prices to fall. However, this doesn’t always happen. A relatively limited number of suppliers, and tightly regulated prices, can lead to companies keeping prices high.9 Figure 2: Australia’s pharmaceutical prices relative to selected countries, 2007-2011 Prices relative to Australia (Australia = 100%) 140% 120% Ireland 100% Germany Sweden Belgium Austria France 80% UK 60% 2007 2008 2009 2010 2011 Note: Four other countries had higher-than-Australian prices in 2008 and lower prices in 2011 (2011 proportion of Australian prices in brackets): Finland (72%), Italy and Spain (71%) and the Netherlands (82%). USA prices were consistently the highest (from 195% to 268% relative to Australia). Source: Grattan Institute analysis of OHE data 8 5 Productivity Commission (2001) Sweeny (2005) 7 O’Neill, et al. (2012) 6 Grattan Institute 2013 Roughead, et al. (2007); Bulfone (2009); Clarke and Fitzgerald (2010); Morgan and Boothe (2010); Clarke (2012). 9 Bulfone (2009) notes that current PBS pricing arrangements inform firms of competitor price reduction offers, limiting benefits to companies of competition on price. See footnote 43 for more information. 5 Australia’s bad drug deal Of course, drug prices aren’t the only factor that influences pharmaceutical expenditure. Population health, demographics, and clinical choices are all important. But of all the ways to limit pharmaceutical spending, cutting prices is the quickest and the easiest. It can save a lot of money that is being wasted and if it is managed the right way, cutting drug prices poses very little risk to health. To estimate how much we could save by reducing drug prices, the following chapters look at the prices paid in New Zealand, and by public hospitals in two Australian States. Subsequent chapters explain how we set our prices, and how we can do it better without reducing health care quality or access. Finally, we discuss potential concerns our recommendations might raise, and how negative side-effects can be avoided. Box 1: What are patented and generic drugs? Drug pricing is complex. Developing truly new drugs can be a long and expensive undertaking. The journey from ‘bench to bedside’ involves many hurdles, with promising inventions in the laboratory often failing to succeed when tested on the population. Drugs must also be approved for safety and effectiveness, adding further delays and costs. To recover these costs, discoveries can be patented. Patents effectively give an exclusive licence to manufacture, and allow the manufacturer to charge higher prices for the 20-year patent period. Because these 20 years include the approval process, drugs will not be on the market for the whole time they are under patent. After the patent has expired, other companies can use the intellectual property behind the drug and bring identical ‘generic’ copies (as opposed to the ‘patented’ version) to market. The patent-holder might also offer a generic version of the drug. Sometimes patent-holders attempt to extend patent protection beyond 20 years by patenting different aspects of their products (the coating of a capsule, or a combination of active ingredients, for example). This is known as ‘evergreening’ and is currently being investigated by a Government inquiry.10 10 Grattan Institute 2013 Commonwealth of Australia (2012). 6 Australia’s bad drug deal 2. A Kiwi comparison A comparison with our neighbour, New Zealand, shows how much money we waste by paying too much for drugs.11 Grattan Institute analysis of 2011-12 data found staggering differences in the prices paid in each country. would not involve any change in treatment patterns. Another $590 million could be saved if substitutions were made for the remaining 11 doses in our ‘top 73’ list that are not available in New Zealand. We looked at the prices of individual drug-dose combinations (“doses”) – for example, of atorvastatin 40 mg. We analysed the top 73 doses that are prescribed the most often, and that account for the most expenditure.12 These savings are based on data from one year. Savings may vary from year to year as prices change, prescribing changes, and new drugs come on the market. However, our estimates are very conservative in two respects. Firstly, our analysis only considers Australia’s top 73 doses, which account for about 43 per cent of PBS expenditure. Secondly, greater savings could be achieved if we allowed greater quantities per prescription as New Zealand does. Using less conservative assumptions, estimated savings could be even higher (see methodological appendix for more information). We compared prices paid here with prices in New Zealand, as reported by its Pharmaceutical Management Agency, PHARMAC.13 For the 11 Australian doses not listed on New Zealand’s schedule, a comparison was made with a nearequivalent identified in the Australian Medicines Handbook. If Australia adopted New Zealand’s prices for 62 identical doses available in both countries, it would save $1.1 billion a year.14 This 11 Spinks and Richardson (2011) also found a large disparity in prices using 2007 data. Grattan Institute analysis uses 2012 data, which includes the impact of recent reforms, including price disclosure. 12 This list combines the top 50 drug-dose combinations by prescription volume, and the top 50 by total expenditure. Because of the overlap between these categories, there are 73 doses on the final list, and 54 different drugs. 13 Our approach is consistent with guidance on international comparisons. See Machado, et al. (2011). PBS prices were for October 2012, PHARMAC for January 2013. 14 Of these 62, seven combine the same drugs in a different ratio. They account for only $7 million of savings. See methodological appendix for more information. Savings estimates all relate to total PBS expenditure. Data are not available to distinguish between public (taxpayer) and private (patient out-of-pocket cost) savings. Grattan Institute 2013 New Zealand’s PHARMAC negotiates discounts on published prices amounting to an average of 17 per cent of expenditure (drug companies are prepared to discount their product if the price is kept secret, in order not to affect prices in other markets). The discounts for individual drugs are not public, so we have not taken them into account in our analysis. Australia also negotiates price discounts below published prices. Since these discounts are not publically released they have not been taken into account in our analysis either. However, they would have to be exceptionally large (and well above New Zealand’s) to have a significant impact on the savings we have estimated. 7 Australia’s bad drug deal Figure 3: Estimated annual savings from adopting New Zealand's pharmaceutical prices, 2011-12 $ million Figure 4: Ex-manufacturer prices for identical drugs as multiples of New Zealand’s, by volume (top) and total cost (bottom), 2011-12 Multiples of New Zealand prices 12 1,200 1,000 Patented 10 Generic 8 800 6 600 4 400 2 0 200 Top 10 11-20 High volume 0 Identical pharmaceuticals Substitutes Source: Grattan Institute analysis based on PHARMAC (2012b); PBS (2012) For the 73 doses we compared, Australian wholesale prices are eight times higher than New Zealand’s. For identical drugs – a more conservative comparison – our prices are six times higher. As Figure 4 shows, the price differences are not random. Our prices are highest precisely when the most money is at stake: for the drugs we use often, and spend the most on. For the top 10 doses on the PBS by volume, we pay an average of more than 10 times New Zealand’s prices. For the 10 doses that cost us the most, the average is almost 13 times New Zealand’s prices. 21-30 Doses 31-40 21-30 Doses 31-40 41-50 Low volume Multiples of New Zealand prices 14 12 10 8 6 4 2 0 Top 10 11-20 High total cost 41-50 Low total cost Source: Grattan Institute analysis Grattan Institute 2013 8 Australia’s bad drug deal Box 2: Atorvastatin – a blockbuster budget buster Australia spent more than $700 million in 2011-12 on a single drug: atorvastatin, marketed by Pfizer under the name Lipitor. Atorvastatin lowers blood cholesterol and is prescribed to reduce the risk of heart disease. The Government cost was more than $570 million, while patients paid the rest. In Australia, atorvastatin is most commonly prescribed in packs of 30 40-milligram tablets. Although generic versions have been introduced, the price paid by the PBS in October 2012 was still high: $51.59 per box. Atorvastatin has been off-patent for more than a year, so prices are tumbling around the world. In New Zealand, Pfizer supplies its generic equivalent, Zarator, for AU$5.80 for a box of 90 tablets. This is less than four per cent of the Australian price per pill. If Australia paid New Zealand’s price for Zarator with current pharmacy mark-ups, the price to the customer would plummet to $14.10. A patient currently paying the maximum $36.10 for his or her prescription would save $22 for every box. Assuming they bought one box a month, this is an annual saving of $264. With New Zealand prices (and current pharmacy mark-ups), the Government would pay nothing at all for non-concessional patients below the Safety Net. On current prescription volumes, and across the most commonly prescribed forms of atorvastatin, New Zealand prices would save more than $1.4 million every day. An ad-hoc price reduction in December 2012 (unrelated to the usual price disclosure cycle) bought the ex-manufacturer price of atorvastatin down by 25%. This contrasts with the 96% cut that would have brought the price into line with New Zealand’s. Grattan Institute 2013 9 Australia’s bad drug deal 3. One country, many prices We don’t have to look overseas for examples of better drug prices. Public hospitals buy drugs outside the PBS. In most states, purchasing negotiations for all public hospitals have been centralised, either in a specific body for the health sector, or as part of broader public sector purchasing arrangements. As the prices in two states show, public hospitals are getting a much better deal than the Commonwealth Government and the general public. Grattan Institute compared PBS prices with the prices paid by public hospitals in Western Australia. Hospitals don’t purchase all the drugs on the PBS, so we only compared prices for identical drugs that are bought by public hospitals and are also on our ‘top 73’ list for the PBS. In the case of Western Australia, that means 39 drugs. If the PBS adopted the cheaper prices that public hospitals in Western Australia pay, it would save an estimated $750 million. Public hospitals in another state – which cannot be named because data were provided on condition of confidentiality – get an even better deal. If the PBS matched the prices paid by public hospitals in this state for 59 identical drugs, there would be savings of nearly $1.2 billion each year. Most of these savings come from lower generic drug prices (see Figure 5).15 This shows that, even compared with other prices 15 All savings estimates in this chapter are based on identical drugs. See the methodological appendix for more information. Grattan Institute 2013 paid in Australia, PBS prices for generic drugs are extremely inflated. We did not obtain information about prices paid by purchasing bodies in all States and Territories. However, we could also expect large savings if the PBS adopted their prices. In 2010, benchmarking of drug prices paid by purchasers in six states and territories found low variation.16 By contrast, there is a huge gap between the prices paid in the states we studied and prices paid by the PBS (see Figure 5) – a gap that equates to wasted expenditure of between $750 million and $1.2 billion a year. Putting the three comparisons together (New Zealand and the two public hospital systems), paints a stark picture of the PBS’s extremely high prices. As Figure 6 shows, on average the wholesale cost of PBS drugs is over eight times the lowest price in our comparisons – for 16 doses, our prices are 10 times higher. The PBS only gets the lowest price for five drug doses, none of which yields substantial savings relative to New Zealand or public hospitals.17 16 We did not review the report from the Australian National Health Benchmarking Program, but according to a Victorian Auditor-General’s report, it found a price gap of only 1.7 per cent between the second-best performer and the average. See Victorian Auditor-General (2011) 17 Four had prescription volumes of less than one million a year. One (lercanidipine hydrochloride) was not used by any comparator. For the leukemia drug imatinib, the PBS price was around $100 cheaper than New Zealand’s, but this drug had less than 14,000 prescriptions. The other drugs were only 10 Australia’s bad drug deal Figure 5: Estimated savings from adopting prices from New Zealand, public hospitals in WA and another state, 2011-12 Figure 6: PBS prices as multiples of benchmark comparators, 201112 $ million PBS prices as multiples of benchmark price (wholesale) 1,800 1,600 1,400 60 Patented Generic Source of lowest price New Zealand Unnamed state Western Australia 1,200 40 1,000 800 600 20 400 Average: 8.2 200 0 0 Western Australia Unnamed state New Zealand Source: Grattan Institute analysis based on Contracts WA (2012); PBS (2012); PHARMAC (2012b) and confidential data Drug-dose combinations Note: This chart represents the 58 identical doses for which the benchmark model was cheaper than the PBS. Only 39 drugs where the PBS cost is more than twice that of the comparator are displayed, although the average is for all 58 doses. The price of one drug, olanzapine, is 64 times higher on the PBS than in Western Australian public hospitals. Source: Grattan Institute analysis marginally cheaper. The PBS did get the best deal on prescription aspirin, at $7.88 compared to New Zealand’s $8.07. Grattan Institute 2013 11 Australia’s bad drug deal All these comparisons are conservative. The range of drugs used in hospitals is far narrower than those covered by the PBS. The volume of drugs being negotiated is also much smaller (nationally, PBS purchases are five times public hospital drug purchases).18 Because state purchasers do not have the same economies of scale and negotiating power as a national purchaser, Australia might be able to pay even lower prices at a national level. Box 3: Pill pricing in Perth Maria (not a real person) is a 63-year old Perth woman recovering from breast cancer, with a history of ischaemic heart disease. She is prescribed anastrozole, a breast cancer drug. Although anastrozole came off patent more than two years ago, it costs $152 for 30 pills. Maria pays the maximum co-payment of $36.10, while the Government pays the rest. She also takes clopidogrel with aspirin for her heart, which costs the Government $75 for each box. Again, she pays $36.10 of this while the Government pays the remainder. A nearby public hospital buys anastrozole for $12, and buys clopidogrel for $11. If pharmacies bought the drugs for these prices, after mark-ups they would cost Maria only $27 and $24 each. These cheaper prices bring both drugs below the maximum copayment. So instead of paying $36.10 for each script ($72.20), Maria now only pays $51 for both her medications – a saving of $22. Meanwhile, the PBS saves $227 each time Maria visits the pharmacist. Maria will also take longer to reach the Medicare Safety Net, resulting in further savings for the PBS. 18 In 2010-11, public hospital expenditure on drugs was 21% of government PBS expenditure, $1.83 billion versus $8.72 billion. See Department of Health and Ageing (2010a); Australian Institute of Health and Welfare (2012a). Grattan Institute 2013 12 Australia’s bad drug deal 4. How pharmaceutical pricing works now Australia has high drug prices because we purchase pharmaceuticals the wrong way. Unlike in New Zealand, the process of listing individual drugs involves political decisions at the highest level: Cabinet. And while independent experts provide advice, the key pricing body is a six-person internal committee within the public service, which includes two industry representatives. Crucially, PBS expenditure is uncapped. There is no fixed ‘drug budget’ to force decision makers to contain costs, and to ensure that subsidies are spent on the most cost-effective options. Australia’s process Before a drug is listed on the PBS, it is assessed for quality, safety and efficacy by the Therapeutic Goods Administration, then for cost-effectiveness and clinical relevance by the Pharmaceutical Benefits Advisory Committee. Once a drug is over these hurdles, the Pharmaceutical Benefits Pricing Authority (the Pricing Authority) determines the maximum price that can be charged, and how much the Government will pay manufacturers or importers through the PBS. The Pricing Authority is a non-statutory body established by ministerial direction. Of the six members of the committee, two are industry lobbyists from Medicines Australia and the Generic Medicines Industry Association. There is an independent chair and one representative from the health department, and one from the Department of Industry, Innovation, Science, Research Grattan Institute 2013 and Tertiary Education. There is also one consumer nominee, currently from the Consumers Health Forum. The Pricing Authority’s recommendations are far from transparent.19 Nevertheless, they may take into account a range of factors, including cost-effectiveness (based on the manufacturer’s proposed price), prices of similar drugs and alternative brands, and prices in comparable countries.20 The Pricing Authority makes recommendations on drug pricing to the Minister for Health. If the total cost of listing the new drug is estimated at less than $10 million a year, it has been agreed that the listing will go ahead.21 If the estimated cost is more than $10 million a year, the final decision is made by Cabinet (see Figure 7). Like the Health Minister, Cabinet can accept or reject recommendations, or defer listing. In recent years, changes have been made to try to cut drug prices. In 2005, mandatory price reductions were introduced for new generic drugs. After a patent expires, the first new, bioequivalent drug added to the PBS had to be at least 12.5 per cent cheaper than the existing drug. This reduction was increased to 16 per cent in 2010, but is still much smaller than the cuts required in many other countries (discussed below). 19 Robertson, et al. (2009) Pharmaceutical Benefits Pricing Authority (2010). For some drugs, pricing decisions also take into account potential volumes of PBS prescriptions for the drug, and prices may be adjusted if volumes differ from pre-listing estimates. 21 The agreement is between the Government and Medicines Australia. 20 13 Australia’s bad drug deal Figure 7: The process for setting drug prices Pharmaceutical Benefits Advisory Committee recommends inclusion on PBS Optional application Pharmaceutical Benefits Pricing Authority Price negotiations Price not agreed Drug company Price agreed No PBS listing, or drug company refers back to PBAC or PBPA with more information Cabinet Inclusion on PBS Health Minister Expenditure over $10 million Another improvement is that since 2007 the prices that pharmacies pay for drugs must be disclosed.22 Previously, discounts that manufacturers and wholesalers gave to pharmacies were not taken into account when PBS prices were set. One example is the lipid-lowering drug Simvastatin. Before April 2012, pharmacists were getting steep discounts that were not considered when setting PBS prices. Pharmacists paid only $17.52 for a standard-dose box, but received $31.82 from the Government. This resulted in a gross profit of 45 per cent – a huge and unintended windfall for pharmacies, paid by the taxpayer.23 Price disclosure is bearing some fruit. The next round of adjustments will come into force in April 2013. The prices of 62 drugs will fall by an average of one quarter. Prices for eight drugs will fall by more than 50 per cent.24 But almost all the reductions fall well short of what is needed to bring drug prices in line with those paid in New Zealand, and by Australian public hospitals (see Figure 8). Expenditure under $10 million Source: Pharmaceutical Benefits Pricing Authority (2009) 22 The scheme was expanded in 2010 and now covers the whole PBS. Georges and Palaghia (2012). Nicholson (2013) also reports very large discounts to pharmacies, but these are still less than the savings that would accrue to Government and consumers through the benchmark model proposed in this report. Clarke (2012) has also demonstrated the very large windfalls accruing to pharmacies from manufacturer price discounts. 24 Department of Health and Ageing (2013) 23 Grattan Institute 2013 14 Australia’s bad drug deal Figure 8: Benchmark prices and Australian prices with reductions from price disclosure Ex-manufacturer price ($) Price in 2011-12 Price after April 2013 reduction 10 Benchmark price 5 0 The policy has other important limitations, including a significant time lag. As shown in Figure 9, data collection, analysis, recommendations and adjustments take a minimum of 18 months.25 Over this period, the real prices pharmacies pay may fall further, but they cannot be adjusted until at least a year and a half later. In the meantime the taxpayer and patients face unnecessary costs. The long delay in passing on the benefits of price reductions to consumers has important consequences, especially for people who pay the full $36.10 co-payment for their prescription. An estimated nine per cent of Australians don’t buy the drugs they have been prescribed due to cost.26 So far, prices haven’t fallen far enough and price disclosure is likely to become less effective over time. The policy is extremely complex to administer, leaving room for error and legal challenges. Recently, a drug manufacturer successfully challenged the Government’s calculations in court, resulting in a price reduction being cancelled, and another limited.27 The ruling may have implications for other price reductions. Note: Benchmark prices are the lowest price out of the PBS, New Zealand, or the two public hospital purchasers we assessed. Source: Grattan Institute analysis 25 By agreement between the Government and Medicines Australia. ABS (2012). This problem is faced disproportionately by younger and sicker adults – see The Commonwealth Fund (2011). 27 IHS (2013) 26 Grattan Institute 2013 15 Australia’s bad drug deal Figure 9: The price disclosure cycle Brand becomes subject to Expanded and Accelerated Price Disclosure Minimum 12 months Drug company collects price disclosure data Drug company submits price disclosure data for the reporting period Service provider (working for the Department) calculates average disclosed price Service provider notifies the Department of price outcome Minimum 6 months Department makes a determination There are signs that manufacturers will try to avoid the impact of price disclosure in other ways. One is to provide payments to pharmacies that are not directly linked to drug sales (like incentives to sign patients up for drug company ‘support programs’).28 Another loophole in the rules is already being exploited. Data from the first month that a new drug is listed is not used in the price disclosure process. During this period, pharmacies can receive steep discounts without risking future reductions in PBS prices.29 Flaws in the process There have been small, positive changes in how drug prices are set. But they will not be enough to make sure the PBS gets good drug prices. Fundamental, structural problems with how pricing decisions remain. Recent arbitrary decisions about listing drugs highlight these issues. In 2011, the then Health Minister announced that consideration of seven medicines recommended for inclusion on the PBS would be deferred, arguing that they did not improve on existing treatments.30 The seven medicines were victims of timing. There doesn’t appear to have been any systematic reason – such as Scheduled reduction Source: Adapted from Department of Health and Ageing (2010b) 28 In 2011, Pfizer offered pharmacists $7 for each patient the pharmacist recruits to a Pfizer ‘support program’. See Miller (2011). 29 Commonwealth of Australia (2010). Pharmacists are aware of this loophole, Thurecht (2011), and according to Dunlevy (2011) some pharmacists purchase a year’s supply during this month-long period. 30 Finance and Public Administration Reference Committee (2011) Grattan Institute 2013 16 Australia’s bad drug deal their relative cost-effectiveness relative to drugs already on the PBS – for choosing not to list them.31 Around the same time, it was announced that Cabinet would decide on all new drugs listings. Previously, it was only involved when forecast expenditure was more than $10 million a year.32 A Senate Committee concluded there had been: … a major, unnecessary and unwelcome change in government policy. The Government has exchanged a wellrespected, criteria-bound, evidence-based and transparent system for a system that is none of these things. Cabinet is duplicating an already existing process, albeit without the appropriate qualifications or information available to the [Pharmaceutical Benefits Advisory Committee]. This is wasteful. Micromanaging the process in this way also represents a poor use of Cabinet's time and is likely to result in significant and unacceptable delays.33 The decision to remove the $10 million threshold for Cabinet consideration was later reversed, but it highlights the risk of other arbitrary changes in future. More broadly, it is clear that pricing decisions are made in the wrong place, by the wrong people. Deciding on the pricing and listing of individual drugs is a specialist, technical task. Even though Cabinet can only accept 31 A minimum incremental budget threshold (based on clinical cost-benefit analysis) can be justified, but at the start of the evaluation process, not at the end. Buyx, et al. (2011) 32 Finance and Public Administration Reference Committee (2011) 33 Ibid. Grattan Institute 2013 or reject recommendations, or defer a decision, there is no good reason for it to have this role. Certainly, Cabinet should set overall spending levels and priorities. It might also set costeffectiveness thresholds to guide the listing process. Beyond this, a confidential political body shouldn’t micro-manage the listing and pricing of specific drugs. The advice received by the Minister and Cabinet comes from bodies that seem independent, and technically they are. However, the Pharmaceutical Benefits Pricing Authority is effectively a committee of the Commonwealth Department of Health and Ageing. The Department, while part of an independent public service, supports and serves the Minister for Health, and is not insulated from politics in the same way as are statutory bodies such as the Reserve Bank, or PHARMAC in New Zealand. More troubling is the fact that unlike New Zealand’s impartial, expert board, Australia’s Pricing Authority includes representatives with direct, vested financial interests (representatives of drug companies and generic manufacturers). Given its membership, this body is unlikely to focus on keeping drug prices in check. The whole framework for negotiating prices is governed by a political accommodation between the Government and drug companies. In a 2010 Memorandum of Understanding, which largely relates to the price of generic drugs, the Government promised not to introduce any new policies to cut drug prices before July 2014: 17 Australia’s bad drug deal The Commonwealth undertakes not to implement new policy to generate price-related savings from the PBS during the period of agreement [May 2010 to July 2014], that is, measures that would change the ex-manufacturer prices of particular medicines, other than that reflected by this MOU.34 This promise, the seemingly arbitrary decisions by Cabinet, and the high drug prices we pay all indicate the process isn’t working. It is opaque, uncertain and expensive, and it assigns the wrong roles to politicians and vested interests. 34 Commonwealth of Australia (2010) Grattan Institute 2013 18 Australia’s bad drug deal 5. The solution: a better way to buy A much better process, and much better results, are clearly possible. Grattan’s analysis of prices paid by public hospitals shows that Australia is quite capable of getting better pharmaceutical prices. We could do much better, but a flawed process is forcing us to pay a high price. Other countries have much better ways of buying pharmaceuticals. So do the Australian public hospital purchasers that we studied. To improve our performance we should learn from these examples and use the best approaches from around the world. Start by getting the foundations right: independent governance and an incentive to save For decades, Australian interest rates have been set by the Reserve Bank, a truly independent body that, unlike government departments, does not report to a minister. A similar model of independent decision-making could apply to pharmaceutical pricing. Three reforms are needed to get our pharmaceutical prices back on track: independent, expert pricing within a defined budget; slashing the price of generic drugs; and encouraging people to use the most cost-effective medicine. New Zealand provides a role model: PHARMAC, an independent pharmaceutical purchaser (see Box 4). PHARMAC has taken a hard-nosed approach in negotiations with drug companies, resulting in substantial savings against projected expenditures (see Figure 10).35 As well as purchasing and listing the prices of pharmaceuticals, PHARMAC is responsible for promoting optimal use of drugs. We should adopt New Zealand’s independent, expert management of drug pricing, as well as a defined budget to contain prices. We should also set tougher rules for the price of generic drugs. Although we have moved in the right direction by setting a mandatory price reduction for new generics, it is a small cut compared to those required in many other countries. Every new drug listed on the PBS increases costs.36 While costbenefit analysis of all new drugs is a good policy, budget impacts also need to be contained as part of the listing process. New Zealand’s process does this well. PHARMAC considers both cost effectiveness and total cost when making listing decisions. PHARMAC has a defined drug budget, so it is forced to make trade-offs about where savings will be made to pay for new drugs. The defined budget also strengthens PHARMAC’s hand 35 36 Grattan Institute 2013 Cumming, et al. (2010); PHARMAC (2012a) Birch and Gafni (1994) 19 Australia’s bad drug deal in negotiations with pharmaceutical companies, while its political independence reduces political pressure and lobbying to politicians to list drugs. The result is low prices. PHARMAC has contained growth in drug prices. Pharmaceutical expenditure now takes up less of the health budget, allowing greater expenditure on other areas of health care.37 New Zealand is now a world leader in containing drug prices. There is no reason why Australia shouldn’t challenge New Zealand for that position. Figure 10: Impact of PHARMAC on community pharmacy spending, 2000 to 2015 $NZ million (ex-GST and rebates) (2012) Projected 3000 Box 4: PHARMAC’s governance The New Zealand Pharmaceutical Management Agency (PHARMAC) is established under the Public Health and Disability Act 2000 as a 38 Crown entity. It is governed by an independent, expert board of six people, including three medical practitioners. PHARMAC’s principal objective is “to secure for eligible people in need of pharmaceuticals, the best health outcomes that are reasonably achievable from pharmaceutical treatment and from within 39 the amount of funding provided” (emphasis added). The Act requires PHARMAC to “consult on matters that relate to the management of pharmaceutical expenditure with any sections of the public, groups, or individuals that, in the view of PHARMAC, may be affected by decisions on those matters” when it considers it appropriate. The PHARMAC Board makes pricing decisions independently. Authorisation by government ministers is not required. According to a recent study, PHARMAC is seen as politically neutral, resistant to lobbying, and able to contain medicine costs. Because of PHARMAC’s independence, and strong bipartisan support, the pharmaceutical industry accepts PHARMAC’s role and both sides work together 40 professionally. Estimated expenditure at 2000 subsidies 2000 1000 Actual expenditure 0 2000 2005 2010 2015 Source: PHARMAC (2012a) 38 Ministry of Health (2005) Ibid. Section 47(a) 40 Ragupathy, et al. (2012) interviewed 20 key informants including doctors, pharmacists, members of Parliament, public servants, and people who work at PHARMAC and in the pharmaceutical industry. 39 37 Pharmaceutical’s share of health spending fell substantially from 1996 to 2006, while it rose in other countries including Australia (1996 to 2005). See The Commonwealth Fund (2008). Grattan Institute 2013 20 Australia’s bad drug deal Australia should also follow New Zealand’s approach and disentangle Cabinet from the PBS listing process. Prices should be set by an independent, impartial and expert pricing board, with strong membership from the medical profession. Like PHARMAC, the new agency should function within a defined budget, providing a clear incentive to achieve better pricing. To inform its decisions, it should benchmark against prices paid by State and Territory purchasers, as well as by national purchasers in other countries.41 Tougher rules on generic pricing Australian prices for generic drugs are extremely high: on average more than seven times higher than New Zealand’s (Figure 11). Generics account for 89 per cent of the estimated savings Australia would make if it adopted New Zealand prices for identical drugs.42 without strong market regulation generic prices tend to remain high.43 Figure 11: Australian wholesale prices as multiples of New Zealand prices, identical drugs, generic and patented, 2011-12 Multiples of NZ prices 40 Drug-dose combinations Average 30 20 10 Australia’s high prices cannot be justified. Generally, companies that offer generics did not invent the drug, so they face no research and development costs, and the marginal costs of pharmaceutical manufacturing are very low. Despite this, 0 Generics Patented Source: Grattan Institute analysis 41 Benchmarking is an important part of pricing in other countries. In England the Department of Health undertakes an annual price comparison which is tabled in Parliament, Department of Health (England) (2012). In Canada price comparisons are released in the Patented Medicine Prices Review Board annual report, see Patented Medicine Prices Review Board (Canada) (2011). 42 Both comparisons include 56 identical drugs only. In seven cases, the ratio of drugs within doses vary. See the methodological appendix for more information. Grattan Institute 2013 43 There are several reasons that companies do not compete vigorously on the price of generics in many markets. These include relatively high concentration of suppliers, heavily regulated prices, consumers being insulated from prices by government subsidies, and generally nationally-bounded markets. Bulfone (2009) notes that current arrangements, where price reductions are conveyed to all participants, limit competition on price. One exception is the USA, which has a very large and competitive generics market, with many generic suppliers, some of which are owned by retail drug store chains. 21 Australia’s bad drug deal There is no good reason to pay more for generics than other countries do. Australia should tackle high generic drug prices in two ways. First, it should impose a cut of at least 50 per cent on generic prices as soon as a drug’s patent expires. Once this kind of price cap is set, companies tend to leave their prices at the regulated limit.46 For this reason, there should be 44 Many countries are turning to better pricing of generics for savings, but substantial price variation remains, Simoens (2007); Danzon and Furukawa (2008). 45 The Council of the Federation (Canada) (2013). Québec is the only province not participating. 46 Carone, et al. (2012) Grattan Institute 2013 Australia Romania Hungary Slovakia Belgium Korea Portugal Japan 0% Greece Figure 12: Price reductions for new generics, selected countries Austria Many other countries have mandated price reductions that are much tougher, as Figure 12 shows. This year Canadian provinces have gone the furthest by requiring the price of six generic drugs (including atorvastatin) to fall to at least 82 per cent below the price of the original, patented drug.45 The provinces expect to expand the rule to more drugs in the future. The change follows the example of provinces such as Ontario, which increased mandatory price reductions for all new generic drugs to 75 per cent in 2010. annual benchmarking against the lowest prices paid by any national purchaser, following the 50 per cent cut.47 Czech R Many governments have responded by setting rules for the price of new generics, capping them at a proportion of the price of the original, patented drug.44 Australia requires new generic drugs to be at least 16 per cent cheaper than the originator. But by international standards, this requirement is timid, and could easily be strengthened. -20% -40% -60% Required reduction below originator price Austria and Korea impose additional cuts for the second and subsequent generics that enter the market (see notes) Notes: Austria imposes additional 15% and 10% cuts for the second and third generics that enter the market. In Korea there are 15% cuts for second and subsequent entrants (or, if it is lower, the cap is the lowest listed price for entrants 2 to 5, and 85% of the lowest listed price for subsequent entrants). For the Czech Republic, reductions are usually 55%, although technically the minimum reduction is 20%. Sources: Directorate General for Internal Policies (European Parliament) (2010); OECD (2010); Puig-Junoy (2010); Izmirlieva and Ando (2012); The Council of the Federation (Canada) (2013). 47 In the case of Canada, when several provinces have the same price, this price could also be used for benchmarking. Bulfone (2009) has proposed a tender rather than benchmarking approach where multiple tenderers could be accepted, but tenderers would lock in their bid for a set period, creating a strong incentive to compete on price. We have proposed a more regulated approach as the savings are more certain. 22 Australia’s bad drug deal Matching the cheapest price for identical drugs in the three jurisdictions studied here – using a benchmarking approach – would save $1.3 billion a year. This would not involve any change in prescribing. These savings would likely grow as many ‘blockbuster’ drugs are due to come off-patent in the next few years. Box 5: Ranibizumab, the most expensive drug of all The most expensive drug (by total cost) on the entire PBS is ranibizumab, which cost over $308 million in 2011-12. It is used for treating age-related macular degeneration, and comes in a 2.3 mg syringe designed for injecting into the eyeball. Currently, it costs $1830 before any mark-ups. A future reform: promoting cost-effective choices Once changes to generic prices are bedded down, further savings could be achieved by encouraging people to use the most cost-effective drug in a ‘therapeutic group’. Drugs in a therapeutic group treat the same problem and have similar health and safety outcomes. An existing policy, the Therapeutic Group Premium, sets the PBS payment for the cheapest drug in some therapeutic groups. If people choose a more expensive drug in the group, the PBS contribution remains the same and patients make up the difference. Doctors can seek an exemption if using the cheapest drug would put a patient’s health at risk.48 This policy currently applies to a limited range of drugs. Once it is well-established, Australia’s new drug pricing board could gradually expand this approach to more therapeutic groups. All the drugs in each therapeutic group would still be subsidised, but the costs of using a more expensive drug would fall on the consumers who make that choice. Ranibizumab is manufactured by Genetech, a drug company that also makes an anti-cancer drug called bevacizumab (Avastin), which comes as a solution that is added to an IV bag. Although this drug was designed for another purpose, it appears to be just as effective as ranibizumab in preventing macular degeneration.49 While bevacizumbab costs $4.30 per mg, ranibizumbab costs $795 per mg – 185 times more. However, Genetech has little incentive to make bevacizumab available in a form that is ready to be injected into the eyeball (the most effective means of administration), since it has a far more profitable product on the market. This forces doctors to divide dosages and fill syringes themselves. The new drug pricing board would be able to weigh up the evidence on cases such as these and see whether it is worth subsidising both drugs. If bevacizumab is as safe and effective as the vastly more expensive ranibizumab, the body could use the Therapeutic Group Premium to encourage use of the cheaper medication. 49 48 PBS (2013b) Grattan Institute 2013 Martin, et al. (2012). There is mixed evidence on the long-term comparative safety of both drugs – see Schmucker, et al. (2012). 23 Australia’s bad drug deal Decisions about the relative effectiveness of different drugs should be made by the new expert body, acting on clinical advice. Therefore we have not made detailed estimates of the savings this change would generate. However, we did calculate indicative savings from switching to similar drugs used in New Zealand when identical drugs were not available. For these 11 doses alone, the potential savings in Government expenditure is estimated at $590 million a year, with potential cumulative savings many times this amount.50 Box 6: Ending Australia’s bad drug deal: the three elements of pharmaceutical pricing reform Our estimate does not take into account all of the costs associated with expanding the Therapeutic Price Premium. These include medical exemptions and out-of-pocket costs for patients who choose more expensive drugs. However, the estimate is still conservative. Firstly, it only applies to 11 doses. Secondly, when more than one alternative was available in New Zealand, we based our comparison is based on the most expensive substitute (see methodological appendix for more information). If the new pricing body benchmarked PBS prices against the three purchasers we looked at (New Zealand and public hospitals in two states), the savings would be huge. Three reforms that could save $1.8 billion a year In summary, this report suggests three changes to how we buy drugs (see Box 6). First, establishing an independent pricing board with a clear budget. Second, using tougher new rules for generic pricing. Third, the new board should consider applying the Therapeutic Group Premium to more groups of drugs. 50 1. Get the foundations right: independent governance and an incentive to save 2. Tougher rules on generic pricing 3. Promoting cost-effective choices As shown in Figure 13, obtaining better prices for identical generics would save nearly $1.2 billion, with savings from identical patented drugs representing an extra $100 million. Future reforms promoting cost-effective drug use could be expected to save over $550 million. Taken together, the three reforms would produce total savings of at least $1.8 billion each year. Most of these savings come from adopting cheaper generic prices (see methodological appendix for further details). These estimates are conservative for a number of reasons. First, we have only analysed 73 doses, accounting for less than half of PBS expenditure. Second, we have only benchmarked prices against three purchasers. If more countries and states were included, the savings would certainly be greater. Third, we have assumed that current PBS pack sizes, mark-ups and dispensing fees remain the same – adopting New Zealand mark-ups and pack sizes would generate further savings. Clarke and Fitzgerald (2010). Grattan Institute 2013 24 Australia’s bad drug deal Finally, we used conservative assumptions when substituting different doses and drugs (see the methodological appendix for more details). Figure 13: Total savings under benchmarking model, 2011-12 $ million 1,400 Patented Generic 1,200 1,000 800 600 400 200 0 Identical pharmaceuticals Substitutes Source: Grattan Institute analysis Savings for patients As well as achieving significant savings for the Government, lower prices from benchmarking would make a big difference for patients. For 40 of the drug doses we looked at, adopting benchmark prices would result in lower retail prices for patients who don’t have a concession card, and who are below the Safety Net. In 15 cases, the saving is more than $10 for each box of medicine. It is more than $20 for six drugs, including atorvastatin (see Figure 14). These figures only include identical drugs. Grattan Institute 2013 Figure 14: Patient savings per pack (non-concessional patients), based on benchmark prices, selected doses, 2011-12 Latanoprost Olanzapine Atorvastatin - all doses Clopidogrel Clopidogrel With Aspirin Irbesartan 300mg Venlafaxine Hydrochloride 75mg Anastrozole Venlafaxine Hydrochloride 150mg Simvastatin 40mg Pantoprazole Sodium Sesquihydrate Valaciclovir Perindopril 10mg Omeprazole Simvastatin 20mg Irbesartan With Hydrochlorothiazide Perindopril 5mg Metformin Hydrochloride 1g Metformin Hydrochloride 500mg Irbesartan 150mg Citalopram Hydrobromide Gliclazide Quetiapine Amlodipine Amoxycillin With Clavulanic Acid $0 $5 $10 $15 $20 $25 Consumer savings per box Note: Atorvastatin figure is average of savings for 10, 20, 40 and 80 mg doses. Less than $3.60 separates the cost of the highest and lowest-price doses. Other doses have not been averaged and are listed separately above. Source: Grattan Institute analysis 25 Australia’s bad drug deal These changes are significant, and will raise concerns about their possible impact. The next chapter considers these concerns, and outlines a phased approach to changing how the PBS purchases drugs in Australia. Grattan Institute 2013 26 Australia’s bad drug deal 6. Possible concerns Any change brings risks, but concerns about lower drug prices are often overstated. Even when real risks are involved, they can be mitigated by designing changes the right way. Three concerns regularly come up when reducing drug prices has been considered here and overseas: access to drugs investment in research and development and pharmacy income. Access to pharmaceuticals In New Zealand, fewer drugs are subsidised and new drugs take longer to be listed.51 The recommendations in this report have been designed to avoid these problems. We do not propose adopting New Zealand’s sole-supplier tendering model, where typically only one brand is available for each drug. Although some of New Zealand’s price advantage may come from sole-supply arrangements (and associated reductions in sales and marketing costs) this cannot account for all of the price gap between PBS and New Zealand prices, or the low prices in Australian state public hospitals. Sole-supplier tendering limits choice for patients, who might prefer to use a brand they are used to. By benchmarking, Australia can pay prices close to those in countries that use sole-supplier tendering (and countries that use other models which work well) without reducing the choices available to patients. Australia doesn’t need to introduce sole-supplier tendering to get lower drug prices. However, bringing Australia’s prices closer to New Zealand’s might still raise fears that drugs won’t be as widely available as they are now. Access could fall for two reasons. First, drug companies might refuse to supply drugs because lower prices make it unprofitable. Second, a capped national drug budget may mean there is not enough funding to buy the current volume and range of drugs.52 To address the first of these fears, Australia could phase in reforms, starting with changes that have little or no risk of reducing access to drugs (see Figure 15). The bulk of estimated savings come from adopting lower prices for identical drugs that are sold to the PBS, as well as to PHARMAC or Australian public hospitals. By definition, benchmarking will not bring prices below profitable levels paid 52 51 Wonder and Milne (2011) Grattan Institute 2013 It has also been suggested that limiting the number of suppliers will increase the risk of breaches of the supply chain (e.g. if manufacturing from one plant is closed). Our proposals (and savings) do not rely on consolidating supply of generics to one manufacturer. 27 Australia’s bad drug deal elsewhere, so there is little risk of companies withdrawing drugs from the market. Further, risks to access are particularly low for the first wave of price changes: cuts in generic prices. Our generic drug prices are high to start with, and a cut of at least 50 per cent below originator prices, while large, is lower than those required elsewhere. Any drug manufacturer can make generic drugs, so refusal to produce them at competitive prices would simply result in losing market share. Figure 15: A timeline for proposed reforms Pricing Board negotiates prices for new drugs Foreshadow new arrangements and establish Pricing Board (funded in 2013-14 Budget) Annual drug expenditure set in Budget Generic price benchmarking Renegotiate pre-existing prices on patented drugs 2013 2014 Source: Grattan Institute Broaden therapeutic group premium pricing 2015 2016 If the national drug budget is managed sensibly, there is no reason why it needs to cut off access to new drugs. New Zealand’s drug budget is set each year. It can be adjusted to respond to changes in population health, the development of new drugs, and changes in government finances. If the drug budget is too low, an argument can be made to increase it as part of the Budget process. From 2000 to 2012, the New Zealand drug budget increased by more than 15 per cent in real terms.53 At the same time, access to pharmaceuticals increased, partly thanks to falling prices. On average, prescriptions for seven important groups of drugs increased almost six-fold (four are shown in Figure 16). Cut generics to 50% of originator prices Agreement with Medicines Australia expires June 2014 Later reforms would not have to limit access to drugs either. Applying the Therapeutic Group Premium to a wider range of drugs (starting from 2016-17) would still leave patients able to choose a more expensive drug if they were willing to pay the difference. If there were medical grounds for this choice, they could buy the drug at the same price as the cheaper drug. 2017 Setting a drug budget will provide a clear target. It will ensure decisions are made about priorities: how much should be spent and what it should be spent on. However, the budget is not set in stone – if risks of reduced access to drugs emerge, the budget can be revised. Setting the wrong target is a risk, but it is no excuse for not setting a target at all. As with the adequacy of the annual drug budget, the new pricing board should review listing times for new drugs regularly to 53 Grattan Institute 2013 See Figure 11 above. 28 Australia’s bad drug deal make sure long delays do not occur here. Provision might also be made for an exceptional circumstances fund, such as the one PHARMAC has established, where doctors could apply for drugs on behalf of a particular patient. money to add expensive, but potentially life-saving drugs to the PBS – drugs which are not listed now. Figure 16: Prescriptions per capita for four groups of drugs, New Zealand, 1993-2012 Calls to cut drug prices often provoke warnings of potential declines in local research and development. There have been claims that pharmaceutical research has fallen in New Zealand, with some blaming PHARMAC’s pricing and listing policies. 54 Yet a study found that clinical trials have actually increased in New Zealand since PHARMAC was created.55 ‘000 prescriptions per million population 1000 Blood pressure 800 600 Asthma 400 Lipid lowering Diabetes 200 0 1993 1998 2003 2008 Notes: Population-adjusted consumption of all the other groups of drugs where information was available also increased: antipsychotics (89%), antidepressants (216%) and sleeping pills (35%). Source: Adapted from PHARMAC (2013) Finally, it is important to note that the reforms suggested in this report will increase access to drugs. Lower prices will reduce the cost barriers that keep some people from filling prescriptions their doctors consider necessary. Lower prices will also free up Grattan Institute 2013 Research and development in Australia Most major drug companies are global, with research activities spread throughout the world. They base decisions on where to undertake research on many factors, including cost, population characteristics (which are important for clinical trials), and the relevant skills, research infrastructure and regulation in different countries. Drug prices don’t determine whether a country is a good place to do research and development. There is no evidence that local drug prices influence decisions about where research and development occurs.56 Further, the bulk of savings identified in this report come from reduced prices for generic drugs, which no longer have a research and development premium. 54 See Sundakov and Sundakov (2005) (a report funded by a pharmaceutical company) for an example of this claim. 55 From 70 in 1998-99 to 113 in 2008-09, Lockhart, et al. (2010). The authors acknowledge two limitations: that these data describe planned, not executed, trials and less information was available for the period 1998-99. 56 Light and Lexchin (2005) compared pharmaceutical research activities and local drug prices in eight countries and found no significant relationship. 29 Australia’s bad drug deal For these reasons, justifying inflated drug prices as a way to attract research and development is irrational. Paying higher prices in the hope that the money will trickle down to research and development is indirect, costly, and most likely ineffective. more likely to attract investment than indirect measures of doubtful effectiveness.60 Figure 17: Types of pharmaceutical research and development, Australia and USA, 2008 Concerns about the future of pharmaceutical research and development in Australia are understandable. Australian research is currently focused on clinical trials, not basic research or drug discovery (see Figure 17). This makes Australia vulnerable to competition from countries that can conduct clinical trials more cheaply.57 Although these risks are real, high drug prices are the wrong way to address them. Australia is an attractive destination for some kinds of research and development, and we punch well above our weight in medical research.58 In the past, the Government has provided specific research and development funding for the pharmaceutical industry.59 Direct support of this kind, or investments in human capital and research infrastructure, are 60% Australia 40% USA 20% 0% Source: Commonwealth of Australia (2009) Lower drug prices won’t necessarily mean lower research and development in Australia, but they will mean lower pharmaceutical company profits. 57 See Commonwealth of Australia (2009). Pharmaceutical manufacturing faces similar risks. Rationalisation of global supply chains and increasing competition from lower-cost countries has caused cuts in employment and plant capacity, Lev (2012). As is the case for research and development, these drivers are far more important than Australian pharmaceutical prices. 58 Department of Health and Ageing (2012). Australia is not as strong in research in pharmacology, toxicity and pharmaceuticals – see Office of the Chief Scientist (2013). 59 See Commonwealth of Australia (2009) for background on industry support provided since 1988. Grattan Institute 2013 At an international level, profits are linked to research and development expenditure.61 As a result, cutting Australian drug 60 Direct support can also drive research towards the most clinically effective treatments, which are not always the most profitable. 61 For a summary of the empirical literature on the link between pharmaceutical profits and research and development spending see OECD (2011). 30 Australia’s bad drug deal prices might have a marginal impact on total, global pharmaceutical research. However, this impact would be very small. Investing the savings from lower drug prices in better healthcare, access to more drugs, in other services, or in tax reductions would almost certainly create a bigger positive impact. If reduced research and development is a concern, some of the savings from lower prices could be used to support research and development directly. Lower income for retail pharmacies Retail pharmacies incur the costs of buying, handling, storing and dispensing medications, providing advice, and the costs of operating their stores. The PBS subsidises retail pharmacies by paying a mark-up on the wholesale cost of drugs, and a dispensing fee (see Table 1, Methodological appendix).62 In the Australian system, higher drug prices typically generate higher incomes for pharmacies at a cost to government. But when prices fall below the maximum copayment ($36.10), a clause in the Fifth Community Pharmacy Agreement allows pharmacies to charge additional fees of up to $5.22 directly to general patients. This will offset some of the impact of lower drug prices on pharmacy income.63 Overall, matching lower New Zealand drug prices for identical drugs would reduce subsidies to pharmacies by about $105 million a year under current funding arrangements. This is because some of the retail pharmacy mark-up is based on the wholesale price of drugs (see the methodological appendix for more detail). For Australia’s 5,270 retail pharmacies, this would result in an average loss of income of around $20,000.64 In addition, pharmacies would lose much of the excess revenue they make from manufacturer discounts below published prices. It is important to note that this windfall income was not intended when PBS prices were agreed. The Government’s price disclosure policy (discussed above) was brought in specifically to combat excess profit from manufacturer discounts. Many of the fixed costs of operating a pharmacy would remain unchanged, and so retail pharmacy profits are likely to be reduced, although this will vary by pharmacy and we did not estimate the impact of lower prices on profits. Currently, the Government negotiates the framework for subsidising retail pharmacies with the Pharmacy Guild of Australia. When this agreement is renegotiated (it expires in 2015), a new way of funding and regulating pharmacies should be discussed. 62 Medicare (2012); Department of Health and Ageing and the Pharmacy Guild of Australia (2010). 63 This provision, according to the PBS, was “introduced to contain costs to the consumer, compensate the pharmacist and ensure that prescriptions for medicines priced less than the co-payment amount of $36.10 are still recordable on the Prescription Record Form for Safety Net recording Grattan Institute 2013 purposes.” The fee itself does not count towards the Safety Net, and the pharmacist can charge it at their discretion. See PBS (2013a) 64 This is around 8.5% of the total subsidies to pharmacists each year. Based on IBISWorld (2012); Department of Health and Ageing and the Pharmacy Guild of Australia (2010). 31 Australia’s bad drug deal With current mark-ups, higher drug prices generally mean much higher retail pharmacy income. Mark-ups should be changed so that pharmacies don’t have such a strong incentive to keep prices high. There also appears to be little justification for the policy of charging extra fees when prices are below the $36.10 maximum co-payment. If the Government wanted to protect retail pharmacy profitability while cutting drug prices, it could change the balance of the dispensing fee, mark-up and other support payments. This could be done in a way that ensured continued access to pharmaceuticals, especially in smaller, rural communities. Regulatory arrangements in larger centres should also be reviewed to harness the benefits of a more competitive market in those locations.65 Box 7: Myths about reducing drug prices Drug companies won’t provide drugs at lower prices – people won’t be able to get the drugs they need Benchmarking will not take prices below profitable levels that drug companies already sell at elsewhere. For generics, many companies are willing to compete at prices which are a fraction of what the PBS pays now. Companies selling to New Zealand and to Australian public hospitals are making money, and yet the PBS pays nearly six times as much for identical drugs. Sole-supplier tendering will disrupt supply and limit patient choice This report does not propose sole-supplier tendering. With benchmarking, multiple companies could sell to the PBS, maintaining choice and reliable supply. Lower drug prices hinder research and development Drug companies need income to fund research and development and to recoup the costs of getting a drug to market. However, most savings in this report come from generic drugs, which no longer have a research and development premium. Most drug companies are multinational and do not base their research decisions on local drug prices. Paying higher prices in the hope that the money will trickle down to research is irrational and most likely ineffective. 65 Wilkinson (2000); Barnes (2011) Grattan Institute 2013 32 Australia’s bad drug deal Conclusion In the 1940s and 1950s, Australia led the world by introducing the PBS to give the public access to ‘life-saving’ drugs. Australia was also an international innovator in the 1990s, introducing assessment of drug cost-effectiveness before listing. Today, we have lost this position of leadership. Our drug prices are high by international standards, and the way we set them is to blame. Lower drug prices will help relieve pressure on both government and household budgets. The pricing agreement between the Government and the drug companies expires in the middle of 2014. Commitment to reform should be made as soon as possible. A new pricing body should be set up well before then to negotiate fairer prices as soon as possible. We should take two initial steps to improve our pricing process. These solutions have been proven overseas and can be introduced now. We should start by reversing the politics. In other words, political choices should determine the overall drug budget, but not the value of individual drugs at the end of the process. An independent board of experts, with a defined, indexed budget, should set prices. As well, the price of new generics should be no more than half the price of the originator, with annual benchmarking against the world’s best prices. The waste caused by Australia’s bad drug deal is immense. The amount wasted every day is almost beyond comprehension: $3.5 million. Particularly when government budgets are under pressure, and demand for health care is rising, this money could be much better spent. These changes would cut wasteful spending by at least $1.3 billion a year. In future, the new pricing body can consider a third change: encouraging people to use more cost-effective drugs. This could include applying the Therapeutic Group Premium policy to more groups of drugs, which might save well over $550 million each year. Future Grattan Institute reports will look at other types of waste in the health system. However, of all the types of waste we will look at, high drug prices are the easiest to remedy. This should be our first priority in making our health system more efficient. Figure 18: Current and proposed pricing decision processes Current approach A better approach Clinical value assessment Political decision about total funds Political pricing and access decisions Pricing and access based on clinical value Source: Grattan Institute Grattan Institute 2013 33 Australia’s bad drug deal Methodological appendix This report estimates potential savings from reduced drug prices by comparing PBS prices with three benchmarks: prices from the New Zealand Pharmaceutical Management Agency (PHARMAC) and the public hospital purchasers in Western Australia and an unnamed Australian state. single ‘top 73’ list. Taken together, these 73 drugs accounted for 45 per cent of total PBS prescriptions and 43 per cent of total PBS expenditure – $3.9 out of $9.1 billion in 2011-12. The PBS lists an ex-manufacturer price per ‘box’ of medicines – for example, the cost for a box of 30 tablets, a vial of eye drops or a pack of 5 pre-filled insulin syringes. This price per ‘box’ (adjusted for differences in the other jurisdictions) was used to estimate savings. Of the top 73 drugs, there were 55 identical drugs on the PHARMAC schedule. This figure includes drugs where there were differences in dosage – for instance where the PBS-listed irbesartan tablets had 300 mg of the active ingredient and the PHARMAC tablets had 100 mg. We adjusted the New Zealand ex-manufacturer price to correct for these differences on a cost per mg basis. There are two broad sets of choices involved in comparing drug prices between nations or purchasers: which drugs should be compared and which prices should be used. Which drugs? The Department of Health and Ageing publishes extensive information about the PBS.66 The starting point for the comparisons was lists of the 50 most frequently prescribed and 50 most expensive (in terms of total expenditure) drugs on the PBS in 2011-12. There was considerable overlap between the two lists. Two drugs were excluded as there were no equivalents in New Zealand’s prescription formulary.67 The lists were combined into a 66 PBS (2012) These were fingolimod, used in the treatment of multiple sclerosis, and ranibizumab, an intravitreal injection for macular degeneration. Neither drug was used in the public hospitals of the states we compared. 67 Grattan Institute 2013 Identical drugs The list of 55 identical drugs includes four instances where Australia’s listing was for a ‘modified release’ tablet and New Zealand’s was not. For three other medications – clopidogrel with aspirin and two separate dosages of budesonide with eformoterol fumarate – New Zealand listed the components separately; this report combined the costs of the two components for a comparison. An additional seven medications were combination drugs for which there was an equivalent medication on the PHARMAC schedule, but in a different ratio to that on the PBS. When comparing these medications, we adjusted the New Zealand dosage of the first-listed medication. For example, the PBS lists irbesartan with hydrochlorothiazide as a tablet with 300 mg of irbesartan and 12.5 mg hydrochlorothiazide, while the PHARMAC 34 Australia’s bad drug deal listing has a ratio of 50 mg to 12.5 mg respectively. In this case we multiplied the New Zealand ex-manufacturer price by 6 (300 ÷ 50). This was a conservative approach which will overstate the price of the New Zealand substitute (which only used 12.5 mg of hydrochlorothiaziade). For the public hospital comparison, only identical drugs were compared – 39 in Western Australia and 59 in the other state.68 Substituting drugs for difference in strength or volume between substitute medications. Packaging differences – i.e the number of tablets per pack – were standardized to the Australian pack in the calculations. The New Zealand formulary generally provides larger quantities per prescription – an average of three times as many pills per script. Adopting these larger volumes would further increase savings by reducing transaction costs and pharmacy mark-ups, but these savings were not included in our calculations. 11 drugs listed on the PBS were not available on the PHARMAC schedule. In this case, other drugs in the same therapeutic class were compared. Choice of the alternative medication was based on Australian Medicines Handbook or the Therapeutic Guidelines.69 This analysis does not examine relative potency of the substitutes (for example, substituting atorvastatin for rosuvastatin) and so should be regarded as an indicative comparison only, as not all substitutes will be ‘equivalent’ therapeutically. Substitutes were based on the nearest matched dosage – for instance, a 40 mg tablet with another 40 mg tablet in the same therapeutic class. Which prices? In some cases, there were several possible substitutes in New Zealand. In each case the analysis substituted the most expensive option available in New Zealand. This makes the analysis more conservative, as sometimes these substitutes were many times more expensive than alternatives. We also corrected Under Australia’s Fifth Community Pharmacy Agreement, pharmacists are allowed to charge additional fees of up to $5.22 when a medication costs less than the $36.10 maximum copayment. However, these fees cannot raise the total dispensed price above the $36.10 maximum co-payment. For example, if a drug costs $31.50 including the dispensing fee, the pharmacist can charge an additional $4.60 to the patient, bringing the total cost to the patient to $36.10. 68 69 Contracts WA (2012) Therapeutic Guidelines Limited (2012); Rossi S (Ed.) (2013) Grattan Institute 2013 The full cost of providing a drug consists of payments at a number of points of the supply chain including the ex-manufacturer price, a wholesale mark-up, a retail mark up and a dispensing fee. Table 1 summarises the relationship between the manufacturer’s price and the dispensing price in Australia and New Zealand. In both New Zealand and Australia, pharmacy revenue includes a mark-up based on the ex-manufacturer price. A corollary of this is that if the ex-manufacturer price is reduced, payments to pharmacies reduce and further savings accrue. 35 Australia’s bad drug deal Table 1: Dispensed prices formulae, Australia and New Zealand Australia ($AUD) New Zealand ($NZD) Maximum cost to the retail pharmacy (wholesale mark-up) Ex manufacturer price (EMP) + Whole sale Cost: <$930: EMP + 7.52% >$930: EMP + $70 Ex Manufacturer Price (NZEMP) Retail pharmacy mark-up ≤ $30.00: 15% $ 30.01 – $45.00: $4.50 $ 45.01 - $180.00: 10% $ 180.01 – 450.00: $18.00 $ 450.01 to $1750.00: 4% >$1750: $70.00 <$150: 4% >$150: 5% Dispensing fees Ready prepared $6.52 Ready prepared $5.30 Extra fees (paid by general patients) These fees are added (at the pharmacy’s discretion) to medications below the copay. The total cost cannot exceed $36.10. If total cost is below copayment of $36.10: Safety Net Recording Fee: $1.11 Allowable Extra Fee: $4.11 (Total extra fees to patient: $5.22) Source: PHARMAC (2012b) Department of Health and Ageing and the Pharmacy Guild of Australia (2010) Grattan Institute 2013 Dispensing fees vary both in New Zealand and Australia – drugs that require preparation or are dangerous attract a higher dispensing fee. This analysis used the ‘ready prepared’ dispensing fee for both New Zealand and Australia.70 The PBS schedule effective from 1 December 2012 to 31 December 2012 was used to identify the quantity per script. The ex-manufacturer prices were taken from the most recent official ex-manufacturer price list available from the PBS website, that effective from 1 October 2012. As a result, this analysis does not include any price reductions that came into force after 1 October 2012.71 An example of the raw data available for the PBS is shown in Table 2. Table 2: Example of raw drug data Drug Form Volume Total Cost Average price Atorvastatin Tablet 40 mg 3,801,902 $294,966,163 $77.58 Average price sometimes is higher than the dispensed price multiplied by volume. The atorvastatin listed in Table 2 currently 70 New Zealand has recently changed some aspects of its pharmaceutical pricing under the 2012 Combined Pharmacy Services Agreement. District Health Boards now form agreements with community pharmacies on dispensing fees. However the assumption of a $5.30 dispensing fee remains a reasonable proxy for the overall rates, although there will be some regional variation. PHARMAC (2013), personal communication. 71 See p 9 for price reductions in atorvastatin. There was also a price reduction for rosuvastatin in December 2012. 36 Australia’s bad drug deal retails for $67.54 per box, while the average price was $77.58. One explanation for this is that doctors may prescribe multiple packs per script. Another explanation is that price reductions (see discussion in Chapter 4) could have occurred over the year and led to lower prices. To test this, we conducted a regression of the difference in ex-manufacturer price from 2011 to 2012, against the average cost as multiples of the dispensed price. This regression showed that the change in total cost was essentially explained by the change in listed prices, rather than other factors such as changes in prescribing volumes (R2=.80). Rather than calculate our savings based on total cost as listed by the PBS, we used prescription volume multiplied by dispensed price. Because our price data are from the end of 2011-12, they take into account the effect of price reductions throughout that financial year. Calculating price comparisons To make fair comparisons between the three jurisdictions studied, it is important to note differences between their prices and the PBS prices. New Zealand The ex-manufacturer price for drugs and maximum quantity of medications for New Zealand were drawn from the PHARMAC schedule from December 2012. Because of the extent of exposure of both Australian and New Zealand drug supply to international markets, the ex-manufacturer price from the PHARMAC schedule was converted to Australian dollars using the Reserve Bank’s average monthly exchange rate for December, when the PHARMAC schedule was set: $1 AUD = $1.2608 NZD. The pharmacy mark up and dispensing fees were converted to Australian dollars using Purchasing Power Parities, with the New Zealand dollar almost on par with the Australian dollar on that basis (1.0196). This reflects the fact that mark-ups are a component of pharmacy income, which unlike pharmaceuticals, is not internationally traded. PHARMAC has negotiated discounts of over 17 per cent of total PHARMAC expenditure on its published prices but these are not publicly attributed to individual items.72 As the drugs subject to discounts are not publicly identified, we have not taken these discounts into account. Similarly, we did not have access to information on Australian price discounts negotiated outside the official price (these are generally secret arrangements between pharmaceutical companies and the PBS) and so any discounts have not been taken into account. 72 Grattan Institute 2013 PHARMAC (2012c) 37 Australia’s bad drug deal States Results For the state public hospital comparisons, we used confidential price data provided to us by one state, as well as the Western Australian contract prices, which are publicly listed. In both cases, we treated the public hospital purchaser contract price as equivalent to an ex-manufacturer price. New Zealand comparison In order to estimate savings from adopting these prices, we applied the PBS mark-up formulae and dispensing fees. As prices were in Australian dollars already, no conversion was required. A range of options for estimating savings from adoption of the PHARMAC pricing were modelled, only three of which are presented here. All start by adjusting the New Zealand exmanufacturer price by the exchange rate. Model A – generates the highest savings estimate Apply New Zealand mark-ups (purchasing power parity adjusted) Adopt New Zealand prices only for drugs that are cheaper in New Zealand Models and aggregate savings Aggregate savings were derived by calculating the difference in cost per box multiplied by the total number of prescriptions under the PBS in 2011-12. Model B – model used in report Savings = (Australian dispensed price[2012] - comparator dispensed price) Apply Australian mark-ups Adopt New Zealand prices only for drugs that are cheaper in New Zealand x Australian script volume[2011-12] As prescription volumes are rising over time, this leads to an underestimate of savings in future years. We did not have data on the proportion of concession patients on each drug. Therefore, we could not estimate aggregate savings to patients and to Government separately. Grattan Institute 2013 Model C – generates lowest savings estimate Apply Australian mark-ups Adopt New Zealand prices for all drugs 38 Australia’s bad drug deal State public hospital purchaser comparison Favoured model: use cheapest drugs from each jurisdiction Two scenarios were modelled to assess savings from adopting public hospital purchaser prices: firstly adopting their prices for all drugs, and secondly only using their prices when cheaper than the PBS (preferred scenario). In both scenarios we applied full retail pharmacy mark-ups. Models for both states generated significant savings on cheaper generics, rather than patented drugs. With PBS mark-ups, several patented drugs were just as – or more – expensive in both systems we compared. Lastly, we compared the cheapest price for every drug, with Australian mark-ups in the three comparison jurisdictions. This approach is consistent with our recommendation for regular international benchmarking. The results of the benchmark model can be seen in Tables 5 and 6. The total savings from this were slightly less than Model A because that model used the much lower New Zealand mark-ups. Table 4: Savings from national adoption of public hospital prices Savings from generic drugs ($m) Savings from Patented drugs ($m) Total ($m) Unnamed state All Drugs 1,111 67 1,178 Cheaper Drugs Only 1,111 76 1,186 Western Australia All Drugs 741 -11 730 Cheaper Drugs Only 754 0 754 Note: numbers do not sum due to rounding Grattan Institute 2013 Use cheapest price from Western Australia, New Zealand, and the unnamed state Apply Australian mark-ups to all drugs Table 5: Comparing prices for atorvastatin 40 mg with Australian markups Jurisdiction Exmanufacturer price Quantity $AU/box (adjusted for quantity) Dispensed price ($AU) PBS 51.59 30 51.59 67.54 NZ 5.72 90 1.91 8.88 WA 4.44 30 4.44 12.01 Other state 2.30 30 2.30 9.61 39 Australia’s bad drug deal Table 6: Savings from benchmarking model Generic ($m) Identical Substitutes Total Patented ($m) Total ($m) 1,159 126 1, 285 50 520 570* 1,209 646 1,835 Using the ‘benchmark’ model of the cheapest drugs available in each jurisdiction, savings on identical drugs would amount to $1.3 billion a year. Including substitutes, the potential savings are closer to $1.8 billion. Figure 20 summarises the potential savings under the different models described in this appendix. Figure 20: Savings generated by cheapest drugs in all jurisdictions (with current mark-ups) against models A, B and C *Note: this figure has been rounded down to $ 550 million in the report. In many cases, New Zealand was marginally cheaper than the unnamed state. This led to most of the savings coming from adopting New Zealand prices (with Australian mark-ups) (see Figure 19). $ million 2,000 1,800 1,600 Figure 19: Number of cheapest doses in each jurisdiction 1,400 Number of doses 50 40 30 20 1,200 Substitute patent 1,000 Identical patent 800 Substitute generic 600 Identical generic 400 10 200 0 New Zealand Unnamed State Western Australia PBS 0 Model A Model B Model C Cheapest drugs Source: Grattan Institute analysis Source: Grattan Institute analysis Grattan Institute 2013 40 Australia’s bad drug deal References ABS (2012) Patient Experiences in Australia: Summary of Findings, 2011-12, catalogue number 4839.0 http://www.innovation.gov.au/Industry/PharmaceuticalsandHealthTechnologies/P harmaceuticalsIndustryStrategyGroup/Documents/PISG_Final_Report.pdf Australian Institute of Health and Welfare (2012a) Australian hospital statistics 2010-11, 42 Commonwealth of Australia (2010) Memorandum of Understanding with Medicines Australia, September 2010, Canberra, accessed 11 February 2013, from http://www.pbs.gov.au/info/industry/useful-resources/memorandum Australian Institute of Health and Welfare (2012b) Health expenditure Australia 2010-11, Cat no. HWE56, AIHW Barnes, T. (2011) 'A Prescription for Pharmacy Reform', Policy, 27(4), p 19-27 Birch, S. and Gafni, A. (1994) 'Cost-effectiveness ratios: in a league of their own', Health Policy, 28, p 133-141 Britt, H., Miller, G. C., Charles, J., Henderson, J., Valenti, L., Harrison, C., Zhang, C., Chambers, T., Pollack, A. J., Bayram, C., O’Halloran, J. and Pan, Y. (2012) A Decade of Australian General Practice Activity 2002–03 to 2011–12, Family Medicine Research Centre, University of Sydney Bulfone, L. (2009) 'High prices for generics in Australia - more competition might help', Australian Health Review, 33(2), p 200-214 Buyx, A. M., Friedrich, D. R. and Schöne-Seifert, B. (2011) 'Ethics and effectiveness: rationing healthcare by thresholds of minimum effectiveness', BMJ, 342 Carone, G., Schwierz, C. and Xavier, A. (2012) 'Cost-containment policies in public pharmaceutical spending in the EU', European Commission Economic Papers, 461(September 2012) Clarke, P.M. (2012) 'Challenges and opportunities for the Pharmaceutical Benefits Scheme' Medical Journal of Australia, 196(3), p 153-154 Clarke, P. M. and Fitzgerald, E. M. (2010) 'Expiry of patent protection on statins: Effects on pharmaceutical expenditure in Australia', Medical Journal of Australia, 192(11), p 633-636 Commonwealth of Australia (2009) Pharmaceuticals Industry Strategy Group, Final Report, Canberra, from Grattan Institute 2013 Commonwealth of Australia (2012) 'Pharmaceutical Patents Review: Background paper and suggested issues paper' Contracts WA (2012) Health Goods and Services, Western Australia Department of Finance, accessed 28 February 2013, from http://www.contractswa.finance.wa.gov.au/group.jsp?groupID=HL&STMP=13022 8063700749 Cumming, J., Mays, N. and Daube, J. (2010) 'How New Zealand has contained expenditure on drugs', BMJ, 340(7758), p 1224-1227 Danzon, P. M. and Furukawa, M. F. (2008) 'International prices and availability of pharmaceuticals in 2005', Health Affairs, 27(1), p 221-233 Department of Health (England) (2012) The Pharmaceutical Price Regulation Scheme: Eleventh Report to Parliament, Department of Health Department of Health and Ageing (2010a) Expenditure and prescriptions twelve months to 30 June 2011, Data and Modelling Section Pharmaceutical Policy and Analysis Branch Department of Health and Ageing (2010b) Pharmaceutical Benefits Scheme Expanded and Accelerated Price Disclosure Arrangements: Procedural and Operational Guidelines, Department of Health and Ageing, accessed 11 February 2013, from http://www.pbs.gov.au/industry/pricing/eapd/eapdguidelines.pdf Department of Health and Ageing (2012) Strategic Review of Health and Medical Research in Australia, Consultation Paper, Canberra, accessed 21 February 2013, from http://www.mckeonreview.org.au/ Department of Health and Ageing (2013) 'Price Reductions for Second Main Cycle', accessed 11 February, from 41 Australia’s bad drug deal http://www.pbs.gov.au/info/industry/pricing/eapd/price-reductions-for-secondmain-cycle Department of Health and Ageing and the Pharmacy Guild of Australia (2010) The Fifth Community Pharmacy Agreement, accessed 15 Jan 2013, from http://www.5cpa.com.au/5CPA/The_5CPA/About_the_5CPA/About+the+5CPA.p age? Directorate General for Internal Policies (European Parliament) (2010) Differences in Costs and Access to Pharmaceutical Products in the EU Duckett, S. and Willcox, S. (2011) The Australian Health Care System (4th edition), Oxford University Press Dunlevy, S. (2011) 'Chemists use tactics to profit by the script', The Australian, June 25, 2011, accessed 13 March 2013, from http://www.theaustralian.com.au/news/health-science/chemists-use-tactics-toprofit-by-the-script/story-e6frg8y6-1226080909961 Finance and Public Administration Reference Committee (2011) The Government's Administration of the Pharmaceutical Benefits Scheme, Canberra, Georges, G. and Palaghia, L. (2012) Health Postcard: Pharmacists wake up and smell the reform, accessed 12 February 2013, from http://www.ferrierhodgson.com/en/Publications/Newsletters/Health%20Postcard/I ssue%207.aspx IBISWorld (2012) 'Pharmacies in Australia: Market Research Report', accessed 4 March 2013, from http://www.ibisworld.com.au/industry/default.aspx?indid=1878 IHS (2013) 'Australian court rules in favour of Sanofi on PBS price reductions against docetaxel, risedronate', Country & Industry Forecasting: IHS Global Insight, Manufacturing in Australia' Light, D. W. and Lexchin, J. (2005) 'Foreign free riders and the high price of US medicines', British Medical Journal, 331(7522), p 958–960 Lockhart, M. M., Babar, Z.-U.-D. and Garg, S. (2010) 'Clinical trials in New Zealand: progress, people and policies', Drug Development Research, 72, p 299–304 Machado, M., Krahn, M., Einarson, T. R. and O'Brodovich, R. (2011) 'International drug price comparisons: Quality assessment', Revista Panamericana de Salud Publica, 29(1), p 46-51 Martin, D. F., Maguire, M. G., Fine, S. L., Ying, G. S., Jaffe, G. J., Grunwald, J. E., Toth, C., Redford, M. and Ferris, F. L. (2012) 'Ranibizumab and bevacizumab for treatment of neovascular age-related macular degeneration: two-year results.', Opthalmology, 119(7), p 1388-1398 Medicare (2012) Pricing of PBS Medicine, Department of Human Services, accessed 4 March 2013, from http://www.medicareaustralia.gov.au/provider/pbs/pharmacists/pricing.jsp Miller, B. (2011) 'Pharmacy Guild under fire for new deal', accessed 6 March 2013, from http://www.abc.net.au/news/2011-10-19/pharmacy-guild-under-firefor-new-deal/3579612 Ministry of Health (2005) New Zealand Public Health and Disability Act 2000, Wellington Morgan, S. and Boothe, K. (2010) 'Prescription drug subsidies in Australia and New Zealand (editorial)', Australian prescriber., 33(1), p 2-4 Nicholson, M. (2013) 'Preparing for the rising tide of price disclosure', The Australian Journal of Pharmacy, 94, p 45-50 Izmirlieva, M. and Ando, G. (2012) 'PHP136 Generic Price Linkage As a Policy Choice: Review of Recent Developments', International Society for Pharmacoeconomics and Outcomes Research (ISPOR) 15th Annual European Congress, Berlin, accessed 7 February 2013, from http://www.slideshare.net/IHS/generic-price-linkage-as-a-policychoice?ocid=g370:globalinsight:social:0007 O’Neill, P., Puig-Peiró, R., Mestre-Ferrandiz, J. and Sussex, J. (2012) International Comparisons of Medicine Prices 2011 Indices Methodology and Results, Office of Health Economics Lev, K. (2012) 'IBISWorld Industry Report: Pharmaceutical Product OECD (2011) 'Trade and Innovation: Pharmaceuticals', OECD Trade Policy Grattan Institute 2013 OECD (2010) Roundtable on Generic Pharmaceuticals, from http://www.oecd.org/competition/abuseofdominanceandmonopolisation/4613889 1.pdf 42 Australia’s bad drug deal Working Papers(11) Ausinfo Office of the Chief Scientist (2013) Benchmarking Australian Science Performance (Occasional Paper Series) Puig-Junoy, J. (2010) 'Impact of European Pharmaceutical Price Regulation on Generic Price Competition', Pharmacoeconomics, 28(8), p 649-663 Patented Medicine Prices Review Board (Canada) (2011) Annual Report 2010, Patented Medicine Prices Review Board Ragupathy, R., Tordoff, J., Norris, P. and Reith, D. (2012) 'Key Informants' Perceptions of How PHARMAC Operates in New Zealand', International Journal of Technology Assessment in Health Care, 28(4), p 367-373 PBS (2012) 'Expenditure and Prescriptions twelve months to 30 June 2012', accessed 2 December 2012, from http://www.pbs.gov.au/info/statistics/expenditure-and-prescriptions-30-06-2012 PBS (2013a) 'Fees, Charges, Allowances, & Tax', accessed 4 March 2013, from http://www.pbs.gov.au/info/general/faq PBS (2013b) 'Therapeutic Group Premium Policy', accessed 13 March 2013, from http://www.pbs.gov.au/browse/group-premium PHARMAC (2012a) Introduction to PHARMAC, Wellington, accessed 23 January 2013, from http://www.pharmac.govt.nz/2011/09/16/01INTRO.pdf PHARMAC (2012b) New Zealand Pharmaceutical Schedule, Government of New Zealand PHARMAC (2012c) Pharmaceutical Management Agency Annual Report, Wellington, from http://www.pharmac.health.nz/ckeditor_assets/attachments/116/annual_report_2 011-12.pdf PHARMAC (2013) PHARMAC Annual Reivew 2012, Wellington, from http://www.pharmac.health.nz/ckeditor_assets/attachments/115/annual_review_ 2012.pdf Pharmaceutical Benefits Pricing Authority (2009) Policies, Procedures and Methods Used in the Recommendations for Pricing of Pharmaceutical Products, Pharmaceutical Benefits Pricing Authority, accessed 11 February 2013, from http://www.health.gov.au/internet/main/publishing.nsf/Content/E266568F1E1E7F 02CA2572B20001F4E3/$File/PBPA-Manual-May%202009.pdf Pharmaceutical Benefits Pricing Authority (2010) Annual Report for the year ended 30 June 2010, Pharmaceutical Benefits Pricing Authority Productivity Commission (2001) International pharmaceutical price differences, Grattan Institute 2013 Robertson, J., Walkom, E. J. and Henry, D. A. (2009) 'Transparency in pricing arrangements for medicines listed on the Australian Pharmaceutical Benefits Scheme', Australian health review, 33(2), p 192-199 Rossi S (Ed.) (2013) 'Australian Medicines Handbook 2013', accessed 2 February 2013, from http://www.amh.net.au Roughead, E. E., Lopert, R. and Sansom, L. N. (2007) 'Prices for Innovative Pharmaceutical Products That Provide Health Gain: A Comparison Between Australia and the United States', Value in Health, 10(6), p 514-520 Schmucker, C., Ehlken, C., Agostini, H. T., Antes, G., Ruecker, G., Lelgemann, M. and Loke, Y. K. (2012) 'A Safety Review and Meta-Analyses of Bevacizumab and Ranibizumab: Off-Label versus Goldstandard', PLOS One, 7(8) Simoens, S. (2007) 'International comparison of generic medicine prices', Current medical research and opinion, 23(11), p 2647-2654 Spinks, J. M. and Richardson, J. R. J. (2011) 'Paying the right price for pharmaceuticals: a case study of why the comparator matters', Australian Health Review, 35(3), p 267-272 Sundakov, A. and Sundakov, V. (2005) New Zealand's Pharmaceutical Policies: A fresh look, Castalia Strategic Advisers Sweeny, K. (2005) Medicine prices in Australia: An international comparison, Centre for Strategic Economic Studies, Victoria University from http://vuir.vu.edu.au/15949/1/(15949).pdf The Commonwealth Fund (2008) 'Multinational Comparisons of Health Systems Data, 2008 Charts', accessed 11 February, from http://www.commonwealthfund.org/Charts/Chartbook/MultinationalComparisons-of-Health-Systems-Data--2008/P/Percentage-of-Total-HealthCare-Spending-on-Pharmaceuticals--1996-and-2006.aspx 43 Australia’s bad drug deal The Commonwealth Fund (2011) 'Commonwealth Fund International Health Policy Survey' The Council of the Federation (Canada) (2013) Provinces and Territories Seek Significant Cost Savings for Canadians on Generic Drugs, Council of the Federation, accessed 7 February 2013, from http://www.councilofthefederation.ca/pdfs/NR-CoF-Generic%20drugs%20(Final)Jan%2018.pdf Therapeutic Guidelines Limited (2012) 'Therapeutic Guidelines', accessed 20 Jan 2013, from http://www.tg.org.au/ Thurecht, N. (2011) 'Generics and the crystal ball', The Australian Journal of Pharmacy, 92, p 51-53 Victorian Auditor-General (2011) Procurement Practices in the Health Sector, Melbourne, Wilkinson, W. (2000) National Competition Policy Review of Pharmacy, Department of Health, accessed 4 March 2013, from http://www.health.gov.au/internet/main/publishing.nsf/Content/ED90D96B6729F F84CA256FBA0016F956/$File/finaloverview.pdf Wonder, M. and Milne, R. (2011) 'Access to new medicines in New Zealand compared to Australia', The New Zealand Medical Journal, 124(1346), p 1-17 Grattan Institute 2013 44
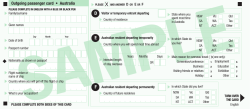


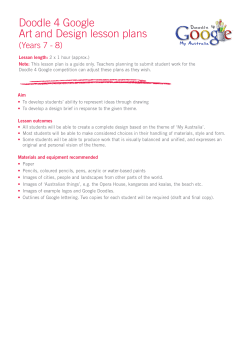


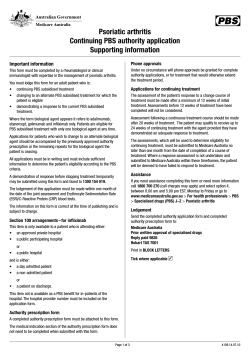
© Copyright 2026