
Comment on LaCour (2014), âThe Echo
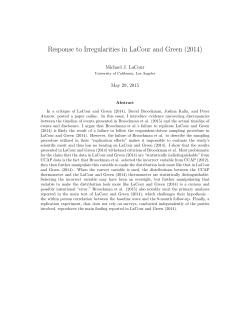
Comment on LaCour (2014), “The Echo
Chambers are Empty”
Gregory J. Martin∗
Emory University
May 29, 2015
Abstract
This note describes a number of anomalies uncovered during an attempt to replicate
the text-based measures of ideology in Michael LaCour’s “The Echo Chambers Are
Empty: Direct Evidence of Balanced, Not Biased, Exposure To Mass Media.”
The recent publicity surrounding the retraction of Michael LaCour and Don Green’s
Science paper on canvassing in gay marriage referenda campaigns reminded me of an
experience I’d had (unsuccessfully) attempting to replicate some of LaCour’s other work
last year. In light of the disturbing revelations regarding the Science paper, I decided
to investigate more fully. This note describes the results of that exercise. Simply
put, despite using the same dataset of news show transcripts and implementing the
same method described in his paper, my results are not at all comparable to LaCour’s.
LaCour’s text-based measures of news show ideology reported in “The Echo Chambers
Are Empty” are very likely fabricated.
∗
Thanks to Gaurav Sood for helpful comments.
1
Background
A working paper of mine (Martin and Yurukoglu (2014)) estimates cable TV viewers’
preferences for news with a like-minded slant. As part of that project, we estimate
the ideological positioning of the three cable news channels by comparing their usage
of certain phrases to the usage of those same phrases by members of Congress in the
Congressional Record, a method pioneered by Matt Gentzkow and Jesse Shapiro in
their work on newspaper slant.
My co-author, Ali Yurukoglu, came across LaCour’s “Echo Chambers” paper, which
contains (in Figure 1) a similar exercise. LaCour’s figure shows precise estimates of
ideological location for a number of individual cable news shows, with significant separation between various shows. For instance, LaCour’s figure places The O’Reilly Factor
at a location in the far right tail of the distribution of Congressional Republicans, and
Countdown with Keith Olbermann in the far left tail of the distribution of Congressional Democrats. This was at odds with my experience; our results using this general
approach had typically located all of the cable news outlets in centrist locations, with
differences between the outlets that were directionally accurate but fairly small in
magnitude. However, LaCour used both a different statistical approach and a different sample of transcript text than we had, and we thought his implementation might
simply be better than ours at discriminating between outlets.
In late June of 2014, Ali emailed LaCour requesting the code that produced the
figure. LaCour promptly responded with code written using the JAGS library. He did
not share his transcript data. I attempted to run the code he provided on our sample of
transcript text. LaCour’s code ran, but after more than a day of running time returned
all zeros for the channels’ ideological positions. I decided it was possible that I had
set it up incorrectly, as his code relied on a file with Congressional ADA scores that
he didn’t include, and I was guessing somewhat as to the format of the inputs. Given
how long the code took to run and my inexperience with JAGS, I decided it wasn’t
worth figuring out what went wrong, and instead wrote my own version of his Bayesian
model, following his description in the paper.1 As input data I used our sample of cable
news show transcripts, which come from LexisNexis.
1
My code is implemented in Stan and is available at https://www.dropbox.com/s/ouvu7vyzeun96ki/
replication_code_data.zip?dl=0.
2
The
The
The
The
The
The
The
Savage Nation
Mark Levin Show
Rush Limbaugh Show
Laura Ingraham Show
Sean Hannity Show
Beltway Boys
Alan Colmes Show
The Radio Factor
Fox News Online
The Stephanie Miller Show
The John and Ken Show
The Bill Press Show
The Thom Hartmann Show
Geraldo at Large
Table 1: Shows with ideology estimates in LaCour’s Figure 1 that do not exist in the LACC
database.
The results of this exercise looked quite similar to the results I had gotten previously
using a different statistical method,2 and unlike LaCour’s plot. At this point I chalked
up the differences to the difference in the underlying text sample, and, deciding that
the Bayesian approach was not superior, returned to the method I had been using.
I have now applied the method to the UCLA Closed Caption (LACC) archive of
news show transcripts, the same dataset that LaCour reports using in his paper.3 The
results of this direct replication look much more similar to my previous results than
they do to the results reported by LaCour. The discrepancies are not accounted for by
differences in the samples of text, and they are also not due to differences in statistical
methodology.
Results
Figure 2 shows my replication of LaCour’s analysis, the original version of which is
displayed in Figure 1. There are at least three major irregularities in LaCour’s reported
results.
Missing channels First and most obviously, LaCour’s figure includes estimates of
ideological positioning for a number of radio shows, such as The Radio Factor and The
Savage Nation, that do not appear at all in the UCLA closed caption archive on which
LaCour’s estimates are supposedly based. LaCour does not cite any additional sources
for text from these shows. Table 1 lists these shows.
2
3
We used an Elastic Net approach, as opposed to LaCour’s Bayesian implementation.
I’ve also run LaCour’s code on this dataset, and reproduced the all-zero outputs I had found previously.
3
Figure 1: Mapping Television and Radio News Programs to Congressional Ideology
●
●
Media Slant
Centrist News
Conservative News
Liberal News
●
●
●
●
●
●
●
●
●
●
●
●
●
●
●
●
●
●
●
●
●
●
●
●
●
●
●
●
●
●
●
●
●
●
●
●
●
●
●
●
●
Congressional Republicans
●
Congressional Democrats
Tucker
The Savage Nation
The Mark Levin Show
The O'Reilly Factor
Glenn Beck
The Rush Limbaugh Show
Fox & Friends
The Laura Ingraham Show
The Sean Hannity Show
Glenn Beck Program
The Beltway Boys
The Radio Factor
Fox News Online
Hannity & Colmes
Special Report w/ Brit Hume
Your World w/ Neil Cavuto
Geraldo at Large
The Thom Hartmann Show
Scarborough Country
Fox Report
The John & Ken Show
Lou Dobbs Tonight
Studio B w/ Shepard Smith
Fox News Sunday
Fox News Live
NBC Nightly News Brian Williams
ABC World News
CBS The Early Show
Paula Zahn Now
CBS Evening News
CNN American Morning
FOX Local News
CNN Situation Room
NBC Today
Eyewitness News This Morning
ABC Good Morning America
Anderson Cooper 360
NBC Local News
CBS Local News
Eyewitness News
PBS Newshour w/ Jim Lehrer
Face The Nation
ABC News Nightline
CNN Newsroom
ABC America This Morning
CNN Headline News
Meet the Press
The Colbert Report
BBC World News
The Alan Colmes Show
Democracy Now
The Stephanie Miller Show
The Bill Press Show
Hardball w/ Chris Matthews
The Daily Show w/ Jon Stewart
MSNBC News Live
The Ed Schultz Show
Countdown w/ Olbermann
Real Time w/ Bill Maher
●
●
●
●
●
●
●
●
●
●
●
●
●
●
●
●
Most −.8
Liberal
−.6
−.4
−.2
0
.2
.4
Ideology Score (DW−NOMINATE)
.6
.8
Most
Conservative
Note: Figure provides language-based estimates of the ideological slant of news programs in 2006, based
upon the
of times
a news
used phrases most
Figure
1: number
LaCour
Figure
1:program
Original
used in the 2006 Congressional Record by Democrats or Republicans. DW-NOMINATE
scores range from (x axis) -1 (liberal) to 1 (conservative). The center dots correspond to
the posterior point estimates of the news programs’ DW-NOMINATE ideology scores –
lines represent 95% credible intervals. The color of the dots indicates the classification
of the news program. Kernel density plots represent DW-NOMINATE ideology scores
for the 109th House and Senate.
10
4
Lou Dobbs Tonight
●
The OReilly Factor
●
Nightline
●
Fox News Live
●
Today Show
●
Good Morning America
●
Colbert Report
●
The Early Show
●
Hannity and Colmes
●
BBC World News
●
CBS Evening News
●
Special Report with Brit Hume
●
Anderson Cooper 360
●
American Morning
●
Daily Show
●
Meet the Press
●
Newsroom
●
Face the Nation
●
NBC Nightly News
●
Paula Zahn Now
●
Eyewitness News
●
Tucker Carlson
●
Democracy Now
●
Situation Room
●
Countdown with Keith Olbermann
●
Scarborough Country
●
Hardball with Chris Matthews
●
Newshour with Jim Lehrer
●
−1.0
−0.5
0.0
0.5
1.0
DW−NOMINATE Score
Congressional Distribution by Party:
R
D
Figure 2: LaCour Figure 1: Replication. Dots are the median of 10,000 parameter samples
generated by RStan’s implementation of the Metropolis-Hastings algorithm. Bars represent
the central 95% interval of these samples. I generated samples using ten independent MCMC
chains with 2,000 samples, each of which discarded a burn-in phase of the first 1,000 draws.
The density estimates are the distributions of DW-NOMINATE first dimension scores for
Congressional Democrats and Congressional Republicans.
5
In addition, there are shows that do appear in the LACC database, but not until
after 2006. For example, Real Time with Bill Maher appears first in 2008. LaCour’s
description of Figure 1 says that it plots “language-based estimates of the ideological
slant of news programs in 2006.” This statement cannot be correct for those shows, like
Bill Maher’s, that do not appear in LACC until after 2006. In all, I was able to locate
28 of the 60 shows claimed by LaCour’s Figure 1 in LACC in 2006. I used text from
episodes of these shows that aired in 2006 to compute counts of the 1000 most-partisan
phrases published by Gentzkow and Shapiro (2010).4
Ideological Separation of Shows LaCour’s Figure 1 identifies a number of
prominent Fox News shows, such as The O’Reilly Factor and Hannity & Colmes,
as being more conservative than the median Republican in Congress. He also places
MSNBC shows such as Countdown with Keith Olbermann and Comedy Central shows
like The Daily Show well to the left of the median Democrat in Congress.
In contrast, estimates from my replication are clustered close to the center of
the DW-NOMINATE scale. Only two shows, PBS’ Newshour with Jim Lehrer and
MSNBC’s Hardball with Chris Matthews, are estimated to the left of the median Congressional Democrat. No shows are estimated to be to the right of the median Congressional Republican. While the left-right ordering generally conforms to expectations,
there are a number of unexpected results in the replication figure that do not appear
in LaCour’s original. For example, ABC News’ Nightline is estimated to be one of the
most conservative programs, as is NBC’s The Today Show.
Confidence Intervals The most dramatic difference between LaCour’s original
figure and the replication is the degree of precision each claims. LaCour’s figure plots
extremely narrow Bayesian credible intervals, the majority of which do not overlap
zero. In contrast, the credible intervals in the replication are very wide, reflecting
the imprecision inherent in text-based measures of ideology, and the simple fact that
partisan-indicative phrases in the Congressional Record are not terribly common on
television news. Many of the intervals cover most of the DW-NOMINATE scale, reflecting little additional information gained from the phrase counts compared to the
4
http://www.icpsr.umich.edu/icpsrweb/ICPSR/studies/26242
6
priors.5 For example, although Jim Lehrer’s NewsHour has the most extreme left-wing
estimated ideology of the shows in the database, NewsHour ’s confidence interval does
not reject the show having the ideology of a moderate Republican such as Virginia
senator John Warner.
In the replication, only one show, Lou Dobbs Tonight, has a credible interval that
does not overlap zero. Applying LaCour’s criterion, Lou Dobbs Tonight would be
classified as “conservative news,” while all the remaining shows would be classified
as “centrist news.” Achieving LaCour’s claimed degree of precision would require a
corpus of text many times the size of the LACC database.
Other Discrepancies
• Appendix A contains a lengthy verbatim excerpt from Gentzkow and Shapiro
(2010) that is not identified as such. Compare Figures 3 and 4.
• LaCour’s code references a data file apparently provided by Tim Groseclose,
/Users/michaellacour/Dropbox/Papers/MediaBias/Groseclose/counts.csv.
This is the only data input to the code.6 Groseclose has collected data on media
citations to think tanks, not the usage of phrases as in the method described in
the paper. Furthermore, it is apparent from the code that the number of media outlets in this file is 20 (the number in Tim Groseclose’s dataset), not the
60 that LaCour reports in the figure; LaCour’s estimation code sets the variable
N.news=20.
• LaCour’s description of the model in Appendix A says that news show ideology
priors are distributed “normally with a mean of 50.06 and precision .001. 50.06 is
an estimate of the average United States voter’s ADA score, where 0 is the most
liberal and 100 is the most conservative.” However, Figure 1 reports ideologies
in terms of DW-NOMINATE score, which range from -1 to 1. Additionally, his
equation above this text description indicates that the priors are uniform on 0
to 100, rather than normal; the code matches the text description and not the
equation. I used DW-NOMINATE scores to match his figure, and chose a prior
that is uniform on the range of the DW-NOMINATE scale.
5
6
Priors are distributed uniform on [-1,1], the range of the DW-NOMINATE scale.
LaCour did not provide this file.
7
Figure 3: Excerpt from Gentzkow and Shapiro (2010), pp. 43-44
8
Figure 4: Corresponding excerpt from LaCour (2014), pp. 33
9
• LaCour claims in Appendix A that he chose a very diffuse and uninformative
prior for the speaker and phrase fixed effects, αi and βi .7 As these parameters
have direct empirical counterparts, choosing such a “flat” prior is unnecessary,
and will tend to slow convergence of the MCMC chains. This choice makes it even
less likely that LaCour achieved his claimed precision using the code provided,
which uses a single MCMC chain of 10,000 draws, of which only the first 100 were
discarded as a “burn-in.”
I kept LaCour’s normally-distributed assumption on these parameters, but initialized the mean and variance of each using its natural empirical counterpart
(the average usage of each phrase across all shows, and the total use of the set of
1000 phrases by each show).
• There are a number of phrases in the Gentzkow-Shapiro set that appear very
infrequently on TV. Including these phrases in the estimation routine will tend
to further decrease precision and slow convergence. I excluded any phrase that
did not appear at least 20 times (in total, across all shows) in the TV transcript
data. I further excluded Congresspeople who did not use the phrases in the GS set of 1000 at least 100 times (in total, across all the phrases) in the 109th
Congress.8 These steps left me with a set of 302 Congresspeople and 509 phrases.
7
His code matches this description.
LaCour does not mention taking these steps, but both have the effect of increasing precision, which
makes his claimed credible intervals even less likely.
8
10


© Copyright 2026